Deep ocean particle flux in the Northeast Atlantic over the past 30 years: carbon sequestration is controlled by ecosystem structure in the upper ocean
- 1National Oceanography Centre, Southampton, United Kingdom
- 2The Marine Biological Association, Plymouth, United Kingdom
- 3Department of Arctic and Marine Biology, UiT The Arctic University of Norway, Tromsø, Norway
The time series of downward particle flux at 3000 m at the Porcupine Abyssal Plain Sustained Observatory (PAP-SO) in the Northeast Atlantic is presented for the period 1989 to 2018. This flux can be considered to be sequestered for more than 100 years. Measured levels of organic carbon sequestration (average 1.88 gm−2 y−1) are higher on average at this location than at the six other time series locations in the Atlantic. Interannual variability is also greater than at the other locations (organic carbon flux coefficient of variation = 73%). We find that previously hypothesised drivers of 3,000 m flux, such as net primary production (NPP) and previous-winter mixing are not good predictors of this sequestration flux. In contrast, the composition of the upper ocean biological community, specifically the protozoan Rhizaria (including the Foraminifera and Radiolaria) exhibit a close relationship to sequestration flux. These species become particularly abundant following enhanced upper ocean temperatures in June leading to pulses of this material reaching 3,000 m depth in the late summer. In some years, the organic carbon flux pulses following Rhizaria blooms were responsible for substantial increases in carbon sequestration and we propose that the Rhizaria are one of the major vehicles by which material is transported over a very large depth range (3,000 m) and hence sequestered for climatically relevant time periods. We propose that they sink fast and are degraded little during their transport to depth. In terms of atmospheric CO2 uptake by the oceans, the Radiolaria and Phaeodaria are likely to have the greatest influence. Foraminifera will also exert an influence in spite of the fact that the generation of their calcite tests enhances upper ocean CO2 concentration and hence reduces uptake from the atmosphere.
1 Introduction
The oceanic Biological Carbon Pump (BCP) transfers vast amounts of organic carbon from the sunlit surface ocean to the deep interior where it may be isolated from the atmosphere for centuries or millennia (Martin et al., 1987). Without the BCP, atmospheric CO2 concentrations would be ∼200 ppm higher than current levels (Kwon et al., 2009). In the past there has been an assumption that if material reaches below the depth of winter mixing or a depth of 1,000 m, it can be considered as sequestered for climatically relevant time periods (Lampitt et al., 2008; Passow and Carlson, 2012; Saba et al., 2021). Models have however demonstrated that the depth below which material can be considered as sequestered for a specified period such as 100 years can be much deeper and varies geographically (Robinson et al., 2014; Siegel et al., 2021; Baker et al., 2022) and 1,000 m should not, in most cases, be considered as the sequestration depth. Using this methodology, in the region of PAP-SO (Porcupine Abyssal Plain Sustained Observatory) only about half the material reaching 1,000 m is sequestered for more than 100 years (Baker et al., 2022). By the time sinking material reaches 2,000 m depth, over 90% is sequestered for >100 years and by 3,000 m, the depth at which our data were collected, it is likely that almost all sinking organic flux could be considered as “sequestration flux.” Although the quantification of export of material from the upper ocean has been a common research objective, from the perspective of the role of the ocean biological carbon pump in reducing atmospheric CO2, it is this sequestration flux which is the key variable.
There are three sets of processes which determine sequestration flux due to the biological carbon pump. The first is primary production, almost all of which takes place in the euphotic zone, and which sets the ultimate “input” to the BCP. The second set of processes are those which describe the fraction of the material generated by primary production that is exported from this upper water column (a.k.a. Export efficiency), isolating it for weeks or months from the influence of light and the atmosphere. The third set of processes are those which determine how much of this export flux reaches depths below which the material remains for a climatically relevant period of time. “Transfer efficiency” describes the proportion of the exported material which reaches a defined depth, the remainder being remineralised as it sinks. There are a myriad of inter-connected processes that affect both export and transfer efficiency (Boyd et al., 2019; Cavan et al., 2019; Baetge et al., 2020; Henson et al., 2022) while the relevance of each of these is likely to be very different in different parts of the water column and in different oceanic provinces.
Time series studies of deep ocean particle flux have been carried out at a number of locations throughout the world’s oceans. The ultimate goal of many of them has been to generate a mechanistic understanding of the factors which control this flux. There has been significant focus on the factors which cause a decrease in flux with increasing depth and the factors causing variability in flux over time, both within each year and between years. In spite of this effort, significant uncertainties still exist, partly due to a lack of insight into issues such as the variability in transfer efficiency. The quest continues to make appropriate observations exploiting new technological developments (e.g., Briggs et al., 2020) as well as established methods and to identify drivers which are likely to have the greatest influence (Lampitt et al., 2001; Lampitt et al., 2010a; Salmon et al., 2015; Cavan et al., 2019; Wynne-Edwards et al., 2020).
A time series study of particle flux was established in the Northeast Atlantic in 1989 as part of the Joint Global Ocean Flux Study (JGOFS) and, after a slight change in location in 1991, this became the PAP-SO (Lampitt et al., 2010b; Hartman et al., 2021). The new location was chosen as it had a flatter seabed thus reducing spatial variability in the benthic fauna and enhancing the chances of establishing a link between the primary flux of organic matter to the seafloor and the structure and function of the benthic ecosystem depending on this flux (Durden et al., 2020). Furthermore, the location was chosen as it was considered to be sufficiently far from the continental shelf so as to reduce the influence of land masses and the continental slope to a negligible level. The biogeochemical processes taking place in the water column could then be considered as representative of a temperate oceanic environment. The expectation was that any advective processes would bring water of a similar biogeochemical nature to the location and that sinking particles would pass through water which would always be considered as characteristic of that general location whatever the direction of advective flow. In addition, the hope was that, as this location over the Porcupine Abyssal Plain experiences relatively weak mesoscale activity (Chelton pers. comm., Chelton et al., 2011), the effects of these structures would be limited. Eddies are complex structures sometimes extending thousands of meters below the surface and can have a significant effect on particle flux (Guidi et al., 2012; Waite et al., 2016; Ramondenc et al., 2023). The hope was also that this location would not be near any “boundaries” between biogeographical provinces which might migrate from 1 year to the next. In 6 largely independent descriptions of Atlantic provinces, PAP-SO is always well away from boundaries between them: North Atlantic Drift province (Longhurst, 2006), oceanic temperate (Beaugrand et al., 2019), Diverse and Productive Oceanic temperate (Beaugrand et al., 2019), satellite spatio-temporal heterogeneity (Scarrott et al., 2021), δ13°C and δ15N isotopic region 5 (Espinasse et al., 2022), radiolarian species (Matul and Mohan, 2017).
We therefore considered that the processes occurring at PAP-SO such as downward particle flux are unlikely to reflect simple changes in the location of a nearby oceanographic or biogeographical boundary. The consequence of all these assumptions is that the factors which determine variability in flux would be local to PAP-SO and hence could be measured and thus understood in a mechanistic manner.
After one of the first papers linking sequestration flux of organic carbon to the protozoan Radiolaria and Phaeodaria (Lampitt et al., 2009) several papers have linked these, which are members of the protozoan super-group Rhizaria, to deep ocean flux (Stukel et al., 2018; Gutierrez-Rodriguez et al., 2019; Ikenoue et al., 2019; Laget et al., 2023) and our current paper gives further insight into the role of Rhizaria in mediating or promoting carbon sequestration. The best-known Rhizaria in the oceans are Foraminifera, Acantharia and Radiolaria. They are often very large cells, occasionally several millimetres in diameter and usually have self-mineralized shells (tests) or ‘skeletons,’ which are made of calcium carbonate, strontium sulfate or silica respectively (e.g., Febvre et al., 2002). Rhizaria were originally thought to be unimportant and rare due to the fact that they are usually destroyed by plankton nets. However, underwater photography is now showing that this group is very much more abundant than previously thought with a biomass in much of the ocean similar to that of the mesozooplankton (plankton in the size range 0.2–20 mm) typically collected by plankton nets (Biard et al., 2016). Understanding of the biology and biogeochemistry of Rhizaria are extremely poor although Laget et al. (2023) maintained living specimens for 1–2 weeks but without observing reproduction. Significant recent changes in the classification of this group have clarified phylogenetic relationships (Adl et al., 2019) but have led to uncertainty when considering previous publications and data sets. The Phaeodaria are, for instance, no longer considered to be Radiolaria.
The conclusion from the last paper assessing the variability in deep ocean particle flux at PAP-SO was that a mechanistic relationship between upper-ocean processes and deep-ocean particle flux remains elusive and various explanations were suggested for this which need to be addressed (Lampitt et al., 2010a). In this paper we present further data on a wide variety of variables at and around PAP-SO which are likely to influence the variability in sequestration flux.
Sequestration flux is a crucial process affecting the global climate and we show that this is influenced to a major extent by the structure of the upper ocean ecosystem. The structure and function of these ecosystems will be altered in response to anticipated chemical and physical changes to the ocean environment over the coming centuries (Henson et al., 2022) although there is considerable uncertainty about the nature or even the direction of these changes.
2 Methods
2.1 Relevant areas of ocean
Recognising that sinking material will rarely descend vertically into the deep ocean due to advection, methods to estimate the area of surface ocean from which material collected in sediment traps may have originated has been discussed for several years (Siegel and Deuser, 1997; Waniek, et al., 2000). These estimates rely on modelled current speeds and assumed particle sinking speeds; the latter entails considerable uncertainty. A particle tracking modelling study at PAP-SO by Wang et al. (2022) concluded that mesoscale dynamics between 200 and 1,000 m depth control the dimensions of the so-called “statistical funnel.” The surface expression of this is the area of ocean from which particles originate and that, over the long term, the radius of this surface expression ranged from 90 to 490 km depending on the assumed sinking velocities in the range 20–200 m d−1. Wang et al. (2022) used a 200 km × 200 km domain to calculate vertical profiles of monthly climatology eddy kinetic energy and root-mean-square vertical velocity. Laget et al. (2023) calculated sinking speeds for Rhizaria always to be greater than 100 md−1 and up to 2044 m d−1. As we consider a sinking rate of 100 m d−1 to be extremely conservative, a box of approximately 220 km × 220 km around the sediment trap mooring was selected (2 meridional degrees × 3 zonal degrees) (Figure 1). Our own research using similar assumptions based on a particle tracking model for 2018 with the Copernicus 1/12-degree model and an assumed sinking speed of particles of 100 m d−1 produced similar results (Supplementary Figure S1) reinforcing our choice of the 220 km × 220 km area of likely influence of the surface ocean on the 3,000 m sequestration flux.
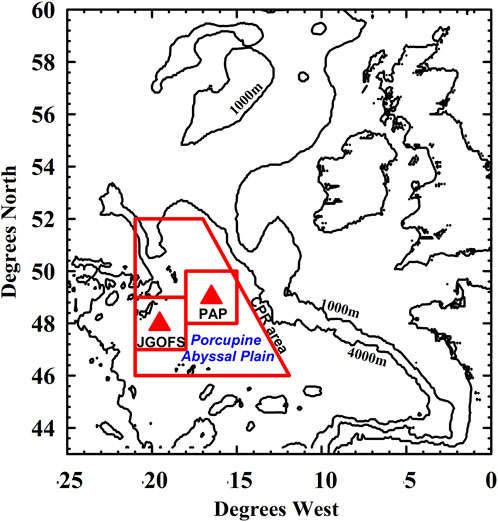
FIGURE 1. Locations of the JGOFS and PAP-SO sites. Regions around these locations from which data were extracted for this paper are also shown.
The sediment trap mooring was at 48oN 19.5oW during the JGOFS experiment of 1989 and 1990, moving to 49oN 16.5oW for all subsequent years. All the data presented in this paper apart from those from the Continuous Plankton Recorder (CPR) are therefore from the locations of these moorings and data are averaged in the two boxes, as relevant to the time period (Figure 1).
The CPR data were selected from a larger area (a trapezium of area just over 300,000 km2) due to the low density of samples within the two PAP boxes in Figure 1. The justification for this area is based on the analysis of plankton abundance over a much larger area of the North Atlantic (Supplementary Figure S2). Samples have been collected at over 5,000 locations in this trapezium since 1958 and about 3,000 locations since the start of our flux programme in 1989.
None of the data regions extend over the continental slope as defined by the 3000 m contour, this being a region with considerably different environmental conditions in terms of physics, chemistry and biology.
2.2 Physical context
We use monthly temperature and salinity data from both the EN4 v4.2.1 database (Good et al., 2013) and the ECCO v4r4 reanalysis (Forget et al., 2015; ECCO Consortium et al., 2021). The latter is available only for the years 1992–2017 inclusive. Whilst EN4 showed greater variability over short spatial and temporal scales, we found good agreement between the two datasets at larger spatial scales and on interannual timescales, giving us confidence in the results presented here. Similarly, velocities from ECCO were consistent with those derived from geostrophy when combining EN4 data with Sea Surface Height (SSH) data from Copernicus, though the magnitude of the ECCO currents was generally smaller as is expected from the spatially smoother variables.
Mixed layer depths were determined from EN4 temperature data and defined as the depth at which the temperature was 0.2°C less than the maximum temperature of the profile which was almost always at the surface.
2.3 Biological processes and characteristics
2.3.1 The continuous plankton recorder (CPR)
Established in 1931, the CPR Survey is the longest running, most geographically extensive marine ecological survey in the world. The CPR is an instrument that can be towed at high speed (∼15–20 knots) at a depth of 7 m from ships-of-opportunity (i.e., non-research ships) during their normal operations (Batten et al., 2003; Reid et al., 2003). The CPR is towed in the ship’s wake and the samples are therefore representative of the first 10 m of the water column. Data on the near-surface abundance of phyto- and zooplankton are available monthly from 1958 and this dataset amounts to 275,705 samples, with 698 taxa routinely analysed. Each sample is the material collected over a towing distance of 10 nautical miles, comprising a volume filtered of 3 m3 and the data presented here are expressed per 3 m3. In spite of the large area of ocean considered in our present study (>300,000 km2) many monthly records are based on less than 10 samples and sometimes none are available such as for August 2012. The mesh size is nominally 270 μm but significant data are obtained from species smaller than this size when specimens adhere to the mesh material. Specimen sizes are not reported.
2.3.2 Video plankton recorder (VPR)
In situ photographic profiles of particles and plankton down to either 1,000 m or 500 m depth were obtained using an autonomous digital VPR (Seascan, Inc., United States) on 9 occasions during an expedition in June 2013 to PAP-SO. The effective resolution of the VPR is approximately 85 µm. The VPR was yo-yo’ed vertically for 1.5–2 h at ∼ 0.83 m s−1, with a frame rate of ∼20 images s−1 resulting in 4 profiles for the deeper tows and 8–10 profiles for the shallower tows. Each image had a volume of 26.3 mL. Image data were extracted using the Autodeck software (Seascan, Inc., United States) and processed using Visual Plankton (C.S. Davis, WHOI, United States) and visual examination. Further data processing was done in Matlab (MathWorks).
2.3.3 Net primary production (NPP)
The CAFE model of NPP (Carbon, Absorption, and Fluorescence Euphotic-resolving) derived from satellite remote sensing data is one which has the greatest variance and the lowest bias when compared to direct field measurements (Silsbe et al., 2016). It encapsulates three variables: the amount of light energy absorbed, the fraction of absorbed energy used for photosynthesis and the efficiency with which this is converted to carbon biomass (Silsbe et al., 2016). Monthly CAFE data were taken from the Ocean Productivity website (http://sites.science.oregonstate.edu/ocean.productivity/index.php) for the SeaWiFS (October 1997—December 2008) and MODIS-Aqua (June 2002—April 2021) missions. The two data sets were merged into a single NPP time-series by regressing the MODIS-Aqua-derived CAFE NPP values against the SeaWiFS-derived CAFE NPP values during the period which the satellite missions overlapped, using ordinary least squares, and predicting the MODIS-Aqua CAFE NPP values for October 1997—May 2002 from the SeaWiFS CAFE NPP values and the coefficients of this regression. The root-mean-square-error of the regression was 34 mg C m−2 d−1, indicating that the MODIS-Aqua CAFE NPP values can be predicted quite accurately from the SeaWiFS CAFE NPP values over the study region.
The VGPM model of NPP (Vertically Generalized Production Model) was also used in a preliminary comparison and this was extracted for the location of PAP-SO ± 60 km from http://sites.science.oregonstate.edu/ocean.productivity/index.php.
2.3.4 Downward particle flux
Particle flux was measured by time series sediment traps at about 3000 m depth within the period 1989 to 2018 inclusive at the locations described above. Gaps occurred in the record as a result of equipment failure or funding crises preventing deployment throughout the 30-year time period. Very short gaps (<7 days) also occurred when refurbishment of the traps occurred a few days after the end of the sampling interval and, when this occurred, or if the gap was longer but in the winter (up to 20 days), linear interpolation was carried out to fill the gap.
The method used to make direct measurements of downward flux is described in Lampitt et al. (2010a). Time series sediment traps (Parflux with either 13 or 21 sample cups) (Honjo and Doherty, 1988) of mouth area 0.5 m2 were deployed at a depth in the range 3,000–3,197 m which is approximately 1800 m above the seabed and hence well clear of locally resuspended sediment and the benthic nepheloid layer. Sample cups were pre-filled with hypersaline buffered formalin as advised in JGOFS protocols (Lampitt et al., 2000). The trap depth is above the lysocline and, as the samples are buffered, calcite dissolution is unlikely to take place after collection. Antia (2005) showed that in samples preserved with mercuric chloride, less than 10% of the total collected calcium entered the dissolved phase, and we would not expect dissolution to be greater than this using the protocols we have adopted. Collection periods varied from 2 to 8 weeks depending on the time of year and hence the expected rate of change in flux during the collection period. The JGOFS protocol was adopted for sample handling and is further described in Newton et al. (1994). ‘‘Swimmers’’ (planktonic organisms which had swum into the sample cups) were removed by hand under dissecting microscope. Fluxes of organic and inorganic carbon were determined as previously described: Newton et al. (1994) for 1989–1990, Kiriakoulakis et al. (2001) and Ragueneau et al. (2001) for 1990–1999 and Salter et al. (2007) subsequently. The methods are very similar and are unlikely to cause any differences in the data. The organic carbon measurement of particles assumed that no organic carbon was added to the particles as a result of formalin preservation. Inorganic carbon content was calculated as the difference between total carbon and organic carbon content (total carbon after acidification). In calculating particulate inorganic carbon (PIC) fluxes, it was assumed that all inorganic carbon was represented by CaCO3, and a carbonate to PIC ratio of 8.33 was used.
Microscopic analysis of the collected material has not been able to determine the abundance of different types of Rhizaria and molecular analysis such as for eDNA has not so far been successful.
3 Results
3.1 Physical context
3.1.1 Sea surface temperature (SST) and mixed layer depth (MLD)
As derived from the EN4 data base, PAP-SO experiences an annual cycle of Sea Surface Temperature (SST) and Mixed Layer Depth (MLD) typical for this latitude with a maximum MLD usually in February and in the range 151–451 m between 1988 and 2018 (inclusive) using the temperature criterion (Figure 2).
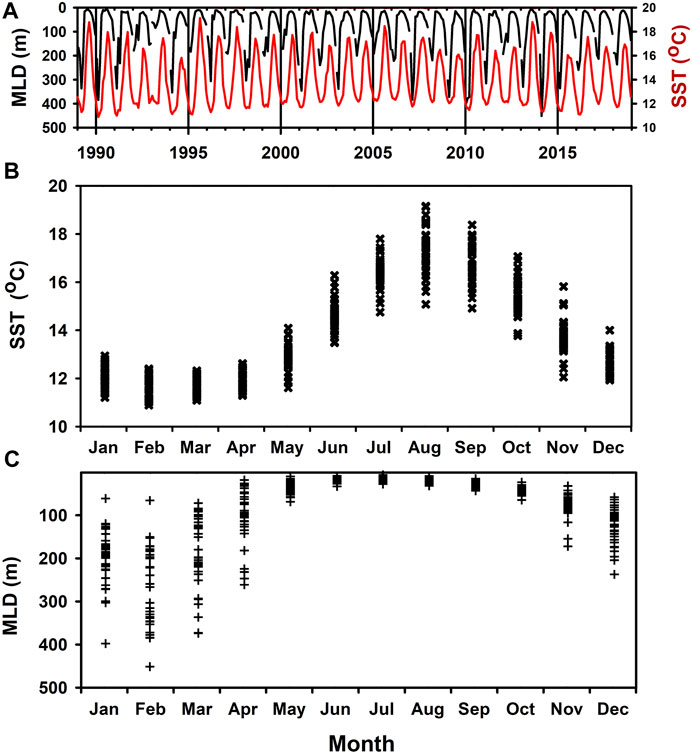
FIGURE 2. Monthly means of MLD and SST from the EN4 data base at PAP-SO. The Mixed Layer Depth (MLD) is defined as the depth at which the temperature is 0.2°C less than the maximum. These data are expressed as a continuous time series (A) and as an annual cycle (B,C) in order to depict the seasonal trend and its variability.
3.1.2 Large scale water motion
PAP-SO is located close to the continental slope which defines the eastern boundary of the North Atlantic, and, in the mean, the surface waters arrive in eastward flow that stems from the North Atlantic Current (NAC) coming from the southwest (Figure 3D). The NAC crosses the mid-Atlantic ridge about 150 km west of PAP. Most of this current turns northward to pass northwest of the PAP site while a small part turns southward to recirculate in the subtropical gyre as the Canary Current and, being close to the boundary between the two branches of the NAC, the flow at the PAP site is weak compared with regions to the west and north, as illustrated by the diverging contours of SSH in Figure 3D.
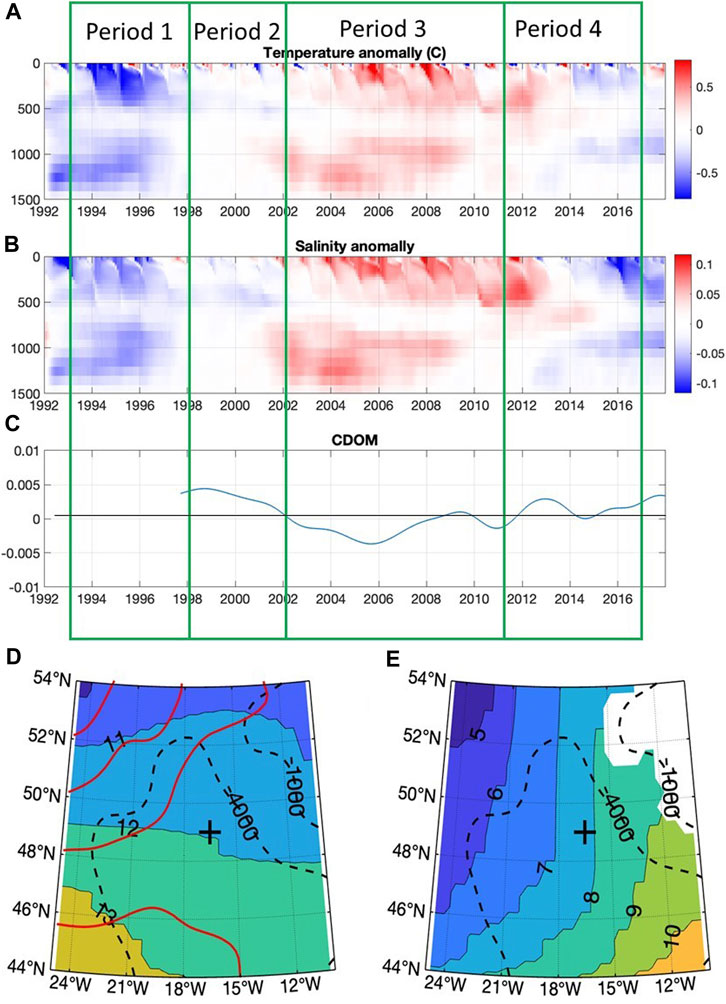
FIGURE 3. For the period 1992–2017: Time evolution of anomalies (relative to the mean annual cycle) of (A) temperature (B) salinity in the upper 1,500 m and (C) Surface CDOM filtered to remove sub-annual variability. The spatial pattern of time-mean temperature distribution at (D) 95 m depth, dominated by the NAC, and at (E) 1,100 m, dominated by the Mediterranean outflow water (MOW), are shown. PAP-SO is indicated by “+” and depth contours are indicated by dashed black lines. Note that the contour interval in (D,E) is 1°C, slightly less than the range of the temperature anomaly in (A). The red contours in (D) show the mean sea surface height for the period 1993–2017 (inclusive). The surface geostrophic flow is parallel to the SSH contours. The four time periods identified in (A–C) are discussed below.
Decadal variability in salinity of the near surface waters of the eastern sub-polar gyre has been widely documented (e.g., Holliday et al., 2020). Details of the mechanisms responsible for these changes are debated (Koul et al., 2020; Fox et al., 2022), but it is understood that changes in ocean circulation alter the balance between waters of relatively salty subtropical origin and those of relatively fresh western subpolar origin (Figure 3) arriving in the eastern North Atlantic (Holliday et al., 2020; Koul et al., 2020). Changes in the source region of subpolar waters also play a role (Fox et al., 2022). Greatest variability in salinity is found in the northward flowing branch of the NAC, but a similar evolution of salinity is seen at the location of PAP-SO (Figure 3B). Salinity and temperature of the upper 200 m were relatively low in the mid-1990s, increasing to a maximum around 2005–2007, and then decreasing again.
Long-term variability of temperature and salinity is also seen between 800 m and 1400 m but appears slightly out of phase with the changes in the upper layer. At these intermediate depths there is a significant influence of Mediterranean outflow water (MOW) (Figure 3E) that forms a tongue of warm high salinity water that spreads northwards along the eastern boundary as far as the Rockall Trough as well as westwards as far as Bermuda. Bozec et al. (2011) conclude that the movement of the MOW once it has exited the strait of Gibraltar is determined by wide scale changes in the circulation pattern of the Atlantic rather than changes in the properties of the MOW itself. We assume that the changes in temperature and salinity between 800 m and 1400 m are an indicator of changes in circulation.
Data from the ECCO reanalysis indicates that, in this region, decadal changes of circulation have a significant barotropic component so that changes in flow at different depths are correlated, even though the mean flow is very different. These circulation changes shift the isolines of temperature and salinity on both the surface and intermediate layers resulting in similar cycles of variability. The data in Figure 3 suggest that the decadal change in temperature at 100 m depth, from a minimum in 1992–1996 to a maximum in 2005–2009, is equivalent to a meridional displacement of the mean temperature contours of about 4° of latitude.
The two gyres of the North Atlantic have characteristic signatures of various types such as in the concentration of Coloured Dissolved Organic Matter (CDOM) which is higher in the Sub-Polar Gyre (SPG) (Nelson et al., 2010) and salinity which is lower in the SPG (Koul et al., 2020). The Sub-polar gyre index can be described in several different ways (Koul et al., 2020) and the extent of its influence has been widely discussed (Foukal and Lozier, 2017; Hátún and Chafik, 2018) but none indicate that the influence of the SPG extends as far as the PAP-SO. However, the data we present in Figure 3 on the anomalies of temperature, salinity and CDOM and in Supplementary Figure S3 on the subpolar gyre index all suggest large scale water mass movements which may be related to shifts in the boundary between the subpolar and subtropical gyres. Period 1 may therefore be considered as having more influence of the subpolar gyre while period 3 may have more influence from the subtropical gyre.
3.1.3 Local water movement to PAP-SO
The ecosystems which generate export flux from the upper ocean and which remineralise sinking material deeper in the water column move as a result of water advection. The extent of this advection determines what region of the ocean is relevant to the issue of particle flux at 3000 m. To give an indication of the geographic region which is likely to be relevant to the ecosystem around PAP-SO, we determined the source region of water 3 months prior to a mid-year date arbitrarily selected as June 1st for each of the years 1993–2017 (inclusive) (Figure 4).
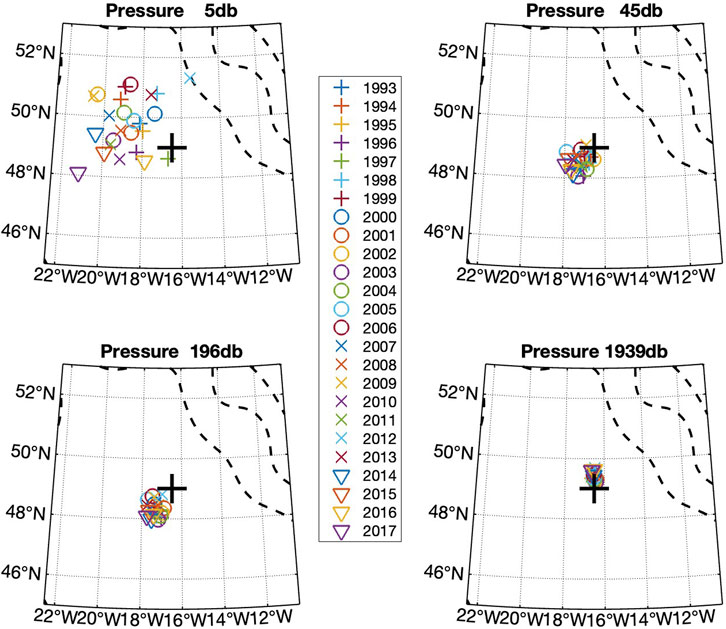
FIGURE 4. Derived location of the source water at PAP-SO 3 months before 1st June for each year at depths of about 5, 45, 200, and 2,000 m. One symbol is shown for each year from 1993 to 2017. The location is calculated using velocities from ECCO. The flow at 5 m is within the Ekman layer, but that at deeper levels is mostly geostrophic. Bathymetric contours for 1,000 and 4,000 m are indicated by dotted lines.
If the mass-weighted sinking rate of particles is 100 m d−1, the relevant time period is 1 month for material to reach 3000 m. Even if the material takes 3 months to reach the trap as used in the calculation for Figure 4, the relevant areas of ocean are almost always within the 2 × 3 boxes depicted in Figure 1. The ECCO data likely underestimate the magnitude of displacements but our conclusion is also supported by the model particle tracking results shown in Supplementary Figure S1.
The conclusion from this analysis is that as advective water motions are invariably slow, the ecosystem development takes place in a region close to PAP-SO and within the areas used to collect relevant data (Figure 1) and not in regions over the continental slope or shelf.
3.2 Biological characteristics and processes
3.2.1 Plankton community
The plankton community around PAP-SO as determined by CPR data is characterised by a diatom peak in April followed by a dinoflagellate peak in June/July with a broader peak of coccolithophores from May to October albeit with significant interannual variability (Supplementary Figure S4A, Figure 5). Both Radiolaria (which in CPR classification includes Phaeodaria) and Foraminifera bloom in the second half of the year but only to a significant extent in about half of the years considered, with both groups exhibiting similar seasonal and interannual variability. The blooms of Foraminifera usually occur over a longer period of time Supplementary Figure S4B).
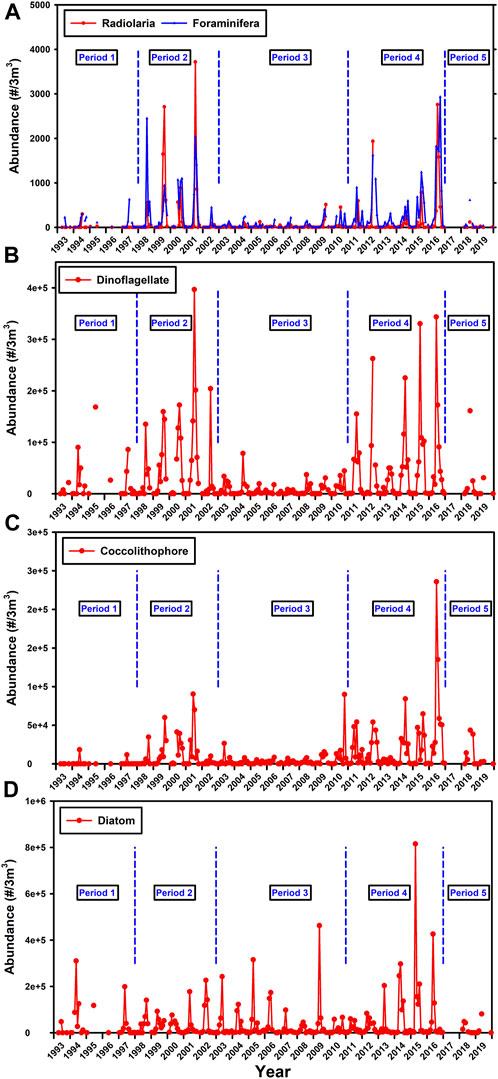
FIGURE 5. Data from the CPR (7 m depth) on the average monthly abundance (A) Radiolaria and Foraminifera (B) Dinoflagellates (C) Coccolithophores and (D) Diatoms with the proposed sub-time periods overlain. A fifth time period has been added from 2017 as the CPR data are of longer duration than the physical data. There are no data for 2017. The definition of “Radiolaria” in the CPR data base was defined before the taxanomic revision of Adl et al. (2019) and so include the Phaeodaria which are no longer considered as Radiolaria.
The CPR data in Figure 5 in the period 1993–2019 (inclusive) are subjectively divided into 5 shorter time periods which seem to have similar characteristics and furthermore mirror the water mass characteristics (Figures 3A,B) and surface CDOM (Figure 3C and Supplementary Figure S3C). The time periods are 1: 1993–1997, 2: 1998–2002, 3: 2003–2010, 4: 2011–2016, 5: 2017–2020. This temporal subdivision is particularly strong when considering the abundance of Radiolaria, Foraminifera, Dinoflagellates and coccolithophores but not diatoms (Figure 5).
Periods 2 and 4 seem similar in terms of the fauna, flora and physical water mass characteristics and Period 3 is clearly different with lower abundances of phytoplankton and Rhizaria, lower NPP (Figure 6B) and a strong influence of warm salty water throughout the top 1500 m (Figures 3A, B). Furthermore, this is a period during which the characteristic of the sediment trap material is somewhat different as discussed below.
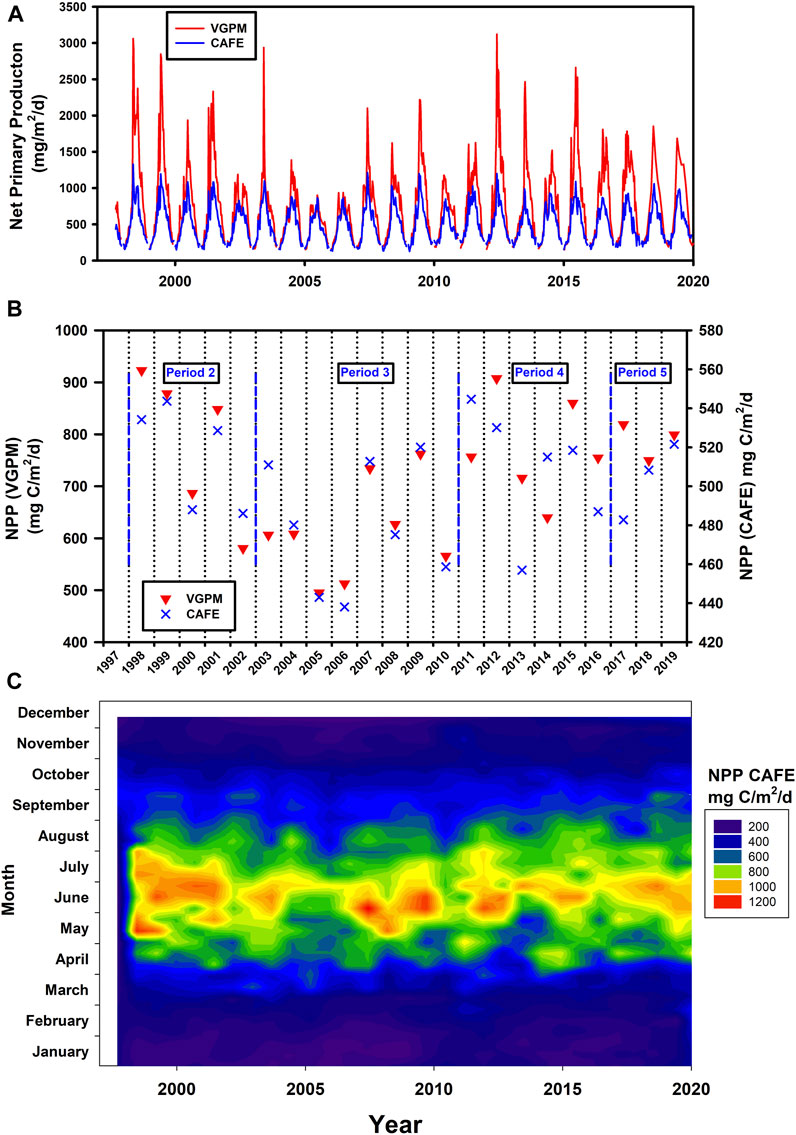
FIGURE 6. Estimates of Net Primary Production (NPP) (A) Time series based on two different methodologies and models. (B) Annual total NPP also using the two models. Note the different scales for the two model data sets. The shorter time periods discussed below are also shown. (C) Heat map of Merged CAFE data.
These periods seem to relate closely to the influence of NAC water in the upper 500 m and of Mediterranean outflow water in the depth range 700–1500 m with greater influence of the subtropical gyre during Period 3 associated with lower plankton abundance.
The VPR demonstrate the presence of Rhizaria at PAP-SO in June 2013 throughout the top 1000 m but perhaps surprisingly with no specimens recorded in the upper 10 m, the depth of the CPR samples (Supplementary Figures S5, S6) probably due to sunlight reducing the capability of the VPR to record such small targets. Alternatively, as this time of year is prior to surface blooms of Rhizaria at PAP-SO as determined by the CPR, their abundance could simply be low.
3.2.2 Net primary production (NPP)
Siegel et al. (2014) used satellite derived NPP to drive a food-web model of the upper ocean to predict export flux and from this one might calculate sequestration flux making assumptions about transfer efficiency. We calculated NPP using both the Merged CAFE model and VGPM and although VGPM has more seasonal variability and generally much higher values than CAFE (Figures 6A, B), the trends over these time periods are similar. Period 3 which has high temperature and salinity anomaly is characterised by lower levels of NPP than other periods. The CAFE model output is also presented as a heat map in Figure 6C.
3.3 Downward particle flux
As can be seen in Figure 7, downward particle flux varied between years in terms of magnitude and seasonal trend with a single or double peak in the period April to October (inclusive). Sampling was not always complete in each year and only those years in which more than 70% of the year was sampled were considered in the analysis. The exception is 2003 where although 84% of the year was sampled, this did not include a 2-month period in the summer when flux was probably high and the entire year of data was excluded. Integrated annual totals are thus considered to be valid for 18 of the years indicated by red stars in Figure 7B (details of each of these years are shown in Supplementary Figures S7, S8 along with the NPP). The integrated annual flux in terms of Total Mass, POC and PIC is shown in Figure 8 for these “good years” emphasising the large interannual variability particularly in POC flux (CV = 73%) and the need for long term measurements if sequestration flux is to be measured with the precision which is necessary.
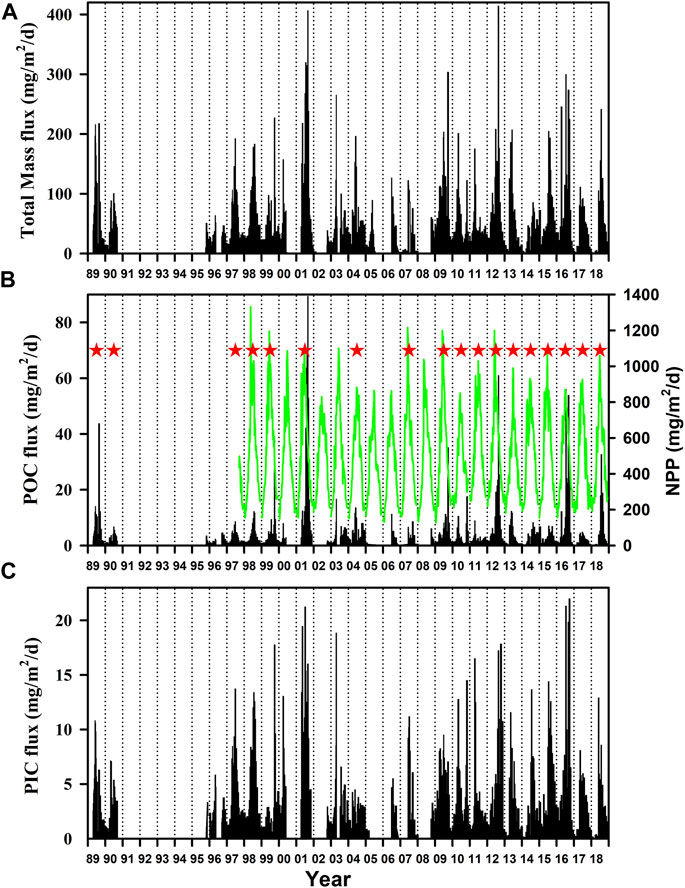
FIGURE 7. Particulate downward flux at 3,000 m for (A) Total Mass (B) POC and (C) PIC. Also shown in (B) is NPP based on the Merged CAFE model. The 18 years which have very few gaps in the data and hence considered to be “good” are indicated by red asterisk. Data from the years which are incomplete are of use for certain analyses but not for the calculation of total annual flux.
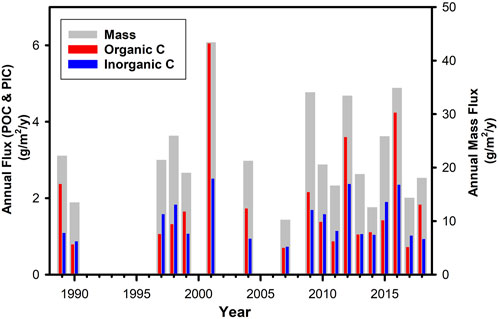
FIGURE 8. Integrated annual flux in terms of mass, POC and PIC for the 18 years considered to be “good years.”
4 Discussion
4.1 Characteristics of sequestration flux
Figure 9 shows that the annual particle flux at PAP-SO alongside deep-water measurements obtained elsewhere in the North Atlantic with multi-year data sets. Differences are not large although the North Atlantic oligotrophic gyre at 23oN is much lower as is expected (Pabortsava et al., 2017, Lampitt et al. in prep). While the average sequestration flux of all years is higher at PAP-SO than at other Atlantic time series stations, a further and important difference with these other data sets is that interannual variability is much larger at PAP-SO and the material is much more enriched in organic carbon although it is possible that some of this enrichment is due to mineral dissolution in the cups (Table 1).
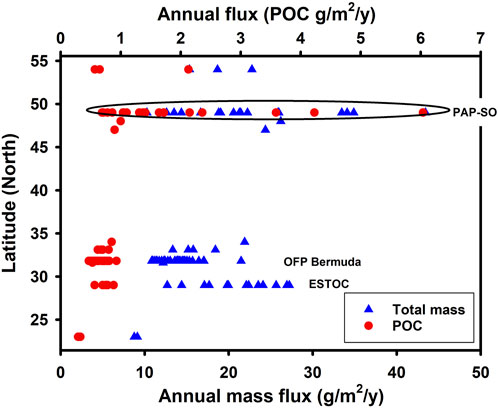
FIGURE 9. Latitudinal trend in deep ocean particle flux in the North Atlantic defined as data collected deeper than 2,000 m. Data from Guieu et al. (2005) which includes some unpublished data from other sources (33, 34, 48°N), Lampitt (1992) (32°N), Pabortsava et al. (2017) (23°N), Fischer et al. (2020) (ESTOC) (29°N), Conte et al. (2019 and Pers. Comm.) (OFP Bermuda) (32°N) and Waniek et al. (2005) (33, 47, 54°N) and PAP-SO reported here. The three time series stations with more than 10 complete years of data are identified by acronym.
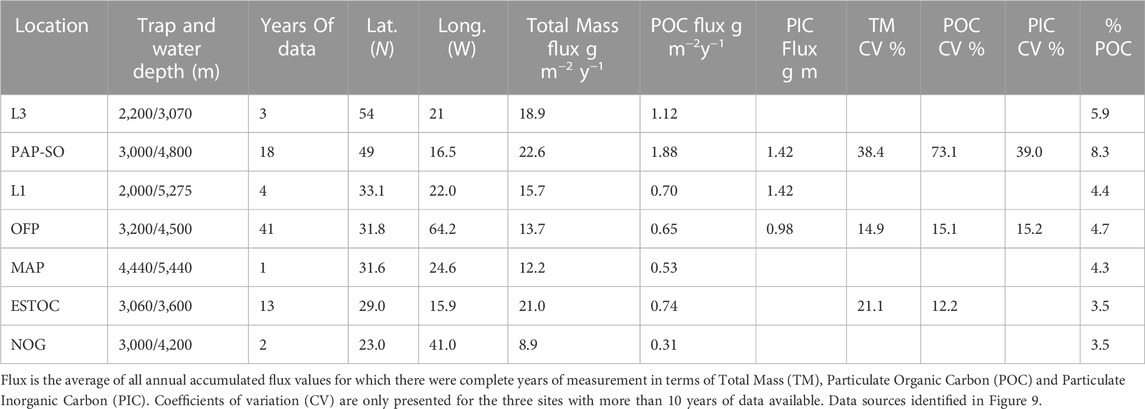
TABLE 1. Characteristics of flux at time series stations in the North Atlantic at which downward flux >2,000 m has been measured for complete years.
At PAP-SO, for several of the years, the peak in deep ocean POC flux preceded or was synchronous with the peak in NPP (Supplementary Figure S8) leading to the conclusion that although NPP is the ultimate driver for downward flux (Siegel et al., 2014) there may well be major seasonal variation in the export efficiency and/or transfer efficiency. This is not unexpected and is now being incorporated into biogeochemical models of particle flux (Dinauer et al., 2022).
The cause of the large interannual variability in POC sequestration flux and, to a lesser extent, Total Mass flux and PIC flux lies in the occurrence of pulses of organic material in late summer in about half of the years which are manifest as being highly enriched. Enriched pulses are subjectively defined for this paper as material with an organic carbon content greater than 12% of the mass flux which occurred in half of the 18 “good” years (Figure 10A). Concentrations as high as this are very rarely reported in deep ocean sediment trap studies with, for instance at OFP Bermuda, values of 5.0% ± 0.7% over the first quarter of the year decreasing to 4.7% ±0.7% for each of the subsequent quarters (Conte et al., 2019 and Pers. Comm.).
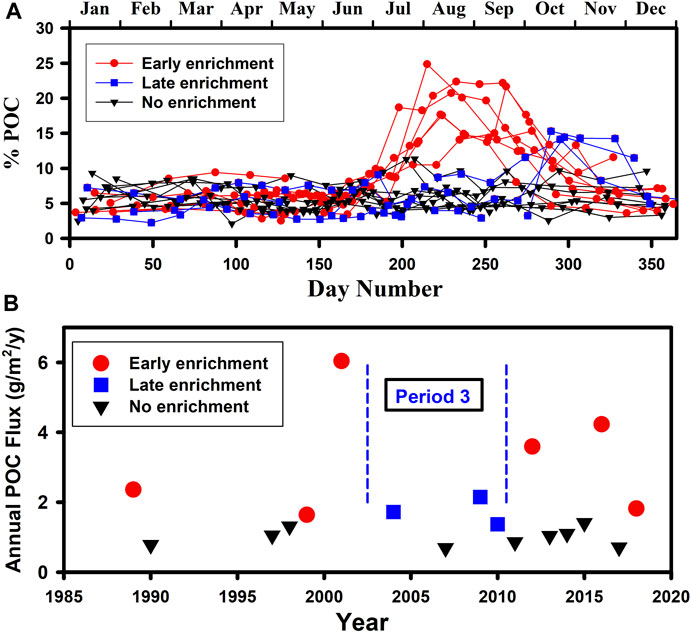
FIGURE 10. (A) Annual time series of percent POC for each of the “good” years distinguished according to whether the late-summer peaks were early (August–September) or late (October–November). (B) Annual POC flux distinguished according to whether the years were characterised by enriched material in the cups and whether this was early or late. Period 3 is identified as a time when, if there was enrichment, it was later in the year.
The 9 years with apparent enriched pulses are ones in which that the annual sequestration flux of POC is always higher than in years which are not enriched (Figure 10B). Apparent enrichment occurs either in August/September (6 of the years) or, during period 3 (2002–2010 inclusive), in October/November (3 of the years) and all of these 3 years with late enrichment are characterised by anomalously warm and salty water throughout the upper 1500 m (Figures 3A, B), generally low plankton abundance (Figure 5), lower surface CDOM (Supplementary Figure S3C) and somewhat lower Subpolar Gyre Index (Supplementary Figure S3A). It is when enrichment occurs in the earlier time period (August/September) that the enhanced annual POC flux is most pronounced. Such large and intermittent pulses of highly enriched material in the second half of the year are a major driver of elevated annual carbon sequestration at PAP-SO and a cause of its interannual variation.
4.2 Drivers for variability in sequestration flux
The biological and chemical processes controlling deep ocean flux are complex, but nevertheless are expected to have some relationship to three variables. Firstly, NPP (photosynthesis minus autotrophic respiration), secondly the proportion of this production which is exported from the upper ocean, “export efficiency”, and thirdly variation in the efficiency with which material is transported to depth, “transfer efficiency” (Buesseler and Boyd, 2009; Dinauer et al., 2022).
The traditional conceptual model of increasing NPP leading to an increase in particulate export (Pace et al., 1987) is not necessarily supported by the available observational data (Estapa et al., 2015; Cael et al., 2018) possibly due to the time lag between NPP and export being overlooked in typical observational datasets (Henson et al., 2015). With regard to deep ocean flux, which is likely to reflect processes over a large area of ocean surface (such as we assume here for the 220 x220 km box= 48,400 km2) and over longer periods of time (such as our sediment trap sampling period of 2 weeks or more), one would expect the spatial and temporal variability of all measurements to be smoothed and for the relationship to be improved but this is not evident in our data (Figure 11). At an even simpler level, one might expect that increased introduction of new nutrients into the euphotic zone as a result of winter mixing would generate enhanced productivity and that this might enhance sequestration flux. Once again variables which reflect mixing such as winter MLD and SST show no relationship to sequestration (Figure 12).
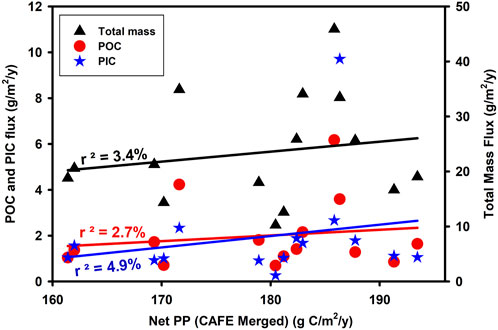
FIGURE 11. Relationship between NPP and the annual integrated flux at 3,000 m depth as total mass (p = 0.512237, n = 15) particulate organic carbon (p = 0.565278, n = 15) and particulate inorganic carbon (p = 0.427561, n = 15).
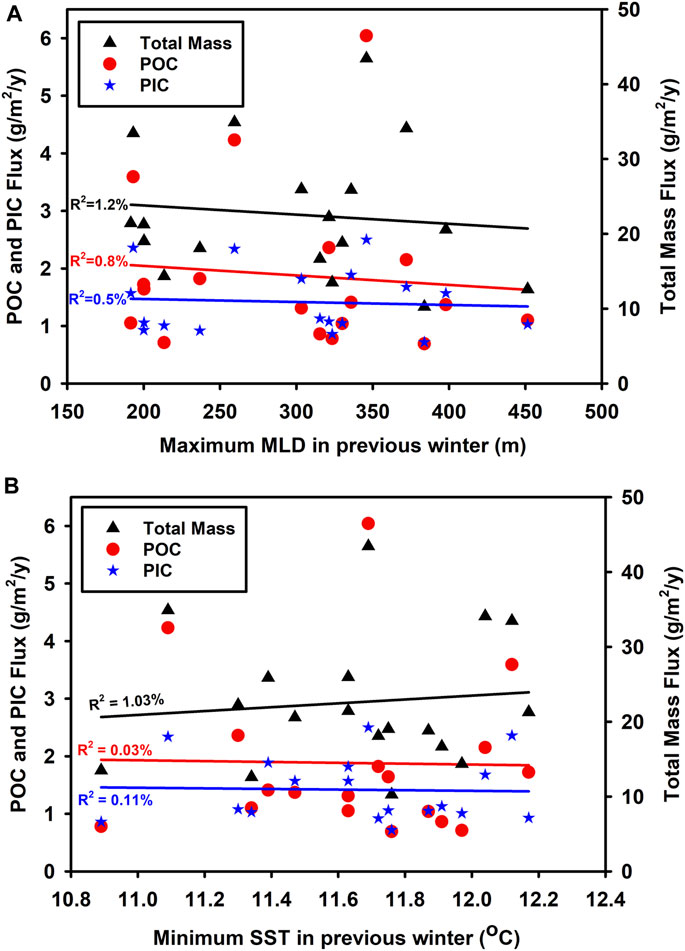
FIGURE 12. Relationship between (A) maximum MLD in previous winter (usually in February) using temperature criterion and (B) minimum SST and annual integrated downward flux at 3,000 m depth as total mass [(A): p = 0.667385, n = 18] [(B): p = 0.688312, n = 18] particulate organic carbon [(A): p = 0.715663, n = 18] [(B): p = 0.942231, n = 18] and particulate inorganic carbon [(A): p = 0.777693, n = 18] [(B): p = 0.894703, n = 18]. MLD and SST were derived from the EN4 data base.
In an earlier paper on deep ocean flux at PAP-SO, the percentage of the annual organic carbon primary production which reaches 3000 m varied from 0.6% to 3.4% with no clear relationship found between sequestration flux and likely drivers such as water-column mixing (OCCAM model), chlorophyll (from satellite) or total primary production (Lampitt et al., 2010b). The conclusion from our current paper is that even with 18 full years of data there is still no direct correspondence between the interannual variability in NPP and deep ocean flux (Figure 11). Although on the global scale, areas of higher productivity tend to have higher deep ocean flux (Lampitt and Antia, 1997; Lutz et al., 2007) others have also found that variation in annual NPP is not a predictor of sequestration flux (Cavan et al., 2019; Wynn-Edwards et al., 2020) and we propose that variation in transfer efficiency is likely to be the critical factor affecting sequestration and it is now appropriate to discuss the causes of such changes in transfer efficiency.
More than half of the years with POC-enrichment in August/September are years characterised by high SST in June (Figure 13) and this is evidenced by the relationship between SST in June and the richness of the material in the sediment trap cups in the second half of the year (Figure 14). There is therefore an indication that a change in the physics of the water column in June, namely, temperature, is having a profound effect on the process of sequestration and the quest is to uncover the nature of this relationship. This elevated upper ocean temperature in June is just before the peak in abundance of Rhizaria in the latter half of the year (when a Rhizaria peak occurs; Supplementary Figure S4B) and we note that in 2001 which was a year with exceptionally high abundance of Rhizaria and sequestration flux, elevated temperature was found in May as well as in June (Figure 13).
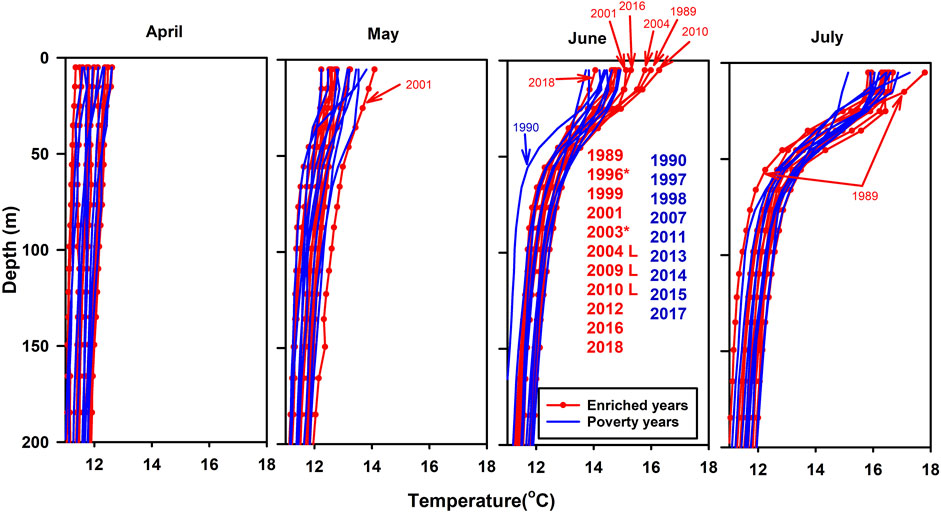
FIGURE 13. Vertical profiles of temperature from EN4 distinguishing those years in which there was enriched material in samples in the sediment traps later in the year (red) from those without enrichment (blue). *: Years with incomplete flux data. L: Enrichment late in year.
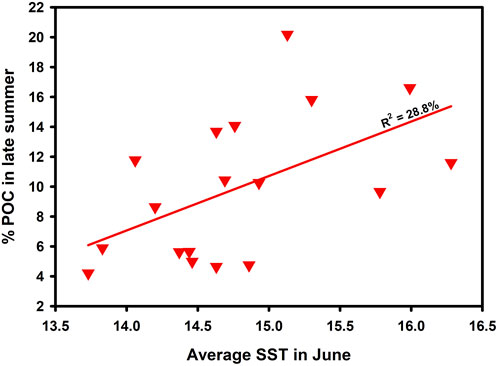
FIGURE 14. Relationship between June SST (5 m depth) from EN4 and richness of the sedimented material expressed as % particulate organic carbon in late summer (August to November inclusive, covering both the early and late enrichment periods). (p = 0.021623, n = 18).
One could describe this as a “June-Switch” during which high SST in June promotes an ecosystem change which leads to high abundance of upper-ocean Rhizaria in July-August which then leads to the deposition of material at 3000 m in the late summer which may be enriched while sinking or may become enriched in the sediment trap cups by preferential dissolution of mineral components (Figure 15). This switch affects both the foraminifera and Radiolaria with a clear relationship for the time periods outside of Period 3 (2003–2010 inclusive) (Supplementary Figure S9). The reason why Period 3 is again different from the rest of the time series is unclear at present although this is the time when the subtropical gyre appears to have enhanced influence on PAP (From SPG index, Temperature, Salinity, surface CDOM and upper ocean plankton).
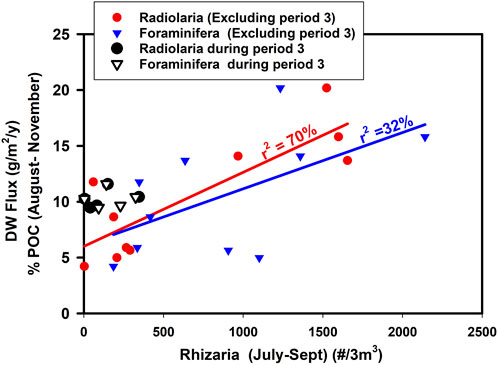
FIGURE 15. Relationship between Rhizaria abundance in the period July to September excluding period 3 and the average % organic carbon in sediment trap material in the period August to November (inclusive) for Radiolaria (p = 0.002536, n = 10) and Foraminifera (p = 0.088849, n = 10). Data from Period 3 are distinguished. Data from 2003 are also included as good data on Rhizaria were available but with a gap in the sediment trap record in mid-summer so not used in annual calculations of flux.
These protozoa have a wide depth range primarily in the mesopelagic (100–1000 m) (Supplementary Figure S5), but are also found in the bathypelagic (1000–3000 m), and have significant niche differentiation (Ikenoue et al., 2019; Biard and Ohman, 2020), a generation time of a few days (Stukel et al., 2018) and a broad diet (phytoplankton, zooplankton, detritus, bacteria) (Gowing, 1989). In addition, some species of both Radiolaria and Foraminifera living in the euphotic zone form a symbiotic relationship with algae (Decelle et al., 2015). We are unaware of any insights into their ability to migrate vertically and the species identity from samples collected by the CPR or VPR is usually unknown in spite of the high-quality images of the VPR (Supplementary Figure S6). The period of July-August when they are most abundant is one in which silicate is likely to be at a low level (Louanchi and Najjar, 2001) having been stripped out by siliceous phytoplankton earlier in the year. It is therefore surprising that the siliceous Rhizaria which are thought to be less effective at using silicate become abundant when this crucial element is in such short supply. The Si uptake dynamics of rhizarians is extremely hard to determine experimentally (Laget et al., 2023) and may, in future, be found to exhibit some nuanced strategies to address this. Future research should focus on the species and/or chemical composition of the Rhizaria in late summer. It is not possible to determine the causality of this June-switch but, bearing in mind the wide range of food types consumed by Rhizaria (Gowing, 1989) and the likelihood of significant changes in ecosystem structure across multiple trophic levels over large areas in response to modest changes in temperature (Beaugrand et al., 2008), there are many possibilities.
It appears that the Rhizaria in the second half of the year (July-September) at 7 m depth (CPR) have a strong influence on organic carbon apparent enrichment (Figure 15) leading to high POC flux later in the year (Figure 16) and even an increase in annual sequestration.
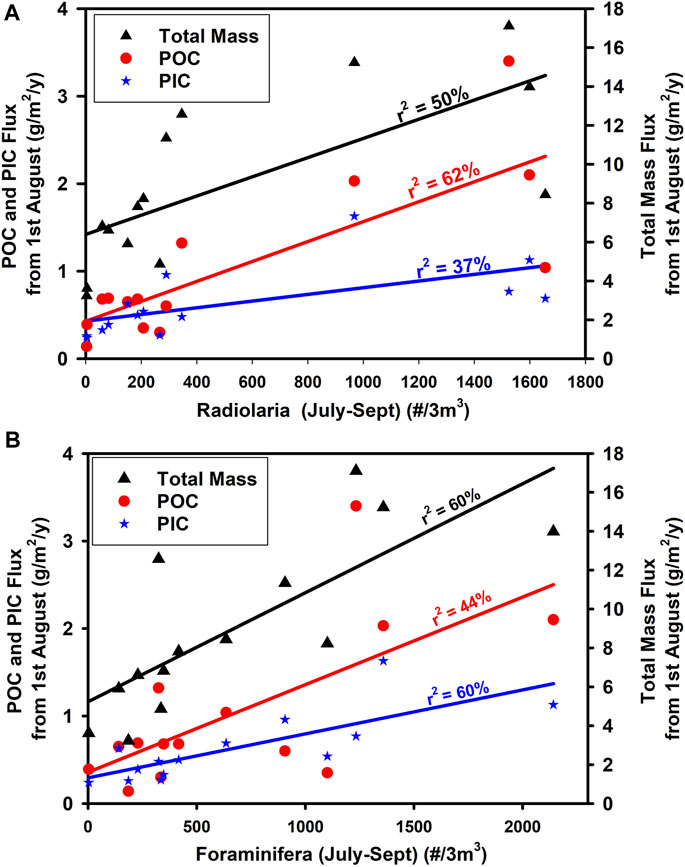
FIGURE 16. Relationship between the average concentration of (A) Radiolaria and (B) Foraminifera during the late summer (July–September inclusive) at 7 m depth (CPR) and the flux from 1st August–31st December at 3,000 m depth expressed as Total Mass [(A): p = 0.00328, n = 15] [(B): p = 0.018123, n = 15], POC [(A): p = 0.019246, n = 14] [(B): p = 0.009285, n = 14] and PIC [(A): p = 0.020562, n = 14] [(B): p = 0.001125, n = 14]. All regressions are significant at the 95% confidence level.
In the past, the Rhizarian group which has been most often implicated as a vehicle for downward flux is the Radiolaria and Phaeodaria (Lampitt et al., 2009; Ikenoue et al., 2012; Stukel et al., 2018; Gutierrez-Rodriguez et al., 2019; Ikenoue et al., 2019). There has also been considerable focus on the role played by Foraminifera in particle flux studies (Storz et al., 2009; Salmon et al., 2015) with Salmon et al. (2015) concluding that up to 40% of total CaCO3 fluxes were due to this group. The Acantharia can also make an important contribution to POC flux as a result of sedimentation of their cysts (Martin et al., 2010).
One could speculate that these protozoae are a significant vehicle for transporting material to depth and that the tests dissolve in the sediment trap cups leaving behind the very rich soup which we have found. This is plausible, especially if the species are phaeodarians which have skeletons comprising hollow tubes of silica and dissolve very easily (Erez et al., 1982). This suggestion is further supported by the fact that phaeodarians which had been collected and visually noted in sediment trap deployments of a few days’ duration in the Costa Rica Dome in 2010 had completely dissolved or broken up after a year of storage (Mike Stukel. Pers. Comm.). As stated above, we would not expect dissolution of tests of Foraminifera but, due to the high percentage of organic carbon in living specimens (POC:PIC = 2.8) (Schiebel and Movellan, 2012) they could still be the cause of the highly enriched material found in sediment traps in the late summer.
The question to address now is what are the relative roles of the Radiolaria, Phaeodaria and Foraminifera in sequestration flux and, in addition, their role in CO2 uptake by the ocean. There has been much discussion about the role played by biogenic minerals in the control of particle flux, the so-called ballast hypothesis (Armstrong et al., 2002) but without a clear conclusion yet as to whether such minerals are the primary cause.
In terms of CO2 uptake from the atmosphere, the consequences of growth and flux of siliceous or calcareous groups are very different. POC generation in the surface ocean leads to a reduction in the partial pressure of CO2 that is compensated by uptake of atmospheric CO2. In contrast, the process of calcification such as during the precipitation of Foraminifera tests releases CO2 and hence reduces CO2 uptake by the ocean, the so called “carbonate counter pump” (Salter et al., 2014). At a molar POC:PIC ratio of 0.6, there is no net change in pCO2 (Antia et al., 2001). The POC:PIC ratio at PAP-SO is invariably well above this figure and, on an annual basis higher than the other areas of the Atlantic for which there are data (Table 1). We conclude that this region is one which is highly effective for CO2 uptake by the oceans, a conclusion also reached from measurements of surface pCO2 (Macovei, et al., 2020). An important question is to determine if this is driven primarily by the Radiolaria or by the Foraminifera, groups which have such close similarities in terms of their population trends (interannual and seasonal) but such strong dissimilarities in terms of their effects on CO2 uptake from the atmosphere. The data shown in Figure 16 indicate strongly that the relationship between Radiolaria and flux is best described in terms of Total Mass and POC while the relationship between Foraminifera and flux is best described by Total Mass and PIC. With a small data set of only 13 or 14 data points, the confidence in this conclusion is not high but nevertheless it does support the suggestion that Radiolaria exert their main effect on POC flux while Foraminifera affect PIC flux more greatly. This also seems plausible due to the fact that the test of Radiolaria (and Phaeodaria) are siliceous and may dissolve within the sediment trap cups before analysis while Foraminifera with calcite tests are less likely to dissolve. There is however new evidence giving strong support to the idea that calcite dissolution occurs at much shallower depths than predicted as a result of biological processes (Subhas et al., 2022). It is possible that further microscopic analyses of sediment trap material will cast light on this although the effects of dissolution may prevent any meaningful conclusion.
5 Conclusion
1. Particle flux at 3,000 m at the PAP-SO site was well described in 18 of the 30 years between 1989 and 2018. The accumulated annual total flux has little relationship to the MLD in the previous winter, minimum SST in the previous winter or Net Primary Production.
2. PAP-SO is exposed to varying influence of the subtropical and subpolar gyres as indicated by upper ocean CDOM, salinity, temperature and upper ocean biota. Subtropical waters exert greater influence during the period 2003–2010.
3. The average annual sequestration flux at PAP-SO exceeds that measured at other deep moored sediment trap timeseries in the Atlantic although not statistically so (at 95%). It exhibits greater interannual variation than these other sites which we suggest is driven by the sporadic surface blooms of the protozoan super-group, the Rhizaria that occur in about half of the years.
4. Enhanced SST in June directly or indirectly increases the abundance of these populations of Rhizaria in late summer. When these blooms occur, material collected subsequently that year in the sediment traps at 3,000 m is highly enriched in organic carbon possibly enhanced by mineral dissolution within the cups and the mass flux is also greater. The combination of enrichment and increased mass flux is such that the calculated annual sequestration flux of organic carbon is greatly enhanced in these years.
5. Among the Rhizaria, this POC enrichment appears to be primarily driven by Radiolaria as defined by the CPR (and maybe enhanced by silica test dissolution) while Foraminifera blooms appear to be primary drivers of late-season PIC flux as well as POC flux.
6. We propose that the major seasonal and interannual variation in sequestration flux at 3,000 m depth is caused by variations in the efficiency by which material is transferred to depth and that this is due to the presence or absence of Rhizaria. If transfer efficiency is high, carbon sequestration will be enhanced and the ocean will be a more effective reservoir for atmospheric CO2.
7. We propose that in the context of ocean carbon sequestration, research into the processes which export material from the upper ocean should include characterisation of the particulate material which is responsible for this export with a clear appreciation of the contemporaneous efficiency by which this material sinks to a depth well into the bathypelagic zone (1,000–3,000 m).
Data availability statement
EN.4.2.1 data were obtained from https://www.metoffice.gov.uk/hadobs/en4/ and are © British Crown Copyright, Met Office, 2013, provided under a Non-Commercial Government Licence http://www.nationalarchives.gov.uk/doc/non-commercial-government-licence/version/2/. ECCO data (Central Estimate Version 4 Release 4) were retrieved from https://ecco-group.org/products-ECCO-V4r4.htm Sea-surface height (SSH) data were obtained from E.U. Copernicus Marine Services DOI: https://doi.org/10.48670/moi-00148. Data on particle flux used in this paper can be found at: https://www.bodc.ac.uk/data/published_data_library/catalogue/10.5285/f7e05069-093d-5bd3-e053-6c86abc056c2.
Author contributions
RL conceived and managed the research program and wrote the paper with comments from co-authors, CP provided technical support which involved coordinating sediment trap deployments and analysing the collected material. PH provided CPR data and insight, FN coordinated deployment and analysed the VPR, DS provided data and insight on physical oceanography, BC provided data on NPP, BE worked in the particle tracking model, NB and SH provided insight and comments on the manuscript. All authors contributed to the article and approved the submitted version.
Funding
The Porcupine Abyssal Plain—Sustained Observatory of the Natural Environment Research Council (NERC, United Kingdom) is principally funded through the Climate Linked Atlantic Sector Science (CLASS) project supported by NERC National Capability funding (NE/R015953/1) but has also had major support from the European Union: EuroSITES (ID: 202955); FixO3 (ID: 312463); CARBOCHANGE (ID: 264879); CARBOOCEAN (ID: 511176); AtlantOS (ID: 633211); MERSEA (ID: 502885); EMSO-Link (ID: 731036). This work was supported by a European Research Council Consolidator grant (GOCART, agreement number 724416) to SH.
Acknowledgments
The PAP-SO time series would not be possible without the ongoing support of the National Marine Facilities group and the Ocean Technology and Engineering group at the NOC. We thank the dedicated captains and crews of the numerous ships involved in the data collection and equipment servicing at the PAP-SO. We also thank the many graduate students and colleagues that have contributed to the data collection and analysis, and the British Oceanographic Data Centre for hosting and making the data available.
Conflict of interest
The authors declare that the research was conducted in the absence of any commercial or financial relationships that could be construed as a potential conflict of interest.
Publisher’s note
All claims expressed in this article are solely those of the authors and do not necessarily represent those of their affiliated organizations, or those of the publisher, the editors and the reviewers. Any product that may be evaluated in this article, or claim that may be made by its manufacturer, is not guaranteed or endorsed by the publisher.
Supplementary material
The Supplementary Material for this article can be found online at: https://www.frontiersin.org/articles/10.3389/feart.2023.1176196/full#supplementary-material
References
Adl, S. M., Bass, D., Lane, C. E., Lukes, J., Schoch, C. L., Smirnov, A., et al. (2019). Revisions to the classification, nomenclature, and diversity of eukaryotes. J. Eukaryot. Microbiol. 66, 4–119. doi:10.1111/jeu.12691
Antia, A. N., Koeve, W., Fischer, G., Blanz, T., Schulz-Bull, D., Scholte, J., et al. (2001). Basin-Wide particulate carbon flux in the atlantic ocean: regional export patterns and potential for atmospheric CO2 sequestration. Glob. Biogeochem. Cycles 15, 845–862. doi:10.1029/2000gb001376
Antia, A. N. (2005). Solubilization of particles in sediment traps: revising the stoichiometry of mixed layer export. Biogeosciences 2, 189–204. doi:10.5194/bg-2-189-2005
Armstrong, R. A., Lee, C., Hedges, J. I., Honjo, S., and Wakeham, S. G. (2002). A new, mechanistic model for organic carbon fluxes in the ocean based on the quantitative association of POC with ballast minerals. Deep Sea Res. Part II Top. Stud. Oceanogr. 49, 219–236. doi:10.1016/S0967-0645(01)00101-1
Baetge, N., Graff, J. R., Behrenfeld, M. J., and Carlson, C. A. (2020). Net community production, dissolved organic carbon accumulation, and vertical export in the western North Atlantic. Front. Mar. Sci. 7, 227. doi:10.3389/fmars.2020.00227
Baker, C. A., Martin, A. P., Yool, A., and Popova, E. (2022). Biological carbon pump sequestration efficiency in the North Atlantic: A leaky or a long-term sink? Glob. Biogeochem. Cycles 36, e2021GB007286. doi:10.1029/2021GB007286
Batten, S. D., Clark, R., Flinkman, J., Hays, G., John, E., John, A. W. G., et al. (2003). CPR sampling: the technical background, materials, and methods, consistency and comparability. Prog. Oceanogr. 58, 193–215. doi:10.1016/j.pocean.2003.08.004
Beaugrand, B., Edwards, M., Brander, K., Luczak, C., and Ibanez, F. (2008). Causes and projections of abrupt climate-driven ecosystem shifts in the North Atlantic. Ecol. Lett. 11, 1157–1168. doi:10.1111/j.1461-0248.2008.01218.x
Beaugrand, G., Edwards, M., and Hélaouët, P. (2019). An ecological partition of the Atlantic Ocean and its adjacent seas. Prog. Oceanogr. 173, 86–102. doi:10.1016/j.pocean.2019.02.014
Biard, T., and Ohman, M. D. (2020). Vertical niche definition of test-bearing protists (Rhizaria) into the twilight zone revealed by in situ imaging. Limnol. Oceanogr. 65, 2583–2602. doi:10.1002/lno.11472
Biard, T., Stemmann, L., Picheral, M., Mayot, N., Vandromme, P., Hauss, H., et al. (2016). In situ imaging reveals the biomass of giant protists in the global ocean. Nature 532, 504–507. doi:10.1038/nature17652
Boyd, P. W., Claustre, H., Levy, M., Siegel, D. A., and Weber, T. (2019). Multi-faceted particle pumps drive carbon sequestration in the ocean. Nature 568, 327–335. doi:10.1038/s41586-019-1098-2
Bozec, A., Lozier, M. S., Chassignet, E. P., and Halliwell, G. R. (2011). On the variability of the mediterranean outflow water in the North Atlantic from 1948 to 2006. J. Geophys. Res. 116, C09033. doi:10.1029/2011JC007191
Briggs, N., Dall'Olmo, G., and Claustre, H. (2020). Major role of particle fragmentation in regulating biological sequestration of CO2 by the oceans. Science 367, 791–793. doi:10.1126/science.aay1790
Buesseler, K. O., and Boyd, P. W. (2009). Shedding light on processes that control particle export and flux attenuation in the twilight zone of the open ocean. Limnol. Oceanogr. 54, 1210–1232. doi:10.4319/lo.2009.54.4.1210
Cael, B. B., Bisson, K., and Follett, C. (2018). Can rates of ocean primary production and biological carbon export be related through their probability distributions? Glob. Biogeochem. Cycles 32, 954–970. doi:10.1029/2017GB005797
Cavan, E. L., Laurenceau-Corneca, E. C., Bressaca, M., and Boyd, P. W. (2019). Exploring the ecology of the mesopelagic biological pump. Prog. Oceanogr. 176, 102125–102215. doi:10.1016/j.pocean.2019.102125
Chelton, D., Schlax, M., and Samelson, R. (2011). Global observations of nonlinear mesoscale eddies. Prog. Oceanogr. 91, 167–216. doi:10.1016/j.pocean.2011.01.002
Conte, M. H., Carter, A. M., Koweek, D. A., Huang, S., and Weber, J. C. (2019). The elemental composition of the deep particle flux in the Sargasso Sea. Chem. Geol. 511, 279–313. doi:10.1016/j.chemgeo.2018.11.001
Decelle, J., Colin, S., and Foster, R. A. (2015). “Photosymbiosis in marine planktonic protists,” in Marine protists. Editors S. Ohtsuka, T. Suzaki, T. Horiguchi, and N. Suzuki (Japan: Springer), 465–500.
Dinauer, A., Laufkötter, C., Doney, S. C., and Joos, F. (2022). What controls the large-scale efficiency of carbon transfer through the ocean's mesopelagic zone? Insights from a new, mechanistic model (MSPACMAM). Glob. Biogeochem. Cycles 36, e2021GB007131. doi:10.1029/2021GB007131
Durden, J. M., Bett, B. J., and Ruhl, H. A. (2020). Subtle variation in abyssal terrain induces significant change in benthic megafaunal abundance, diversity, and community structure. Prog. Oceanogr. 186, 102395. doi:10.1016/j.pocean.2020.102395
Erez, J., Takahashi, K., and Honjo, S. (1982). In-situ dissolution experiment of Radiolaria in the central north pacific ocean. Earth Planet. Sci. Lett. 59, 245–254. doi:10.1016/0012-821x(82)90129-7
Espinasse, B., Sturbois, A., Basedow, S. L., Hélaouët, P., Johns, D. G., Newton, J., et al. (2022). Temporal dynamics in zooplankton δ 13C and δ 15N isoscapes for the North Atlantic ocean: decadal cycles, seasonality, and implications for predator ecology. Front. Ecol. Evol. 10, 986082. doi:10.3389/fevo.2022.986082
Estapa, M. L., Siegel, D. A., Buesseler, K. O., Stanley, R. H. R., Lomas, M. W., and Nelson, N. B. (2015). Decoupling of net community and export production on submesoscales in the Sargasso Sea. Glob. Biogeochem. Cycles 29, 1266–1282. doi:10.1002/2014gb004913
Febvre, C., Febvre, J., and Michaels, A. (2002). “Acantharia,” in The illustrated guide to the Protozoa Editors. J. J. Lee, G. F. Leedale, and P. Bradbury (USA Society of Protozoologists), 783–803.
Fischer, G., Neuer, S., Ramondenc, S., Müller, T. J., Donner, B., Ruhland, G., et al. (2020). Long-term changes of particle flux in the canary basin between 1991 and 2009 and comparison to sediment trap records off Mauritania. Front. Earth Sci. 8, 280. doi:10.3389/feart.2020.00280
Forget, G., Campin, J. M., Heimbach, P., Hill, C. N., Ponte, R. M., and Wunsch, C. (2015). ECCO version 4: an integrated framework for non-linear inverse modeling and Global Ocean state estimation. Geosci. Model. Dev. 8, 3071–3104. doi:10.5194/gmd-8-3071-2015
Foukal, N. P., and Lozier, M. S. (2017). Assessing variability in the size and strength of the North Atlantic subpolar gyre. J. Geophys. Res. Oceans 122, 6295–6308. doi:10.1002/2017JC012798
Fox, A. D., Handmann, P., Schmidt, C., Fraser, N., Rühs, S., Sanchez-Franks, A., et al. (2022). Exceptional freshening and cooling in the eastern subpolar North Atlantic caused by reduced Labrador Sea surface heat loss. Ocean. Sci. 18, 1507–1533. doi:10.5194/os-18-1507-2022
ECCO Consortium Fukumori, I., Wang, O., Fenty, I., Forget, G., Heimbach, P., and Ponte, R. M. (2021). Synopsis of the ECCO central production Global Ocean and Sea-ice state estimate. (Version 4 Release 4). doi:10.5281/zenodo.4533349
Good, S. A., Martin, M. J., and Rayner, N. A. (2013). EN4: quality controlled ocean temperature and salinity profiles and monthly objective analyses with uncertainty estimates. J. Geophys. Res. Oceans 118, 6704–6716. doi:10.1002/2013JC009067
Gowing, M. M. (1989). Abundance and feeding ecology of Antarctic phaeodarian radiolarians. Mar. Biol. 103, 107–118. doi:10.1007/BF00391069
Guidi, L., CalilDuhamel, P. H. R. S., Björkman, K. M., Doney, S. C., and Jackson, G. A. (2012). Does eddy-eddy interaction control surface phytoplankton distribution and carbon export in the North Pacific Subtropical Gyre? J. Geophys. Res. 117, G02024. doi:10.1029/2012JG001984
Guieu, C., Roy-Barman, M., Leblond, N., Jeandel, C., Souhaut, M., Le Cann, B., et al. (2005). Vertical particle flux in the northeast Atlantic Ocean (POMME experiment). J. Geophys. Res. 110, C07S18. doi:10.1029/2004JC002672
Gutierrez-Rodriguez, A., Stukel, M. R., dos Santos, A. L., Biard, T., Scharek, R., Vaulot, D., et al. (2019). High contribution of Rhizaria (Radiolaria) to vertical export in the California Current Ecosystem revealed by DNA metabarcoding. ISME J. 13, 964–976. doi:10.1038/s41396-018-0322-7
Hartman, S. E., Bett, B. J., Durden, J. M., Henson, S. A., Iversen, M., Jeffreys, R. M., et al. (2021). Enduring science: three decades of observing the Northeast Atlantic from the porcupine Abyssal Plain Sustained observatory (PAP-SO). Prog. Oceanogr. 191, 102508. doi:10.1016/j.pocean.2020.102508
Hátún, H., and Chafik, L. (2018). On the recent ambiguity of the North Atlantic subpolar gyre index. J. Geophys. Res. Oceans 123, 5072–5076. doi:10.1029/2018JC014101
Henson, S. A., Laufkötter, C., Leung, S., Giering, S. L. C., Palevsky, H. I., and Cavan, E. L. (2022). Uncertain response of ocean biological carbon export in a changing world. Nat. Geosci. 15, 248–254. doi:10.1038/s41561-022-00927-0
Henson, S. A., Yool, A., and Sanders, R. (2015). Variability in efficiency of particulate organic carbon export: A model study. Geophys. Res. Lett. 29, 33–45. doi:10.1002/2014GB004965
Holliday, N. P., Bersch, M., BerxChafik, B. .L., Cunningham, S., Florindo-López, C., Florindo-López, C., et al. (2020). Ocean circulation causes the largest freshening event for 120 years in eastern subpolar North Atlantic. Nat. Commun. 11, 585. doi:10.1038/s41467-020-14474-y
Honjo, S., and Doherty, K. W. (1988). Large aperture time-series sediment traps; design objectives, construction and application. Deep-Sea Res. 35, 133–149. doi:10.1016/0198-0149(88)90062-3
Ikenoue, T., Kimoto, K., Okazaki, Y., Sato, M., Honda, M. C., Takahashi, K., et al. (2019). Phaeodaria: an important carrier of particulate organic carbon in the mesopelagic twilight zone of the North pacific ocean. Glob. Biogeochem. Cycles 33, 1146–1160. doi:10.1029/2019gb006258
Ikenoue, T., Takahashi, K., and Tanaka, S. (2012). Fifteen year time-series of radiolarian fluxes and environmental conditions in the Bering Sea and the central subarctic Pacific, 1990–2005. Deep Sea Res. Part II Top. Stud. Oceanogr. 61-64, 17–49. doi:10.1016/j.dsr2.2011.12.003
Kiriakoulakis, K., Stutt, E., Rowland, S. J., Vangriesheim, A., Lampitt, R. S., and Wolff, G. A. (2001). Controls on the organic chemical composition of settling particles in the Northeast Atlantic Ocean. Prog. Oceanogr. 50, 65–87. doi:10.1016/s0079-6611(01)00048-9
Koul, V., Tesdal, J. E., Bersch, M. .H., Brune, S., and Borchert, L. (2020). Unraveling the choice of the north Atlantic subpolar gyre index. Sci. Rep. 10, 1005. doi:10.1038/s41598-020-57790-5
Kwon, E., Primeau, F., and Sarmiento, J. (2009). The impact of remineralization depth on the air–sea carbon balance. Nat. Geosci. 2, 630–635. doi:10.1038/ngeo612
Laget, M., Llopis-Monferrer, N., Maguer, J. F., Leynaert, A., and Biard, T. (2023). Elemental content allometries and silicon uptake rates of planktonic Rhizaria: insights into their ecology and role in biogeochemical cycles. Limnol. Oceanogr. 68, 439–454. doi:10.1002/lno.12284
Lampitt, R. S., and Antia, A. N. (1997). Particle flux in deep seas: regional characteristics and temporal variability. Deep-Sea Res. Part I 44, 1377–1403. doi:10.1016/s0967-0637(97)00020-4
Lampitt, R. S., Bett, B. J., Kiriakoulis, K., Popova, E. E., Ragueneau, O., Vangriesheim, A., et al. (2001). Material supply to the abyssal seafloor in the Northeast Atlantic. Prog. Oceanogr. 50, 27–63. doi:10.1016/s0079-6611(01)00047-7
Lampitt, R. S., Boorman, B., Brown, L., Lucas, M., Salter, I., Sanders, R., et al. (2008). Particle export from the euphotic zone: estimates using a novel drifting sediment trap, 234th and new production. Deep Sea Res. I 55, 1484–1502. doi:10.1016/j.dsr.2008.07.002
Lampitt, R. S., Newton, P. P., Jickells, T. D., Thomson, J., and King, P. (2000). Near-bottom particle flux in the abyssal northeast Atlantic. Deep-Sea Res. II 47, 2051–2071. doi:10.1016/s0967-0645(00)00016-3
Lampitt, R. S., Salter, I., deCuevas, B. A., Hartman, S., Larkin, K. E., and Pebody, C. A. (2010b). Long-term variability of downward particle flux in the deep Northeast Atlantic: causes and trends. Deep-Sea Res. II 57, 1346–1361. doi:10.1016/j.dsr2.2010.01.011
Lampitt, R. S., Salter, I., and Johns, D. (2009). Radiolaria: major exporters of organic carbon to the deep ocean. Glob. Biogeochem. Cycles 23, GB1010. doi:10.1029/2008GB003221
Lampitt, R. S. (1992). The contribution of deep-sea macroplankton to organic remineralization: results from sediment trap and zooplankton studies over the madeira Abyssal Plain. Deep-Sea Res. 39, 221–233. doi:10.1016/0198-0149(92)90106-4
LampittBillett, R. S. D. S. M., and Martin, A. P. (2010a). The sustained observatory over the porcupine Abyssal Plain (PAP): insights from time series observations and process studies. Deep-Sea Res. Part II Top. Stud. Oceanogr. 57, 1267–1271. doi:10.1016/j.dsr2.2010.01.003
Longhurst, A. R. (2006). Ecological geography of the sea. 2nd Edition. San Diego: Academic Press, 560p.
Louanchi, F., and Najjar, R. G. (2001). Annual cycles of nutrients and oxygen in the upper layers of the North Atlantic Ocean. Deep-Sea Res. II 48, 2155–2171. doi:10.1016/s0967-0645(00)00185-5
Lutz, M. J., Caldeira, K., Dunbar, R. B., and Behrenfeld, M. J. (2007). Seasonal rhythms of net primary production and particulate organic carbon flux to depth describe the efficiency of biological pump in the global ocean. J. Geophys. Research-Part C-Oceans112(C10) 112, C10011–1. doi:10.1029/2006jc003706
Macovei, V. A., HartmanSchusterTorres-ValdésMoore, S. E. U. S. C. M., Sanders, R. J., Torres-Valdés, S., and Sanders, R. J. (2020). Impact of physical and biological processes on temporal variations of the ocean carbon sink in the mid-latitude North Atlantic (2002–2016). Oceanogr 180, 102223. doi:10.1016/j.pocean.2019.102223
Martin, J. H., Knauer, G. A., Karl, D. M., and Broenkow, W. W. (1987). Vertex: carbon cycling in the Northeast pacific. Deep-Sea Res. 34, 267–285. doi:10.1016/0198-0149(87)90086-0
Martin, P., Allen, J. T., Cooper, M. J., Johns, D. G., Lampitt, R. S., Sanders, R., et al. (2010). Sedimentation of acantharian cysts in the Iceland Basin: strontium as a ballast for deep ocean particle flux, and implications for acantharian reproductive strategies. Limnol. Oceanogr. 55, 604–614. doi:10.4319/lo.2010.55.2.0604
Matul, A., and Mohan, R. (2017). Distribution of polycystine radiolarians in bottom surface sediments and its relation to summer sea temperature in the high-latitude North Atlantic. Front. Mar. Sci. 4, 330. doi:10.3389/fmars.2017.00330
Nelson, N. B., Siegel, D. A., Carlson, C. A., and Swan, C. M. (2010). Tracing global biogeochemical cycles and meridional overturning circulation using chromophoric dissolved organic matter. Geophys. Res. Lett. 37, 42325. doi:10.1029/2009GL042325
Newton, P. P., Lampitt, R. S., Jickells, T. D., King, P., and Boutle, C. (1994). Temporal and spatial variability of biogenic particles fluxes during the JGOFS northeast Atlantic process studies at 47°N, 20°W. Deep-Sea Res. 41, 1617–1642. doi:10.1016/0967-0637(94)90065-5
Pabortsava, K., Lampitt, R. S., Benson, J., Crowe, C., McLachlan, R., Le Moigne, F. A. C., et al. (2017). Carbon sequestration in the deep Atlantic enhanced by Saharan dust. Nat. Geosci. 10, 189–194. doi:10.1038/ngeo2899
Pace, M. L., Knauer, G. A., Karl, D. M., and Martin, J. H. (1987). Primary production, new production and vertical flux in the Eastern Pacific-Ocean. Nature 325, 803–804. doi:10.1038/325803a0
Passow, U., and Carlson, C. A. (2012). The biological pump in a high CO<sub>2 world. Mar. Ecol. Prog. Ser. 470, 249–271. doi:10.3354/meps09985
Ragueneau, O., Gallinari, M., Corrin, L., Grandel, S., Hall, P., Hauvespre, A., et al. (2001). The benthic silica cycle in the North-East Atlantic. Annual mass balance, seasonality, and importance of non-steady-state processes for the early diagenesis of biogenic opal in deep-sea sediments. Prog. Oceanogr. 50, 171–200. doi:10.1016/s0079-6611(01)00053-2
Ramondenc, S., Lampitt, R. S., Norrbin, M. F., Belcher, A., and Iversen, M. H. (2023). Influence of two counter-rotating eddies on upper North Atlantic Ocean biogeochemistry. In Press.
Reid, P. C., Colebrook, J. M., Matthews, J. B. L., and Aiken, J. (2003). The continuous plankton recorder: concepts and history, from plankton indicator to undulating recorders. Prog. Oceanogr. 58, 117–173. doi:10.1016/j.pocean.2003.08.002
Robinson, J., Popova, E. E., YoolSrokosz, A. .M., Lampitt, R. S., and Blundell, J. R. (2014). How deep is deep enough? Ocean iron fertilization and carbon sequestration in the southern ocean. Geophys. Res. Lett. 41, 2489–2495. doi:10.1002/2013GL058799
Saba, G. K., Burd, A. B., Dunne, J. P., Hernández-León, S., Martin, A. H., Rose, K. A., et al. (2021). Toward a better understanding of fish-based contribution to ocean carbon flux. Limnol. Oceanogr. 66, 1639–1664. doi:10.1002/lno.11709
Salmon, K. H., Anand, P., Sexton, P. F., and Conte, M. (2015). Upper ocean mixing controls the seasonality of planktonic foraminifer fluxes and associated strength of the carbonate pump in the oligotrophic North Atlantic. Biogeosciences 12, 223–235. doi:10.5194/bg-12-223-2015
Salter, I., Lampitt, R. S., Sanders, R., Poulton, A., Kemp, A. E. S., Boorman, B., et al. (2007). Estimating carbon, silica and diatom export from a naturally fertilised phytoplankton bloom in the southern ocean using PELAGRA: A novel drifting sediment trap. Deep Sea Res. Part II Top. Stud. Oceanogr. 54, 2233–2259. doi:10.1016/j.dsr2.2007.06.008
Salter, I., Schiebel, R., Ziveri, P., Movellan, A., Lampitt, R., and Wolff, G. A. (2014). Carbonate counter pump stimulated by natural iron fertilization in the Polar Frontal Zone. Nat. Geosci. 7, 885–889. doi:10.1038/ngeo2285
Scarrott, R. G., Cawkwell, F., Jessopp, M., Cusack, C., O’Rourke, E., and de Bie, C. A. J. M. (2021). Ocean-surface heterogeneity mapping (OHMA) to identify regions of change. Remote Sens. 13, 1283. doi:10.3390/rs13071283
Schiebel, R., and Movellan, A. (2012). First-order estimate of the planktic foraminifer biomass in the modern ocean. Earth Syst. Sci. Data 4, 75–89. doi:10.5194/essd-4-75-2012
Siegel, D. A., Buesseler, K. O., Doney, S. C., Sailley, S. F., Behrenfeld, M. J., and Boyd, P. W. (2014). Global assessment of ocean carbon export by combining satellite observations and food-web models. Glob. Biogeochem. Cycles 28, 181–196. doi:10.1002/2013GB004743
Siegel, D. A., and Deuser, W. G. (1997). Trajectories of sinking particles in the sargasso sea: modeling of statistical funnels above deep-ocean sediment traps. Deep Sea Res. I 44, 1519–1541. doi:10.1016/s0967-0637(97)00028-9
Siegel, D. A., DeVries, T., Doney, S. C., and Bel, T. (2021). Assessing the sequestration time scales of some ocean-based carbon dioxide reduction strategies. Res. Lett. 16, 104003. doi:10.1088/1748-9326/ac0be0
Silsbe, G. M., Behrenfeld, M. J., Halsey, K. H., Milligan, A. J., and Westberry, T. K. (2016). The CAFE model: A net production model for Global Ocean phytoplankton. Glob. Biogeochem. Cycles 30, 1756–1777. doi:10.1002/2016GB005521
Storz, D., Schulz, H., Waniek, J. J., Schulz-Bull, D., and Kucera, M. (2009). Seasonal and interannual variability of the planktic foraminiferal flux in the vicinity of the Azores Current. Deep Sea Res. Part I Oceanogr. Res. Pap. 56, 107–124. doi:10.1016/j.dsr.2008.08.009
Stukel, M. R., Biard, T., Krause, J., and Ohman, M. D. (2018). Large Phaeodaria in the twilight zone: their role in the carbon cycle. Limnol. Oceanogr. 63, 2579–2594. doi:10.1002/lno.10961
Subhas, A. V., Dong, S., Naviaux, J. D., Rollins, N. E., Ziveri, P., Gray, W., et al. (2022). Shallow calcium carbonate cycling in the North pacific ocean. Glob. Biogeochem. Cycles 36, e2022GB007388. doi:10.1029/2022GB007388
Waite, A. M., Stemmann, L., Guidi, L., Calil, P. H. R., Hogg, A. M. C., Feng, M., et al. (2016). The wineglass effect shapes particle export to the deep ocean in mesoscale eddies. Geophys. Res. Lett. 43, 9791–9800. doi:10.1002/2015GL066463
Wang, L., Gula, J., Collin, J., and Mémery, L. (2022). Effects of mesoscale dynamics on the path of fast-sinking particles to the deep ocean: A modeling study. J. Geophys. Res. Oceans 127, e2022JC018799. doi:10.1029/2022JC018799
Waniek, J. J., Prien, R., and Koeve, W. (2000). Trajectories of sinking particles and the catchment areas above sediment traps in the northeast Atlantic. J. Mar. Res. 58, 983–1006. doi:10.1357/002224000763485773
Waniek, J. J., Schulz-Bull, D. E., Kuss, J., and Blanz, T. (2005). Long time series of deep water particle flux in three biogeochemical provinces of the northeast Atlantic. J. Mar. Syst. 56, 391–415. doi:10.1016/j.jmarsys.2005.03.001
Wynn-Edwards, C. A., Shadwick, E. H., Davies, D. M., Bray, S. G., Jansen, P., Trinh, R., et al. (2020). Particle fluxes at the Australian southern ocean time series (SOTS) achieve organic carbon sequestration at rates close to the global median, are dominated by biogenic carbonates, and show No temporal trends over 20-years. Front. Earth Sci. 8, 329. doi:10.3389/feart.2020.00329
Keywords: carbon flux, Northeast Atlantic, sequestration, Rhizaria, Radiolaria, Foraminifera, biological carbon pump
Citation: Lampitt RS, Briggs N, Cael BB, Espinola B, Hélaouët P, Henson SA, Norrbin F, Pebody CA and Smeed D (2023) Deep ocean particle flux in the Northeast Atlantic over the past 30 years: carbon sequestration is controlled by ecosystem structure in the upper ocean. Front. Earth Sci. 11:1176196. doi: 10.3389/feart.2023.1176196
Received: 28 February 2023; Accepted: 20 September 2023;
Published: 16 October 2023.
Edited by:
Makio Honda, Japan Agency for Marine-Earth Science and Technology (JAMSTEC), JapanReviewed by:
Takahito Ikenoue, Japan Agency for Marine-Earth Science and Technology (JAMSTEC), JapanJonaotaro Onodera, Japan Agency for Marine-Earth Science and Technology (JAMSTEC), Japan
Copyright © 2023 Lampitt, Briggs, Cael, Espinola, Hélaouët, Henson, Norrbin, Pebody and Smeed. This is an open-access article distributed under the terms of the Creative Commons Attribution License (CC BY). The use, distribution or reproduction in other forums is permitted, provided the original author(s) and the copyright owner(s) are credited and that the original publication in this journal is cited, in accordance with accepted academic practice. No use, distribution or reproduction is permitted which does not comply with these terms.
*Correspondence: R. S. Lampitt, r.lampitt@noc.ac.uk
†Present address: B. Espinola, Finnish Meteorological Institute, Marine Research, Helsinki, Finland
 R. S. Lampitt
 N. Briggs
 B. B. Cael
 B. Espinola
 P. Hélaouët
 S. A. Henson
 F. Norrbin
 C. A. Pebody
 D. Smeed