Study on the stability of high and steep slopes under deep bench blasting vibration in open-pit mines
- 1School of Architectural Engineering, Guizhou University for Nationalities, Guiyang, China
- 2Guizhou Energy Industry Research Institute Co, Ltd, Guiyang, China
- 3School of Safety Engineering, China University of Mining and Technology, Xuzhou, China
In order to study the stability of the high and steep slope of an open-pit mine under deep bench blasting vibration, a mine in Inner Mongolia is taken as the engineering background, and the mechanical parameters of rock samples were determined based on uniaxial and triaxial instruments. The stability of the high and steep slope of the open-pit mine under static and dynamic loads was analyzed by using field vibration monitoring and numerical simulation methods. The results show that the vibration range of the vibration wave is -1.25–1.25 cm/s, and the vibration wave shows a gradual attenuation trend. The Sadovsky regression equation was used to analyze and fit the monitoring data and the corresponding regression equations in each direction were obtained. Under static action, the safety factor of the high and steep slope is 1.20, and the displacement of the sliding zone passing through the slope is small, so the slope stability is good. Under the action of dynamic blasting load, the overall displacement of the slope is small, and the change of displacement decreases with the decrease of the vibration wave.
1 Introduction
Metal mineral resources are the basis for human survival and development. With the continuous progress of the industry, more and more metal minerals have been mined, among which metal open-pit mining accounts for a large proportion (Song et al., 2021a). Taking China as an example, the proportion of open-pit mining in metal mining is as high as 90% (Yang et al., 2011; Wang et al., 2013; Lv et al., 2019). With the continuous development and utilization of shallow surface resources, deep open-pit mining has become the trend of open-pit mining development in the world. In the process of deep mining, with the increase of mining depth, the safety and stability of the slope are getting worse and worse. However, for deep-pit mines, increasing slope angle and implementing fine blasting are important means to reduce mining costs and improve economic benefits. Blasting production has been used in mine production as a relatively mature production method and a relatively wide range of production processes. However, the vibration effect generated by the blasting operation has a certain impact on the stability of the slope. Therefore, it is of great theoretical and practical significance to carry out research on the stability of high and steep slopes in deep concave open-pit mines under the action of blasting vibration to prevent and control geological disasters caused by high slopes and improve the economic benefits of mines (Du et al., 2020; Song et al., 2021b).
In recent years, scholars at home and abroad have conducted numerous studies on slope stability under the action of blasting. Chong et al. (2018) established a numerical model of the slope with a smooth step using FLAC3D, analyzed the vibration response law of the slope under the action of blasting vibration, and formulated the safety threshold of blasting vibration. Ming et al. (2012) established a slope vibration model under the action of blasting seismic waves and obtained the slope dynamic response under the action of different blasting frequencies using modal analysis and harmonic response analysis. Hoang et al. (2021) studied three intelligent hybrid models based on different nature-inspired optimization algorithms and deep neural networks to predict GV and proposed a deep neural network model based on deep learning techniques. Ke et al. (2021) proposed an intelligent prediction model for GVI based on the hybridization of self-encoder neural network and support vector machine regression (SVR). A total of nine input variables were used to estimate GVI: borehole diameter, step height, borehole length, batching, spacing, hardness factor, powder factor, the maximum explosive charge per extension, and monitoring distance. Sun et al. (2021) proposed a Bayesian method for predicting blast damage on highly rocky slopes using vibration and acoustic data and established the relationship between blast damage and intrinsic frequency of rock mass for the first time. Xuan-Nam et al. (2021) proposed a cuckoo search optimization model based on an artificial neural network based on 118 blasting events collected from a quarry in Vietnam. Bazzi et al. (2020) investigated the effect of blasting vibration on slope stability using the finite element analysis method. Pit slopes containing faults were examined under the action of seismic loads caused by successive blasts of different intensities. Wu et al. (2020) took the high and steep slope of the Daye iron ore mine as an example and used shaking table tests, the limit equilibrium theory, and the least squares method to better evaluate the stability of slopes under repeated blasting vibrations in fracture zones. Based on the limit equilibrium theory and shaking table test data, the stability of slopes under different. Yin et al. (2018) analyzed the energy distribution of blast vibration signals by peak mass velocity (PPV), frequency characteristics, and time-frequency processing method using different rock blast vibration signals monitored at a blasting site.
In the past, domestic and foreign scholars used theoretical research, physical test, numerical simulation, mathematical model, and other research methods to study the slope stability under blasting vibration, but there are few studies on the stability of high and steep slopes in open-pit mines under blasting. With the development of blasting technology and the increase in mining depth, most mines enter the deep mining stage. The exposed area of the slope becomes larger, the slope stability is poor, and the blasting vibration plays a major role in the slope instability. Therefore, the analysis of the influence of deep bench blasting vibration on the stability of high and steep slopes in open-pit mines has become an urgent problem to be solved in deep mining blasting. Taking the high and steep slope of a mine in Inner Mongolia as the engineering background, this work studies the stability of the high and steep slope under blasting vibration by using the methods of physical test, field monitoring, and numerical simulation, to ensure the safe production efficiency of the mine and the life and property safety of the staff in the quarry and provide some reference for similar projects.
2 Project overview
This high steep-sided metal open-pit mine is located in the central region of Inner Mongolia and is a Cenozoic Tertiary outcrop located at the northern edge of the Inner Mongolia geotechnical axis. The strata in the area are strongly wrinkled and metamorphosed and fractures are developed. The type of engineering geological exploration in the mine area is type II, category II: medium engineering geological conditions, with hard and semi-hard metamorphic rocks as the main block rock deposits. The topography and geomorphology are simple, the terrain is conducive to natural drainage, and the lithology of the strata is relatively single. There are no large tectonic fracture zones in the mine area, the fractures are filled by fault breccias, and the contact fracture zones and weathering zones are not developed, so the geological structure is simple. The rock structure is mainly blocky, with high rock strength and an open mining area, and the stability of the slope becomes more complicated with the increase of mining depth. The mine’s east quarry is nearly elliptical in shape, with an east-west length of 1.43 km and a width of 1.06 km, covering an area of 3.213 km2. The east quarry has been mined for more than 50 years, with an overall slope of 43°–39°, a design end slope depth of 1,230 m, and a final average slope height of 372 m. The geographic location and geomorphology of the mine are shown in Figure 1.
3 Determination of mechanical parameters
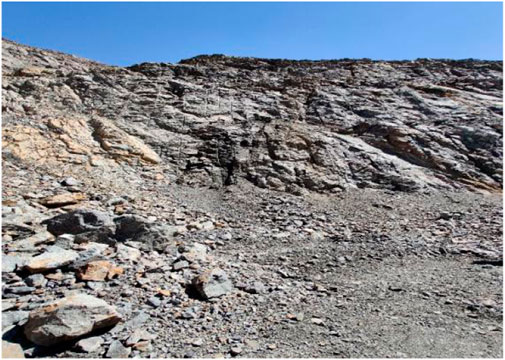
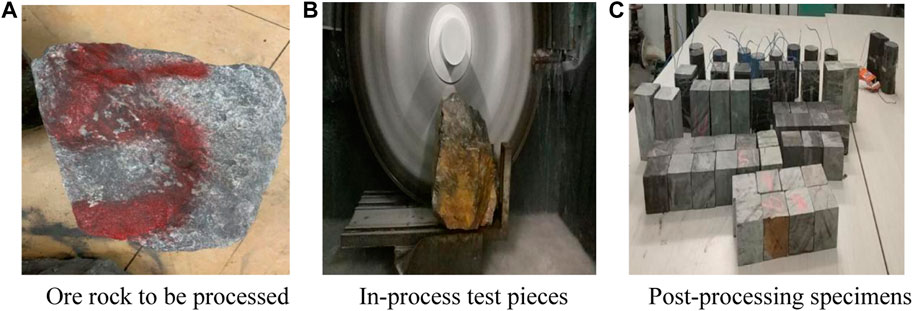
The rock and ore specimens were collected from the field and processed into suitable specimens at a later stage, mainly for rock gravity density, uniaxial compression deformation, tensile strength, rock shear resistance at variable angles, and rock structural surface straight shear tests. The field collection area is reasonably distributed in all levels of steps as far as possible under safety conditions. The collected rock samples include slate, dolomite, and iron ore, in addition to some weak structural interview samples. Pictures of the field collection are shown in Figure 2. The rock samples collected from the mine site were processed to meet the test requirements by using a TY-450 sawing machine with high processing accuracy and other types of stone grinding machines according to the relevant regulations to meet the experimental requirements. Figure 3 1) shows the large sample of mineral rock to be processed and Figure 3 2) shows the sample under processing. The specimen specifications are as follows: uniaxial compressive and bi-directional strain test: 50mm×50mm×100mm; triaxial shear test: Φ50×100. No artificial fissures were allowed to appear during the specimen preparation. According to the accuracy of specimen production, the error of specimen edge length should be less than 0.03 cm, and the parallel error of the upper and lower opposing surfaces of the specimen must be less than 0.05 mm; the adjacent two sides of the specimen should be less than 0.25° perpendicular to each other; the same is true for the perpendicularity of the specimen end face and axis, and the processing accuracy of all specimens reached the specified standard.
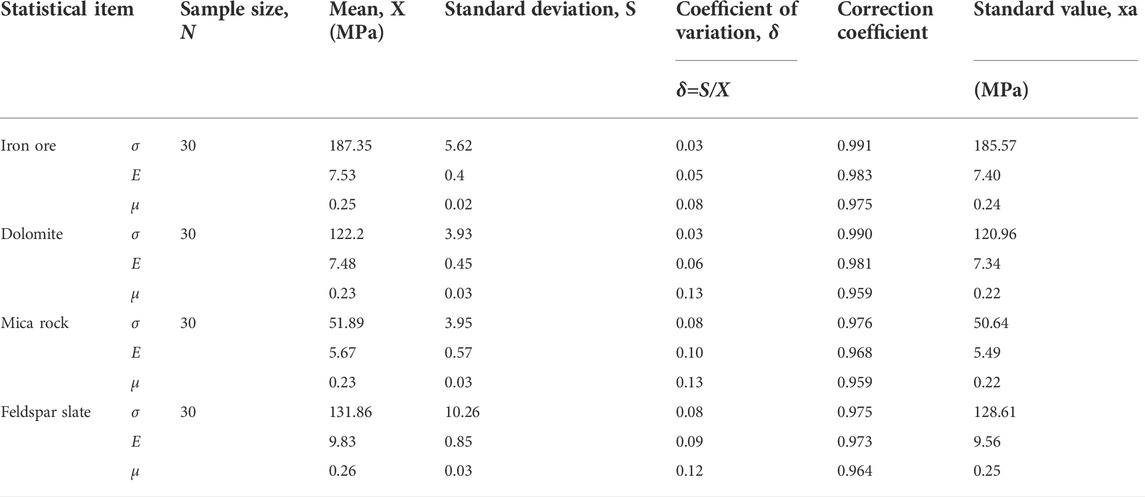
The density determination test focused on determining the apparent density of the ore and rock and the sample used was the sample for determining the uniaxial shear strength, which was carried out before the determination of uniaxial shear strength and its deformation parameters (Sugiyama et al., 2021; Zingano et al., 2021; Anderson et al., 2022). The results of the measurements are presented in Table 1, and according to the test results, the density of iron ore is 3.64 g/cm3, the density of dolomite is 2.93 g/cm3, the density of mica rock is 2.97 g/cm3, and the density of feldspar−slate is 2.87 g/cm3.
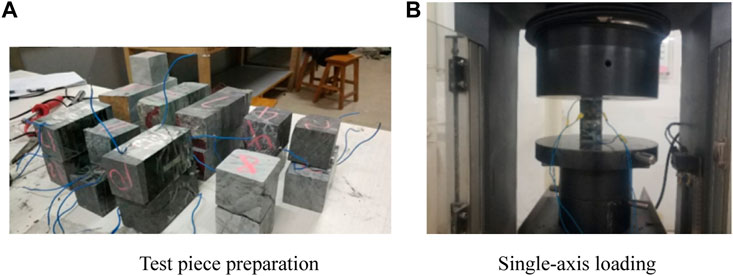
The uniaxial compressive strength experiment uses the apparatus including a WANCE-106 type electronic universal testing machine and digital static strain gauge. The principle of determination is by the ratio of the maximum load to the loaded area when the specimen is compressed by longitudinal load only and damage occurs without restriction around; the value is numerically made the uniaxial compressive strength of the specimen. Longitudinal and transverse resistance strain gauges were applied to each specimen, as shown in Figure 4A. During the experiment, the loading speed was set to 0.5 MPa/s, and the maximum load from the beginning of the experiment to the time of damage to the specimen was recorded, as shown in Figure 4B. The experimental results are shown in Table 2. According to the uniaxial compressive strength test, the uniaxial compressive strength, elastic modulus, and Poisson’s ratio of iron ore were 185.57 MPa, 7.4×10⁴ MPa, and 0.24, respectively; the uniaxial compressive strength, elastic modulus, and Poisson’s ratio of dolomite were 120.96 MPa, 7.34×10⁴ MPa, and 0.22, respectively. The uniaxial compressive strength, elastic modulus, and Poisson’s ratio of mica rock were 50.64 MPa, 5.49×10⁴ MPa, and 0.22, respectively; the uniaxial compressive strength, elastic modulus, and Poisson’s ratio of feldspar−slate were 128.61 MPa, 9.56×10⁴ MPa, and 0.25, respectively.
In order to make the test conditions close to the three-way stress state that the rock is subjected to, the equipment used in this experiment is a triaxial press. The specimens were subjected to a lateral envelope pressure of σ2 = σ3, and the triaxial press was loaded at a rate of 0.5–1.0 MPa/s loading σ1 until complete shear failure of the specimens occurred. The shear damage of the rock specimen was consistent with the Moore strength criterion, and the angle between the damaged section and the maximum principal stress plane of the specimen was (45-φ/2)°. In this experiment, the SAJS-2000 rock triaxial straight shear testing machine was used for the test and its experimental procedure is shown in Figure 5, and the triaxial shear strength results are shown in Table 3. According to the rock triaxial shear test, the cohesion and internal friction angle of dolomite were 17.61 MPa and 47.24°, respectively; the cohesion and internal friction angle of the feldspar−slate were 16.98 MPa and 44.31°, respectively.
4 On-site blast vibration monitoring
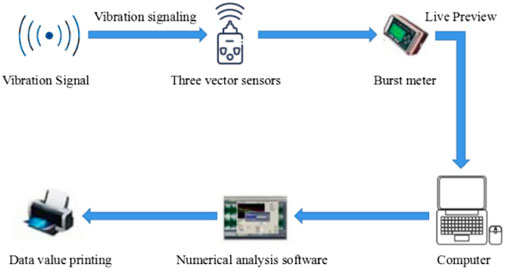
The blast vibration monitoring system is generally composed as shown in Figure 6, in which the most critical is the placement and selection of the pickups and vibrometers. The two together determine the accuracy of blasting seismic wave pickup and the reliability of the pickup date. The TC-4850 blasting monitoring system of Chengdu Zhongke measurement and control is used for this blasting slope monitoring (Afanasev and Makhmudov, 2021; Leng et al., 2021). The device is compact in size and easy to carry. With versatility, it can be matched with velocity and acceleration sensors to complete different testing requirements. The instrument has an adaptive range and can preview the value, frequency, and waveform information immediately after sampling, without the support of an external computer.
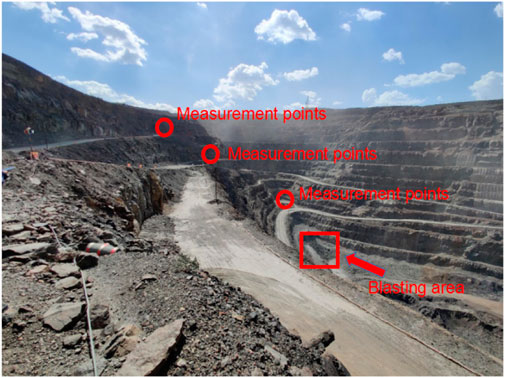
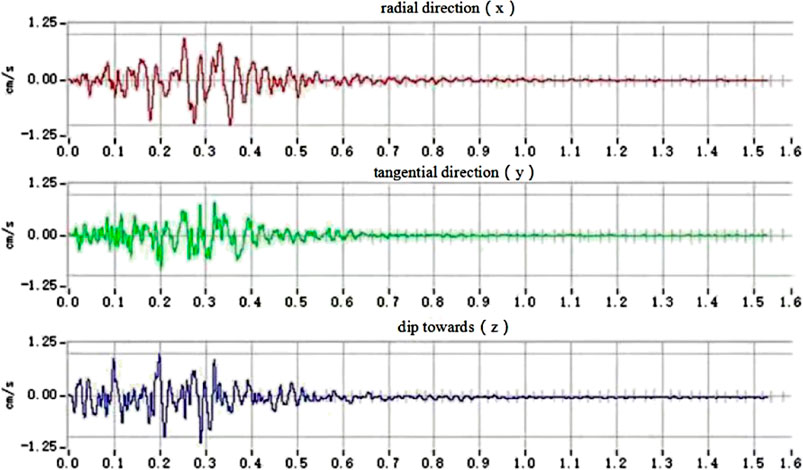
In the open-pit mine blasting monitoring, the monitoring results and the results processed by the attenuation formula and other analytical applications have a significant impact on the selection of measurement points. Based on the geological engineering of the slope of the open pit, the selection of measurement points is based on the following principles: in general, blast vibration monitoring points are to be arranged in the back of the measured blast area, to determine and evaluate the impact of blast vibration on the slope; according to the location of the blast area, selected different step heights and the same engineering geological state for the deployment of points, different step heights and geological conditions on the propagation of blast vibration waves also have a great impact. In the range near the blast area that is blasting seismic effects of the range of more measurement points, to determine the range of blasting vibration attenuation and propagation law; blasting measurement points are generally chosen to be laid out in a corresponding representative point and roughly linear with the blast center. The distance and location of the measurement points from the blast area are measured and calibrated with two southern industrial GPS data collectors GIStar710, and the blast vibration measurement points are shown in Figure 7. The blasting vibration monitoring of the high steep slope open-pit mine lasted for nearly 7 months, during which vibration monitoring was conducted for pre-cracking blasting and step blasting against the boundary, respectively. Before each blasting ban, the blasting area was surveyed, the location of the measurement points was set, the required parameters of the vibration measurement instrument were set, the mode was set to be triggered after the commissioning was completed, and the location of the measurement points was recorded. The management of the guard was obeyed, the monitoring instrument was retrieved after the blasting was completed, and the relevant data were exported in time for analysis and processing. Surface mine blasting vibration test by the sensor picks up a vibration; the recorder will be a large number of vibration data processing into a waveform time course curve with speed as the vertical axis and selected time as the horizontal axis. This curve is often called the random signal waveform of the vibration parameters. The waveform mainly reflects the blast vibration rate as the relevant information embodied, eliminating other irrelevant and redundant data, and it is used to reveal the decay law of blast vibration propagation; part of the data acquisition waveform diagram is shown in Figure 8.
Based on the regression analysis test data of slope vibration by boundary blasting, the Sadowski regression analysis was conducted on the measured vibration data using the one-dimensional linear regression method. An accurate analysis of the regression results was carried out, and the regression analysis results are shown in Table 4: K is the topographic coefficient, α is the blasting vibration decay coefficient, and r is the correlation coefficient. V is the particle vibration velocity, cm/s; Q is the maximum loading amount for one period, kg; R is the horizontal distance between the measuring point of step arrangement and the center of explosion area, m. The higher the absolute value of the correlation coefficient r is close to 1, the higher the correlation is, and it is generally considered that the value of r is highly correlated when it is greater than 0.8. The regression curve of measured vibration velocity of pre-cracking blasting is shown in Figure 9. Based on the regression analysis test data of slope vibration of step blasting, the Sadowski regression analysis of measured vibration data was carried out by using the one-dimensional linear regression method through the formula, and the accuracy analysis was carried out by using the regression results. Regression analysis results are shown in Table 4, and the regression curve of measured vibration speed of pre-cracking blasting is shown in Figure 9. Regression analysis results are shown in Table 5, and the regression curves of the measured vibration velocity of pre-cracking blasting are shown in Figure 10. The correlation coefficient R is a close degree of evaluating the linear relationship, which measures the similarity between the regression analysis value and the real value. The value of R is greater than 0.8 and the closer it is to 1, the higher the degree of linear correlation. Combined with Figures 9–10 and tables 4–5, the correlation coefficient of velocity fitting results in three directions is greater than 0.8, which indicates that the vibration propagation formula has good applicability to the attenuation law of slope vibration under geological conditions. With the increase of blasting center distance, the vibration velocity of slope particles decreases continuously, and the influence of blasting center distance on blasting vibration velocity is much greater than that of elevation, indicating that the vibration measurement results have a certain reference value.
5 Numerical simulations
5.1 Strength discounting method and numerical modeling
The slope strength discount method refers to the slope with discounted slope anti-slip force that is shear strength just less than or equal to the shear force, and its slope reaches the critical damage state. The safety factor is the ratio of the discounted shear strength to the original shear strength at the critical damage strength. The calculation guideline of the strength reduction method is to apply Eqs. 1,2 to the slope rock strength: the bond force c and the friction angle are adjusted accordingly so that the slope model shows critical damage, and the safety factor Fs, which is the discount factor of the slope, is obtained at this time.
In the formula, c is the bonding force, ϕ is the frictional force,
In the calculation of strength reduction, there are two ways to judge the slope instability caused by strength reduction. One is that the plastic zone of the slope model is penetrated, and the other is that the calculation solution of the model is not convergent. 1) The coalescence of the plastic zone: with the decrease of slope strength, its shear capacity is continuously destroyed. Then the shear strain is produced and the plastic failure occurs. The shear strain extends from one free surface to another free surface until it is fully communicated, that is, the plastic zone is penetrating. At this time, it can be determined that the slope has been unstable. 2) The non-convergence of the solution: when the slope failure occurs, the instability part changes from static to dynamic, and the landslide also appears as unlimited displacement. In the numerical simulation, the judgment based on this phenomenon is that the ratio of displacement to the strain of the plastic failure surface with sliding displacement is not constant. At this time, the calculation program cannot find a solution that satisfies the equilibrium convergence for the static and stress−strain criteria at the same time and the slope failure is determined at this time. In the case of the natural slope only considering the self-weight effect, the safety system of the slope is calculated to find out the possible slip surface when the slope is damaged. At the same time, it also provides a basis for analyzing the influence of vibration on the slope under the following blasting dynamic loading conditions.
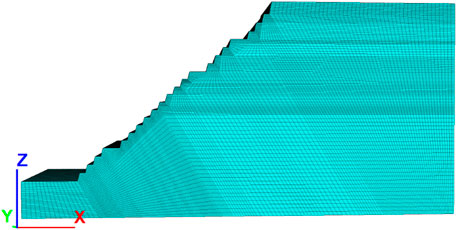
Numerical analysis software FLAC3D will be used to model the middle part of the south gang of the slope of this open-pit mine. The measured slope height of the south gang part of the slope is 372 m, and the final slope angle is 45°–47°. Most of the sloping rock is composed of slate, with some dolomite outcrops. The rock quality is good and there is no significant influence on the structural weakness. After years of mining, nearly 21 steps have been formed in the middle of the north gang, including three sweeping platforms, from the bottom to the upper boundary of the mine, in order of 1348 m horizontal sweeping platform, 1488 m horizontal sweeping platform, and 1544 m sweeping platform. The width of the sweeping platform is 30m, the width of the safety platform is 10 m, and the side slope angle is 75°; in the stage from 1348 m level to 1544 m level, the safety platform height is changed to 14 m and the side slope angle is still 75°; in the stage from 1544 m level to 1544 m level at the top of the slope, the platform height is 14 m and the side slope angle is 70°. The modeling uses AutoCAD to draw the slope model and then uses Rhino modeling software for 3D extrusion and mesh division. Based on the abovementioned information, the numerical analysis model is established. The Mohr−Coulomb model is selected for this slope model. The boundary constraints of the model are set as follows: along the X-direction, the left and right boundaries are constrained, and displacement is allowed in the remaining two directions; along the Y-direction, the front and rear boundaries are constrained, and displacement is allowed in the remaining directions; along the Z-direction, displacement is restricted at the bottom of the model, and free displacement is allowed at the top of the slope. The final slope model is 800 m long, 200 m wide, and 372 m high, as shown in Figure 11.
5.2 Analysis of results
5.2.1 Static stability analysis of high and steep slopes
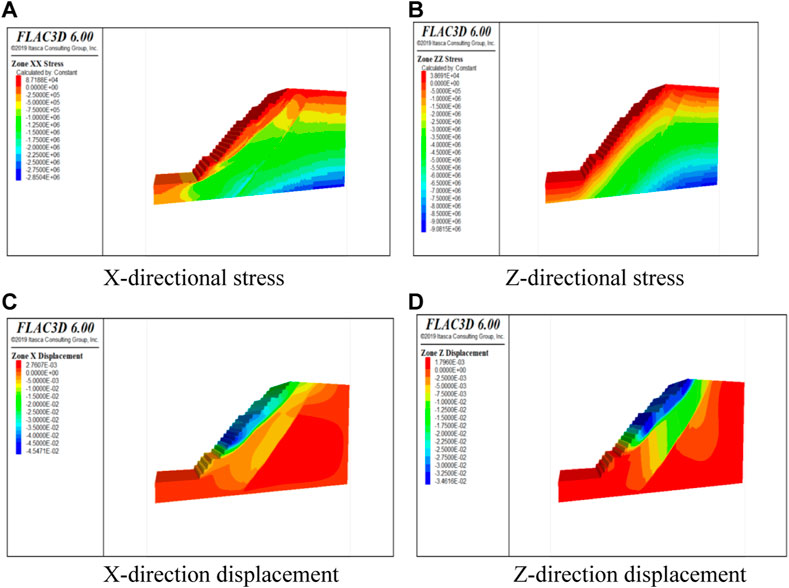
The destabilization of the high and steep slopes of the open-pit with damage phenomena such as sliding is associated with the creep rupture result of the shear slip zone formed by the shear force on the rock body with time steps, which in turn leads to the damage of the potential breakage zone with reduced strength unable to support the vertical gravity of its upper rock body. The slope stress and displacement clouds of this open-pit mine under self-weight conditions are shown in Figure 12. According to Figures 12 1) (b), it can be seen that the stress of the high steep slope under the influence of its gravity only appears at the maximum value at the foot of the slope, where the maximum horizontal stress is 8.7188e+04 MPa and the maximum vertical stress is 3.8691e+04 M Pa. According to the theoretical analysis, the gravity load calculation formula, where it is constant for the homogeneous continuous rock mass, the gravity load is proportional to the rock mass. Therefore, the gravity load is proportional to the height h of the rock mass, which is most influenced by the gravity load of the overlying rock layer, and the largest part of the high and steep slope is also pressurized at the foot of the slope. In the analysis of the safety of the numerically simulated slope, the slope displacement can be used as a parametric index to judge the stability of the slope. The magnitude of displacement at each node of the slope can measure whether the slope has been damaged there. As shown in Figures 12C, D, the horizontal displacement cloud and vertical displacement cloud of the high and steep slope under self-weight, the largest negative displacement appears at the upper step of the bottom clearing platform, and the maximum displacement is -4.5471e-02 m. This is because the simulated amount of rock at this place is dolomite, whose mechanical strength is lower than the rest of the slate rock on the slope; the maximum horizontal positive displacement of the slope appears inside the slope with the value of 2.7607e-03 m, which is due to the gravitational settlement of the overlying rock slope. By observing the vertical displacement cloud, it can be concluded that the maximum negative displacement appears at the excavation of the slope, and the displacement located at the deep part of the slope is a small positive value, which is due to the settlement effect of the overlying rock on the slope under the self-weight of the slope. The result is consistent with the objective settlement law.
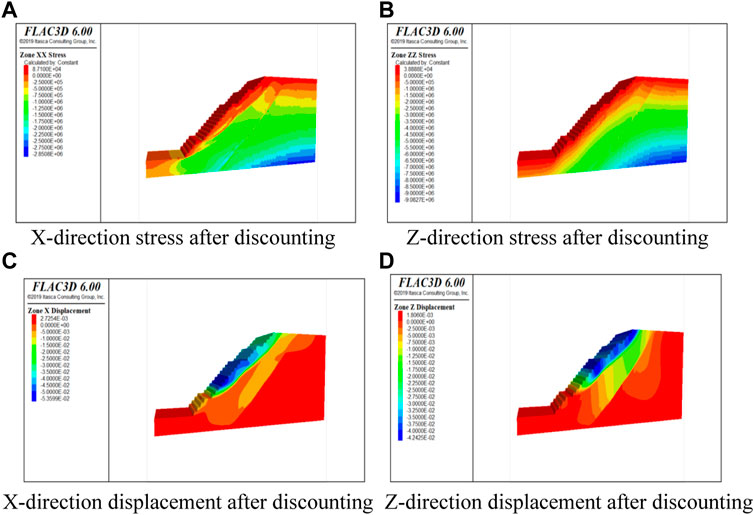
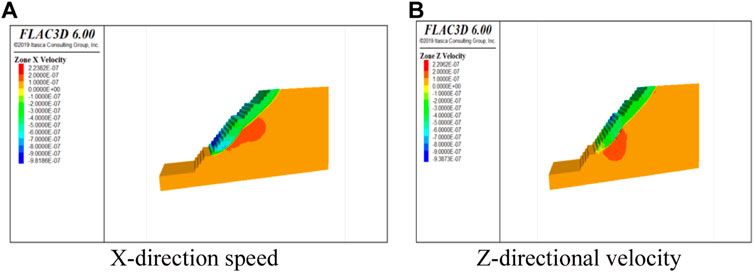
In the actual project, it is necessary to consider that the slope deformation of the open pit is mainly shear deformation and there is tensile damage, so the tensile strength should be discounted accordingly when discounting. In this study, the strength reduction factor is 1.2, and the stress and displacement clouds after the corresponding strength reduction are shown in Figure 13. The stress of the slope at the bottom is the maximum, the maximum horizontal stress is 8.7100e+04 MPa, and the maximum vertical stress is 3.8888e+04 MPa. The maximum stress appears on the step of the slope, which is in line with the theoretical logic. The maximum displacement of the slope occurs at the step appearing at the upper part of the bottom clearing platform, which is in line with the objective law that the dolomite strength conforms to the slate strength. In the horizontal displacement diagram, the side slope steps along the top of the steps to the weak structural surface have appeared as displacement partition interface, that is, there is an obvious abrupt change in displacement. In the vertical displacement map, there is also an obvious sliding fault surface, and there is an abrupt change of displacement. Therefore, it can be concluded that the sliding damage has occurred at this time. In addition to the stress displacement cloud, the velocity cloud can also be used as a way to determine whether the slope is unstable or not. The velocity cloud is similar to the displacement cloud as shown in Figure 14. A continuous velocity equivalence zone can be seen in the velocity cloud, and the position of the potential sliding surface is consistent with the position of the sliding surface in the displacement cloud, which is verified.
The plastic zone of the potential sliding surface is the standard of instability. When the generalized plastic strain or equivalent plastic strain passes through the top of the slope, it is used as a sign of slope failure. According to the change and distribution of some physical quantities, such as the generalized shear strain in the numerical calculation domain. When the plastic region in the domain is completely connected, the judge of the slope failure degree also needs to see whether the slope body produces infinite plastic deformation and displacement. The calculation of finite element software is judged by observing the plastic strain diagram of the plastic zone.
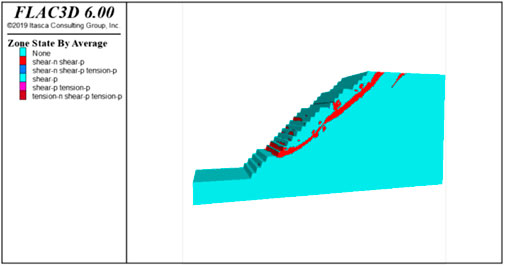
Figure 15 is the plastic zone distribution map of the slope after reduction. According to the distribution nephogram of the plastic zone, whether the failure surface is penetrated or not can be directly observed, which is also an important measure of slope failure. Combined with Figure 15 and the plastic zone penetration criterion, it can be seen that from the top free surface of the slope to the free surface of the first cleaning platform, the tensile failure occurs at the top of the slope and a continuous surface appears in the plastic zone and gradually forms a sliding surface.
5.2.2 Dynamic stability analysis of high and steep slopes
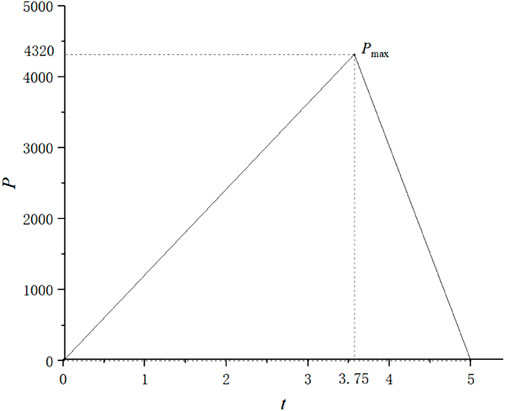
The overall propagation velocity should be attenuated when the breaking vibration load is loaded on the high and steep slope model, so it is necessary to construct damping for the slope model. For simulating the impact process in the propagation of blasting vibration in engineering reality, the commonly used triangular impulse load waveform is proposed to be used. When the triangular load is loaded, the peak value of the load needs to be determined to simulate the blast impact, and the loading action time of the dynamic load also needs to be considered. There are two nodes of this load, that is, the dynamic load value undergoes two loading parts, rising and falling. According to the literature, the formula for the peak stress Pmax of the blast dynamic load is shown as follows.
Pmax is the peak blast vibration load pressure, pa.
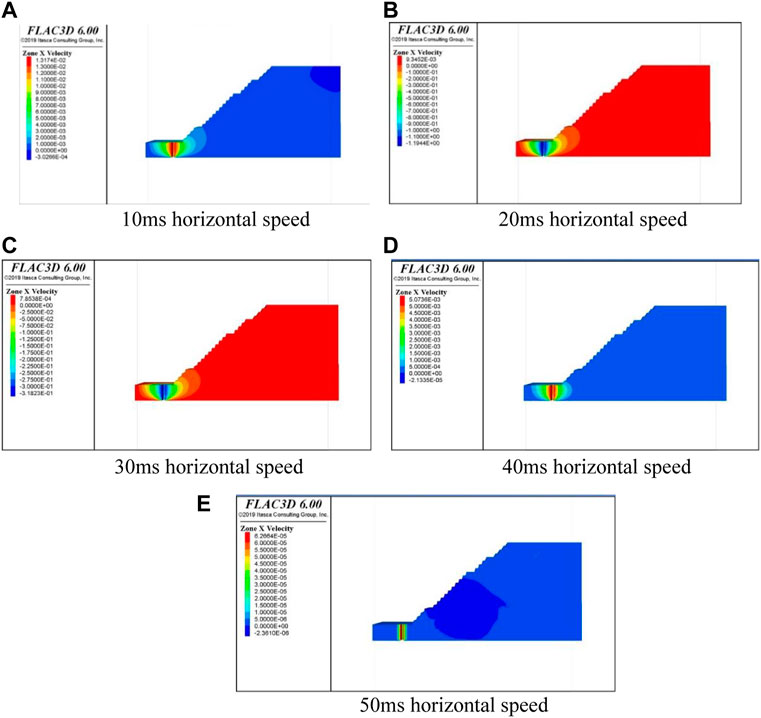
The blasting equivalent triangular load built, shown in Figure 16, is loaded on the slope after discounting; 10 ms, 20 ms, 30 ms, 40 ms, and 50 ms time steps under the model horizontal direction of the velocity are shown in Figure 17. According to Figure 17, the horizontal velocity cloud under different time intervals can be seen, the velocity in the gun hole near the center shows a regular waveform transmission, indicating that the blast wave generated by the blast is also from the center to the surrounding dispersion, and as the horizontal velocity decreases, the blast wave also decreases. Also, as the horizontal velocity decreases, the blast waveform gradually decreases. In addition, the blast waveform is irregular or asymmetric diffusion trend at the periphery of the hole, the main reasons for this phenomenon are the following two aspects: first, the model is not a symmetrical structure on the left and right of the hole, which leads to different blast responses, that is, different velocity propagation patterns; second, the blast center is different from the boundary on both sides, and the left side of the simplified gun hole near the boundary is set as a static boundary, to prevent the boundary on both of the abovementioned cases, which will cause the difference of dynamic response of the slope.
After loading the blast equivalent triangular load, the response of the slope to the vibration load under different time intervals is calculated for the dynamic load of the high and steep slope model, that is, the horizontal displacement clouds, vertical displacement clouds, and displacement increment clouds of this model at 10 ms, 20 ms, 30 ms, 40 ms, and 50 ms time intervals are studied, as shown in Figure 18. As can be seen from Figure 18, the horizontal displacement and displacement increment cloud show that the maximum value of both appears at the 1290 m level, that is, at the foot of the slope, and the vertical displacement on the cloud shows that its maximum value is easy to appear at the position of the waist and the top of the slope and coincides with the place where the slope is easy to slide after the discount of static load strength. The maximum horizontal displacement is 2.5e-7m, the maximum vertical displacement is 4.23e-8m, and the maximum displacement increment is 2.64e-7m, and the displacement changes gradually decrease with the weakening of the vibration wave.
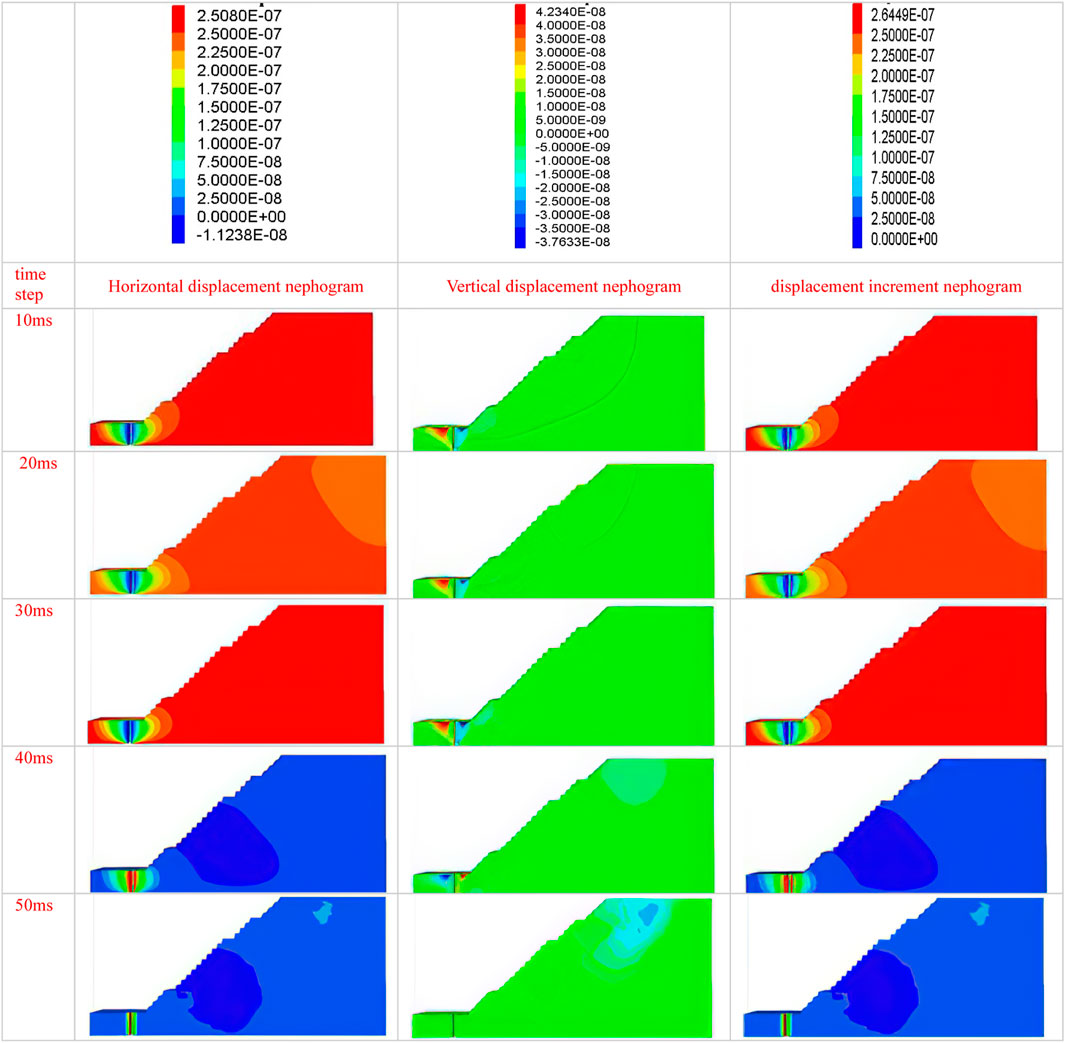
FIGURE 18. Horizontal displacement, vertical displacement, and displacement incremental cloud map 5.
6 Conclusion
In this study, the high and steep slope of an open-pit mine in Inner Mongolia is taken as the engineering research background. After the preliminary field survey, the physical and mechanical properties of the ore and rock indoor test and the long-term production blasting vibration monitoring, the monitoring data are analyzed by regression analysis. Then the results of processing and analysis are combined with FLAC3D to establish a numerical model, respectively, based on the static weight and blasting dynamic load under two kinds of slope stability studied, and the conclusions are as follows:
1) The vibration frequency of pre-splitting bench blasting in the quarry is mainly between 10 and 50 Hz, the vibration velocity of the mass point is 8–12 cm/s, and the allowable vibration velocity of pre-splitting bench blasting is 10 cm/s. The pre-splitting blasting of the quarry adopts a single-ring detonation limited charge and radial decoupling charge, and the bench blasting adopts hole-by-hole detonation. The energy of blasting seismic waves is small and the overall trend of blasting vibration velocity is still attenuation law. Pre-cracking blasting in the quarry takes a single-ring detonation charge limit and radial uncoupled charge, step blasting using hole-by-hole detonation, blasting seismic wave energy is small, so the blast vibration speed on the slope of the elevation amplification effect is not obvious, and the overall trend is still the decay law of the blast vibration speed.
2) The blast vibration decay law equations for the horizontal radial, horizontal tangential, and vertical directions of pre-cracking blasting in the east quarry are
3) A potential slip surface appears after the strength reduction of the slope, and the size of the surface and the arc of the slip band will continue to increase with time. After calculation, the safety factor of the high and steep slope is about 1.2, and the displacement of the sliding zone passing through the slope is small. Therefore, it is concluded that the slope has good stability in the current state. Under blasting triangular load, the maximum horizontal displacement of the slope is 2.5e-7m and the maximum vertical displacement is 4.23e-8m. With the attenuation of seismic waves, the displacement decreases gradually, and the overall displacement of the slope is small. Considering that the slope has high rock mechanical strength and good rock integrity, the blasting center position has a certain distance from the slope position.
Data availability statement
The raw data supporting the conclusions of this article will be made available by the authors without undue reservation.
Author contributions
HS was responsible for writing the article. SM was responsible for data statistics and visualization.
Funding
This project was funded by Qian Jiaohe KY 108, Qiankehe LH 7387, and the Geological Research Project of Guizhou Geological and Mineral Exploration and Development Bureau No.16.
Conflict of interest
Author SM was employed by Guizhou Energy Industry Research Institute Co, Ltd.
The remaining author declares that the research was conducted in the absence of any commercial or financial relationships that could be construed as a potential conflict of interest.
Publisher’s note
All claims expressed in this article are solely those of the authors and do not necessarily represent those of their affiliated organizations, or those of the publisher, the editors, and the reviewers. Any product that may be evaluated in this article, or claim that may be made by its manufacturer, is not guaranteed or endorsed by the publisher.
References
Afanasev, P. I., and Makhmudov, K. F. (2021). Assessment of the parameters of a shock wave on the wall of an explosion cavity with the refraction of a detonation wave of emulsion explosives. Appl. Sci. (Basel). 11 (9), 3976. doi:10.3390/app11093976
Anderson, I., Ma, J., Wu, X., and Stow, D. (2022). Determining reservoir intervals in the Bowland Shale using petrophysics and rock physics models[J]. Geophys. J. Int. 228 (1), 39–65. doi:10.1093/gji/ggab334
Bazzi, H., Noferesti, H., and Farhadian, H. (2020). Modelling the effect of blast-induced vibrations on the stability of a faulted mine slope[J]. J. South. Afr. Inst. Min. Metallurgy 120 (10), 591–597. doi:10.17159/2411-9717/1066/2020
Chong, M., Zhan, H., and Yao, W. (2018). Stability and safety criterion of slopes containing soft inclusions under the action of blasting vibration[J]. Blast Impact 38 (3), 563. doi:10.11883/bzycj-2016-0275
Du, H., Song, D., Chen, Z., and Guo, Z. (2020). Experimental study of the influence of structural planes on the mechanical properties of sandstone specimens under cyclic dynamic disturbance. Energy Sci. Eng. 8, 4043–4063. doi:10.1002/ese3.794
Hoang, N., Xuan-Nam, B., Quang-Hieu, T., Nguyen, D. A., Hoa, L. T. T., Le, Q. T., et al. (2021). Predicting blast-induced ground vibration in open-pit mines using different nature-inspired optimization algorithms and deep neural network. Nat. Resour. Res. 30, 4695–4717. doi:10.1007/s11053-021-09896-4
Ke, B., Nguyen, H., Bui, X., and Costache, R. (2021). Estimation of ground vibration intensity induced by mine blasting using a state-of-the-art hybrid autoencoder neural network and Support vector regression model. Nat. Resour. Res. 30 (5), 3853–3864. doi:10.1007/s11053-021-09890-w
Leng, Z., Sun, J., Lu, W., Xie, X., Jia, Y., Zhou, G., et al. (2021). Mechanism of the in-hole detonation wave interactions in dual initiation with electronic detonators in bench blasting operation. Comput. Geotechnics 129, 103873. doi:10.1016/j.compgeo.2020.103873
Lv, J., Han, Y., Nan, C., and Bai, R. (2019). Study on the overburden and surface deformation damage law of end gang compression coal shaft mining in Haidaigou open pit mine[J]. J. Min. Saf. Eng. 36 (3), 535
Ming, F., Zhu, C., and Li, D. Q. (2012). Effect of blasting vibration frequency on slope stability[J]. J. Central South Univ. Nat. Sci. Ed. 43 (11), 4439
Song, D., Liu, X., Huang, J., Zhang, Y., and Nkwenti, B. N. (2021). Seismic cumulative failure effects on a reservoir bank slope with a complex geological structure considering plastic deformation characteristics using shaking table tests. Eng. Geol. 286, 106085. doi:10.1016/j.enggeo.2021.106085
Song, D., Liu, X., Li, B., and Bastos, J. J. V. (2021). Assessing the influence of a rapid water drawdown on the seismic response characteristics of a reservoir rock slope using time-frequency analysis. Acta Geotech. 16, 1281–1302. doi:10.1007/s11440-020-01094-5
Sugiyama, Y., Homae, T., Matsumura, T., and Wakabayashi, K. (2021). Numerical study on the effect of the initiation process of cylindrical high explosives on the blast-wave behavior. Shock Waves 31 (5), 427–438. doi:10.1007/s00193-021-01021-x
Sun, P., Lu, W., Hu, H., Zhang, Y., Chen, M., and Yan, P. (2021). A bayesian approach to predict blast-induced damage of high rock slope using vibration and sonic data. Sensors 21 (7), 2473. doi:10.3390/s21072473
Wang, G., Yang, Y., Zhang, H., and Zhang, Z. X. (2013). Failure characteristics and its influencing factors of talus-derived rock mass during open-pit mining. Trans. Nonferrous Metals Soc. China 23 (2), 462–471. doi:10.1016/s1003-6326(13)62486-3
Wu, T., Zhou, C., Jiang, N., Xia, Y., Bin, Z., et al. (2020). Study on the mechanical cumulative damage model of slope fault fracture zone under the cumulative effect of blasting vibration[J]. Period. Polytechnica-Civil Eng. 64 (3), 845. doi:10.3311/PPci.16030
Xuan-Nam, B., Hoang, N., and Quang-Hieu, T. (2021). Predicting ground vibrations due to mine blasting using a novel artificial neural network-based cuckoo search optimization[J]. Nat. Resour. Res. 30 (3), 2663–2685. doi:10.1007/s11053-021-09823-7
Yang, T. H., Zhang, F. C., Yu, Q. L., Cai, M. F., and Li, H. Z. (2011). Current status and development trend of research on stability of high and steep slopes in open pit mines[J]. Geotechnics 32 (5), 1437. doi:10.16285/j.rsm.2011.05.031
Yin, Z., Hu, Z., Wei, Z., Zhao, G. M., Ma, H. F., huo, Z., et al. (2018). Assessment of blasting-induced ground vibration in an open-pit mine under different rock properties[J]. Adv. Civ. Eng. 2018 (6), 1–10. doi:10.1155/2018/4603687
Keywords: blast vibration, field monitoring, high and steep slopes, numerical simulation, stability
Citation: Su H and Ma S (2022) Study on the stability of high and steep slopes under deep bench blasting vibration in open-pit mines. Front. Earth Sci. 10:990012. doi: 10.3389/feart.2022.990012
Received: 09 July 2022; Accepted: 17 August 2022;
Published: 07 September 2022.
Edited by:
Wen Nie, Jiangxi University of Science and Technology, ChinaCopyright © 2022 Su and Ma. This is an open-access article distributed under the terms of the Creative Commons Attribution License (CC BY). The use, distribution or reproduction in other forums is permitted, provided the original author(s) and the copyright owner(s) are credited and that the original publication in this journal is cited, in accordance with accepted academic practice. No use, distribution or reproduction is permitted which does not comply with these terms.
*Correspondence: Hengyu Su, Suhygzmd@163.com
 Hengyu Su
 Shu Ma2,3
