Variability of sea salt and methanesulfonate in firn cores from northern Victoria Land, Antarctica: Their links to oceanic and atmospheric condition variability in the Ross Sea
 Seokhyun Ro1,2
  Sang-Bum Hong2*
  Joo-Hong Kim2
  Yeongcheol Han2
  Soon Do Hur2
  Jung-Ho Kang2 Songyi Kim2,3 Changkyu Lim2 Chaewon Chang2 Jangil Moon2
  Seong-Joong Kim2
  Sungmin Hong1*
- 1Department of Ocean Sciences, College of Natural Sciences, Inha University, Incheon, South Korea
- 2Korea Polar Research Institute, Incheon, South Korea
- 3Department of Science Education, Ewha Womans University, Seoul, South Korea
The potential ice core proxies of variability in oceanic and atmospheric conditions over the Ross Sea were evaluated. This study examined sea salt sodium (ss–Na+) and biogenic sulfur (methanesulfonate, MS–) records, covering 23 years between 1990 and 2012, from two firn cores drilled on the Styx Glacier plateau (SGP), northern Victoria Land, East Antarctica, to examine the potential links between those records and datasets for various climate variables. The comparison showed that the interannual variability of the ss–Na+ record is closely related to Pacific–South American mode 2 (PSA2) in the Ross Sea sector, exhibiting an increased ss–Na+ flux, owing most likely to more frequent penetration of maritime air masses from the western Ross Sea to the SGP when the winter/spring PSA2 mode becomes more pronounced. The observed MS– record revealed statistically significant positive correlations with the changes in the summertime chlorophyll a concentration in the Ross Sea polynya (RSP) and wind speed in the southern Ross Sea region. This indicates the dominant role of a combination of changes in the summertime primary productivity and wind speed over the RSP in modulating the MS– deposition flux at the SGP. These results highlight the suitability of the ss–Na+ and MS– records from the SGP as proxies for characterizing the dominant patterns of variability in oceanic and atmospheric conditions and their underlying mechanisms on interannual and longer timescales beyond the instrumental limits over the Ross Sea region.
1 Introduction
Considerable concerns have been raised regarding the understanding of changes in the modes of climate variability in the Pacific sector of the Southern Ocean, encompassing the Ross Sea, West Antarctica (WA), and the Antarctic Peninsula (AP), because these modes are closely linked to large-scale climate processes, such as the Southern Annular Mode (SAM) and El Niño Southern Oscillation (ENSO), which, in turn, could affect the Earth’s climate substantially (Mayewski et al., 2009, 2017; Fogt and Wovrosh, 2015). The main climate modes include the Amundsen Sea Low (ASL), a quasi-stationary low-pressure system within the Amundsen and Bellingshausen Seas and a major driver of the West Antarctic climate variability. The deepening of the ASL enhances the anomalous cool/dry southerlies into the Ross Sea and warm/moist northerlies into the AP and WA (Turner et al., 2013; Raphael et al., 2016). Along the West Antarctic coast, two leading modes, the Pacific South American mode 1 (PSA1) and mode 2 (PSA2), exist. The PSA1 and PSA2 patterns are defined as the second and third empirical orthogonal functions of the extra-tropical 500–hPa geopotential height (GpH) anomalies in the Southern Hemisphere (Mo, 2000; Mo and Paegle 2001; Marshall and Thompson, 2016). The two PSA modes are characterized by the anticyclone anomalies centered at ∼120° and ∼150°W in the South Pacific, with anomalous southward winds in the Ross Sea region (and northward winds in the AP and WA regions) during their positive phases, particularly in the austral winter/spring (Yuan and Martinson, 2001; Fogt et al., 2012; Turner et al., 2013). The patterns of variability and trends of these atmospheric modes have attracted growing concern because these modes could influence the areal extent of polynyas in the western Ross Sea, i.e., the Ross Sea polynya (RSP) and Terra Nova Bay polynya (TNBP) (Yang L. et al., 2018; Wenta and Cassano, 2020), where the cold and dense Antarctic bottom water (AABW) is formed, accounting for ∼30–40% of the total AABW production (Ohshima et al., 2016; Silvano et al., 2020).
Recent studies have shown that the Ross Sea sector has experienced a gradual increase in the RSP area and its occurrence time and annual-mean sea ice extent (SIE) and concentration (SIC), associated likely with the large-scale atmospheric modes, between the late 1970s and early 2010s, as revealed from satellite observation (Comiso et al., 2011; Park et al., 2018; Parkinson, 2019). On the other hand, little is known regarding the full mechanisms behind these variations and the dominant timescale of variability, partly due to the limited satellite-based observational record, large seasonal and interannual fluctuations in its record, and the presence of anthropogenic forcing to the observed changes (Fogt and Wovrosh, 2015; Li et al., 2015; Eayrs et al., 2019). Addressing this issue will require an extension of the historical records into the past beyond satellite-based records to document the natural variability in the sea ice conditions in the Ross Sea, which will help unravel the underlying mechanisms driving the observed changes.
Thus far, an increasing number of studies have reported the reconstructed records of the long-term trend and variability in the SIE in the Ross Sea region (including the RSP) from the coastal Antarctic ice cores using sea ice proxies, such as sea salt sodium (ss–Na+) and methanesulfonic acid (MSA, CH3SO3−; hereafter referred to as MS–) (Steig et al., 1998; Rhodes et al., 2009, 2012; Sinclair et al., 2014; Thomas and Abram, 2016; Mezgec et al., 2017; Severi et al., 2017; Bertler et al., 2018). Although these ice core proxy records provide valuable information on the regional pattern of changes in sea ice over the Ross Sea, only a limited number of studies have examined the association of the observed Ross Sea SIE variability and the trend with changes in the atmospheric circulation patterns over multi-decadal (Kreutz et al., 2000; Emanuelsson et al., 2018) to longer time scales (Winstrup et al., 2019; Dalaiden et al., 2021). Combining the proxy evidence of past ASL variability, these studies showed that the ASL could be the primary climate mode contributing to the SIE trends in the Ross Sea. On the other hand, apart from a link with the ASL, no attempts have been made to explore the influence of the PSA patterns on the observed sea ice variability retrieved from ice core records despite the potential impact of the PSA modes on the satellite-based SIE changes over the Ross Sea (Yuan and Li, 2008).
To reconstruct past SIE and its association with the main climate modes, the link between ice core proxy records and datasets of climate variables needs to be tested at a given location. This study examined the ss–Na+ and MS– records preserved in two shallow firn cores, spanning from 1990 to 2012, from the Styx Glacier plateau (SGP) of northern Victoria Land, located in the western Ross Sea region. These records were compared with existing satellite-based data to identify a statistical relationship between the parameters. This relationship was used to assess the suitability of ice core ss–Na+ and MS– records as proxies of the variability in oceanic and atmospheric conditions at the interannual timescale in this region.
2 Materials and methods
2.1 Field site and firn cores
The SGP (163° 41.22′E, 73° 51.10′S, and 1,623 m above the sea level) with an area of 150 km2 is located on the eastern coast, 85 km away from the Jangbogo Antarctic Research Station and 60 km away from the western coast of the Ross Sea, in northern Victoria Land, East Antarctica (Figure 1). The southerly and southwesterly winds are prevalent in this region (Udisti et al., 1999), accompanied by air masses originating from the Ross Sea (Scarchilli et al., 2011; Sinclair et al., 2012). The snow layers of the SGP are well-preserved due to a minimum influence of katabatic wind (Stenni et al., 2000) and the absence of summer melt (Udisti et al., 1998, 1999; Nyamgerel et al., 2021). The annual accumulation rates are relatively high, ranging from 130 to 226 kg m−2 yr−1 (Han et al., 2015). Therefore, this site is expected to be adequate for obtaining well-preserved high-resolution glaciochemical records. The mean annual temperature is –30.5°C, the horizontal ice flow is 0.9 m yr−1, and the estimated ice thickness is 550 m (Han et al., 2015).
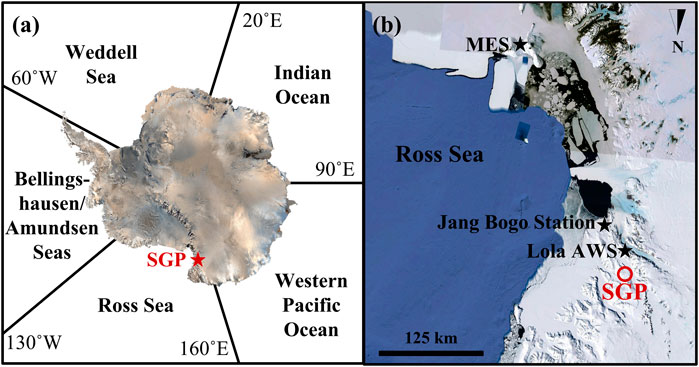
FIGURE 1. (A) Map of the Antarctic continent showing the drilling site on the Styx Glacier plateau (SGP), northern Victoria Land, East Antarctica, and five oceanic sectors across the Southern Ocean, Weddell Sea (60˚W–20˚E), Indian Ocean (20–90˚E), Western Pacific Ocean (90–160˚E), Ross Sea (160˚E–130˚W), and Amundsen–Bellingshausen Sea (130–60˚W), as defined by Parkinson (2019). (B) Enlarged scale of the Ross Sea region showing the SGP, the Korean Jang Bogo Station, an Italian automatic weather station (Lola AWS), and Mt. Erebus Saddle (MES; 77° 30.90′S, 167° 40.59′E, 1,600 m above the sea level).
In this study, two firn cores were used with lengths of 11.29 m (hereafter referred to as the Styx-A core) and 8.84 m (hereafter referred to as the Styx-B core) drilled at the SGP using a hand auger system (Geotech Co. Ltd., Japan). The distance between the two drilling sites was 174 m. The core samples were kept frozen in polyethylene bags, transported to the Korea Polar Research Institute (KOPRI), and stored in a cold room at a temperature under –15°C before the analysis. More details for this study site and the firn cores are given elsewhere (Han et al., 2015; Yang J.-W. et al., 2018; Jang et al., 2019; Nyamgerel et al., 2020, 2021).
2.2 Analytical method
The subsamples were obtained from the top 9.29 m of the Styx-A core and the whole Styx-B core, which allowed the use of the combined glaciochemical records from the two firn cores for the same period (see Section 3). It is to be noted that the top 0.5 m was discarded because of the poor core quality of the cores. All decontamination and subsampling procedures of the core were performed under a class 100 laminar airflow booth installed inside a cold room (–20°C). Briefly, the core sections were cut into 11.5–52 cm long sticks (3.2 × 3.2 cm2) with a band-saw. Then, each core stick fixed in a custom-designed Teflon holder was decontaminated mechanically by ultraclean procedures, as described by Ro et al. (2020). These involved the chiseling of three successive layers (at least ∼2 mm thick for each layer) of the firn from the outside toward the center of the stick using pre-cleaned ceramic knives (Kyocera, Japan). The uncontaminated inner part of the stick was then cut at a depth interval of 2.0–5.0 cm (mean 3.2 ± 0.7 cm) for the Styx-A core and 2.0–5.5 cm (mean 3.7 ± 0.6 cm) for the Styx-B core. Each cut section was sampled discretely in a polyethylene bag (Whirl-Pak, Nasco, United States). After all the decontamination procedures were performed, 271 and 197 subsamples were obtained for the Styx-A and -B cores, respectively.
The samples were melted at room temperature and immediately aliquoted for subsequent analyses of the major ions and stable water isotopes. The ionic species were analyzed simultaneously using a two-channel ion chromatography (IC) system that combined two Dionex IC sets, Dionex ICS-2000 (Thermo Fisher Scientific Inc., United States) equipped with the IonPac AS15 (2 × 250 mm) column, potassium hydroxide eluent, ASRS-300 suppressor, a sample loop of 200 μl volume for anions (MS–, Cl−, and SO42–), and a Dionex ICS-2100 with CS12A (2 × 250 mm) column, methanesulfonic acid eluent, CSRS-300 suppressor, and a sample loop of 200 μl volume for the cations (Na+ and Ca2+). The IC system was installed in a class 10 laminar airflow booth in a clean room (class 1,000). The calibrations were performed using standard solutions from Dionex (P/N 046070 for cations and P/N 057590 for anions) except for MS−, for which the standard solution was prepared by diluting a stock solution (∼1,000 mg L−1) of CH3SO3Na (CAS No. 2386-57-4, Sigma-Aldrich, United States). The limit of detection and accuracy were ∼0.02–0.26 μg L−1 and ∼1.3–5.6% for anions and ∼0.01–0.26 μg L−1 and ∼4.5–12.0% for cations (Hong et al., 2012), respectively. The measured glaciochemical data used were verified carefully considering their calibration parameters and ionic balances, and some unusual data points were excluded as considered contaminated.
Stable water isotopes (δ18O and δD) were analyzed in the aliquots filtered through 0.45-µm polyvinylidene fluoride (PVDF) syringe filters (Merck Millipore, United States) by cavity ring-down spectroscopy (CRDS, L1102-i, L2130-i, and L2140-i, Picarro Inc., United States). Standards of known isotopic composition (Vienna Standard Mean Ocean Water 2 (VSMOW2), Greenland Ice Sheet Precipitation (GISP), and Standard Light Antarctic Precipitation 2 (SLAP2)) were used for the calibration of the isotopic data (Nyamgerel et al., 2020).
Sea salt (ss–) and non-sea salt (nss–) fractions of Na+, Ca2+, and SO42– used in this study were calculated using the following equations (Severi et al., 2009, 2017):
[X]sample is the measured or calculated concentration of ion ‘X’ in samples. [Ca2+/Na+]crust is the Ca2+/Na+ ratio (1.80 w/w) in the Earth crust (Bowen, 1979). [Ca2+/Na+]seawater and [SO42–/Na+]seawater are the mean ratios of Ca2+/Na+ (0.038 w/w) and SO42–/Na+ (0.25 w/w) in bulk seawater (Kester et al., 1967).
2.3 Observational and reanalysis datasets
This study used the daily pressure and wind speed data observed from an Italian automatic weather station (Lola AWS) (74° 8′ 6″S, 163° 25′ 50″E, 1,621 m above the sea level), 40 km away from the SGP (Figure 1B). In addition, the monthly SIE data were obtained from the National Oceanic and Atmospheric Administration (NOAA) National Snow and Ice Data Center (NSIDC); the monthly SIC, 500–hPa GpH, meridional wind (v–wind) at 10 m, zonal wind (u–wind) at 10 m, and wind speed at 10 m data were from the European Centre for Medium Range Weather Forecasts (ECMWF) Interim Reanalysis (ERA-Interim); and monthly chlorophyll a concentration data were collected from the Moderate Resolution Imaging Spectroradiometer–Aqua (MODIS–Aqua) observation. The open water area was estimated based on SIC, following Cheng et al. (2019). More detailed information on these datasets is given in Supplementary Section S1.
2.4 Statistical analysis
The principal component analysis (PCA) is a multivariate technique often used to reduce the dimensionality of large data sets (Nyamgerel et al., 2020). Using JMP statistical software (SAS Institute, United States), PCA with Varimax rotation was performed on the sea salt and non-sea salt fractions of ionic species, together with biogenic species (MS– and nss–SO42–) and isotopes (δ18O and δD). The reliability of the initial PCA results was checked by running the PCAs repeatedly for the datasets, where each species was removed from the total matrix at a time. The explained variance of each output factor between runs was then compared to determine the influence of a set parameter on the output components. All the PCA outputs on a given dataset identified the three major principal components (PCs) that accounted for ≥85% of the total variance, confirming the validity and reliability of PCA results.
In this study, Pearson’s correlation coefficient (r-value) was used to examine the linear relationship between the two variables declaring statistical significance for a given level of significance (p-value) with a two-tailed t-test.
2.5 Back trajectory analysis
The 5-day backward trajectories of air masses before reaching the SGP were calculated using the U.S. NOAA’s Hybrid Single-Particle Lagrangian Integrated Trajectory (HYSPLIT, version 5) model. The daily meteorological data used in this study were ERA-Interim from the global model ECMWF available at http://www.ecmwf.int. The back trajectories were calculated daily in a vertical mode for June–November (JJASON) and November–March (NDJFM) from 1990 to 2012. In this analysis, the trajectories arriving at 500 and 1,000 m above the ground level were calculated because the transport pathways of air masses below 1,000 m may reflect the average flow field characteristics of the Antarctic troposphere (Stohl and Sodemann, 2010; Chambers et al., 2018).
2.6 Age dating of firn cores
The PCA allows the identification of the seasonality and trend within the glaciochemical dataset by investigating the inter-species relationships and common structure. The PCA results identified the three major principal components (PCs) that explained 87.3 and 87.2% of the variance in the Styx-A and -B data, respectively, as shown in Supplementary Tables S1, S2. PC1 explained 40.2% (Styx-A) and 41.3% (Styx-B) of the total variance with strong loadings of sea salt species (ss–Na+, ss–Ca2+, Cl−, and ss–SO42–). PC2 is characterized by high loadings (25.5% for the Styx-A core and 24.6% for the Styx-B core) for isotopes (δ18O and δD) and biogenic species (MS– and nss–SO42–), indicating similar seasonal features between these variables. PC3, which accounts for 21.6 and 21.3% of the variance for the Styx-A and Styx-B cores, respectively, is of a crustal origin (nss–Na+ and nss–Ca2+).
As shown in Figure 2, the dating of the Styx-A core was determined primarily by counting the annual layers identified by the well-defined seasonal variations of the chemical composition (δ18O, δD, MS–, and nss–SO42–) in PC2, showing their annual patterns with the summer maxima and winter minima in Antarctic precipitation (Dansgaard, 1964; Minikin et al., 1998; Pasteris et al., 2014). The same seasonality of SO42–/ss–Na+ and Cl−/ss–Na+ ratios with maxima in summer (Hara et al., 2020; Nyamgerel et al., 2020, 2021) was also used to date the core (Figure 2). According to 23 summer maxima of these seasonalities (vertical orange bars in Figure 2), the top 9.29 m of the Styx-A core was dated to cover the time between 1989/90 and 2011/12 austral summer seasons.
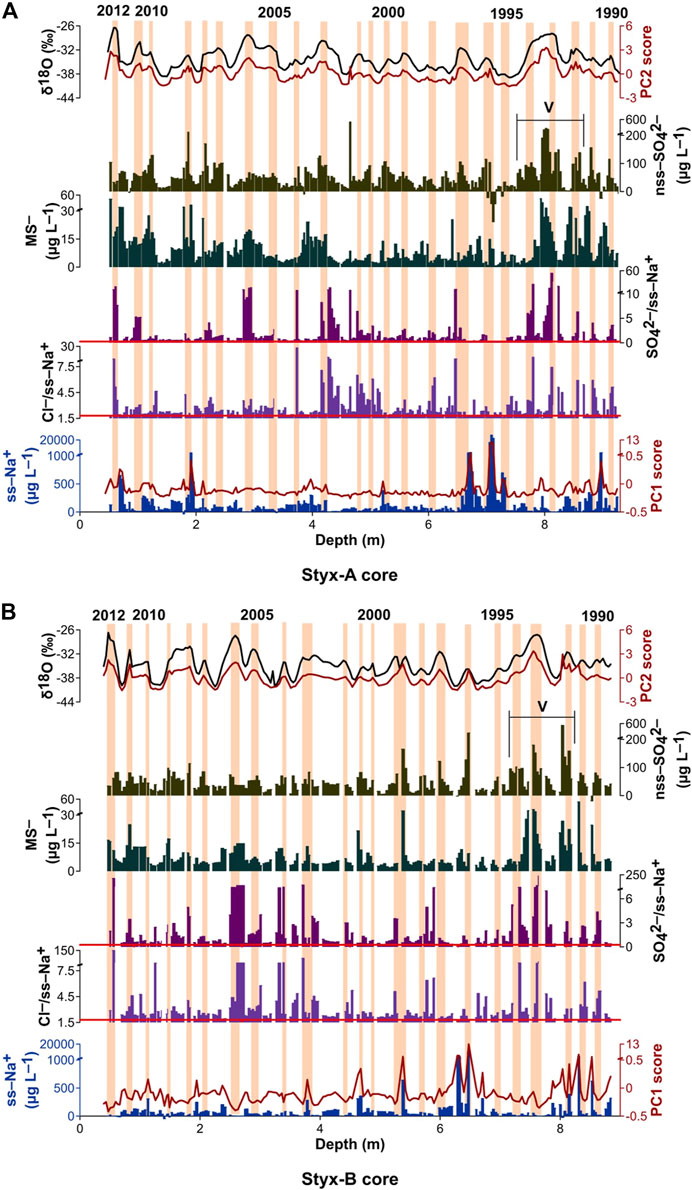
FIGURE 2. Annually resolved records of δ18O, PC2 score, nss–SO42−, MS–, SO42−/ss–Na+, Cl−/ss–Na+, ss–Na+, and PC1 score from (A) the Styx-A core and (B) the Styx-B core. Profiles of δD, Cl−, ss–SO42–, and ss–Ca2+ are not shown because strong correlations between δ18O and δD and among ss–Na+, ss–Ca2+, Cl−, and ss–SO42– are observed (r > 0.99). Horizontal red lines represent the SO42–/ss–Na+ and Cl−/ss–Na+ ratios in seawater (0.25 and 1.80 w/w, respectively). Vertical orange areas refer to depth intervals assigned to summer seasons of each year. ‘V’ denotes volcanic intervals with the well-identified large volcanic deposition from Mt. Cerro Hudson and Mt. Pinatubo (Nyamgerel et al., 2020).
Along with the age scale of the Styx-B core that was previously dated back to 1990 at 8.84 m depth (Nyamgerel et al., 2020), the dating result was verified by linking annual layers in the chemical profiles to the Styx-B core profiles. In Figure 2, the strong nss–SO42- and SO42-/ss–Na+ peaks were detected at depth intervals of 7.68–8.60 m and 7.17–8.15 m in the Styx-A and -B cores, respectively, during the 1991–1993 time period, corresponding to the volcanic layers of the Cerro Hudson (1991–1992) and Pinatubo (1993–1994) eruptions (Nyamgerel et al., 2020 and references therein). This is consistent with the previous findings of the prominent nss–SO42− enhancement pattern in the snow layers deposited between late 1991 to the end of 1993, following the Cerro Hudson and Pinatubo eruptions (Legrand and Wagenbach, 1999), confirming the precise dating of the Styx-A core by counting annual layers. On the other hand, there existed a discrepancy between the Styx-A and -B ss–Na+ records. As shown in Figure 2, two core records revealed unusual peaks of ss–Na+ concentrations, reaching more than 1 mg L−1, at depths of 6.69–6.72 m, 7.06–7.12 m, and 8.97 m in the Styx-A core and 6.29–6.32, 6.48, and 8.53 m in the Styx-B core. These ss–Na+ peaks are most likely associated with large sea salt deposition fluxes caused by sporadic storm events occurring along the Victoria Land coasts (Gragnani et al., 1998; Udisti et al., 1999). The peaks in 1990, 1995, and 1996 in the Styx-A core were essentially matched by those in their respective periods of the Styx-B core, although the ss–Na+ concentration for a peak in 1990 was relatively lower (625 μg L−1) in the Styx-B core, partly due to the difference in the size of sample numbers per year (the means of 11 and 9 for the Styx-A and -B cores, respectively). In contrast, the two core records did not show matching peaks that were identified in late 2008 at 1.91 m and early 1991 at 8.31 m in the Styx-A and -B cores, respectively. This feature could be attributed to inter-core variability of chemical signals due to snowdrift or roughness of the snow surface at a given site (Wolff et al., 2005; Gautier et al., 2016). Overall, uncertainty in the dating of the Styx-A core is estimated to be <1 year for the period of 1990–2012.
The mean annual snow accumulation rates calculated by multiplying the annual layer thickness by the density at the corresponding depth in the core were 164 ± 58 kg m−2 yr−1 for the Styx-A core, which is comparable with that (155 ± 54 kg m−2 yr−1) of the Styx-B core during 1990–2012.
3 Results and discussion
The PCA results represent the dominance of sea salt and biogenic sulfur compositions, accounting for two-thirds of the total variance in the ionic composition of the Styx cores (Supplementary Tables S1, S2) and documented at various coastal areas in Antarctica (Benassai et al., 2005; Kärkäs et al., 2005; Vega et al., 2018). Sea salt aerosol (SSA) derives primarily from the sea surface by wind-driven breaking waves via bubble bursting (de Leeuw et al., 2011). On the other hand, frost flowers or blowing snow on the sea ice surface have been suggested to be potential sources of SSA to coastal regions of Antarctica over winter/spring with large SIE, resulting in higher sea salt fluxes during winter/spring (Rankin et al., 2000; Hara et al., 2004, 2012; Abram et al., 2013; Frey et al., 2020). For comparison, MS–, the marine biogenic species, is formed exclusively by the atmospheric photo-oxidation of dimethylsulfide (DMS) emitted from the seasonal sea ice melt zone (SSMZ) and polynyas in the high southern latitudes, exhibiting well-defined annual peaks during late spring to summer months in coastal Antarctic aerosol and precipitation (Minikin et al., 1998; Gondwe et al., 2003; Smith and Comiso, 2008; Osman et al., 2017). Accordingly, changes in the occurrence of ss–Na+ and MS– in the annually-dated Styx firn cores could be related directly to the changing patterns of SIE and the atmosphere–ocean system controlled by the regional/global climatic variables (Fischer et al., 2004; Abram et al., 2013).
When exploring the potential links between ss–Na+ and various climate variables, anomalous ss–Na+ concentration peaks above 1,000 μg L−1 (Figure 2), which could potentially indicate sporadic storm events, as described previously, were excluded to reduce the risk of misinterpreting the variability of ss–Na+ concentrations. The mean ss–Na+ concentrations, thus, obtained were 112 μg L−1 for the Styx-A core and 86 μg L−1 for the Styx-B core, which are comparable to those reported from snowpit samples in the SGP (Piccardi et al., 1996; Kwak et al., 2015).
To examine the dominant deposition processes (wet or dry deposition) of ss–Na+ and MS–, the annually averaged fluxes of ss–Na+ and MS– (calculated by multiplying the mean annual concentration by the annual snow accumulation rate) were plotted as a function of annual snow accumulation rates. If there is a positive linear relationship between the two variables, the y-intercept of the line represents the contribution of the dry deposition (Cole-Dai et al., 1995; Benassai et al., 2005). As shown in Supplementary Figure S1, the y-intercepts of the linear regression analysis represented the positive value (4,931 μg m−2 yr−1) for ss–Na+ and the negative value (–443 μg m−2 yr−1) for MS–. In addition, Pearson’s correlation coefficients between the annual snow accumulation rate and the annual ss–Na+ and MS– fluxes were, respectively, 0.37 and 0.66. This suggests that the dry deposition process was important in regulating the fallout of ss–Na+ to the study site, whereas MS– concentrations were associated primarily with wet deposition (Cole-Dai et al., 1995; Benassai et al., 2005). The consequence of these observations is probably due to atypical atmospheric circulation in the Ross Sea region, with dry cyclonic activity in winter and snowfall in summer (Scarchilli et al., 2011).
In the following sections, the mean annual ss–Na+ fluxes and MS– concentrations were examined in relation to their emission intensities from oceanic source areas, where air masses reaching the SGP originate most, and meteorological conditions to investigate their potential as indicators of past SIE and atmospheric circulation change. It is to be noted as detailed in Supplementary Section S2 that the annual ss–Na+ fluxes and MS– concentrations were standardized by subtracting the mean from the observed value, and the standardized data series were then averaged to reduce the effects of noise in the individual core records and produce a single stacked record of each ion for the Ross Sea region (Abram et al., 2007).
3.1 Deposition mechanism of sea salt species
3.1.1. Source effects on sea salt deposition
Based on the seasonality of the ss–Na+ concentrations generally showing maxima during the winter and spring seasons (Figure 2), the potential source areas of SSA arriving at the SGP during JJASON (winter–spring) between 1990 and 2012 were first identified using the HYSPLIT air mass back trajectories (see Section 2.5). The trajectories reaching the SGP showed the highest entrainment of maritime air masses from the Ross Sea sector (41% at 500 m and 47% at 1,000 m above ground level), lying close to the winter and spring sea ice edge between 70° and 65°S (Eayrs et al., 2019), with the additional intrusions from the Western Pacific Ocean (both 30%) and Amundsen–Bellingshausen Sea sectors (29 and 23%) (Supplementary Figure S2A,B). The ocean-derived trajectories were almost within the marine atmospheric boundary layer (<∼2000 m above sea level) in the high latitudes of the Southern Ocean (Truong et al., 2020) where there exist a number of processes that control the vertical distribution and transport of marine aerosol. It is to be noted that the air masses from the Ross Sea sector entrain directly into the Ross Sea embayment, which is favorable for the SSA migration (Minikin et al., 1994; Bertler et al., 2005). Meanwhile, the maritime air mass from the Western Pacific Ocean and Amundsen–Bellingshausen Sea sectors typically travel across the East and West Antarctic Ice Sheet, respectively (Markle et al., 2012; Sinclair et al., 2013), resulting in the removal of SSAs through long-distance transport (Minikin et al., 1994; Bertler et al., 2005). Taken together, it appears that the Ross Sea sector is most likely to be the major source region affecting sea salt deposition in the SGP.
The relationship between the stacked ss–Na+ record and the time series of the annual SIE maximum in the Ross Sea sector on interannual timescales was first examined. As shown in Figures 3A,B and Supplementary Tables S3, there was no relationship between the two variables with Pearson’s correlation coefficient of 0.04 at p > 0.1. The stacked ss–Na+ flux record was then compared with the August–October (ASO, months of sea ice maxima; Eayrs et al., 2019) SIC records of various Antarctic oceanic sectors. In Figure 4A, the stacked ss–Na+ flux and the SIC showed positive correlations (0.3 ≤ r ≤ 0.5 at p ≤ 0.1) over the Amundsen–Bellingshausen Sea sector and negative correlations (–0.7 ≤ r ≤ –0.3 at p ≤ 0.1) over the Indian Ocean sector. On the other hand, no correlations were observed over the Ross Sea sector. This suggests that the present ss–Na+ record is not linked to sea ice variability in the adjacent ocean, which, in turn, requires different factors that might contribute to the observed ss–Na+ flux changes.
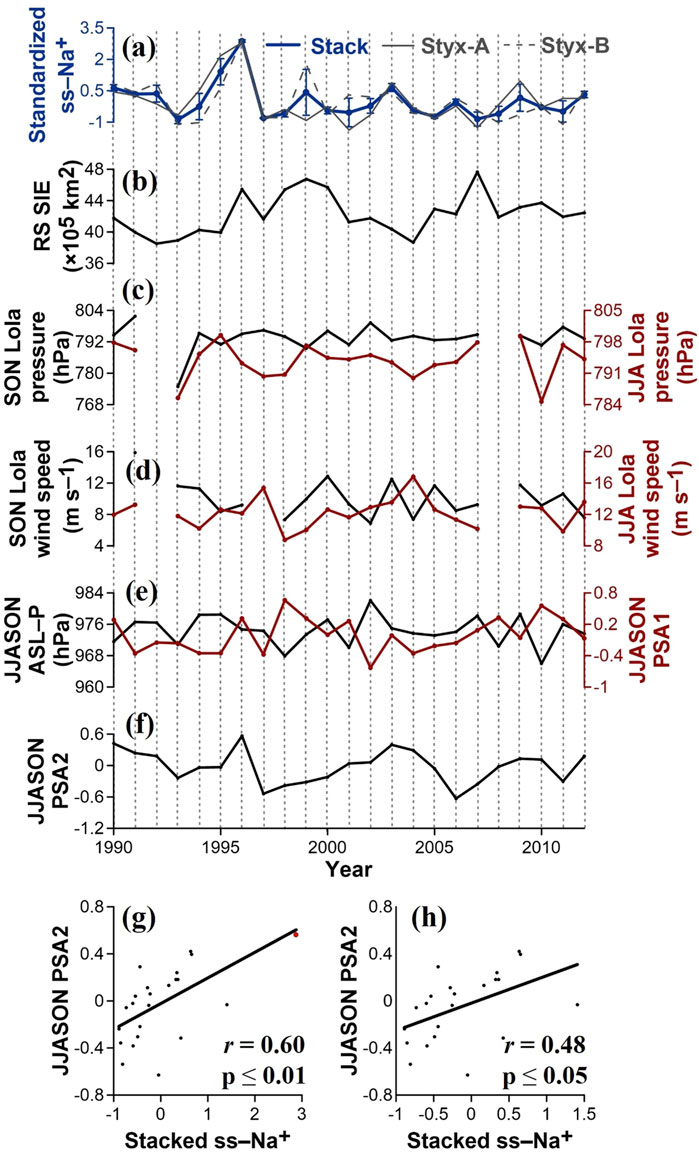
FIGURE 3. (A) Stacked record of annually averaged ss–Na+ fluxes in the Styx-A and -B cores. The stacked profile was produced after standardizing the observed ss–Na+ flux data (see text). The vertical bars represent the standard error for each annual value. (B) Satellite-derived maximum SIE record for the Ross Sea (RS) sector (see Supplementary Section S1 and Figure 1A), (C) JJA and SON Lola AWS pressure records, (D) JJA and SON Lola AWS wind speed records, (E) JJASON ASL–P index defined by Hosking et al. (2013) and PSA1 index defined by Marshall and Thompson (2016), and (F) JJASON PSA2 index defined by Marshall and Thompson (2016). Linear regression fits between the stacked ss–Na+ flux and JJASON PSA2 index over the corresponding periods for all data points (G) and after excluding an outlier data point (red dot in (g)) in the year 1996 (H).
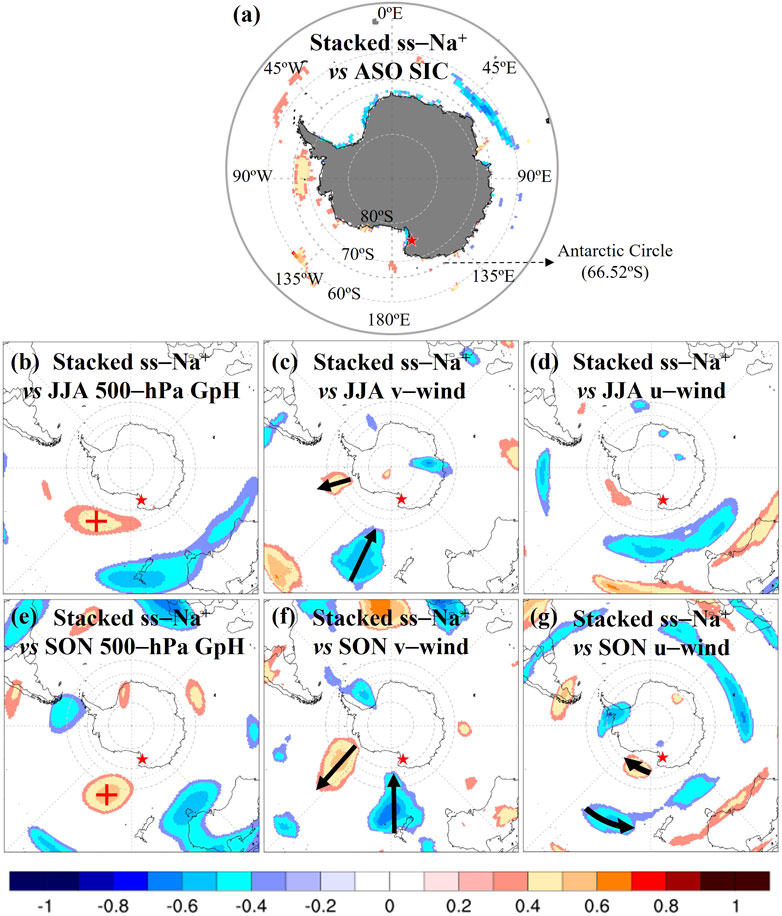
FIGURE 4. Maps of spatial correlation analysis between the stacked ss–Na+ record and (A) ASO SIC, (B) JJA 500–hPa GpH, (C) JJA 10 m v–wind, (D) JJA 10 m u–wind, (E) SON 500–hPa GpH, (F) SON 10 m v–wind, and (G) SON 10 m u–wind across the Southern Ocean and Antarctica at the 90% significance level (see Supplementary Section S1). Red stars represent the location of the SGP. The red crosses in (B) and (E) indicate the PSA2 position. The black arrows in (C), (F), and (G) are wind vectors indicating the direction and intensity of the wind. Pearson’s correlation coefficients on maps are given by the intensity of shading, as displayed in a color scale bar at the bottom. The correlation analysis was performed using a Climate Reanalyzer (http://ClimateReanalyzer.org), Climate Change Institute, University of Maine, United States.
3.1.2 Meteorological effects on sea salt deposition
Together with the effects of the sea salt source, the regional-scale (meso-to synoptic-scale) cyclones or large-scale atmospheric circulation can also play a critical role in the sea salt supply at coastal Antarctic sites (Carrasco et al., 2003; Sinclair et al., 2010; Bertler et al., 2018; Nyamgerel et al., 2021). The stacked ss–Na+ to Lola AWS pressure and wind velocity data during June–August (JJA; winter) and September–November (SON; spring) were compared to examine the relationship between the ss–Na+ flux record and the regional-scale cyclones. As shown in Figures 3C,D and Supplementary Tables S3, no statistically significant relationships were observed between the stacked ss–Na+ flux and the two meteorological parameters (p > 0.1).
The possible impact of large-scale atmospheric patterns on dominant ss–Na+ deposition to the SGP in winter and spring seasons was then examined. Figures 4B–G shows the correlations of the stacked ss–Na+ record with JJA/SON 500–hPa GpH, v–wind (northward), and u–wind (eastward) around Antarctica. The ss–Na+ flux was positively associated with the 500–hPa GpH offshore of the Ross Sea region between 130° and 170°W (0.3 ≤ r ≤ 0.6 at p ≤ 0.1) (Figures 4B,E). The corresponding fields between the stacked ss–Na+ and the v–and u–winds exhibited more southward flows in the western Ross Sea between 170°E and 160°W (negative shadings in Figures 4C,F), northward flows in the Amundsen Sea between 110° and 130°W (positive shadings in Figures 4C,F), westward flows in the South Pacific between 40° and 50°S (negative shadings in Figure 4G), and eastward flows in the Southern Ocean between 65° and 75°S (positive shadings in Figure 4G). These large-scale features were more prominent in spring than in winter. The results suggest that the ss–Na+ flux record from the Styx cores has been closely linked with the interannual variability in the anticyclone circulation centered in the Ross Sea between 130° and 170°W and the associated southward winds in the western Ross Sea region between 170°E and 160°W in winter/spring.
The linkages of stacked ss–Na+ with the JJASON ASL actual center pressure (hereafter referred to as ASL–P) index, PSA1 index, and PSA2 index were examined to reveal the dominant climate mode that primarily affects the large-scale atmospheric circulation in the Ross Sea. The observed atmospheric circulation variability over the Ross Sea has been associated with the fluctuations of these indices, where their pressure centers are positioned over the Southern Pacific Ocean (Marshall and Thompson, 2016; Raphael et al., 2016). As shown in Figures 3E,F and Supplementary Tables S3, no statistically significant correlations were observed between the stacked ss–Na+ and JJASON ASL–P and PSA1 indices (p > 0.1). In contrast, the stacked ss–Na+ record showed a significant correlation (r = 0.60, p ≤ 0.01) with the JJASON PSA2 index (Figure 3G and Supplementary Tables S3). After excluding the outlying data point (red dot for 1996 in Figure 3G) to minimize the possible bias of the correlation estimate, the relationship between the two variables was still statistically significant (r = 0.48, p ≤ 0.05) (Figure 3H and Supplementary Tables S3). As a result, the observed relationship suggests that increases in the deposition of SSAs to the SGP between winter and spring were likely associated with the more enhanced phase of PSA2 in the corresponding seasons. The positive PSA2 pattern is characterized by relatively stronger anticyclone anomalies in the Ross Sea with anomalous onshore winds at its western flank, offshore winds at its eastern flank, easterly winds at its northern flank, and westerly winds at its southern flank (see Figure 2D of Marshall and Thompson (2016), which showed great similarity to the corresponding fields in Figures 4E–G. The positive phase of PSA2 is also associated with the anticorrelated patches at the western (near the AP) and northeastern (near Australia) sides of the Ross Sea, as shown in Figure 4E (see also Figures 1C,F of Mo (2000)). Accordingly, increases in winter/spring sea salt inputs to the SGP would be linked to maritime air masses from the western Ross Sea that would penetrate the SGP more frequently in line with the prevailing anticyclone anomalies in the Ross Sea when JJASON PSA2 becomes more pronounced. Hence, this study proposes that variability of the ss–Na+ flux in the Styx cores can be used as the proxy indicator to reconstruct the past changes in the PSA2 pattern for a longer period.
3.2 Deposition mechanism of biogenic sulfur
3.2.1 Source effects on biogenic sulfur deposition
To identify the major source areas of MS–, the 5-day back trajectories reaching the SGP during NDJFM were first examined when there were large increases in the emission of oceanic DMS, the precursor of MS–, in the SSMZ of the Southern Ocean (Lana et al., 2011). Supplementary Figure S2C,D shows that most NDJFM air masses within ∼2 km above the sea level passed over the SSMZ of the Ross Sea sector (75% at 500 m and 73% at 1,000 m above the ground level) where DMS concentration in the surface seawater and its emission flux are highest with sea ice melting during the corresponding months (Curran and Jones, 2000; Lana et al., 2011). The dominance of air masses from the Ross Sea during the summer months may reflect the seasonal variation of the major transport pathways reaching the SGP (Scarchilli et al., 2011; Sinclair et al., 2013). In addition, the RSP (75–79°S, 170°E–155°W) and the TNBP (74–76°S, 168–163°E), located in the southern Ross Sea (see Supplementary Figure S3), are biologically productive, exhibiting annual cycles of primary production with rapid increases in the early spring and summer peaks (Arrigo and van Dijken, 2003; Mangoni et al., 2017). As a result, they are likely to be the most important source of biogenic sulfur deposited on the SGP. However, we cannot exclude the possibility that emissions of DMS in remote oceanic areas could also be a source of MS– in the Styx ice cores because biogenic aerosols in the fine mode have residence times of more than 5 days (Curran and Jones, 2000; Williams et al., 2002).
The potential source areas (polynyas/sea ice) of MS– deposition to the Styx cores were examined by comparing the stacked annual MS– record with the variations in the open water areas of the RSP and the TNBP, the maximum SIE of the Ross Sea sector, and ASO/NDJFM SIC across the Southern Ocean. It is to be noted that NDJFM SIC is expected to be closely related to the sea ice melt areas in a given location because the decrease in SIC occurs when sea ice melts in the spring and summer. As shown in Figures 5A–C and Supplementary Tables S3, there were no significant positive correlations between the stacked MS– record and temporal variations of polynya areas and maximum SIE (p > 0.1). By contrast, the stacked MS– exhibited significant positive correlations (0.3 ≤ r ≤ 0.5 at p ≤ 0.1) with the ASO SIC in the SSMZ on the northwestern Ross Sea (hereafter referred to as NRS; 67–69°S, 160°E–170°W) and negative correlations (–0.6 ≤ r ≤ –0.3 at p ≤ 0.1) with the NDJFM SIC in the central-eastern Ross Sea (hereafter referred to as CERS; 69–72°S, 160–130°W) (Figures 6A,B). This suggests that these offshore areas could be important for controlling the MS– variability in flux to the SGP.
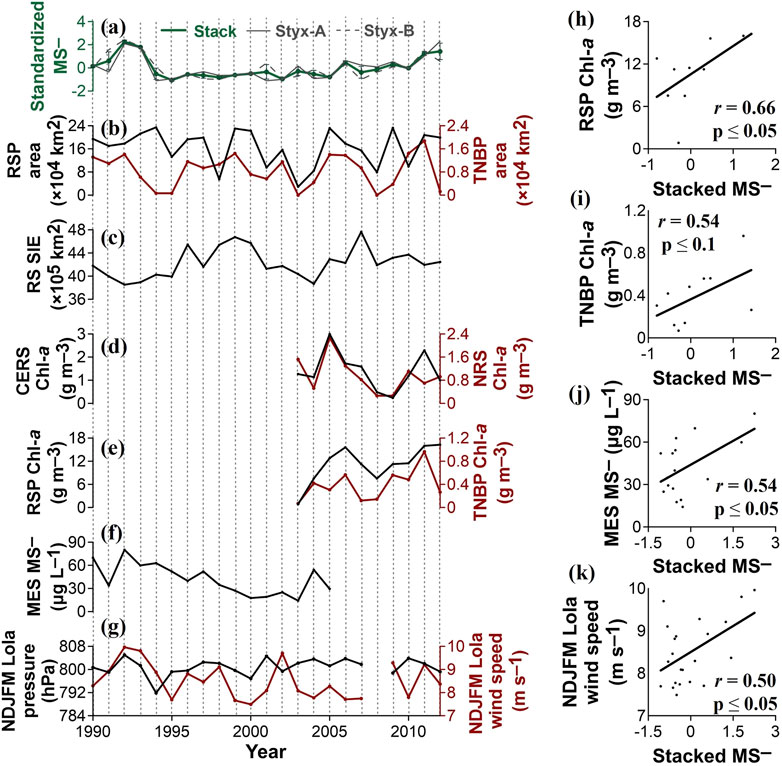
FIGURE 5. (A) Stacked record of annually averaged MS– concentrations in the Styx-A and -B cores. The stacked profile was produced after standardizing the observed MS– concentration data (see text). The vertical bars represent the standard error for each annual value. (B) Satellite-derived NDJFM open water areas in the RSP and the TNBP (see Supplementary Section S1), (C) maximum SIE in the Ross Sea (RS) sector, (D) NDJFM chlorophyll a (Chl–a) concentrations in the CERS and the NRS, and (E) NDJFM Chl–a concentrations in the RSP and the TNBP (see Supplementary Section S1). (F) MES MS– record from Rhodes et al. (2009, 2012). (G) NDJFM Lola AWS pressure and wind speed records. Linear regression fits between the stacked MS– concentration and NDJFM Chl–a concentrations in the RSP (H) and the TNBP (I), MES MS– (J), and NDJFM Lola AWS wind speed (K) over the corresponding periods.
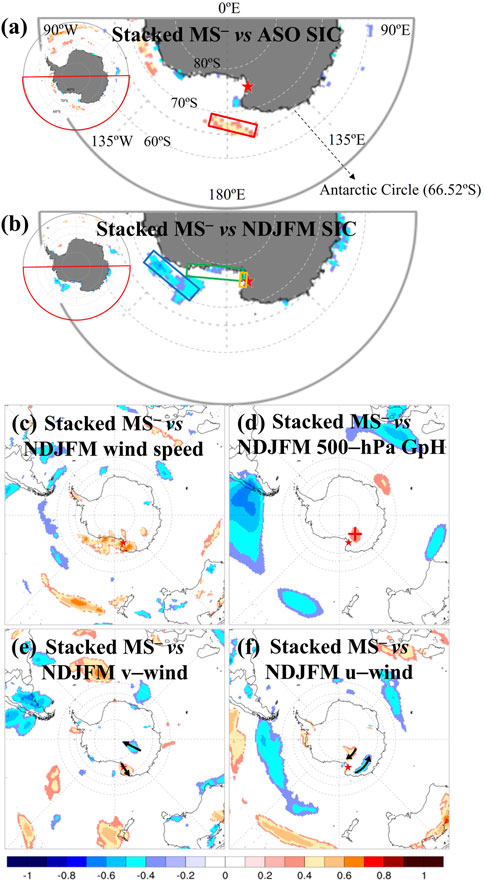
FIGURE 6. Maps of spatial correlation analysis between the stacked MS–record and (A) ASO SIC, (B) NDJFM SIC, (C) NDJFM 10 m wind speed, (D) NDJFM 500–hPa GpH, (E) NDJFM 10 m v–wind, and (F)NDJFM 10 m u–wind across the Southern Ocean and Antarctica at the 90% significance level. Red stars represent the location of the SGP. The fields of the red line in (A) and blue, green, and orange lines in (B) represent areas of the NRS, the CERS, the RSP, and the TNBP, respectively, for estimating the summertime chlorophyll–a concentrations from satellite images (see Supplementary Section S1). The black arrows in (E) and (F) are wind vectors indicating the direction and intensity of the wind. Pearson’s correlation coefficients on maps are given by the intensity of shading, as displayed in a color scale bar at the bottom. The correlation analysis was performed using the Climate Reanalyzer (http://ClimateReanalyzer.org), Climate Change Institute, University of Maine, United States.
Because the emission of DMS, which is oxidized to MS–, is closely associated with phytoplankton biomass in the Southern Ocean (Gabric et al., 2005), this study examined the sensitivity of the MS– record to the variation of the NDJFM chlorophyll a concentrations (see Supplementary Section S1), the index of phytoplankton biomass, in possible source areas to identify a substantial contributor to the variability of our MS– record. Despite the limited data availability of the chlorophyll a concentrations, there is no evidence of significant correlations between the stacked MS– and NDJFM chlorophyll a concentrations in the NRS and the CERS (p > 0.1) (Figure 5D and Supplementary Tables S3). On the other hand, statistically significant correlations were found between the MS– record and NDJFM chlorophyll a concentrations in the RSP (r = 0.62, p ≤ 0.05) and the TNBP (r = 0.53, p ≤ 0.1) (Figure 5E,H,I and Supplementary Tables S3). This suggests that the RSP and the TNBP would serve as the dominant MS– sources reaching the SGP in late spring to early autumn with biological activities. It should be noted that the concentration of chlorophyll a between 2003 and 2012 was approximately 25 times higher in the RSP than in the TNBP (averages of 10.78 and 0.43 g m−3, respectively), indicating that the RSP might be a greater source of DMS-derived MS– flux into the SGP. A comparison of the MS– record with temporally coincident chlorophyll a data suggests that the interannual variability of the MS– flux into the SGP was modulated by biological activities in the RSP instead of the NRS and the CERS.
These results are consistent with previous findings that the annual mean MS– record in the snow layers at the Mt. Erebus Saddle (MES) on Ross Island (see Figure 1B) was strongly correlated with the changes in the RSP primary productivity (Rhodes et al., 2009, 2012). Indeed, the stacked MS– record is significantly correlated with the MES MS– (r = 0.54, p ≤ 0.05; see Figures 5F,J and Supplementary Tables S3). On the contrary, these results are inconsistent with previous studies, where the ice core MS– records from Law Dome (Curran et al., 2003), Ellsworth Land (Thomas and Abram, 2016), and Antarctic Peninsula (Abram et al., 2010) revealed strong positive correlations with changes in the SIE of the adjacent sea areas during winter months in the preceding year. These regions are characterized by the much smaller (about one order of magnitude) polynyas along with the much larger (two orders of magnitude) maximum SIE compared to those situated off an area of our study (Arrigo and van Dijken, 2003). This suggests the possibility that the underlying mechanisms regulating the MS– deposition fluxes to the snow surface vary between coastal areas, which may lead to an ambiguous interpretation of the MS– records.
3.2.2 Meteorological effects on biogenic sulfur deposition
To explore the association of regional meteorological conditions with the observed relationship between the stacked annual MS– record and the RSP chlorophyll a records, the stacked MS– was compared with the NDJFM Lola AWS pressure and wind speed records (Figure 5G and Supplementary Tables S3). The absence of correlation between the stacked annual MS– and NDJFM Lola pressure was observed (p > 0.1), while the correlation was statistically significant for wind speed (r = 0.50, p ≤ 0.05) (Figure 5K). Furthermore, good positive correlations between the MS– and NDJFM wind speed were observed in the southern Ross Sea region (0.3 ≤ r ≤ 0.7 at p ≤ 0.1) (Figure 6C). Wind speed is an important factor that affects atmospheric DMS levels because the sea-to-air flux of DMS increases as wind speed increases (Zhang et al., 2020). Overall, the observed interannual variability of the MS– flux into the SGP is likely due to a combination of changing biological activities in and wind speed bringing marine air traveling over the RSP.
Finally, this study examined the possible association between the stacked MS– record and large-scale atmospheric patterns during summer. Figures 6D–F show the correlations of the stacked MS–with NDJFM 500–hPa GpH, v–wind, and u–wind around Antarctica. There was no evidence of compelling relationships between the large-scale meteorological conditions and the MS– deposition on the SGP, but the results showed that the increased MS– was likely to be strengthened by the local anticyclone system located southwest of the SGP (denoted as a red cross in Figure 6D), bringing stronger northward winds over the RSP (positive shadings in Figure 6E). By combining the significant positive correlations of the MS– with wind speed across the RSP region (Figure 6C), these features support that the RSP would be a major source of DMS-derived MS– flux into the SGP, as discussed in the previous section.
4 Conclusion
This study presented the ss–Na+ and MS– records from 1990 to 2012 from two firn cores drilled on the SGP, the western Ross Sea coast of northern Victoria Land. The stacked annual records of ss–Na+ and MS– were then compared with the observational datasets for various climate variables to examine the suitability of these records as proxies of the oceanic conditions and associated atmospheric circulation variability over the Ross Sea.
The stacked ss–Na+ record was correlated with the anticyclone circulation centered in the Ross Sea between 130° and 170°W and the associated southward winds in the western Ross Sea between 170°E and 160°W in winter/spring, suggesting the close linkage of the interannual variability of ss–Na+ to the winter/spring large-scale atmospheric circulation patterns. The subsequent comparison of the ss-Na+ record with the main climate modes (ASL, PSA1, and PSA2) showed a significant correlation with the winter/spring PSA2 index, suggesting that increases in the ss–Na+ flux to the SGP could be associated with the PSA2 patterns between winter and spring. The prevailing anticyclone anomalies in the Ross Sea that occur when the winter/spring PSA2 mode becomes more pronounced would allow the frequent penetration of maritime air masses containing SSAs from the western Ross Sea to the SGP.
The stacked MS– record showed a significant positive correlation with the temporally coincident chlorophyll a data in the RSP, suggesting that interannual variability of MS– was modulated by the summertime primary productivity in the RSP. Positive correlations were then observed for the MS– record with summertime wind speeds in the southern Ross Sea region and other meteorological parameters, indicating that an increase in the MS– deposition flux on the SGP would occur as a result of a strengthened local anticyclone system located southwest of the SGP, bringing more northward winds over the RSP. Overall, a combination of changing biological activities and wind speed of air traveling over the RSP appears to be responsible for the observed interannual variability of the MS– record.
Overall, the detailed examination of the ss–Na+ and MS– records from the SGP reflects the connection between ss-Na+ and spring/winter PSA2 in the Ross Sea and between MS– and a combination of the summertime primary productivity and wind strength in the RSP. This presents the potential of these SGP records as proxies for reconstructing the past variations in oceanic and atmospheric conditions associated with climate variables over the Ross Sea region. These results will guide future research for a greater understanding of the mechanisms that govern the sea ice variability in this region using high-resolution and longer proxy ice core records from different coastal areas, including the SGP.
Data availability statement
The original contributions presented in the study are included in the article/Supplementary Material; further inquiries can be directed to the corresponding author at the e-mail address: hong909@kopri.re.kr
Author contributions
SR, S-BH, J-HK, and SH contributed to the conceptualization. SR, CL, J-HK, YH, and S-BH contributed to the data analysis. The manuscript was written by SR, S-BH, and SH with the contributions of other coauthors to manuscript revision. SR and JM performed the firn core decontamination. CC and S-BH performed ion chromatography measurements. SK and YH performed the analysis of stable water isotopes. All of the authors have read and approved the manuscript.
Funding
This research was supported by the Basic Science Research Program through the National Research Foundation of Korea (NRF), funded by the Ministry of Education, Science and Technology (NRF-2018R1A2B2006489), and the Korea Polar Research Institute (KOPRI) grant funded by the Ministry of Oceans and Fisheries (KOPRI PE22100).
Acknowledgments
The authors are grateful to KOPRI technicians and engineers for preparing and measuring the Styx firn core samples and to summer season researchers participating in field activities at the SGP in December 2014. They would also like to appreciate W.J. Thompson for providing the PSA indices data, the University of Maine for providing the Climate Reanalyzer website, the Italian PNRA (Programma Nazionale di Ricerche in Antartide) project for providing the Lola AWS meteorological data (http://www.climantartide.it), and the Air Resources Laboratory (ARL) for providing the HYSPLIT transport modeling program. The authors also thank the ECMWF, NOAA NSIDC, and NASA for providing the reanalysis and observational dataset. Finally, the authors thank the reviewers and the editor for their constructive feedback, which has led to improving the final manuscript.
Conflict of interest
The authors declare that the research was conducted in the absence of any commercial or financial relationships that could be construed as a potential conflict of interest.
Publisher’s note
All claims expressed in this article are solely those of the authors and do not necessarily represent those of their affiliated organizations, or those of the publisher, the editors, and the reviewers. Any product that may be evaluated in this article, or claim that may be made by its manufacturer, is not guaranteed or endorsed by the publisher.
Supplementary material
The Supplementary Material for this article can be found online at: https://www.frontiersin.org/articles/10.3389/feart.2022.896470/full#supplementary-material
References
Abram, N. J., Mulvaney, R., Wolff, E. W., and Mudelsee, M. (2007). Ice core records as sea ice proxies: An evaluation from the Weddell Sea region of Antarctica. J. Geophys. Res. 112, D15101. doi:10.1029/2006jd008139
Abram, N. J., Thomas, E. R., McConnell, J. R., Mulvaney, R., Bracegirdle, T. J., Sime, L. C., et al. (2010). Ice core evidence for a 20th century decline of sea ice in the Bellingshausen Sea, Antarctica. J. Geophys. Res. 115, D23101. doi:10.1029/2010jd014644
Abram, N. J., Wolff, E. W., and Curran, M. A. J. (2013). A review of sea ice proxy information from polar ice cores. Quat. Sci. Rev. 79, 168–183. doi:10.1016/j.quascirev.2013.01.011
Arrigo, K. R., and van Dijken, G. L. (2003). Phytoplankton dynamics within 37 Antarctic coastal polynya systems. J. Geophys. Res. 108, 3271. doi:10.1029/2002jc001739
Benassai, S., Becagli, S., Gragnani, R., Magand, O., Proposito, M., Fattori, I., et al. (2005). Sea-spray deposition in Antarctic coastal and plateau areas from ITASE traverses. Ann. Glaciol. 41, 32–40. doi:10.3189/172756405781813285
Bertler, N. A. N., Conway, H., Dahl-Jensen, D., Emanuelsson, D. B., Winstrup, M., Vallelonga, P. T., et al. (2018). The Ross Sea Dipole – temperature, snow accumulation and sea ice variability in the Ross Sea region, Antarctica, over the past 2700 years. Clim. Past. 14, 193–214. doi:10.5194/cp-14-193-2018
Bertler, N. A. N., Mayewski, P. A., Aristarain, A., Barrett, P., Becagli, S., Bernardo, R., et al. (2005). Snow chemistry across Antarctica. Ann. Glaciol. 41, 167–179. doi:10.3189/172756405781813320
Carrasco, J. F., Bromwich, D. H., and Monaghan, A. J. (2003). Distribution and characteristics of mesoscale cyclones in the antarctic: Ross sea eastward to the Weddell Sea. Mon. Weather Rev. 131, 289–301. doi:10.1175/1520-0493(2003)131<0289:dacomc>2.0.co;2
Chambers, S. D., Preunkert, S., Weller, R., Hong, S.-B., Humphries, R. S., Tosltti, L., et al. (2018). Characterizing atmospheric transport pathways to Antarctica and the remote Southern Ocean using Radon-222. Front. Earth Sci. (Lausanne). 6. doi:10.3389/feart.2018.00190
Cheng, Z., Pang, X., Zhao, X., and Stein, A. (2019). Heat flux sources analysis to the Ross Ice Shelf polynya ice production time series and the impact of wind forcing. Remote Sens. 11 (188). doi:10.3390/rs11020188
Cole-Dai, J., Thompson, L. G., and Mosley-Thompson, E. (1995). A 485 year record of atmospheric chloride, nitrate and sulfate: Results of chemical analysis of ice cores from dyer plateau, antarctic Peninsula. Ann. Glaciol. 21, 182–188. doi:10.1017/s0260305500015792
Comiso, J. C., Kwok, R., Martin, S., and Gordon, A. L. (2011). Variability and trends in sea ice extent and ice production in the Ross Sea. J. Geophys. Res. 116, C04021. doi:10.1029/2010jc006391
Curran, M. A. J., and Jones, G. B. (2000). Dimethyl sulfide in the Southern Ocean: Seasonality and flux. J. Geophys. Res. 205, 20451–20459. doi:10.1029/2000jd900176
Curran, M. A. J., van Ommen, T. D., Morgan, V. I., Phillips, K. L., and Palmer, A. S. (2003). Ice core evidence for Antarctic sea ice decline since the 1950s. Science 302, 1203–1206. doi:10.1126/science.1087888
Dalaiden, Q., Goosse, H., Rezsöhazy, J., and Thomas, E. R. (2021). Reconstructing atmospheric circulation and sea-ice extent in the West Antarctic over the past 200 years using data assimilation. Clim. Dyn. 57, 3479–3503. doi:10.1007/s00382-021-05879-6
Dansgaard, W. (1964). Stable isotopes in precipitation. Tellus 16, 436–468. doi:10.1111/j.2153-3490.1964.tb00181.x
de Leeuw, G., Andreas, E. L., Anguelova, M. D., Fairall, C. W., Lewis, E. R., O'Dowd, C., et al. (2011). Production flux of sea spray aerosol. Rev. Geophys. 49, RG2001. doi:10.1029/2010rg000349
Eayrs, C., Holland, D., Francis, D., Wagner, T., Kumar, R., and Li, X. (2019). Understanding the seasonal cycle of antarctic sea ice extent in the context of longer‐term variability. Rev. Geophys. 57, 1037–1064. doi:10.1029/2018rg000631
Emanuelsson, B. D., Bertler, N. A. N., Neff, P. D., Renwick, J. A., Markle, B. R., Baisden, W. T., et al. (2018). The role of Amundsen–Bellingshausen Sea anticyclonic circulation in forcing marine air intrusions into West Antarctica. Clim. Dyn. 51, 3579–3596. doi:10.1007/s00382-018-4097-3
Fischer, H., Traufetter, F., Oerter, H., Weller, R., and Miller, H. (2004). Prevalence of the antarctic circumpolar wave over the last two millenia recorded in dronning maud Land ice. Geophys. Res. Lett. 31, L08202. doi:10.1029/2003gl019186
Fogt, R. L., Wovrosh, A. J., Langen, R. A., and Simmonds, I. (2012). The characteristic variability and connection to the underlying synoptic activity of the Amundsen-Bellingshausen Seas Low. J. Geophys. Res. 117. doi:10.1029/2011jd017337
Fogt, R. L., and Wovrosh, A. J. (2015). The relative influence of tropical sea surface temperatures and radiative forcing on the Amundsen Sea low. J. Clim. 28, 8540–8555. doi:10.1175/jcli-d-15-0091.1
Frey, M. M., Norris, S. J., Brooks, I. M., Anderson, P. S., Nishimura, K., Yang, X., et al. (2020). First direct observation of sea salt aerosol production from blowing snow above sea ice. Atmos. Chem. Phys. 20, 2549–2578. doi:10.5194/acp-20-2549-2020
Gabric, A. J., Shephard, J. M., Knight, J. M., Jones, G., and Trevena, A. J. (2005). Correlations between the satellite-derived seasonal cycles of phytoplankton biomass and aerosol optical depth in the Southern Ocean: Evidence for the influence of sea ice. Glob. Biogeochem. Cycles 29, GB4018. doi:10.1029/2005gb002546
Gautier, E., Savarino, J., Erbland, J., Lanciki, A., and Possenti, P. (2016). Variability of sulfate signal in ice core records based on five replicate cores. Clim. Past. 12, 103–113. doi:10.5194/cp-12-103-2016
Gondwe, M., Krol, M., Gieskes, W., Klassen, W., and de Baar, H. (2003). The contribution of ocean-leaving DMS to the global atmospheric burden of DMS, MSA, SO2, and NSS SO4=. Glob. Biogeochem. Cycles 17 (2), 1056. doi:10.1029/2002gb001937
Gragnani, R., Smiraglia, C., Stenni, B., and Torcini, S. (1998). Chemical and isotopic profiles from snow pits and shallow firn cores on Campbell Glacier, northern Victoria Land, Antarctica. Ann. Glaciol. 27, 679–684. doi:10.3189/1998aog27-1-679-684
Han, Y., Jun, S. J., Miyahara, M., Lee, H.-G., Ahn, J., Chung, J.-W., et al. (2015). Shallow ice-core drilling on Styx glacier, northern Victoria Land, Antarctica in the 2014–2015 summer. jgsk. 51, 343. (in Korean). doi:10.14770/jgsk.2015.51.3.343
Hara, K., Osada, K., Kido, M., Hayashi, M., Matsunaga, K., Iwasaka, Y., et al. (2004). Chemistry of sea-salt particles and inorganic halogen species in Antarctic regions: Compositional differences between coastal and inland stations. J. Geophys. Res. 109, D20208. doi:10.1029/2004jd004713
Hara, K., Osada, K., Yabuki, M., Matoba, S., Hirabayashi, M., Fujita, S., et al. (2020). Atmospheric sea-salt and halogen cycles in the Antarctic. Environ. Sci. Process. Impacts 22, 2003–2022. doi:10.1039/d0em00092b
Hara, K., Osada, K., Yabuki, M., and Yamanouchi, T. (2012). Seasonal variation of fractionated sea-salt particles on the Antarctic coast. Geophys. Res. Lett. 39. doi:10.1029/2012gl052761
Hong, S.-B., Hur, S.-D., Kim, S.-M., Hong, S., Chung, J.-W., Kang, N., et al. (2012). Uncertainties of ionic species in snowpit samples determined with ion chromatography system. Anal. Sci. Technol. 25, 350–363. (in Korean). doi:10.5806/AST.2012.25.6.350
Hosking, J. S., Orr, A., Marshall, G. J., Turner, J., and Phillips, T. (2013). The influence of the Amundsen–Bellingshausen Seas Low on the climate of West Antarctica and its representation in coupled climate model simulations. J. Clim. 26, 6633–6648. doi:10.1175/jcli-d-12-00813.1
Jang, Y., Hong, S. B., Buizert, C., Lee, H-G., Han, S-Y., Yang, J-W., et al. (2019). Very old firn air linked to strong density layering at Styx Glacier, coastal Victoria Land, East Antarctica. Cryosphere 13, 2407–2419. doi:10.5194/tc-13-2407-2019
Kärkäs, E., Teinilä, K., Virkkula, A., and Aurela, M. (2005). Spatial variations of surface snow chemistry during two austral summers in western Dronning Maud Land, Antarctica. Atmos. Environ. 39, 1405–1416. doi:10.1016/j.atmosenv.2004.11.027
Kester, D., Duedall, I., Connors, D., and Pytkowicz, R. (1967). Preparation of artificial seawater. Limnol. Oceanogr. 12, 176–179. doi:10.4319/lo.1967.12.1.0176
Kreutz, K. J., Mayewski, P. A., Pittalwala, I. I., Meeker, L. D., Twickler, M. S., and Whitlow, S. I. (2000). Sea level pressure variability in the Amundsen Sea region inferred from a West Antarctic glaciochemical record. J. Geophys. Res. 105, 4047–4059. doi:10.1029/1999jd901069
Kwak, H., Kang, J.-H., Hong, S.-B., Lee, J., Chang, C., Hur, S. D., et al. (2015). A study on high-resolution seasonal variations of major ionic species in recent snow near the Antarctic Jang Bogo station. Ocean Polar Res. 37, 127–140. (in Korean). doi:10.4217/opr.2015.37.2.127
Lana, A., Bell, T. G., Vallina, S. M., Ballabrera-Poy, J., Kettle, A. J., Dachs, J., et al. (2011). An updated climatology of surface dimethlysulfide concentrations and emission fluxes in the global ocean. Glob. Biogeochem. Cycles 25. doi:10.1029/2010gb003850
Legrand, M., and Wagenbach, D. (1999). Impact of the Cerro Hudson and Pinatubo volcanic eruptions on the Antarctic air and snow chemistry. J. Geophys. Res. 104, 1581–1596. doi:10.1029/1998jd100032
Li, X., Holland, D. M., Gerber, E. P., and Yoo, C. (2015). Rossby waves mediate impacts of tropical oceans on West Antarctic atmospheric circulation in austral winter. J. Clim. 28, 8151–8164. doi:10.1175/jcli-d-15-0113.1
Mangoni, O., Saggiomo, V., Bolinesi, F., Margiotta, F., Budillon, G., Cotroneo, Y., et al. (2017). Phytoplankton blooms during austral summer in the Ross Sea, Antarctica: Driving factors and trophic implications. PLoS ONE 12, e0176033. doi:10.1371/journal.pone.0176033
Markle, B. R., Bertler, N. A. N., Sinclair, K. E., and Sneed, S. B. (2012). Synoptic variability in the Ross Sea region, Antarctica, as seen from back-trajectory modeling and ice core analysis. J. Geophys. Res. 117. doi:10.1029/2011jd016437
Marshall, G. J., and Thompson, D. W. J. (2016). The signatures of large‐scale patterns of atmospheric variability in Antarctic surface temperatures. J. Geophys. Res. Atmos. 121, 3276–3289. doi:10.1002/2015jd024665
Mayewski, P. A., Carleton, A. M., Birkel, S. D., Dixon, D., Kurbatov, A. V., Korotkikh, E., et al. (2017). Ice core and climate reanalysis analogs to predict Antarctic and Southern Hemisphere climate changes. Quat. Sci. Rev. 155, 50–66. doi:10.1016/j.quascirev.2016.11.017
Mayewski, P. A., Meredith, M. P., Summerhayes, C. P., Turner, J., Worby, A., Barrett, P. J., et al. (2009). State of the antarctic and Southern Ocean climate system. Rev. Geophys. 47, RG1003. doi:10.1029/2007rg000231
Mezgec, K., Stenni, B., Crosta, X., Masson-Delmotte, V., Baroni, C., Braida, M., et al. (2017). Holocene sea ice variability driven by wind and polynya efficiency in the Ross Sea. Nat. Commun. 8, 1334. doi:10.1038/s41467-017-01455-x
Minikin, A., Legrand, M., Hall, J., Wagenbach, D., Kleefeld, C., Wolff, E., et al. (1998). Sulfur-containing species (sulfate and methanesulfonate) in coastal Antarctic aerosol and precipitation. J. Geophys. Res. 103, 10975–10990. doi:10.1029/98jd00249
Minikin, A., Wagenbach, D., Graf, W., and Kipfstuhl, J. (1994). Spatial and seasonal variations of the snow chemistry at the central Filchner-Ronne Ice Shelf, Antarctica. Ann. Glaciol. 20, 283–290. doi:10.3189/1994aog20-1-283-290
Mo, K. C., and Paegle, J. N. (2001). The Pacific-South American modes and their downstream effects. Int. J. Climatol. 21, 1211–1229. doi:10.1002/joc.685
Mo, K. C. (2000). Relationships between low-frequency variability in the southern Hemisphere and sea surface temperature anomalies. J. Clim. 13, 3599–3610. doi:10.1175/1520-0442(2000)013<3599:rblfvi>2.0.co;2
Nyamgerel, Y., Han, Y., Kim, S., Hong, S.-B., Lee, J., and Hur, S. D. (2020). Chronological characteristics for snow accumulation on Styx Glacier in northern Victoria Land, Antarctica. J. Glaciol. 66, 916–926. doi:10.1017/jog.2020.53
Nyamgerel, Y., Hong, S.-B., Han, Y., Kim, S., Lee, J., and Hur, S.-D. (2021). Snow-pit record from a coastal Antarctic site and its preservation of meteorological features. Earth Interact. 25, 108–118. doi:10.1175/ei-d-20-0018.1
Ohshima, K., Nihashi, S., and Iwamoto, K. (2016). Global view of sea-ice production in polynyas and its linkage to dense/bottom water formation. Geosci. Lett. 3, 13–14. doi:10.1186/s40562-016-0045-4
Osman, M., Das, S. B., Marchal, O., and Evans, M. J. (2017). Methanesulfonic acid (MSA) migration in polar ice: Data synthesis and theory. Cryosphere 11, 2439–2462. doi:10.5194/tc-11-2439-2017
Park, J., Kim, H.-C., Jo, Y.-H., Kidwell, A., and Hwang, J. (2018). Multi-temporal variation of the Ross Sea polynya in response to climate forcings. Polar Res. 37, 1444891. doi:10.1080/17518369.2018.1444891
Parkinson, C. L. (2019). A 40-y record reveals gradual Antarctic sea ice increases followed by decreases at rates far exceeding the rates seen in the Arctic. Proc. Natl. Acad. Sci. U. S. A. 116, 14414–14423. doi:10.1073/pnas.1906556116
Pasteris, D. R., McConnell, J. R., Das, S. B., Criscitiello, A. S., Evans, M. J., Maselli, O. J., et al. (2014). Seasonally resolved ice core records from West Antarctica indicate a sea ice source of sea-salt aerosol and a biomass burning source of ammonium. J. Geophys. Res. Atmos. 119, 9168–9182. doi:10.1002/2013jd020720
Piccardi, G., Casella, F., and Udisti, R. (1996). Non-sea-salt contribution of some chemical species to the snow composition at Terra Nova Bay (Antarctica). Int. J. Environ. Anal. Chem. 63, 207–223. doi:10.1080/03067319608026267
Rankin, A. M., Auld, V., and Wolff, E. W. (2000). Frost flowers as a source of fractionated sea salt aerosol in the polar regions. Geophys. Res. Lett. 27, 3469–3472. doi:10.1029/2000gl011771
Raphael, M. N., Marshall, G. J., Turner, J., Fogt, R. L., Schneider, D., Dixon, D. A., et al. (2016). The Amundsen Sea low: Variability, change, and impact on antarctic climate. Bull. Am. Meteorol. Soc. 97, 111–121. doi:10.1175/bams-d-14-00018.1
Rhodes, R. H., Bertler, N. A. N., Baker, J. A., Sneed, S. B., Oerter, H., and Arrigo, K. R. (2009). Sea ice variability and primary productivity in the Ross Sea, Antarctica, from methylsulphonate snow record. Geophys. Res. Lett. 36, L10704. doi:10.1029/2009gl037311
Rhodes, R. H., Bertler, N. A. N., Baker, J. A., Steen-Larsen, H. C., Sneed, S. B., Morgenstern, U., et al. (2012). Little Ice Age climate and oceanic conditions of the Ross Sea, Antarctica from a coastal ice core record. Clim. Past. 8, 1223–1238. doi:10.5194/cp-8-1223-2012
Ro, S., Hur, S.-D., Hong, S., Chang, C., Moon, J., Han, Y., et al. (2020). An improved ion chromatography system coupled with a melter for high-resolution ionic species reconstruction in Antarctic firn cores. Microchem. J. 159, 105377. doi:10.1016/j.microc.2020.105377
Scarchilli, C., Frezzotti, M., and Ruti, P. M. (2011). Snow precipitation at four ice core sites in East Antarctica: Provenance, seasonality and blocking factors. Clim. Dyn. 37, 2107–2125. doi:10.1007/s00382-010-0946-4
Severi, M., Becagli, S., Caiazzo, L., Ciardini, V., Colizza, E., Giardi, F., et al. (2017). Sea salt sodium record from Talos Dome (East Antarctica) as a potential proxy of the Antarctic past sea ice extent. Chemosphere 177, 266–274. doi:10.1016/j.chemosphere.2017.03.025
Severi, M., Becagli, S., Castellano, E., Morganti, A., Traversi, R., and Udisti, R. (2009). Thirty years of snow deposition at talos Dome (northern Victoria Land, East Antarctica): Chemical profiles and climatic implications. Microchem. J. 92, 15–20. doi:10.1016/j.microc.2008.08.004
Silvano, A., Foppert, A., Rintoul, S. R., Holland, P. R., Tamura, T., Kimura, N., et al. (2020). Recent recovery of antarctic bottom water formation in the Ross Sea driven by climate anomalies. Nat. Geosci. 13, 780–786. doi:10.1038/s41561-020-00655-3
Sinclair, K. E., Bertler, N. A. N., Bowen, M. M., and Arrigo, K. R. (2014). Twentieth century sea-ice trends in the Ross Sea from a high-resolution, coastal ice-core record. Geophys. Res. Lett. 41, 3510–3516. doi:10.1002/2014gl059821
Sinclair, K. E., Bertler, N. A. N., Trompetter, W. J., and Baisden, W. T. (2013). Seasonality of airmass pathways to coastal Antarctica: Ramifications for interpreting high-resolution ice core records. J. Clim. 26, 2065–2076. doi:10.1175/jcli-d-12-00167.1
Sinclair, K. E., Bertler, N. A. N., and Trompetter, W. J. (2010). Synoptic controls on precipitation pathways and snow delivery to high-accumulation ice core sites in the Ross Sea region, Antarctica. J. Geophys. Res. 115, D22112. doi:10.1029/2010jd014383
Sinclair, K. E., Bertler, N. A. N., and van Ommen, T. D. (2012). Twentieth-century surface temperature trends in the western Ross Sea, Antarctica: Evidence from a high-resolution ice core. J. Clim. 25, 3629–3636. doi:10.1175/jcli-d-11-00496.1
Smith, W. O., and Comiso, J. C. (2008). Influence of sea ice on primary production in the Southern Ocean: A satellite perspective. J. Geophys. Res. 113, C05S93. doi:10.1029/2007jc004251
Steig, E. J., Hart, C. P., White, J. W. C., Cunningham, W. L., Davis, M. D., and Saltzman, E. S. (1998). Changes in climate, ocean and ice-sheet conditions in the Ross embayment, Antarctica, at 6ka. Ann. Glaciol. 27, 305–310. doi:10.3189/1998aog27-1-305-310
Stenni, B., Serra, F., Frezzotti, M., Maggi, V., Traversi, R., Becagli, S., et al. (2000). Snow accumulation rates in northern Victoria Land, Antarctica, by firn-core analysis. J. Glaciol. 46, 541–552. doi:10.3189/172756500781832774
Stohl, A., and Sodemann, H. (2010). Characteristics of atmospheric transport into the Antarctic troposphere. J. Geophys. Res. 115, D02305. doi:10.1029/2009JD012536
Thomas, E. R., and Abram, N. J. (2016). Ice core reconstruction of sea ice change in the Amundsen‐Ross Seas since 1702 A.D. Geophys. Res. Lett. 43, 5309–5317. doi:10.1002/2016gl068130
Truong, S. C. H., Huang, Y., Lang, F., Messmer, M., Simmonds, I., Siems, S. T., et al. (2020). A climatology of the marine atmospheric boundary layer over the Southern Ocean from four field campaigns during 2016-2018. J. Geophys. Res. Atmos. 125, e2020JD033214. doi:10.1029/2020JD033214
Turner, J., Phillips, T., Hosking, J. S., Marshall, G. J., and Orr, A. (2013). The Amundsen Sea low. Int. J. Climatol. 33, 1818–1829. doi:10.1002/joc.3558
Udisti, R., Becagli, S., Castellano, E., Traversi, R., Vermigli, S., and Piccardi, G. (1999). Sea-spray and marine biogenic seasonal contribution to snow composition at Terra Nova Bay, Antarctica. Ann. Glaciol. 29, 77–83. doi:10.3189/172756499781820923
Udisti, R., Traversi, R., Becagli, S., and Piccardi, G. (1998). Spatial distribution and seasonal pattern of biogenic sulphur compounds in snow from northern Victoria Land, Antarctica. Ann. Glaciol. 27, 535–542. doi:10.3189/1998aog27-1-535-542
Vega, C. P., Isaksson, E., Schlosser, E., Divine, D., Martma, T., Mulvaney, R., et al. (2018). Variability of sea salts in ice and firn cores from fimbul ice shelf, dronning maud Land, Antarctica. Cryosphere 12, 1681–1697. doi:10.5194/tc-12-1681-2018
Wenta, M., and Cassano, J. J. (2020). The atmospheric boundary layer and surface conditions during katabatic wind events over the Terra Nova Bay polynya. Remote Sens. 12, 4160. doi:10.3390/rs12244160
Williams, J., de Reus, M., Krejci, R., Fischer, H., and Strom, J. (2002). Application of the variability-size relationship to atmospheric aerosol studies: Estimating aerosol lifetimes and ages. Atmos. Chem. Phys. 2, 133–145. doi:10.5194/acp-2-133-2002
Winstrup, M., Vallelonga, P., Kjaer, H. A., Fudge, T. J., Lee, J. E., Riis, M. H., et al. (2019). A 2700-year annual timescale and accumulation history for an ice core from Roosevelt Island, West Antarctica. Clim. Past. 15, 751–779. doi:10.5194/cp-15-751-2019
Wolff, E. W., Cook, E., Barnes, P. R. F., and Mulvaney, R. (2005). Signal variability in replicate ice cores. J. Glaciol. 51, 462–468. doi:10.3189/172756505781829197
Yang, J.-W., Han, Y., Orsi, A. J., Kim, S.-J., Han, H., Ryu, Y., et al. (2018b). Surface temperature in twentieth century at the Styx Glacier, northern Victoria Land, Antarctica, from borehole thermometry. Geophys. Res. Lett. 45, 9834–9842. doi:10.1029/2018gl078770
Yang, L., Sun, L., Emslie, S. D., Xie, Z., Huang, T., Gao, Y., et al. (2018a). Oceanographic mechanisms and penguin population increases during the little ice age in the southern Ross Sea, Antarctica. Earth Planet. Sci. Lett. 481, 136–142. doi:10.1016/j.epsl.2017.10.027
Yuan, X., and Li, C. (2008). Climate modes in southern high latitudes and their impacts on Antarctic sea ice. J. Geophys. Res. 113, C06S91. doi:10.1029/2006JC004067
Yuan, X., and Martinson, D. G. (2001). The Antarctic dipole and its predictability. Geophys. Res. Lett. 28, 3609–3612. doi:10.1029/2001gl012969
Keywords: Ross Sea, Styx firn cores, sea salt sodium, methanesulfonate, Pacific–South American mode, Ross Sea polynya
Citation: Ro S, Hong S-B, Kim J-H, Han Y, Hur SD, Kang J-H, Kim S, Lim C, Chang C, Moon J, Kim S-J and Hong S (2022) Variability of sea salt and methanesulfonate in firn cores from northern Victoria Land, Antarctica: Their links to oceanic and atmospheric condition variability in the Ross Sea. Front. Earth Sci. 10:896470. doi: 10.3389/feart.2022.896470
Received: 15 March 2022; Accepted: 09 August 2022;
Published: 06 September 2022.
Edited by:
Zoe Courville, Cold Regions Research and Engineering Laboratory, United StatesReviewed by:
Andrea Spolaor, National Research Council (CNR), Italy, Keiichiro Hara,Fukuoka University, JapanCopyright © 2022 Ro, Hong, Kim, Han, Hur, Kang, Kim, Lim, Chang, Moon, Kim and Hong. This is an open-access article distributed under the terms of the Creative Commons Attribution License (CC BY). The use, distribution or reproduction in other forums is permitted, provided the original author(s) and the copyright owner(s) are credited and that the original publication in this journal is cited, in accordance with accepted academic practice. No use, distribution or reproduction is permitted which does not comply with these terms.
*Correspondence: Sang-Bum Hong, hong909@kopri.re.kr; Sungmin Hong, smhong@inha.ac.kr