Riverine microplastic contamination in southwest Germany: A large-scale survey
 Isabella Schrank1†
  Martin G. J. Löder1†*
  Hannes K. Imhof1
  Sonya R. Moses1 Maren Heß2 Julia Schwaiger3
  Christian Laforsch1*
- 1Animal Ecology I and BayCEER, University of Bayreuth, Bayreuth, Germany
- 2Landesamt für Natur, Umwelt und Verbraucherschutz Nordrhein-Westfalen, Recklinghausen, Germany
- 3Bayerisches Landesamt für Umwelt, Augsburg, Germany
Microplastic (MP) contamination of freshwater ecosystems is still in the focus of research and public attention, as aquatic environments have a high ecological, economic, and recreational value. We now know that rivers do not only function as pathways of MPs into oceans but may also act as temporary MP sinks. However, due to methodological differences, the comparability of studies on MP contamination of rivers is still limited. To compare MP contamination between different river systems, to analyze if there is a constant increase in MP contamination from the upper to the lower course of the river, and to investigate if there are distinct MP distribution patterns, we set up a large-scale survey. We chose two large river systems, the Rhine and Danube catchments with their tributaries and sampled 23 rivers of different sizes at 53 sampling locations in southwest Germany. Surface water sampling, sample processing, and analysis were performed with the same methodology to obtain comparable results on MP number, polymer type, and particle’s size and shape. Fully quantitative data were generated down to 300 µm by using a manta trawl net with a 300-µm mesh size for sampling. Nevertheless, we also included the non-quantitative sampled fraction of particles down to a size of 20 µm in our FTIR analysis after plastic-friendly sample purification by enzymatic oxidative treatment. Plastic concentrations recorded in surface water at the sampling locations ranged from 0.7 to 354.9 particles/m³. Concerning all samples, the number of particles increased toward lower size classes (61.0 ± 34.2% below 300 µm), and fragments were the prevailing shape (90.7 ± 13.6%). Polyethylene (49.2 ± 25.9%) and polypropylene (33.2 ± 22.6%) were the most frequent polymer types. Our survey did not reveal distinct MP distribution patterns or a constant increase of MP abundance within river courses in the investigated river systems. Next, to provide a large-scale dataset of microplastic contamination in surface waters of southwest Germany, our study shows that a representative sampling of MPs in rivers is challenging. MP particles are not homogeneously distributed in rivers, and this indicates that spatial and temporal changes in MP abundance should always be considered in MP monitoring approaches.
1 Introduction
Products made from plastics are of great importance in our modern daily life. This is one of the reasons why the history of plastic is an economic success story. Due to this fact, global plastic production is still on the rise and so is, simultaneously, the demand for single-use plastic products for packaging. As a consequence, large amounts of plastic waste are generated. In 2018, 29.1 million tons of plastic litter was introduced into the official European waste streams (Plastics Europe, 2020). However, not all post-consumer products are currently recycled. In Europe, the proportion used for recycling was estimated to account for 32.5% in 2018. The remainder of plastic waste is used for energy recovery by incineration or dumped in landfills. In addition to these managed end-of-life routes, a considerable proportion of plastic waste is carelessly discarded into the environment. In this context, the World Economic Forum, 2016 has calculated that globally every year approximately 32% of plastic packaging material alone is improperly disposed into the environment. However, littering is only one pathway by which plastic debris enters terrestrial and aquatic environments. Other sources are, for example, wind transport from landfills or construction sites, industrial or agricultural run-offs, wastewater treatment plant (WWTP) effluents, combined sewer overflows, or stormwater run-offs (Dris et al., 2018; Eerkes-Medrano and Thompson, 2018)—and this list is still incomprehensive.
Once in the environment, larger plastic items fragment by physical, chemical, and biological weathering into ever smaller particles called microplastics (MPs), which are, by current definition, smaller than 5 mm (Wagner and Lambert, 2018). As these MPs originate from larger items, they are also referred to as secondary MPs (Hartmann et al., 2019). Fibers from clothing fall into this category as well (Dris et al., 2017). By contrast, primary MPs are produced in the MP size range, for example, raw plastic pellets, particles used in cosmetic products such as toothpaste and peelings, or air-blasting media (Fendall and Sewell, 2009; Gregory, 2009; Zitko and Hanlon, 1991). There is still no common definition of MPs, and there is an ongoing debate on which materials besides commodity plastics are to be included and if paint particles or tire wear have to be numbered among MPs (Hartmann et al., 2019). Due to the extremely heterogeneous nature of MPs, concerning size, shape, polymer chemistry, additives, and weathering state, the ecological effects can be highly diverse; thus, the potential risks of MPs entering the environment are still barely understood and discussed controversially (Imhof et al., 2013; Rochman et al., 2016; Koelmans et al., 2017; Bucci et al., 2020). Nevertheless, to assess the risk of MP, it is indispensable to know the environmental exposure of organisms and therefore also to quantify environmental contamination.
Initially, MP research focused on the contamination of the marine environment, but during the last years, studies revealed that limnetic systems are affected to a similar level (e.g. Xu et al., 2020; Dris et al., 2018; Eerkes-Medrano and Thompson, 2018; Imhof et al., 2018; Jiang, 2018; Wagner et al., 2014). Numerous studies dealing with plastic waste in rivers in general have mainly addressed the fact that they play a crucial role as transport routes for plastic into the oceans (Siegfried et al., 2017; Jambeck et al., 2015; Acha et al., 2003). In this context, it has been estimated that every year between 1.15 and 2.41 million tons or more of plastic are introduced via rivers into the oceans (Lebreton et al., 2017; Schmidt C. et al., 2017), and a large amount of marine beach litter originates from riverine input (Veerasingam et al., 2016; Araújo and Costa, 2007). However, rivers are not only vectors for MPs to the marine system but also they represent important environments per se and act, at least temporarily, as a sink when MPs are deposited in riverbed sediments (Hurley et al., 2018; Kooi et al., 2018). Therefore, as reflected in Skalska et al. (2020), the number of studies with bare focus on MP contamination of rivers is increasing, but a large picture is still missing.
The available data on MPs reported for rivers cover mainly MP numbers in surface water and span a wide range of contamination levels; however, they are often reported in different units. Mani et al. (2015), for instance, normalized their data to the surface area and reported 892,777 particles/km2 in the surface water of the Rhine River with a maximum concentration of 3.9 million particles/km2, and Di and Wang (2018) normalized to volume and reported 1,597 to 12,611 particles/m3 on average in the 2,516.7 ± 911.7 particles/m3 for the Yangtze River. Leslie et al. (2017) detected 48–187 MP particles/L in surface water samples in a canal in Amsterdam, and Scherer et al. (2020) reported a mean MP number of 5.57 particles/m3 in surface water of the Elbe River. As indicated by the given examples, the comparability of data is often limited due to the differences in reported units, extraction, purification, analysis, and the reported MP size classes often differ between studies (Hidalgo-Ruz et al., 2012; Driedger et al., 2015; Löder and Gerdts, 2015; Hale et al., 2020). This issue has been addressed early in MP research by many scientists; however, standardized protocols are still lacking.
Although the behavior of the extremely heterogeneous group of MP particles within highly dynamic fluvial systems is poorly understood, some of the present studies (Scherer et al., 2020; Leslie et al., 2017) potentially hint toward patterns or trends with, for example, higher or lower abundances, within the course of the river. Nevertheless, we still do not really understand the general role of different point (e.g., WWTPs and sewer overflows) and diffuse (e.g., industrial or agricultural run-offs and cities) MP sources in the catchment area of a river on MP contamination and if these lead to distinct contamination patterns, which explain differences between rivers. Furthermore, with respect to spatial variation, it is unclear if there is a constant increase of MP numbers from the headwaters to the lower reaches of a river. Furthermore, temporal variation patterns of MP contamination at a fixed location are also largely unknown. An attempt to address these questions can only be made by utilizing larger and comparable datasets.
In order to generate such a larger and intra-survey comparable MP dataset, we chose two large river systems, the Rhine and Danube catchments with its tributaries, and conducted a large-scale MP survey at 23 rivers of different size at 53 sampling locations in southwest Germany. Our research aims were (I) to compare MP contamination between different river systems; (II) to investigate if there are distinct MP distribution patterns with respect to urban input, WWTP inlets, or inflow of tributaries in the respective catchment; (III) to analyze if there is a constant increase in MP contamination from the upper to the lower course of a river; and (IV) to address potential temporal variation of MP concentration at selected locations of three rivers. Best possible comparability with other studies was facilitated by sampling with a frequently applied manta trawl with a mesh size of 300 µm (Mani and Burkhardt-Holm, 2020; Kataoka et al., 2019; Faure et al., 2015). We chose a plastic conserving purification approach via enzymatic-oxidative treatment and FTIR spectroscopy for MP analyses to ensure reliable identification of a wide range of plastic types (Löder et al., 2017; Möller et al., 2021).
2 Methods
2.1 Sampling the water surface
2.1.1 Large-scale MP survey
In total, 53 water surface samples were collected from 23 rivers in the Rhine and Danube catchment areas in southwestern Germany (Figure 1) from 2014 to 2017 using a manta trawl. This large-scale survey has been conducted in collaboration with five German federal environmental state offices and resulted in a first pilot report (Heß et al., 2018). The pilot report does, however, not include the whole dataset as presented here; therefore, values reported might deviate slightly. For detailed information concerning the recorded data, sampling dates, and coordinates, please refer to the Supplementary Table S1.
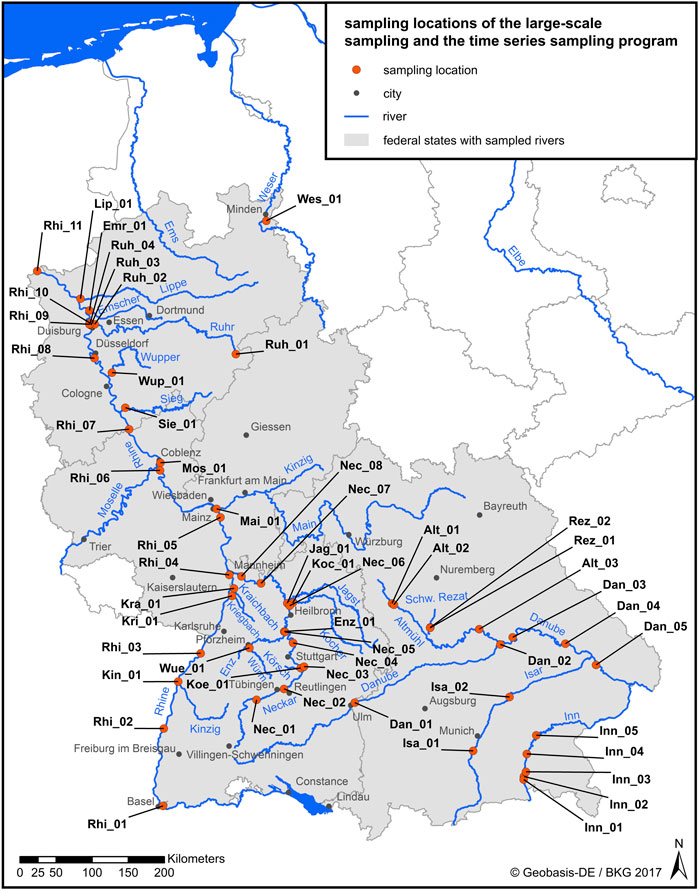
FIGURE 1. Large-scale MP survey at 53 sample locations of 23 rivers in five federal states in the southwestern part of Germany.
The manta trawl used for sampling had a net opening of 30 × 15 cm and a net with a mesh size of 300 µm (HYDRO-BIOS Apparatebau GmbH, Kiel–Altenholz, Germany). The manta trawl sampled the upper 15 cm of the water surface. A stainless steel flowmeter (OTT HydroMet GmbH, Kempten, Germany) was mounted in the net opening of the manta trawl to determine the sampled water volume. The manta trawl was trawled beside a boat with the help of a crane or an outrigger. Where no boat was available or the river was too small for a boat, the manta trawl was launched from the middle of a bridge on a rope. Due to handling reasons, a net length of 1 m was used for smaller rivers or stationary sampling points and a net length of 2 m was used for larger rivers. The duration of trawling was between 15 and 20 min, depending on the flow velocity of the river and the suspended matter concentration. On rare occasions, longer trawling times (up to 35 min) were conducted for rivers with a lower flow velocity. Shorter trawls (down to 8 min) were conducted for streams or rivers with a high flow velocity or with a high content of suspended matter to avoid clogging of the net. Trawl location, trawl length (GPS track), duration of sampling, and sampled volume were recorded. Sampled water volumes ranged between 7.0 and 74.9 m³ with a mean sampling volume of 31.5 ± 17.2 m³. After trawling, the concentrated samples were rinsed with Milli-Q® into glass jars (J. Weck GmbH u. Co. KG, Germany). All samples were stored in cool and dark place until further processing. Before sample processing, larger items of natural origin (e.g., leaves, insects, and wood sticks) were removed with tweezers and thoroughly rinsed using a self-designed pressure-driven rinsing bottle (plastic-free) in the sequence 1) Milli-Q®, 2) ethanol (35%), and 3) Milli-Q® to ensure that attached MPs were not lost. All liquids for rinsing were filtered with 0.2-µm pore size as described later in detail.
2.1.2 Repeated sampling for temporal variation of MPs
Selected locations of the Rivers Schwäbische Rezat, Rhine, and Ruhr were sampled repeatedly to investigate the temporal variation of MP concentrations. Please refer to the Supplementary Table S3 for detailed information concerning dates, coordinates, and sampled volume. The small Schwäbische Rezat River was sampled at two locations up and downstream of a WWTP outlet (Rez_01 and Rez_02) during the large-scale sampling program in 2015. A repeated sampling took place at both locations in 2016 when three consecutive replicate samples (each with 20 min trawl duration) were collected, always with a temporal distance of ca. 0.5 h in between. The river mouth of the Ruhr River (Ruh_04) was already sampled in 2015 during the large-scale sampling program. In 2017, this location (Ruh_04) and two new selected locations of the Rhine River, upstream (Rhe_09) and downstream (Rhe_10) of the river mouth of the Ruhr, were sampled at four different time points each (Figure 2). In total, three samples were taken during 1 day (0 h, 5 h, and 22 h) to address daily variation in MP abundance. The fourth sampling at these three points was conducted after 141 days. The sampling procedure during the repeated sampling studies was equal to the large-scale sampling program and sampled water volumes ranged from 3.2 to 50.5 m³ (mean: 27.9 ± 15.2 m³, Supplementary Table S3).
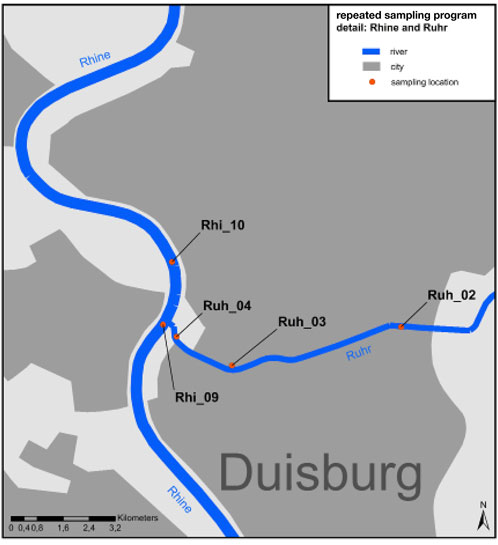
FIGURE 2. Repeated sampling program at two locations of the Rhine River (Rhi_09 upstream of the Ruhr River and Rhi_10 downstream of the Ruhr River) and one location at the mouth of the Ruhr River (Ruh_04).
2.2 Sample preparation
All samples underwent a size fractionation using a 500-µm stainless steel sieve before particle identification, as described by Löder et al. (2017). The sample size fraction >500 µm was transferred to a plankton counting chamber (Bogorov type), and all potential plastic particles were conservatively sorted out, photo-documented, and measured under a stereomicroscope (Leica M50, Leica Microsystems GmbH, Germany) equipped with a digital camera for microscopy (Olympus DP26, 5 Megapixel, Olympus Corporation, Japan) and the software CellSens Dimension (Olympus Corporation, Japan). All potential plastic particles were afterwards analyzed via attenuated total reflection (ATR)-FTIR spectroscopy.
The MP size fraction <500 µm was purified from the organic and inorganic sample matrix, according to Löder et al. (2017), with a step-wise enzymatic-oxidative purification protocol consisting of sequential enzymatic steps, wet peroxide oxidation using the Fenton protocol, and a density separation step. This approach secures reliable focal plane array (FPA)–based micro-FTIR imaging data with minimal matrix interferences. In addition, the sequential enzymatic-purification protocol is a very gentle purification method for MP (Schrank et al., 2022). The purified samples were filtered using anodisc filters (Whatman, 0.2-µm pore size, 25-mm diameter, GE Healthcare, Chalfont St Giles, United Kingdom) with a custom-made round glass filter funnel of 10-mm diameter for the subsequent micro-FTIR measurement. Because an excessive amount of particulate material on the filter can hamper an accurate spectroscopic analysis, subsampling was performed to obtain a sufficiently small subsample. In this context, two strategies have been applied: A) if the original concentrated water sample had a high load of suspended material, the sample was homogenized by stirring and a custom-made stainless steel quartering cross was placed into the glass jars (∼850 ml, J. Weck GmbH u. Co. KG, Germany) containing the sample (Supplementary Figure S1). Then the sample was frozen at −20°C. When frozen, one random quarter of the sample was obtained and further processed. B) If too much particulate material remained after the enzymatic-oxidative purification, the sample was homogenized, and only a subsample was filtered on the anodisc filter for analysis.
2.3 Contamination prevention measures
Sample contamination was prevented according to the precautions described in Löder et al. (2017). All liquids used for rinsing were filtered with appropriate filters with 0.2-µm pore size (Merck KGaA, Germany). Blank samples were generated with filtered (0.2-µm pore size) Milli-Q® water and underwent the same laboratory processes and analysis as the environmental samples. As not all samples could be processed at once, they were processed consecutively in batches. For each processed batch, one blank sample was generated. A total of eight blanks reflecting eight batches were generated for the large-scale sampling program. Furthermore, four blanks reflecting four processed batches were generated each for the short-term intervals (0 h, 5 h, 22 h) and for the long-term interval (141 days) of the time-scale sampling program.
2.4 Measurement and analysis
The identification of all potential plastic particles of the size fraction >500 µm was performed with ATR-FTIR spectroscopy, and the size fraction <500 µm was analyzed with FPA-based micro-FTIR analysis using anodisc filters-both methods were applied according to Löder et al. (2015). ATR-FTIR spectroscopy of each potential plastic particle >500 µm was performed using a “Tensor 27” FTIR spectrometer with a platinum ATR unit (Bruker Optik GmbH, Ettlingen, Germany), internal L-alanine–doped deuterated triglycine sulfate (DLaTGS) single detector, and silicon carbide globar as IR source. IR spectra were recorded in the wavenumber range 4000–400 cm−1 with a resolution of 8 cm−1 and 16 co-added scans. The background measurement against air was conducted before each sample measurement with the same settings.
FPA-based micro-FTIR analysis of the filters containing the MP particles <500 µm was conducted with a “Hyperion 3000” FTIR microscope (Bruker Optik GmbH, Ettlingen, Germany) equipped with a 64 x 64 detector pixel FPA detector coupled to the Tensor 27 FTIR spectrometer. The whole 10-mm diameter sample area of each anodisc filter was measured on CaF2 filter holders in a transmission mode with a ×15 IR objective lens. IR spectra were recorded in the wavenumber range 3600–1250 cm−1 with a resolution of 8 cm−1, a binning of 4 × 4 resulting in a final pixel size of ca. 11 µm, and 6 co-added scans. The background measurement was conducted against the blank anodisc filter with 32 co-added scans. The software OPUS 7.5 (Bruker Optik GmbH, Ettlingen, Germany) was used to operate the whole FTIR system and the analysis.
The spectral analysis has been conducted similarly as described by Löder et al. (2015). The spectra of all particles (single ATR-FTIR measured particles in the fraction >500 μm, particles marked by FPA-based imaging in the fraction <500 µm) were compared to a polymer library generated by the Alfred Wegener Institute, Helgoland, Germany (Löder et al., 2015) to verify the polymer types. Polymer particles were categorized into 13 different categories according to the polymer type: PE (polyethylene), PP (polypropylene), PS (polystyrene), SAN/ABS (styrene–acrylonitrile/acrylonitrile–butadiene–styrene), PMMA (polymethyl methacrylate), PUR (polyurethane), PA (polyamide), PVC (polyvinylchloride), PVA (polyvinyl alcohol), PET/PES (polyethylene terephthalate/polyester), PAN (polyacrylonitrile), paint, and “others”. Furthermore, the identified particles were categorized into the five different shapes: fragment, fiber, film, bead, and pellet (Supplementary Figure S2).
Measurement of the maximum length and width was performed using CellSens Dimensions (Olympus Corporation, Japan) for the size fraction >500 µm or OPUS 7.5 (Bruker Optik GmbH, Ettlingen, Germany) for the size fraction <500 µm. According to the maximum length, particles were categorized into four different size classes: macroplastics (>5 mm), large MPs (5–1 mm), small MPs I (1000–300 µm), and small MPs II (20–300 µm). The size classes given here were chosen due to practical reasons, adapted to our sampling, and sample processing design and are not a further suggestion for a size categorization of MPs.
The correction of potential laboratory contamination of the samples was performed as follows: the average particle number per polymer of the eight blank samples of the large-scale sampling program, the four blank samples of the short-term intervals (0 h, 5 h, and 22 h) or the four blank samples of the long-term interval (141 days) of the time-scale sampling program was calculated for each of the four size classes, rounded up to the next integer and subtracted from the results of the environmental filters. Finally, the corrected data were normalized to sampled water volume resulting in MP number concentrations.
Statistical analyses were performed using the R-based software Jamovi version 2.2.3 (R package 4.0). Parametric tests were applied for datasets that meet the assumptions of homogeneity of variance and normal distribution (Student’s t test). The non-parametric variant was performed for all other cases (Mann–Whitney U test). In addition, linear regressions were performed to analyze a potential increase of microplastic abundance in the course of the studied rivers with five to nine consecutive samples (Rhine, Neckar, Inn, Danube).
3 Results and discussion
This study provides an extensive dataset on the MP pollution of the surface waters of the Rhine and Danube river systems and their tributaries, thus covering a large geographical extent and including a variety of river systems with different characteristics (23 large and small rivers). In total, 53 samples were collected and analyzed. The comparability within the dataset was ensured by applying the same methods for sample collection, sample processing, and analysis throughout the whole study. In addition, the generated data are based on a strict FTIR spectroscopic identification of all samples down to a particle size of 20 µm and thus provide reliable information about the polymer type, size, and shape of every single MP particle found.
Due to the high amount of data, we refrain from elaborating on every result, instead focusing on general patterns and unexpected results. However, complete information is given in the supporting information (Supplementary Tables S1–S4). After discussing the potential influence of the sampling methodology on the found particle size distribution, the main aspects addressed are as follows: (I) spatial differences in MP contamination between the different investigated river systems, including a comparison of MP contamination to other river systems reported in the literature; (II) signs for constant increase in MP contamination from the upper to the lower course of a river; (III) distinct spatial MP distribution patterns with respect to MP sources such as WWTPS; and (IV) potential temporal variation of MP concentration at selected locations of three rivers.
3.1 Influence of sampling method on MP particle size distribution
The abundance of larger plastic pieces (macroplastic >5 mm) was not the main focus of this study, and we are aware that using a manta net with a relatively small net opening is not suitable for monitoring macroplastics, especially not for larger pieces. However, we report the macroplastic abundance data here for completeness. Although reasonable volumes of water were sampled (Pasquier et al., 2022), ranging from 7.0 to 74.9 m³ (mean 31.5 ± 17.2 m³), only a limited amount of macroplastic (0.3 ± 0.6 macroplastic/m³, 0.5 ± 0.8% of the total particle number) was detected. In total, 307 macroplastic particles were found in the samples, but only three out of 53 samples contained more than one macroplastic particle/m³ (please see Supplementary Table S1). The identified macroplastic particles were in a size range of 5.0–52.8 mm with a mean of 10.4 ± 7.4 mm and a median of 7.8 mm. Macroplastic abundance that we found was comparable to other studies reporting macroplastic in water surface samples. For example, in the Great Lakes tributaries, particles of a similar size range, namely, larger than 4750 μm, took a minor portion of only 2% (Baldwin and Mason, 2016).
The most remarkable pattern concerning all samples was an increase of detected particles with decreasing size of the particles (Figure 3). In the size class microplastic (MP, particles <5 mm), large MPs (1–5 mm) took up an average of 12.8 ± 14.1% (mean ± SD). Microplastic (<1000 µm) accounted for 87.2 ± 14.1% (mean ± SD) and was further divided into the size classes 300–1000 µm (small MP I: 26.0 ± 24.5%), and the non-quantitative samples size class of particles 20–300 µm (small MP II, 61.2 ± 34.2%) which was the most abundant one, although those particles should have passed the net with a mesh size of 300 µm. There are two possible explanations for this observation. On the one hand, this high number of particles could potentially result from the fragmentation of MPs during laboratory handling. However, this possibility was minimized by gentle sample preparation and purification techniques (Schrank et al., 2022) and is therefore unlikely. More likely is that most particles smaller than 300 µm were entrapped in or attached to larger organic aggregates and thus captured as “bycatch” by the 300 µm net. The fact that we detected a high number of MPs <300 µm makes it highly probable that the environmental concentrations of particles in this size class (20–300 μm, small MP II) may be much higher. Therefore, we anticipate that the data presented here represent only the “tip of the iceberg”. Independent of the limitations regarding the particle abundance of the size class 20–300 μm, several other studies examining the water surface or the water column observed such dominance in the recorded number of small MPs. For example, in a study by Leslie et al. (2017), five out of six urban canal surface water samples contained the most significant particles in the size range of 10–300 µm. Likewise, Di and Wang (2018) and Stanton et al. (2020), who sampled bulk water, detected the highest number of MP particles in the size class <500 µm. Finally, Mintenig et al. (2020), who used a quantitative sampling approach for particles down to 20 μm, found that 67.1% of all MP items were even below 100 µm in their longest dimension. Even in aquatic sediments, where no bias of mesh sizes occurs, similar size distribution patterns could be observed (Klein et al., 2015; Imhof et al., 2016; Mani et al., 2019b; Scherer et al., 2020). Though a potential bias toward the underestimation of the particle abundance <300 µm exist in this study, the increase of particle abundance with decreasing size of the MP in the aquatic environment can be considered a fact.
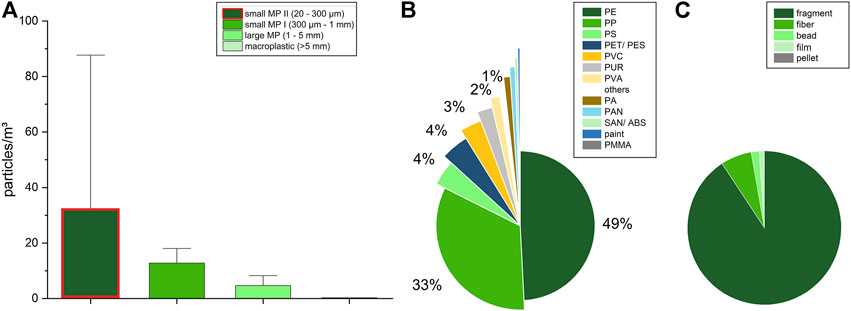
FIGURE 3. Size distribution and shares of polymer types and shapes of MPs in the whole sample set. (A) Particle concentration per size class. The non-quantitatively sampled size class small MP II (20–300 μm) is marked with a red box to highlight the potential underestimation of particle abundance <300 μm. Percentage of (B) polymer type and (C) shape. Detailed information for each sample location is given in the Supplementary Information.
The mesh size of 300 µm for the manta net was chosen as a compromise to sample comparably large water volumes (mean 31.5 ± 17.2 m³) without clogging. Doing so also addresses the rarer fraction of larger MPs as representatively as possible. Retrospectively and considering the high abundance of smaller particles (e.g., <300 µm), lower sample volumes would be sufficient (Koelmans et al., 2019). Therefore, samples can be pumped through cascades of filter cartridges (Mintenig et al., 2020; Mintenig et al., 2017) or large area stainless steel mesh filters if the quantification of small-sized particles is the primary goal of a study. Typically, water volumes of <1 m³ can be reached using pressure filtration and 10-µm filters. Such a reduction of sample volume will prevent the problem of fast clogging during sampling with small-meshed nets due to the high load of organic/inorganic suspended material in most riverine waters. Furthermore, a combined approach sampling with a 300-µm manta net (for larger MPs) in parallel with 10-µm pressure filtration (for smaller MPs) opens up the opportunity to sample the whole size range of MPs from 5 mm to 10 µm quantitatively and addressing the expected abundance by a representative sample volume for both size classes.
3.2 Spatial distribution patterns of MPs
3.2.1 MP abundance in the large-scale survey
All 53 samples contained plastic particles (>20 µm) with abundances ranging from 0.7 particles/m³ up to 354.9 particles/m³ with an average load of 49.8 ± 68.7 particles/m3 (median: 22.7 particles/m³). Mean values reported here are always shown with standard deviation. An overview of the particle concentrations per size class at every sample location of the large-scale program is shown in Figure 4. If only the fully quantitative size classes (>300 µm) would be considered the abundances range from 0 particles/m³ up to 214.8 particles/m³ with an average load of 17.7 ± 39.3 particles/m3 (median: 5.9 particles/m³). Please note that we consistently report the numbers in the following, including the non-quantitatively sampled size class (20–300 µm). Therefore, the numbers have to be seen as minimum values. For clear differentiation in the presented maps and figures, the non-quantitatively sampled size class small MP II (20–300 µm) is marked with a red box to highlight the potential underestimation of particle abundance <300 µm. When comparing to other studies, we adjust the size classes of our own results to ensure better comparability; however, such cases are clearly declared in the text.
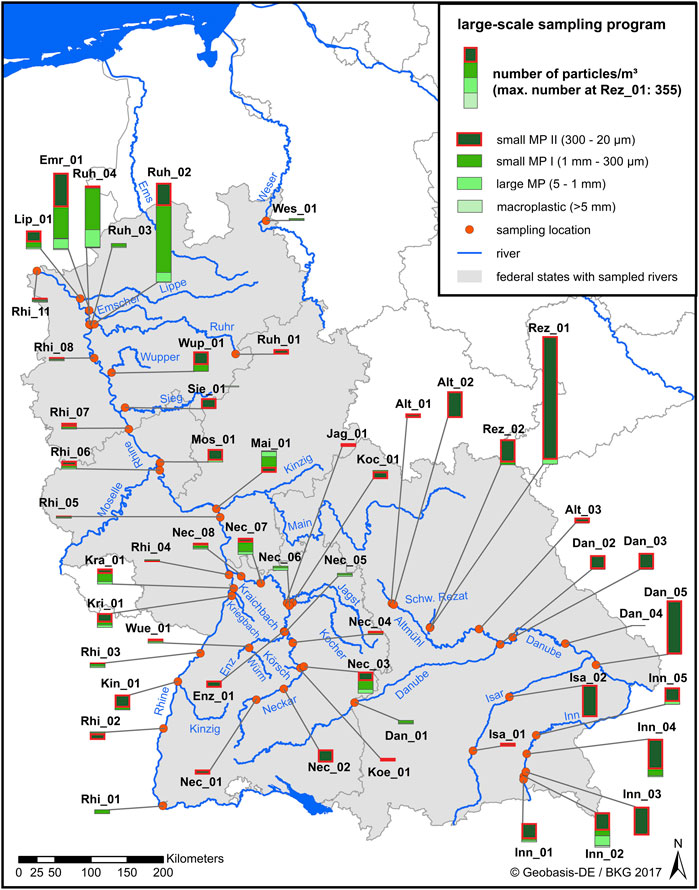
FIGURE 4. Plastic particle concentrations (number of particles/m3) per size of all large-scale sampling program sample locations. The non-quantitatively sampled size class small MP II (20–300 µm) is marked with a red box to highlight the potential underestimation of particle abundance <300 µm.
If directly compared among each other, the MP (5 mm–20 µm) concentration of the Rhine (average: 11.5 ± 6.3 particles/m³, median: 10.0 particles/m³) and the Danube rivers (average: 48.7 ± 53.7 MP/m³, median: 37.7 MP/m³) both exhibited a similar concentration without statistically significant differences (p=0.606, N=9/5, Mann–Whitney U test). Dris et al. (2018) reported MP abundances between 0.1 and 2,933 particles/m3 with a median of 2.6 particles/m3 in their review on MP contamination of surface water samples of rivers. In contrast, Di and Wang (2018) found high contamination in the Yangtze River with abundances ranging between 1,597 and 12,611 particles/m3. Therefore, given all uncertainties in comparison with former studies, the MP particle concentration of the Rhine and Danube rivers can be evaluated as low or moderate compared to other rivers worldwide (Hidalgo-Ruz et al., 2012; Dris et al., 2018; Eerkes-Medrano and Thompson, 2018). Moreover, the abundance we report here reaches the same level as the Elbe River, which has a comparable catchment (Scherer et al., 2020).
3.2.1.1 MP in the Rhine River catchment area
A further study on microplastics along the Rhine River was performed by Mani et al. (2015), who sampled 11 locations along the course of the Rhine River and, a few years later, three locations with temporal replication (Mani and Burkhardt-Holm, 2020). As the datasets of different studies often vary in units, size classes, analyzed parameters, and applied methods (Driedger et al., 2015), an exact comparison of our data with other studies is still difficult. However, both studies can be compared to our results after excluding the size class below 300 µm and converting the particles/area to particles/volume. Normalized to cubic meters, Mani et al. (2015) reported a maximum of 22 particles/m3 and 5 particles/m3 on average. Mani and Burkhardt-Holm (2020) detected MP concentrations between 1.1 ± 1.5 and 6.32 ± 2.6 MP/m3. Our values showed a maximum of 10.8 particles/m3 and an average of 5.9 ± 3.0 MP/m³. Thus, our results are similar to those reported by both former studies. However, only a subfraction of potential MP was verified via FTIR spectroscopy by Mani et al. (2015) and Mani and Burkhardt-Holm (2020).
Remarkably, the tributaries often contained higher concentrations than the Rhine River. We found the second, third, and fourth highest values measured in the large-scale sampling of our study in the estuaries of two tributaries. The increased particle amount in the Emscher River (Emr_01: 213 MP/m3) may arise because the Emscher River carries high amounts of wastewater, especially in its lower and middle course (Heß et al., 2018). Although WWTPs effluents have not been explicitly investigated here, WWTPs are reported as potentially important MP point sources (Mintenig et al., 2017; Schmidt et al., 2018; Schmidt et al., 2020) The sampling spots in the confluence of the Ruhr and Rhine rivers (Ruh_02 and Ruh_04) could show increased particle numbers due to the backwater behind the Rhine River (Ruh_04) and a lock (Ruh_02) where plastic particles can potentially accumulate (Mao et al., 2020). Such an accumulation might be responsible for the relatively high numbers detected (Ruh_02: 278 MP/m3, Ruh_04: 171 MP/m³). The Neckar is a more significant tributary of the Rhine River and was sampled at eight locations and reached an MP contamination from 8.0 to 58.8 MP/m3 and a mean of 23.7 ± 18.2 MP/m3 (median: 13.3 particles/m3). Comparing the averaged particle numbers of the Neckar River (23.7 ± 18.2 MP/m3) and the Rhine River (11.5 ± 6.3 MP/m³) both reached a similar concentration (p=0.272, N=9/8, Mann–Whitney U test). The five sampled tributaries to the Neckar River showed only low numbers of MPs ranging from 5.0 to 22.7 MP/m³
3.2.1.2 MP in the Danube River catchment area
In the Danube River, the MP abundances at the five locations ranged from 0.7 to 150.8 MP/m3 with an average of 48.7 ± 53.7 MP/m³ (median: 37.7 MP/m³). Therefore, the MP particle concentration can be evaluated as moderate contamination compared to international studies. Lechner et al. (2014) sampled the Austrian stretch of the Danube River and detected only 0.3 ± 4.7 items/m3 in this river. However, they applied a submerged driftnet for sampling with a mesh size of 500 µm and analyzed MP only visually. Using visual instead of spectrometric methods can bias MP numbers as significantly smaller plastic particles can be overlooked or misidentified (Löder & Gerdts, 2015). A second study assessing the microplastic contamination of the Danube River did not consider particle concentrations per volume and reported total MP weight per volume and is therefore not comparable (Lechner, 2020). The Inn River and the Isar River are significant tributaries of the Danube River and were sampled at five and two locations, respectively. The Inn River reached comparable concentrations to the Danube River, with a MP contamination ranging from 47.0 to 104.7 MP/m3 and a mean of 75.2 ± 22.5 MP/m3 (median: 79.3 MP/m³). However, without statistically significant differences (p=0.680, N=5 Student’s t test). The Isar River showed an MP contamination ranging from 8.3 to 87.8 MP/m3.
3.2.1.3 MP spatial distribution patterns
Although Mani and Burkhardt-Holm (2020) detected an increase of MP over the course of the Rhine River, the initial hypothesis of an increase in microplastic abundance from the source to the mouth of a large river cannot be confirmed by this study. Rhine, Danube, Neckar, and Inn exhibited a variable MP concentration, and no relationship between sample location and MP concentration was visible (Figure 5; Table 1). Meanwhile, Mani and Burkhardt-Holm, (2020) found 1.1 ± 1.5–3.3 ± 2.1 MP/m³ (n = 3) in the upper course of the Rhine River in the vicinity of the city Basel; the MP concentration increased to 2.7 ± 0.4–6.3 ± 2.6 MP m³ at the sites in Germany (Bad Honnef and Rees) for MP between 5 mm and 300 µm in 2016 and 2017. The sites are comparable with this study’s sample locations Rhi_7 and Rhi_11. If the MP <300 µm were excluded from our dataset for a more realistic comparison, the Rhine River exhibited a highly variable MP concentration. MP concentrations during the sampling campaign in 2015 ranged from 1.7 to 10.8 MP/m³ with the third-highest value (8.7 MP/m³) close to Basel. In addition, during a second sampling campaign in 2017, two locations of the Rhine River (Rhi_9 and Rhi_10) were sampled in a distance of 5 h, 22 h, and 141 days. Again, a high variation in MP concentration was found at this time but with higher values (17.5–127.1 MP/m³) than the sampling in 2015.
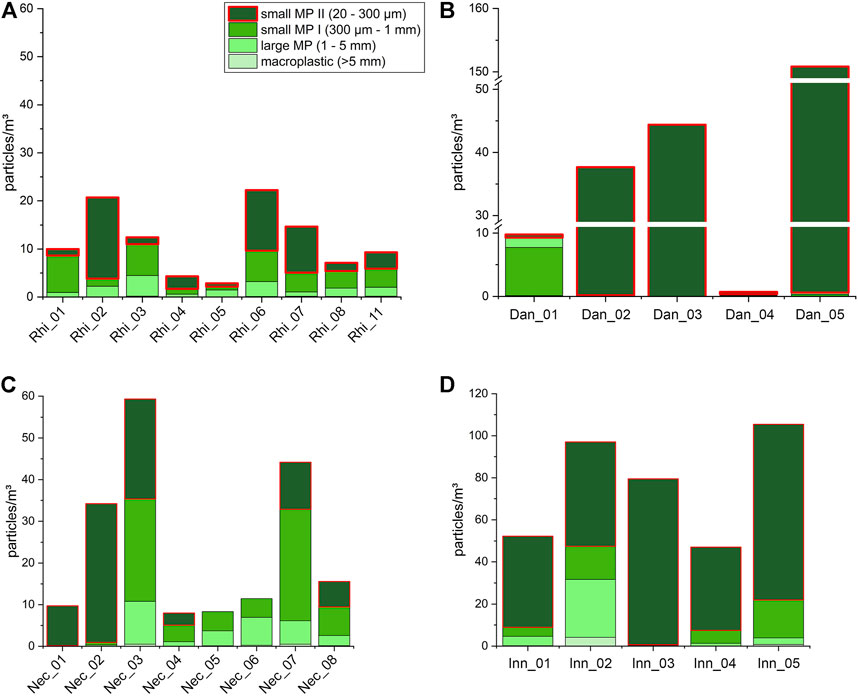
FIGURE 5. Large-scale sampling survey. Particle concentrations (number of particles/m3) per size class (green scale) in the course of four rivers: (A) Rhine River and (C) it’s tributary Neckar River and (B) Danube River and (D) its tributary Inn River. The non-quantitatively sampled size class small MP II (20–300 µm) is marked with a red box to highlight the potential underestimation of particle abundance <300 µm. Please note that the different scaling of y-axis changes to increase the readability.
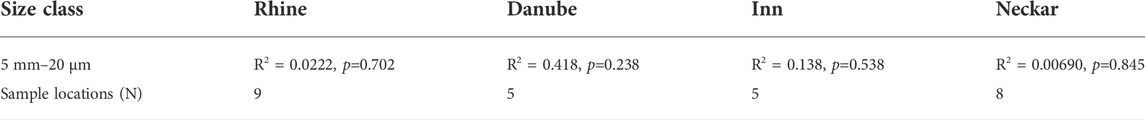
TABLE 1. Statistical results of the linear regression performed using the R-based software Jamovi version 2.2.3 (R package 4.0) to analyze a potential increase of microplastic abundance in the course of the studied rivers with five to nine consecutive samples (Rhine, Neckar, Inn, and Danube) for the size class MP (5 mm–20 µm).
3.2.1.4 WWTPs as potential MP point sources
One suspected reason for the high temporal and spatial variation of MP could be point sources such as wastewater treatment plants (WWTPs). WWTPs were shown to be an essential point source for the introduction of MP (Mintenig et al., 2017). Especially fibers, fragments, and beads are introduced by WWTP discharge (Talvitie et al, 2017; Dris et al., 2018; Schmidt et al, 2018; Imhof et al, 2018; Lechner, 2020; Schmidt et al., 2020; Stanton et al., 2020; Ben-David et al., 2021). To explicitly investigate the influence of WWTP effluent on MP abundance in a river, the small Bavarian river Schwäbische Rezat River, a tributary of the Altmühl River, which again is a tributary of the Danube River, was sampled at two locations, upstream and downstream of the outlet of a wastewater treatment plant (WWTP). The MP values found here were the highest recorded in the large-scale survey. Interestingly, the highest values (354.0 MP/m3) were recorded upstream of the WWTP outlet and, surprisingly, lower MP concentrations (68.7 MP/m3) were recorded at the station after the inlet of the WWTP. Therefore, at least in this case, a correlation between wastewater and MP abundance could not be verified here. Instead, the relatively high discharge of the WWTP compared to the discharge of the Schwäbische Rezat River at this specific location could lead to a dilution of MP. For verification of this unexpected result, the Schwäbische Rezat River was sampled repeatedly during a second sampling program concerning temporal variation. This is discussed in more detail below.
3.2.2 MP particle shape and polymer type in riverine samples
In addition to MP particle concentration and size, we assessed MP polymer type and particle shape during the large-scale sampling survey. An overview of data on both parameters based on all samples of the large-scale sampling program is given in Figures 3B,C. See Supplementary Figures S3, S4 and Supplementary Tables S1–S4 for detailed information.
3.2.2.1 MP shapes
Fragments were the dominant shape (90.7 ± 13.6%) and were found in all samples of the large-scale sampling survey (Figure 4). Fibers contributed to 6.5 ± 12.6% on average and were the second most detected type of shape, whereas beads (1.7 ± 5.3%), films (1.0 ± 2.1%), and pellets (0.02 ± 0.16%) were present only in minor shares (Figure 3 and Supplementary Figure S3). In correspondence with our study, fragments were most often detected in four Swiss rivers (Faure et al., 2015) and at the German Rhine River sample locations of Mani and Burkhardt-Holm (2020), followed by beads and films. In many other studies, fibers instead of fragments were the most dominant particle shape (e.g., Mani et al., 2015; Baldwin and Mason, 2016; Lahens et al., 2018; Napper et al., 2021). In the Danube River, beads and pellets were most frequently recorded (Lechner et al., 2014).
However, the applied methods and the analyzed size classes strongly differed between studies. Methodological differences may cause a shift toward specific shapes. Fibers and small fragments are expected to appear in higher proportions when smaller mesh sizes are used. In contrast, larger fragments, films, pellets, or beads might be found in higher ratios when larger mesh sizes are applied, where fibers and small fragments can pass through. In addition to the sampling method, the identification method may also lead to different ratios of the detected shapes. Relatively large fibers, pellets, or beads could be identified with less doubt than small irregular fragments during visual identification, which actually might be overseen. Spectroscopic methods can identify such small irregular fragments, and consequently, lead to more fragments identified as MPs. This could explain the higher ratio of fragments found in our study than in studies using visual identification where fibers dominated (Baldwin and Mason. 2016; Leslie et al., 2017; Di and Wang, 2018; Scherer et al., 2020; Napper et al., 2021). On the other hand, the low proportion of fibers we recorded can result from difficulties identifying MPs with a small diameter close to the lower limit of resolution (∼10 µm) with FTIR methods (Mintenig et al., 2017).
Fragments can be expected to originate from larger plastic pieces that disintegrate into secondary MPs and are therefore introduced frequently into the environment as well as fibers, which may enter waters via WWTPs or by atmospheric input (Dris et al., 2016; Dris et al., 2017; Klein and Fischer, 2019; Zhang and Kang, 2019). In contrast, pre-production pellets and beads might be released accidentally and locally during processing, packaging, and transport. Therefore, they are not expected to be found regularly in large amounts in river samples. This is supported by our study, where bead shares higher than 5% were only found at two locations of the large-scale sampling and three locations of the time-scale sampling. Here, beads were found at two locations of the Rhine River with up to 51.4% (Rhi_09, repeated sampling) and up to 37.3% (Rhi_10, repeated sampling). Pellets were found only in two samples, one from the Neckar River (Nec_07) and one from the Main River (Mai_01). However, in both cases the shares are smaller than 2%.
3.2.2.2 MP polymer types
Regarding the polymer types found, PE and PP were dominant in almost all samples of the large-scale sample survey with an average proportion of 49.2 ± 25.9% and 33.2 ± 22.6%, respectively (Figure 4 and Supplementary Figure S4). PE occurred at every sampled location and PP in 98% of the sampled locations. High rates of both polymers are expected to be found in water surface samples, as their density is lower than water (Skalska et al, 2020), and both polymers have a high market share (Plastics Europe, 2020). Most studies of riverine MP contamination reveal similar patterns as our large-scale survey (Zhang et al., 2015; Rodrigues et al., 2018; Mani and Burkhardt-Holm, 2020; Scherer et al., 2020; Skalska et al., 2020). Due to the variety of different entry routes, both polymers could not be assigned to a specific source. However, both synthetic polymers are commonly used for single-use packaging purposes and thus have the highest production rates in Europe, with 29.8% for PE and 19.4% for PP (Plastics Europe, 2020). These products mostly reach the environment by inappropriate disposal, that is, littering. Those larger plastic pieces degrade in the environment (Meides et al., 2021; Meides et al., 2022; Menzel et al., 2022), and may reach aquatic environments via diffuse terrestrial run-off and atmospheric transport. Furthermore, PE and PP are still included in cosmetics and cleaning products as primary MPs (e.g., beads and fragments, Bertling et al., 2018). Secondary MPs from our daily life generated through abrasion reach the wastewater and may also be introduced via WWTP effluents (Mintenig et al., 2017).
3.2.2.3 Deviations from the general picture
Deviations from this general picture related to particle shape and polymer type occurred only locally in our study (Supplementary Figures S3, S4). For example, one Rhine River sample (Rhi_1, near Basel) contained 43.8% PET/PES, mainly fibers. Although PET/PES is commonly used in single-use plastics and textile fibers, only 4.4 ± 7.7% of the particles found in the whole study were PET/PES. At an overall low MP contamination, PS, mainly beads, was found with a share of 48.5% in the sample of the small river Würm. Such beads are, for example, used as ion exchange material (Mani et al., 2019a) and could be introduced via industry sewage or WWTP effluents. The Würm River can contain more than 50% treated wastewater (Heß et al., 2018), which could explain this observation. Although PVC was rarely found in the samples of the large-scale survey, some locations reached higher values. For example, at one location of the Neckar River (Nec_01), 30.8%, and two locations of the river Inn, 25.9% (Inn_02) and 65% (Inn_03) of all measured plastic particles were PVC. One sampling location at the Schwäbische Rezat River (Rez_01), upstream of a WWTP, contained 24.5% PVC particles. About 1 year later, during the repeated sampling program, ratios between 70.5% and 94.2% of PVC were detected at the same location. PVC particles have a density of 1.20–1.44 g/cm3 (Hellerich et al., 2010) and are therefore not necessarily expected to be found on the water surface. This pattern could either speak for point sources in the vicinity of the sample location or might result from the “particles” behavior in the environment. Next to biofouling which can prevent the settling of heavier particles (Kooi et al., 2018), turbulence can keep MP particles in the water column or even force them to the surface. Therefore, it is not unlikely to find PVC particles on the water surface despite their high density.
3.3 MP abundance in a temporal context
The results from the Schwäbische Rezat River found during the large-scale MP survey were unexpected. Higher MP abundance was detected above the WWTP than below the WWTP. However, a similar pattern was found in the repeated sampling program for temporal variation, which was performed 1 year later. Upstream of the WWTP, a higher MP abundance (276.4 ± 80.4 MP/m3) was measured than downstream (68.5 ± 35.4 MP/m3) of the WWTP outlet (Student’s t test, N=3, p=0.027, Figure 6, Supplementary Table S3). This decreased abundance below the WWTP is contradictory. Other studies including Mintenig et al. (2017) proved WWTP “effluents” partially high MP contamination. However, the MP abundance depends strongly on the techniques used in a WWTP. Although studies have indicated an increase of microplastic quantity by WWTPs (Schmidt et al., 2018), other studies could not confirm an increase of MP particles in surface water after the inlet of WWTPs (Watkins et al, 2019; Stanton et al., 2020). These contrasting results underline that potential sources such as WWTPs and their influence on environmental concentrations of MP in the aqueous environment are not always predictable and have to be investigated in more detail for a better understanding (Kooi et al., 2018). In rare cases, the introduction of less contaminated water via WWTP effluent could lead to the dilution of MP concentration. Especially in small streams such as the Schwäbische Rezat with a mean discharge of 0.149 m³/s.
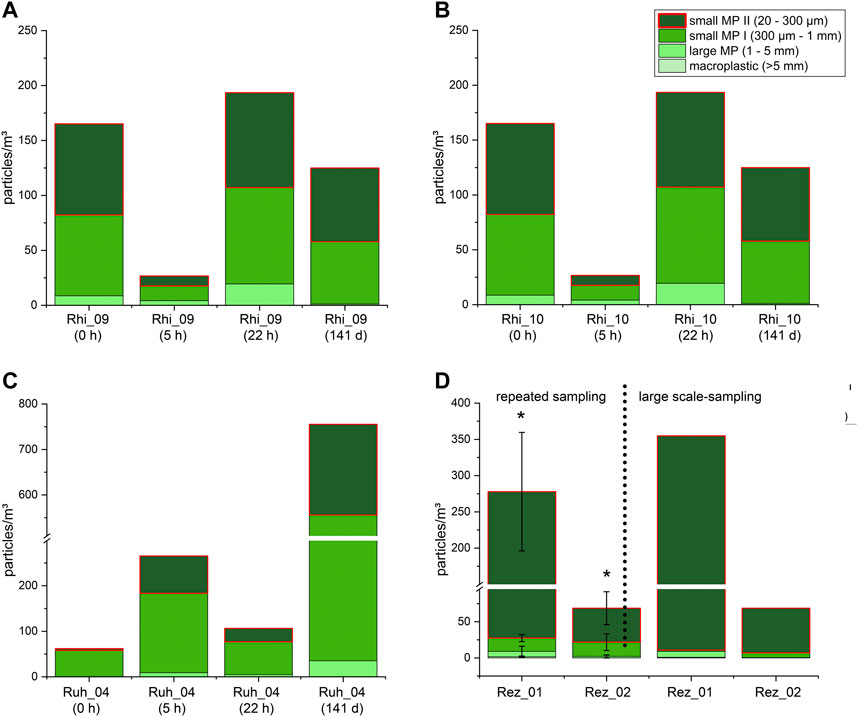
FIGURE 6. Detected MP particle concentration (MP/m³) per size class during the repeated sampling survey. The Rhine and the Ruhr rivers were sampled at four different points of time (0 h, 5 h, 22 h, and 141 days): (A) Rhi_09 (upstream of the Ruhr River), (B) Rhi_10 (downstream of the Ruhr River) and (C) the Ruhr River (Ruh_04) at the mouth of the river. (D) In the same way, the Schwäbische Rezat River was sampled at three different points of time (0 h, 0.5 h, and 1 h) at two locations: Rez_01 (upstream of a WWTP) and Rez_02 (downstream of a WWTP) during the repeated sampling survey in 2016 (mean ± SD) and at a single time point during the large-scale sampling survey in 2015. The non-quantitatively sampled size class small MP II (20–300 µm) is marked with a red box to highlight the potential underestimation of particle abundance <300 µm. Please note that the scaling of the y-axis changes to increase the readability. *p=0.027; Student’s t test.
In addition to the two spots of the river Schwäbische Rezat, repeated sampling was done exemplarily at two sampling locations of the Rhine River and one sampling location of the river Ruhr (Figure 2). Sampling was performed at four different time points (0 h, 5 h, 22 h and 141 days) to gain insight into the temporal variation of MP abundance. Simultaneously, such a replication gives an impression of the representativity of single-time point measurements (Figure 5, Supplementary Table S3). During the repeated sampling, no clear pattern could be identified, neither on a temporal nor a spatial level. On the other hand, MP particles were detected in all samples of the repeated sampling alike in the 53 large-scale survey samples. Interestingly the high contamination of the River Ruhr (Ruh_4) found in the large scale sampling in 2015 could be confirmed with an even higher concentration. However, the MP concentration of the Rhine River upstream and downstream of the confluence was also higher during this time. But no difference between Rhi_9, Rhi_10, and Ruh_4 was detected (ANOVA, df=2, F=1.02, p=0.398). Particle abundances varied within the three short-term intervals (0 h, 5 h, and 22 h) and between them and the long-term interval (141 days). In the short-term interval samples, comparable MP concentrations were detected at all locations of the Rhine (Rhi_09, Rhi_10) and the river Ruhr (Ruh_04). The highest difference between the short-term interval and the long-term interval was a 12.2 fold difference from the lowest to the highest detected abundance at Ruh_04: The highest MP concentration measured in this study was measured after 141 days with an MP concentration of 754.9 MP/m3. However, only 144.6 ± 87.3 MP/m³ were found during the short-term repeated sampling with a time distance of 0 h, 5 h and 22 h. Two years before, 170.94 MP/m3 were found during the large-scale sampling survey at this location. The results demonstrate that MP concentration may change significantly at a single sampling location during longer intervals and within 1 day.
3.4 Factors responsible for spatial and temporal variation of MP concentration
Multiple potential contamination sources such as WWTPs, the influence of big cities, industry, agricultural areas, and other tributaries contaminated with MP were anticipated to cause increasing MP numbers at the water surface with the course of the investigated rivers. Therefore, we sampled consecutive locations in the stretch of the rivers the Danube, Rhine, and their tributaries Inn and Neckar. Although our large-scale survey data were collected at single time points without addressing temporal variation, it clearly shows the ubiquitous presence of MPs in the investigated rivers. However, no clear picture of MP contamination concerning differences between river systems in general or the main rivers and their tributaries was recognizable. However, our large-scale survey, which allows the comparisons of many river systems, gives rise to whether surface water sampling alone is suitable to enlighten the “real” MP contamination of a river and if snapshot sampling allows such a comparison.
We observed for all investigated rivers that the concentration of MPs did not constantly increase but fluctuated over their courses and showed a random pattern. Similarly, other studies investigating the MP load over the course of rivers did neither find a stringent increasing gradient (Mani et al, 2015; Zhang et al., 2015; Di and Wang, 2018; Scherer et al., 2020). However, there are indications that a steady increase along the river’s course does not manifest at the water surface or in the water column but in the sediments (Scherer et al., 2020). In contrast to our findings, MP concentrations in the surface water increased along the river’s course in the Ganges River. Seasonal changes occurred with higher MP concentrations during pre-monsoon and lower MP concentrations during post-monsoon periods (Napper et al., 2021). Also, MP concentrations were positively correlated with distance from the source, water discharge and catchment size of three naval tributaries and the Rhine River itself (Mani & Burkhardt-Holm, 2020). However, compared to our study, the increase from the source to the mouth is much smaller than the temporal and geographical variation of MP abundance at the Rhine River.
In this context, one must remember that MPs are non-soluble compounds and do not behave like soluble pollutants. Instead, they are a very heterogeneous group of particles and thus non-homogenously distributed in the water body of a river due to differences in polymer density, size, shape, aging state, biofouling and aggregation. Therefore, even within one cross section of a river, high local heterogeneity of MP abundance can occur (Liedermann et al., 2018). Consequently, particle numbers may vary depending on the manta trawl position in the river. The conducted sampling methods partly addressed this as for all rivers where a boat was available for sampling; the manta net was deployed on the left, in the middle and on the right side of the river during one sample event. However, the replicated sampling clearly showed that the surface water of rivers is a highly dynamic system and microplastic abundance is highly variable on small but also large time scales.
Furthermore, turbulences depending on river morphology and water velocity will influence the distribution patterns of MPs. The same is true for, for example, interaction with river vegetation or installations. Areas with a low flow velocity can enhance the sedimentation rate and temporal storage of MP in sediments (Nizzetto et al., 2016; Hoellein et al., 2019), and the composition of the riverbed sediment plays a crucial role in entrapping and releasing MP under certain flow conditions (Hurley et al., 2018; Ockelford et al., 2020). Furthermore, microplastic is trapped in the hyporheic zone (Frei et al., 2019) and transported within it (Boos et al., 2021). Precipitation can alter the MP particle concentration due to overflowing water from rainwater overflows (Liu and Borregaard, 2019), stormwater retention ponds, sewer discharge (Piehl et al., 2018; Ory et al., 2020) or run-off from terrestrial systems, such as agricultural lands contaminated with MPs (Piehl et al., 2018; Weithmann et al., 2018). This inflow of water, contaminated with microplastics, can increase microplastic concentration after rain events. The vicinity of point sources such as WWTP or industrialized areas can similarly lead to local hotspots. On the other side, the introduction of less contaminated water via tributaries could lead to dilution effects and lower the MP concentration.
Considering all these factors together, it is likely that the abundance of plastic particles in the surface water of rivers does not follow a strict predictable pattern such as a supposed increase over the course of a river. Instead, patchy distribution, current patterns, turbulent mixing, flow velocity, and river morphology may play a role in high variations of MP abundances on one location at small time (Kooi et al., 2018; Watkins et al., 2019) and small spatial scales (Liedermann et al., 2018). In addition, the different densities of the polymers, aggregation of particles with other plastic but also natural particles or colloids, and the growth of biofilms can influence plastic transport (Liedermann et al., 2018).
Moreover, riverine plastic transport is not limited to the surface layer. Therefore, microplastic contamination should be examined within the whole water column and suspended sediments (Liedermann et al., 2018; Frei et al., 2019; Scherer et al., 2020). Therefore, multipoint measurements would be necessary to address spatial and temporal heterogeneity. These findings may have significant implications for MP monitoring approaches since single point measurements have only snap-shot character and might impede the evaluation of MP mitigation measures.
The implementation of repeated one-location multipoint MP surveys for sampling simultaneously at the water surface, in the water column, water/sediment interphase, and in the sediment promise a mechanistic understanding of spatial MP distribution and are essential to identify potential contamination sources. However, such a survey design also confronts researchers with a huge amount of samples that is hard to manage, especially when a high qualitative resolution is to be achieved and microplastic in the lower micron size range are to be analyzed.
Data availability statement
The original contributions presented in the study are included in the article and the Supplementary Material; further inquiries can be directed to the corresponding authors.
Author contributions
IS, ML, HI, MH, JS, and CL conceived the study; IS, ML, and HI did the field work, laboratory processing, analysis, and data interpretation; IS, ML, SM and HI drafted the first version of the manuscript; all authors critically discussed the results, commented, and reviewed the manuscript.
Funding
This work was funded by (I) the Bavarian Environment Agency in the project “Eintragspfade und Kontamination bayerischer Oberflächengewässer mit Mikroplastik und mögliche Auswirkungen auf die Biota, (II) the State Institute for the Environment Baden-Württemberg in the project “Durchführung von orientierenden Untersuchungen ausgewählter Fließgewässer in Baden Württemberg auf Mikroplastik, (III) the State Office for Nature, Environment and Consumer Protection North Rhine-Westphalia and the Ruhrverband in the project “Untersuchung der Fließgewässer in NRW über die Kunststoffkontamination, (IV) the Hessian Agency for Nature Conservation, Environment and Geology in the project “Untersuchung von Flusswasserproben auf Mikroplastik, and (V) the State Office for the Environment Rhineland-Palatinate in the project “Auftrag zur Untersuchung von Flusswasserproben auf Mikroplastik”. The publication was funded by the University of Bayreuth Open Access Publishing Fund.
Acknowledgments
We thank Ursula Wilzcek for assistance in the laboratory work, Heghnar Martirosyan for assistance in the analysis, Sarah Piehl for assistance in laboratory work and analysis, and Benjamin Trotter for assistance in sampling and analysis. We furthermore are very grateful for scientific support by Peter Diehl, Jens Mayer, Harald Rahm, Werner Reifenhäuser, and Jochen Stark.
Conflict of interest
The authors declare that the research was conducted in the absence of any commercial or financial relationships that could be construed as a potential conflict of interest.
Publisher’s note
All claims expressed in this article are solely those of the authors and do not necessarily represent those of their affiliated organizations, or those of the publisher, the editors, and the reviewers. Any product that may be evaluated in this article, or claim that may be made by its manufacturer, is not guaranteed or endorsed by the publisher.
Supplementary material
The Supplementary Material for this article can be found online at: https://www.frontiersin.org/articles/10.3389/feart.2022.794250/full#supplementary-material
References
Acha, E. M., Mianzan, H. W., Iribarne, O., Gagliardini, D. A., Lasta, C., and Daleo, P. (2003). The role of the Rio de la Plata bottom salinity front in accumulating debris. Mar. Pollut. Bull. 46 (2), 197–202. doi:10.1016/s0025-326x(02)00356-9
Araújo, M. C., and Costa, M. (2007). An analysis of the riverine contribution to the solid wastes contamination of an isolated beach at the Brazilian Northeast. Manag. Environ. Qual. Int. J. 18 (1), 6–12. doi:10.1108/14777830710717677
Baldwin, A. K., Corsi, S. R., and Mason, S. A. (2016). Plastic debris in 29 Great Lakes tributaries: Relations to watershed attributes and hydrology. Environ. Sci. Technol. 50 (19), 10377–10385. doi:10.1021/acs.est.6b02917
Ben-David, E. A., Habibi, M., Haddad, E., Hasanin, M., Angel, D. L., Booth, A. M., et al. (2021). Microplastic distributions in a domestic wastewater treatment plant: Removal efficiency, seasonal variation and influence of sampling technique. Sci. Total Environ. 752, 141880. doi:10.1016/j.scitotenv.2020.141880
Bertling, J., Bertling, R., and Hamann, L. (2018). Kunststoffe in der Umwelt: Mikro- und Makroplastik, Ursachen, Mengen, Umweltschicksale, Wirkungen Lösungsansätze, Empfehlungen; Kurzfassung der Konsortialstudie. Oberhausen: Fraunhofer UMSICHT.
Boos, J.-P., Gilfedder, B. S., and Frei, S. (2021). Tracking microplastics across the streambed interface: Using laser-induced-fluorescence to quantitatively analyze microplastic transport in an experimental flume. Water Resour. Res. 57, e2021WR031064. doi:10.1029/2021WR031064
Bucci, K., Tulio, M., and Rochman, C. M. (2020). What is known and unknown about the effects of plastic pollution: A meta-analysis and systematic review. Ecol. Appl. 30 (2), e02044. doi:10.1002/eap.2044
Di, M., and Wang, J. (2018). Microplastics in surface waters and sediments of the three gorges reservoir, China. Sci. Total Environ. 616-617, 1620–1627. doi:10.1016/j.scitotenv.2017.10.150
Driedger, A. G. J., Dürr, H. H., Mitchell, K., and Van Cappellen, P. (2015). Plastic debris in the Laurentian great Lakes: A review. J. Gt. Lakes. Res. 41 (1), 9–19. doi:10.1016/j.jglr.2014.12.020
Dris, R., Gasperi, J., Saad, M., Mirande, C., and Tassin, B. (2016). Synthetic fibers in atmospheric fallout: A source of microplastics in the environment? Mar. Pollut. Bull. 104 (1–2), 290–293. doi:10.1016/j.marpolbul.2016.01.006
Dris, R., Gasperi, J., Mirande, C., Mandin, C., Guerrouache, M., Langlois, V., et al. (2017). A first overview of textile fibers, including microplastics, in indoor and outdoor environments. Environ. Pollut. 221, 453–458. doi:10.1016/j.envpol.2016.12.013
Dris, R., Imhof, H. K., Löder, M. G. J., Gasperi, J., Laforsch, C., and Tassin, B. (2018). “Chapter 3 - microplastic contamination in freshwater systems: Methodological challenges, occurrence and sources,” in Microplastic contamination in aquatic environments. Editor Y. Zeng Eddy (Amsterdam Netherlands: Elsevier), 51–93. doi:10.1016/B978-0-12-813747-5.00003-5
Eerkes-Medrano, D., and Thompson, R. C. (2018). “Chapter 4 - occurrence, fate, and effect of microplastics in freshwater systems,” in Microplastic contamination in aquatic environments. Editor Y. Zeng Eddy (Amsterdam Netherlands: Elsevier), 95–132. doi:10.1016/B978-0-12-813747-5.00004-7
Faure, F., Demars, C., Wieser, O., Kunz, M., and de Alencastro, L. F. (2015). Plastic pollution in Swiss surface waters: Nature and concentrations, interaction with pollutants. Environ. Chem. 12 (5), 582–591. doi:10.1071/en14218
Fendall, L. S., and Sewell, A. M. (2009). Contributing to marine pollution by washing your face: Microplastics in facial cleansers. Mar. Pollut. Bull. 58 (8), 1225–1228. doi:10.1016/j.marpolbul.2009.04.025
Frei, S., Piehl, S., Gilfedder, B. S., Löder, M. G. J., Krutzke, J., Wilhelm, L., et al. (2019). Occurence of microplastics in the hyporheic zone of rivers. Sci. Rep. 9 (1), 15256. doi:10.1038/s41598-019-51741-5
Gregory, M. R. (2009). Environmental implications of plastic debris in marine settings - entanglement, ingestion, smothering, hangers-on, hitch-hiking and alien invasions. Phil. Trans. R. Soc. B 364 (1526), 2013–2025. doi:10.1098/rstb.2008.0265
Hale, R. C., Seeley, M. E., La Guardia, M. J., Mai, L., and Zeng, E. Y. (2020). A global perspective on microplastics. J. Geophys. Res. Oceans 125 (1), e2018JC014719. doi:10.1029/2018jc014719
Hartmann, N. B., Huffer, T., Thompson, R. C., Hassellöv, M., Verschoor, A., Daugaard, A. E., et al. (2019). Are we speaking the same language? Recommendations for a definition and categorization framework for plastic debris. Environ. Sci. Technol. 53 (3), 1039–1047. doi:10.1021/acs.est.8b05297
Hellerich, W., Harsch, G., and Baur, E. (2010). Werkstoff-Führer Kunststoffe: Eigenschaften, Prüfungen, Kennwerte. Hanser Fachbuch.
Heß, M., Diehl, P., Mayer, J., Rahm, H., Reifenhäuser, W., Stark, J., et al. (2018). Mikroplastik in Binnengewässern Süd- und Westdeutschlands. Teil 1: Kunsttsoffpartikel in der oberflächennahen Wasserphase. Nordrhein-Westfahlen und Rheinland-Pfalz: Karlsruhe, Augsburg, Wiesbaden, Recklinghausen, Mainz: Bundesländerübergreifende Untersuchungen in Baden-Württemberg, Bayern, Hessen.
Hidalgo-Ruz, V., Gutow, L., Thompson, R. C., and Thiel, M. (2012). Microplastics in the marine environment: A review of the methods used for identification and quantification. Environ. Sci. Technol. 6 (46), 3060–3075. doi:10.1021/es2031505
Hoellein, T. J., Shogren, A. J., Tank, J. L., Risteca, P., and Kelly, J. J. (2019). Microplastic deposition velocity in streams follows patterns for naturally occurring allochthonous particles. Sci. Rep. 9 (1), 3740. doi:10.1038/s41598-019-40126-3
Hurley, R., Woodward, J., and Rothwell, J. J. (2018). Microplastic contamination of river beds significantly reduced by catchment-wide flooding. Nat. Geosci. 11 (4), 251–257. doi:10.1038/s41561-018-0080-1
Imhof, H. K., Ivleva, N. P., Schmid, J., Niessner, R., and Laforsch, C. (2013). Contamination of beach sediments of a subalpine lake with microplastic particles. Curr. Biol. 23 (19), R867–R868. doi:10.1016/j.cub.2013.09.001
Imhof, H. K., Laforsch, C., Wiesheu, A. C., Schmid, J., Anger, P. M., Niessner, R., et al. (2016). Pigments and plastic in limnetic ecosystems: A qualitative and quantitative study on microparticles of different size classes. Water Res. 98, 64–74. doi:10.1016/j.watres.2016.03.015
Imhof, H. K., Wiesheu, A. C., Anger, P. M., Niessner, R., Ivleva, N. P., and Laforsch, C. (2018). Variation in plastic abundance at different lake beach zones - a case study. Sci. Total Environ. 613, 530–537. doi:10.1016/j.scitotenv.2017.08.300
Jambeck, J. R., Geyer, R., Wilcox, C., Siegler, T. R., Perryman, M., Andrady, A., et al. (2015). Plastic waste inputs from land into the ocean. Science 347 (6223), 768–771. doi:10.1126/science.1260352
Jiang, J. Q. (2018). Occurrence of microplastics and its pollution in the environment: A review. Sustain. Prod. Consum. 13, 16–23. doi:10.1016/j.spc.2017.11.003
Kataoka, T., Nihei, Y., Kudou, K., and Hinata, H. (2019). Assessment of the sources and inflow processes of microplastics in the river environments of Japan. Environ. Pollut. 244, 958–965. doi:10.1016/j.envpol.2018.10.111
Klein, M., and Fischer, E. K. (2019). Microplastic abundance in atmospheric deposition within the Metropolitan area of Hamburg, Germany. Sci. Total Environ. 685, 96–103. doi:10.1016/j.scitotenv.2019.05.405
Klein, S., Worch, E., and Knepper, T. P. (2015). Occurrence and spatial distribution of microplastics in river shore sediments of the Rhine-Main area in Germany. Environ. Sci. Technol. 49 (10), 6070–6076. doi:10.1021/acs.est.5b00492
Koelmans, A. A., Besseling, E., Foekema, E., Kooi, M., Mintenig, S. M., and Ossendorp, B. C. (2017). Risks of plastic debris: Unravelling fact, opinion, perception, and belief. Environ. Sci. Technol. 51 (20), 11513–11519. doi:10.1021/acs.est.7b02219
Koelmans, A. A., Mohamed Nor, N. H., Hermsen, E., Kooi, M., Mintenig, S. M., and De France, J. (2019). Microplastics in freshwaters and drinking water: Critical review and assessment of data quality. Water Res. 155, 410–422. doi:10.1016/j.watres.2019.02.054
Kooi, M., Besseling, E., Kroeze, C., van Wezel, A. P., and Koelmans, A. A. (2018). “Modeling the fate and transport of plastic debris in freshwaters: Review and guidance,” in Freshwater microplastics : Emerging environmental contaminants? Editors W. Martin., and L. Scott (Cham: Springer International Publishing), 125
Lahens, L., Strady, E., Kieu-Le, T.-C., Dris, R., Boukerma, K., Rinnert, E., et al. (2018). Macroplastic and microplastic contamination assessment of a tropical river (Saigon River, Vietnam) transversed by a developing megacity. Environ. Pollut. 236, 661–671. doi:10.1016/j.envpol.2018.02.005
Lebreton, L. C. M., van der Zwet, J., Damsteeg, J.-W., Slat, B., Andrady, A., and Reisser, J. (2017). River plastic emissions to the world’s oceans. Nat. Commun. 8 (1), 15611. doi:10.1038/ncomms15611
Lechner, A. (2020). “Down by the River”: (Micro-) Plastic Pollution of Running Freshwaters with Special Emphasis on the Austrian Danube, in Mare Plasticum–The Plastic Sea. Editors M. Streit-Bianchi, M. Cimadevila, and W. Trettnak (Cham: Springer). doi:10.1007/978-3-030-38945-1_8
Lechner, A., Keckeis, H., Lumesberger-Loisl, F., Zens, B., Krusch, R., Tritthart, M., et al. (2014). The Danube so colourful: A potpourri of plastic litter outnumbers fish larvae in europe's second largest river. Environ. Pollut. 188 (0), 177–181. doi:10.1016/j.envpol.2014.02.006
Leslie, H. A., Brandsma, S. H., van Velzen, M. J. M., and Vethaak, A. D. (2017). Microplastics en route: Field measurements in the Dutch river delta and Amsterdam canals, wastewater treatment plants, North Sea sediments and biota. Environ. Int. 101, 133–142. doi:10.1016/j.envint.2017.01.018
Liedermann, M., Gmeiner, P., Pessenlehner, S., Haimann, M., Hohenblum, P., Habersack, H., et al. (2018). A methodology for measuring microplastic transport in large or medium rivers. Water 10 (4), 414. doi:10.3390/w10040414
Liu, F., Olesen, K. B., Borregaard, A. R., and Vollertsen, J. (2019). Microplastics in urban and highway stormwater retention ponds. Sci. Total Environ. 671, 992–1000. doi:10.1016/j.scitotenv.2019.03.416
Löder, J. G. M., and Gerdts, G. (2015). “Methodology used for the detection and identification of microplastics—a critical appraisal,” in Marine anthropogenic litter. Editors G. Bergmann., and Klages (Cham Canada: Springer International Publishing), 201.
Löder, M. G. J., Kuczera, M., Mintenig, S. M., Lorenz, C., and Gerdts, G. (2015). Focal plane array detector-based micro-Fourier-transform infrared imaging for the analysis of microplastics in environmental samples. Environ. Chem. 12 (5), 563–581. doi:10.1071/en14205
Löder, M. G. J., Imhof, H. K., Ladehoff, M., Löschel, L. A., Lorenz, C., Mintenig, S. M., et al. (2017). Enzymatic purification of microplastics in environmental samples. Environ. Sci. Technol. 51 (24), 14283–14292. doi:10.1021/acs.est.7b03055
Mani, T., and Burkhardt-Holm, P. (2020). Seasonal microplastics variation in nival and pluvial stretches of the Rhine River – from the Swiss catchment towards the North Sea. Sci. Total Environ. 707, 135579. doi:10.1016/j.scitotenv.2019.135579
Mani, T., Blarer, P., Storck, F. R., Pittroff, M., Wernicke, T., Burkhardt-Holm, P., et al. (2019a). Repeated detection of polystyrene microbeads in the lower Rhine river. Environ. Pollut. 245, 634–641. doi:10.1016/j.envpol.2018.11.036
Mani, T., Hauk, A., Walter, U., and Burkhardt-Holm, P. (2015). Microplastics profile along the Rhine river. Sci. Rep. 5, 17988. doi:10.1038/srep17988Article number: 17988
Mani, T., Primpke, S., Lorenz, C., Gerdts, G., and Burkhardt-Holm, P. (2019b). Microplastic pollution in benthic midstream sediments of the Rhine River. Environ. Sci. Technol. 53 (10), 6053–6062. doi:10.1021/acs.est.9b01363
Mao, Y., Li, H., Gu, W., Yang, G., Liu, Y., and He, Q. (2020). Distribution and characteristics of microplastics in the Yulin River, China: Role of environmental and spatial factors. Environ. Pollut. 265, 115033. doi:10.1016/j.envpol.2020.115033
Meides, N., Menzel, T., Poetzschner, B., Löder, M. G. J., Mansfeld, U., Strohriegl, P., et al. (2021). Reconstructing the environmental degradation of polystyrene by accelerated weathering. Environ. Sci. Technol. 55 (12), 7930–7938. doi:10.1021/acs.est.0c07718
Meides, N., Mauel, A., Menzel, T., Altstädt, V., Ruckdäschel, H., Senker, J., et al. (2022). Quantifying the fragmentation of polypropylene upon exposure to accelerated weathering. Microplastics and Nanoplastics 2 (1). doi:10.1186/s43591-022-00042-2
Menzel, T., Meides, N., Mauel, A., Mansfeld, U., Kretschmer, W., Kuhn, M., et al. (2022). Degradation of low-density polyethylene to nanoplastic particles by accelerated weathering. Sci. Total Environ. 826, 154035. doi:10.1186/s43591-022-00042-2
Mintenig, S. M., Int-Veen, I., Löder, M. G. J., Primpke, S., and Gerdts, G. (2017). Identification of microplastic in effluents of waste water treatment plants using focal plane array-based micro-Fourier-transform infrared imaging. Water Res. 108, 365–372. doi:10.1016/j.watres.2016.11.015
Mintenig, S. M., Kooi, M., Erich, M. W., Primpke, S., Redondo- Hasselerharm, P. E., Dekker, S. C., et al. (2020). A systems approach to understand microplastic occurrence and variability in Dutch riverine surface waters. Water Res. 176, 115723. doi:10.1016/j.watres.2020.115723
Möller, J. N., Heisel, I., Satzger, A., Vizsolyi, E. C., Oster, S. D. J., Agarwal, S., et al. (2021). Tackling the challenge of extracting microplastics from soils: A protocol to purify soil samples for spectroscopic analysis. Environ. Toxicol. Chem. 41, 844–857. doi:10.1002/etc.5024
Napper, I. E., Baroth, A., Barrett, A. C., Bhola, S., Chowdhury, G. W., Davies, B. F., et al. (2021). The abundance and characteristics of microplastics in surface water in the transboundary Ganges River. Environ. Pollut. 274, 116348. doi:10.1016/j.envpol.2020.116348
Nizzetto, L., Bussi, G., Futter, M. N., Butterfield, D., and Whitehead, P. G. (2016). A theoretical assessment of microplastic transport in river catchments and their retention by soils and river sediments. Environ. Sci. Process. Impacts 18 (8), 1050–1059. doi:10.1039/c6em00206d
Ockelford, A., Cundy, A., and Ebdon, J. E. (2020). Storm response of fluvial sedimentary microplastics. Sci. Rep. 10 (1), 1865. doi:10.1038/s41598-020-58765-2
Ory, N. C., Lehmann, A., Javidpour, J., Stöhr, R., Walls, G. L., and Clemmesen, C. (2020). Factors influencing the spatial and temporal distribution of microplastics at the sea surface – a year-long monitoring case study from the urban Kiel Fjord, southwest Baltic Sea. Sci. Total Environ. 736, 139493. doi:10.1016/j.scitotenv.2020.139493
Pasquier, G., Doyen, P., Kazour, M., Dehaut, A., Diop, M., Duflos, G., et al. (2022). Manta net: The golden method for sampling surface water microplastics in aquatic environments. Front. Environ. Sci. 10. doi:10.3389/fenvs.2022.811112
Piehl, S., Hauk, R., Robbe, E., Richter, B., Kachholz, F., Schilling, J., et al. (2021). Combined approaches to predict microplastic emissions within an urbanized estuary (Warnow, Southwestern Baltic Sea). Front. Environ. Sci. 9 (41). doi:10.3389/fenvs.2021.616765
Piehl, D. S., Leibner, A., Lüder, M. G. J., Dris, R., Bogner, C., and Laforsch, C. (2018). Identification and quantification of macro- and microplastics on an agricultural farmland. Sci. Rep. 8 (1), 17950. doi:10.1038/s41598-018-36172-y
Plastics Europe (2020). Plastics - the facts 2019, An analysis of European plastics production, demand and waste data.
Rochman, C. M., Browne, M. A., Underwood, A. J., van Franeker, J. A., and Thompson, R. C. (2016). The ecological impacts of marine debris: Unraveling the demonstrated evidence from what is perceived. Ecology 97 (2), 302–312. doi:10.1890/14-2070.1
Rodrigues, M. O., Abrantes, N., Gonçalves, F. J. M., Nogueira, H., Marques, J. C., and Gonçalves, A. M. M. (2018). Spatial and temporal distribution of microplastics in water and sediments of a freshwater system (Antuã River, Portugal). Sci. Total Environ. 633, 1549–1559. doi:10.1016/j.scitotenv.2018.03.233
Schrank, I., Möller, J. N., Imhof, H. K., Hauenstein, O., Zielke, F., Agarwal, S., et al. (2022). Microplastic sample purification methods - assessing detrimental effects of purification procedures on specific plastic types. Sci. Total Environ. 833, 154824. doi:10.1016/j.scitotenv.2022.154824
Scherer, C., Weber, A., Stock, F., Vurusic, S., Egerci, H., Kochleus, C., et al. (2020). Comparative assessment of microplastics in water and sediment of a large European river. Sci. Total Environ. 738, 139866. doi:10.1016/j.scitotenv.2020.139866
Schmidt, L. K., Bochow, M., Imhof, H. K., and Oswald, S. E. (2018). Multi-temporal surveys for microplastic particles enabled by a novel and fast application of SWIR imaging spectroscopy – study of an urban watercourse traversing the city of Berlin, Germany. Environ. Pollut. 239, 579–589. doi:10.1016/j.envpol.2018.03.097
Schmidt, C., Krauth, T., and Wagner, S. (2017). Export of plastic debris by rivers into the Sea. Environ. Sci. Technol. 51 (21), 12246–12253. doi:10.1021/acs.est.7b02368
Schmidt, C., Kumar, R., Yang, S., and Büttner, O. (2020). Microplastic particle emission from wastewater treatment plant effluents into river networks in Germany: Loads, spatial patterns of concentrations and potential toxicity. Sci. Total Environ. 737, 139544. doi:10.1016/j.scitotenv.2020.139544
Siegfried, M., Koelmans, A. A., Besseling, E., and Kroeze, C. (2017). Export of microplastics from land to sea. A modelling approach. Water Res. 127, 249–257. doi:10.1016/j.watres.2017.10.011
Skalska, K., Ockelford, A., Ebdon, J. E., and Cundy, A. B. (2020). Riverine microplastics: Behaviour, spatio-temporal variability, and recommendations for standardised sampling and monitoring. J. Water Process Eng. 38, 101600. doi:10.1016/j.jwpe.2020.101600
Stanton, T., Johnson, M., Nathanail, P., MacNaughtan, W., and Gomes, R. L. (2020). Freshwater microplastic concentrations vary through both space and time. Environ. Pollut. 263, 114481. doi:10.1016/j.envpol.2020.114481
Talvitie, J., Mikola, A., Koistinen, A., and Setälä, O. (2017). Solutions to microplastic pollution – removal of microplastics from wastewater effluent with advanced wastewater treatment technologies. Water Res. 123, 401–407. doi:10.1016/j.watres.2017.07.005
Veerasingam, S., Mugilarasan, M., Venkatachalapathy, R., and Vethamony, P. (2016). Influence of 2015 flood on the distribution and occurrence of microplastic pellets along the Chennai coast, India. Mar. Pollut. Bull. 109 (1), 196–204. doi:10.1016/j.marpolbul.2016.05.082
Wagner, M., and Lambert, S. (2018). Freshwater microplastics - Emerging environmental contaminants. New York City: Springer International Publishing.
Wagner, M., Scherer, C., Alvarez-Muñoz, D., Brennholt, N., Bourrain, X., Buchinger, S., et al. (2014). Microplastics in freshwater ecosystems: What we know and what we need to know. Environ. Sci. Eur. 26 (1), 12–19. doi:10.1186/s12302-014-0012-7
Watkins, L., Sullivan, P. J., and Walter, M. T. (2019). A case study investigating temporal factors that influence microplastic concentration in streams under different treatment regimes. Environ. Sci. Pollut. Res. 26 (21), 21797–21807. doi:10.1007/s11356-019-04663-8
Weithmann, N., Möller, J., Löder, M. G. J., Piehl, S., Laforsch, C., and Freitag, R. (2018). Organic fertilizer as a vehicle for the entry of microplastic into the environment. Sci. Adv. 4, eaap8060. doi:10.1126/sciadv.aap8060
World Economic Forum (2016). The new plastics economy - rethinking the future of plastics. Geneva Switzerland: W E F.
Xu, S., Ma, J., Ji, R., Pan, K., and Miao, A. J. (2020). Microplastics in aquatic environments: Occurrence, accumulation, and biological effects. Sci. Total Environ. 703, 134699. doi:10.1016/j.scitotenv.2019.134699
Zhang, Y., Gao, T., Kang, S., and Sillanpää, M. (2019). Importance of atmospheric transport for microplastics deposited in remote areas. Environ. Pollut. 254, 112953. doi:10.1016/j.envpol.2019.07.121
Zhang, K., Xiong, X., Hu, H., Wu, C., Bi, Y., Wu, Y., et al. (2017). Occurrence and characteristics of microplastic pollution in Xiangxi Bay of Three Gorges Reservoir, China. Environ. Sci. Technol. 51 (7), 3794–3801. doi:10.1021/acs.est.7b00369
Zhang, K., Gong, W., Lv, J., Xiong, X., and Wu, C. (2015). Accumulation of floating microplastics behind the three gorges dam. Environ. Pollut. 204, 117–123. doi:10.1016/j.envpol.2015.04.023
Keywords: microplastic, river, microplastic contamination, large-scale microplastic survey, enzymatic-oxidative purification, FTIR spectroscopy
Citation: Schrank I, Löder MGJ, Imhof HK, Moses SR, Heß M, Schwaiger J and Laforsch C (2022) Riverine microplastic contamination in southwest Germany: A large-scale survey. Front. Earth Sci. 10:794250. doi: 10.3389/feart.2022.794250
Received: 13 October 2021; Accepted: 22 August 2022;
Published: 26 October 2022.
Edited by:
Tim van Emmerik, Wageningen University and Research, NetherlandsReviewed by:
Daniel González-Fernández, University of Cádiz, SpainAlice A. Horton, United Kingdom
Montserrat Filella, Université de Genève, Switzerland
Copyright © 2022 Schrank, Löder, Imhof, Moses, Heß, Schwaiger and Laforsch. This is an open-access article distributed under the terms of the Creative Commons Attribution License (CC BY). The use, distribution or reproduction in other forums is permitted, provided the original author(s) and the copyright owner(s) are credited and that the original publication in this journal is cited, in accordance with accepted academic practice. No use, distribution or reproduction is permitted which does not comply with these terms.
*Correspondence: Martin G. J. Löder, Martin.Loeder@uni-bayreuth.de; Christian Laforsch, Christian.Laforsch@uni-bayreuth.de
†These authors have contributed equally to this work and share first authorship