Hydrothermal Dynamics of Seasonally Frozen Soil With Different Vegetation Coverage in the Tianshan Mountains
 Shen Ma
 Bin Yang3
  Jingyi Zhao
 Ji Chen
- 1Beiluhe Observation and Research Station on Frozen Soil Engineering and Environment in Qinghai-Tibet Plateau, State Key Laboratory of Frozen Soil Engineering, Northwest Institute of Eco-Environment and Resources, Chinese Academy of Sciences, Lanzhou, China
- 2University of Chinese Academy of Sciences, Beijing, China
- 3Command Center of Comprehensive Natural Resources Survey, China Geological Survey, Beijing, China
The hydrothermal relationship between vegetation and seasonal frozen soil is one of the key research contents in the fields of permafrost ecological environment, hydrology and climate change in alpine mountainous areas. Based on the monitoring data of air temperature, precipitation and soil hydrothermal conditions at the depth of 0–5 m from site TS-04 (with high vegetation coverage) and site TS-05 (with low vegetation coverage) in the alpine grassland of the Tianshan Mountains, this study compared and analyzed the characteristics of freezing-thawing process, temperature and moisture changes of seasonal frozen soil with different vegetation coverage. The results show that the maximum seasonal freezing depth of the two sites is almost comparable, but site TS-04 has a smaller freezing and thawing rate, and a shorter duration of freeze-thaw at all depths. TS-04 also has a smaller annual range of surface temperature and ground-air temperature difference. The analysis indicates that vegetation acts as a thermal buffer and has a good thermal insulation effect on the ground surface. Site TS-04 had high unfrozen water content in the unfrozen period and the water content increased with depth, while the unfrozen water content was low in site TS-05. In addition, the thresholds of soil water content response to rainfall events at 5 cm depth of site TS-04 and site TS-05 were 5 and 11 mm precipitation respectively, which indicated that the high vegetation coverage is conducive to rainwater infiltration, and the underlying soil of the site has a faster response to rainfall events.
Introduction
Many factors affect the soil hydrothermal state in the alpine ecosystem. The coupling of various factors (e.g., air temperature, precipitation, soil properties) results in variations in the subsurface soil at different temporal-spatial scales (Yang et al., 2007; Wang et al., 2009; Dai et al., 2013). Among these factors, vegetation cover has a significant influence on the soil hydrothermal status over a short period of time (Cheng et al., 2008). The interactions between soil moisture and heat with different vegetation types and amount of coverage are also different. The temperature and moisture conditions of subsurface soil often control many processes of the ecosystem. In cold regions, subsurface soil often experiences intense seasonal freezing and thawing, which complicates the heat and moisture exchange between soil and the ecosystem (Wu et al., 2003).
The variations in subsurface soil hydrothermal processes in alpine regions can lead to anomalies in the land–air energy and water balance, which can significantly affect surface hydrological processes, the ecological environment, carbon–nitrogen cycles, and climate systems in the Qinghai-Tibet Plateau and its surrounding areas (Groffman et al., 2011; Natali et al., 2011; Li et al., 2016). In permafrost regions, surface vegetation plays a very important role in the development of permafrost by changing the hydrothermal coupling cycle of the underlying soil. Vegetation coverage influences thaw–freeze cycles and thermal states of permafrost. The differences in vegetation type and coverage result in varying heat and water exchange efficiencies in subsurface soil. A deeper understanding of the relationship between soil and vegetation can more accurately describe the interaction between soil hydrothermal processes and vegetation and help establish a more accurate continental ecological model; thus, a more accurate land surface ecological model can be developed (Dickinson, 1986; Sellers et al., 1986). In permafrost regions, due to the unique periodic freeze and thaw of permafrost, there is insufficient understanding of the relationship between frozen soil and overlying vegetation. A numerical model that can accurately simulate the interaction between frozen soil hydrothermal processes and overlying vegetation has not been established. Thus, terrestrial ecological and surface models can not accurately reflect the processes of frozen ground (Nan et al., 2002; Xiao et al., 2013; Chen et al., 2015; Wu et al., 2018). Fully understanding the relationship between frozen soil and vegetation is a key issue to solve in establishing a model that can more accurately reflect the ecology and surface of frozen soil areas.
The Tianshan Mountains are the largest mountain range in Central Asia, where permafrost, seasonal frozen soil, and alpine steppe are prominent in high altitude areas. The Tianshan Mountains and the Qinghai-Tibet Plateau feature different permafrost types. The permafrost areas of the Qinghai-Tibet Plateau have high-plain permafrost, while the permafrost areas of the Tianshan Mountains have mountain-type permafrost. At present, domestic and foreign scholars have done a lot of research on the soil hydrothermal characteristics of the Qinghai Tibet Plateau, but the soil hydrothermal state in the Tianshan area is not yet clear. In the mountainous permafrost region of the Tianshan Mountains, how vegetation impacts the soil water and heat conditions (such as soil freeze–thaw and soil moisture phase changes) is still poorly understood. In this study, we used a large amount of field monitoring data from typical alpine grassland ecosystems in the hinterland of the Tianshan Mountains to study the differences of soil hydrothermal dynamic responses to vegetation coverage changes in typical seasonal frozen regions.
Study Area and Methods
Study Area and Observation Sites
The study area is located in the Kuixiandaban area, Tianshan Mountains, Xinjiang Province. This area has a typical continental dry climate (Figure 1). The nearest meteorological station is Daxigou station, which is built on the gentle slope of an alpine meadow with an altitude of 3,549 m in the headwater area of the Urumqi River. According to the long-term climatic data, the annual average air temperature of the Daxigou meteorological station was -4.97°C, and the annual average precipitation was 460.5 mm (1961–2016). The slope is 5.7° at the TS-04 site and 8.5° at the TS-05 site. According to field detection data, the lower limit of the permafrost distribution in the source area of the Urumqi River is 3,250 m on the sunny slope and 2,900 m on the shady slope.
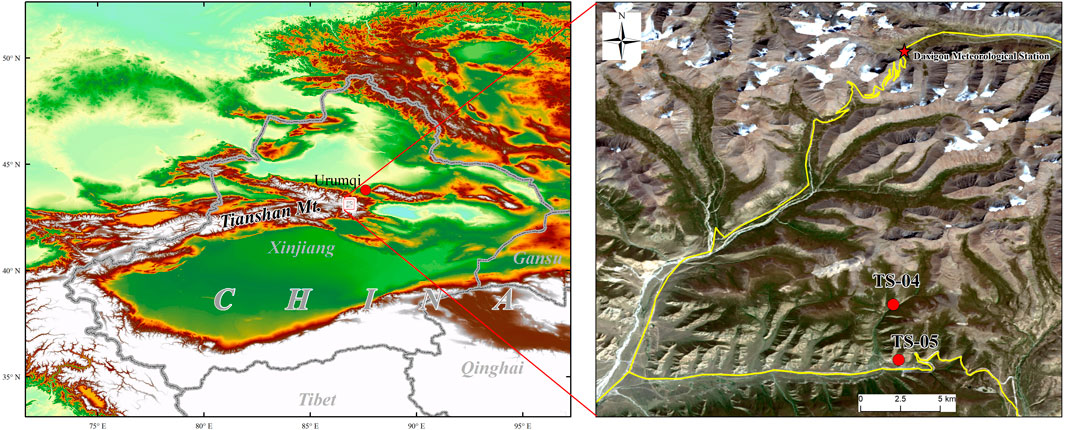
FIGURE 1. Location of the study area and observation sites.
The elevations of monitoring points TS-04 (42.97°N, 86.84°E) and TS-05 (42.94°N, 86.84°E) are 3,145 and 2,949 m, respectively. Both stations are located on the southern slope of the watershed between the north and south slopes of the Tianshan Mountains within the source area of the Ulastai River. The TS-04 site is located on the alluvial and diluvial platform in the Wusite Valley, 3.2 km from the Wusite Railway Bridge. On the east and west sides of the site, the rivers flowing southwest and southeast meet at 100 m south of the site, so the water conditions of the site are good. According to the drilling data, the main types and ranges of soil textures at the TS-04 site are black brown clay (0–0.3 m), fine sand (0.3–0.7 m), rock (0.7–1.3 m), sand stone (1.3–2 m), sand (2–3 m); the TS-05 site has fine sandy soil (0–0.3 m), clay (0.3–0.6 m), fine sand (0.6–1.2 m), and coarse sand with gravel (1.2–3 m). Field investigations show that the two study sites are not in the permafrost area, which is typically frozen seasonally.
The vegetation types of both sites are alpine steppe. The dominant plant species are S. purpurea, S. subsessiliflora, and S. basiplumosa of the dense perennial grasses of the genus Stipa L. and rhizome type perennial Carex-Qinghai-Tibet Carex, Artemisia wellbyi, A. younghusbandii, and A. minor. The vegetation coverage of the TS-04 site is 80–90%, while the vegetation coverage of the TS-05 site is 30–40%.
Methods
Collection of Basic Monitoring Data
The research period spans September 2017 to August 2018. The main observations include air temperature, snow depth, precipitation, soil temperature, and water content (Table 1). The snow depth and precipitation were measured by a SR50 snow depth detector (±1 cm) and a T200B precipitation meter (±0.1 mm), respectively. The air temperature at 2 m above the ground was measured by an HMP155A-L air temperature and humidity sensor (±0.2°C). A soil profile was excavated, and soil moisture sensors produced by the Campbell Company in the United States were inserted at depth intervals of 0.05, 0.20, 0.40, 0.80, 1.2, 1.6, and 2.0 m. In addition, soil moisture in this article refers to unfrozen water. The research team drilled a deep hole at each site to place cables produced by the State Key Laboratory of Frozen Soil Engineering to measure soil temperature at depths ranging from 0.05 to 40 m. A heat flux plate was placed at a depth of 5 cm in the soil surface. All sensors collected data at a rate of 30 min per session.
TABLE 1. List of measurements used in this study.
Definition of Precipitation Response Events and Freeze-Thaw Cycles
According to the accuracy of the rain gauge, when the precipitation was greater than 0.2 mm within 6 h, a new precipitation–soil moisture response process started. Six hours represents the interval between two consecutive precipitation periods; generally 6–8 h is used in the literature (Dunkerley, 2008). The instrument noise threshold was 0.2 mm because precipitation events with an interval of more than 6 h are very frequent, and 0.2 mm is a frequent isolated record that will not produce any soil moisture changes (Lozano-Parra et al., 2015). To study how precipitation events impact soil wetting, we defined the extent, start, and end times of precipitation events.
Diurnal changes in soil temperature may cause soil moisture to increase at a rate of 0.1% every 30 min during the day, so we defined a 0.2% increase in soil moisture within 30 min as the response threshold of soil moisture to precipitation (Lin and Zhou, 2008). To avoid the impact of snowfall on rainfall events, we selected the highest rainfall months of July, August, and September for analysis.
The freeze–thaw process of soil can be divided into four stages, regardless of the soil salinity and texture, according to the daily maximum and minimum temperatures of the soil: thawed period, Tmin>0°C; frozen period, Tmax<0°C; freezing period, Tmax >0°C and Tmin <0°C; thawing period, Tmax >0°C and Tmin <0°C. The freezing and thawing periods are also called the daily freeze–thaw cycle (Yang et al., 2007; Guo et al., 2011).
Result
Meteorological Data of TS-04 and TS-05 Stations
The meteorological conditions of the two stations are very similar, and the trend in the data is nearly the same (Figure 2). The wind speed near the ground is generally low in summer and high in the cold season. The wind speed near the ground of TS-05 is greater than that of TS-04 (Figure 2A). The variations in the daily average temperatures of the two stations are nearly the same, but there is an obvious temperature difference in summer (Figure 2B). The summer temperature of the TS-05 station is higher than that of the TS-04 station. There is a close relationship between the air relative humidity and precipitation. When a precipitation event occurs, it is often accompanied by an increase in air humidity. According to Figure 2C and Figure 2D, there is a good correlation between air humidity change and precipitation. It can also be seen that the precipitation of TS-05 is less than that of TS-04. According to the landform data of the two stations, we know that the vegetation of the TS-04 station is relatively dense due to abundant water and heat in summer. The vegetation grows more easily, and it can reduce the surface wind speed and solar radiation.
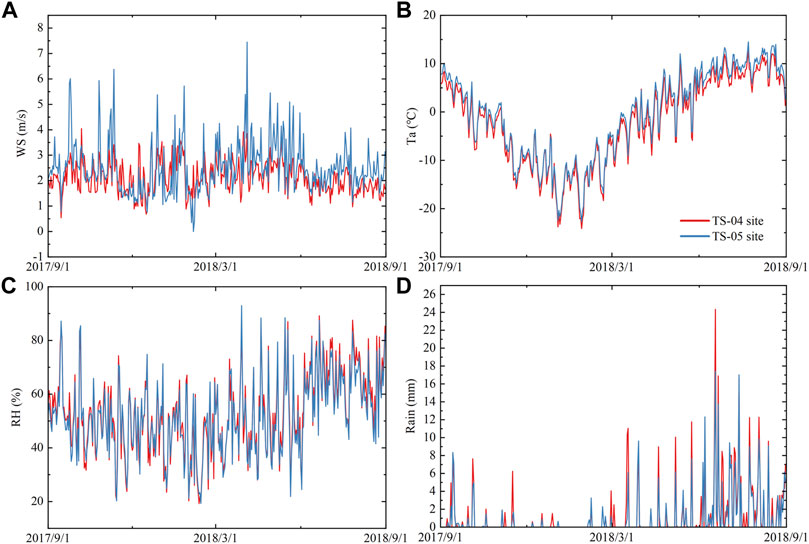
FIGURE 2. Comparison of meteorological data between TS-04 and TS-05 stations. (WS, Wind Speed; Ta, Air temperature; RH, Relative humidity).
Soil Thermal Conditions Under Various Amounts of Vegetation Coverage
Soil Heat Flux in Shallow Layers
Soil heat flux is an important thermal index of soil, which can directly reflect the transmission state of soil heat. When the ambient temperature is greater than the soil temperature, the heat passes into the soil from the environment under the action of the temperature gradient, and the soil heat flux is positive. In contrast, when the soil heat flux is negative, the soil releases heat to the environment. The study of heat exchange between soils elucidates the conditions of heat absorption and release in soil and the change of heat storage, which is directly related to the distribution of energy in the atmosphere and soil. These processes also play an important role in the study of climate change. Figure 3 shows the monthly mean change in soil heat flux and air temperature at TS-04 and TS-05. In the cold season, the soil heat flux at TS-04 varies from −18.31 (w/m2) to 10.87 (w/m2), with a range of 29.18 (w/m2). The minimum value occurs in January 2018, the maximum value occurs in April, and the annual average value is −1.58 w/m2. The minimum value of the soil heat flux at TS-05 was −6.19 w/m2 in November 2017, the maximum value was 4.49 w/m2 in March 2018, and the annual average value was −0.16 w/m2. The soil heat flux at the two stations was negative for 5 months, therefore the soil released heat to the environment. The soil absorbed heat from the environment in the remaining 7 months. Before the soil heat flux reaches the maximum value, the air temperature and soil heat flux exhibit the same trends. With a gradual increase of temperature, the soil heat flux decreased.
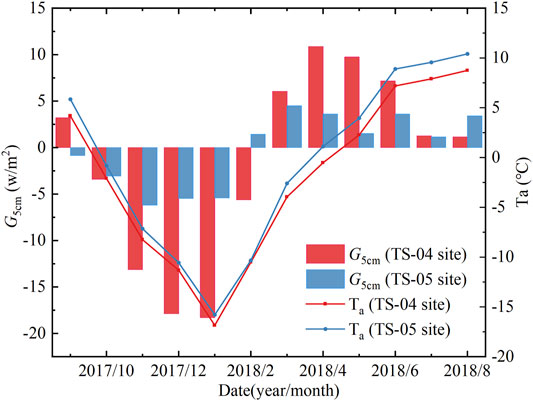
FIGURE 3. Monthly mean changes of air temperature (Ta) and 5 cm soil heat flux (G5cm) at TS-04 and TS-05 sites.
Temperature Change During Soil Freezing-Thawing
At the TS-04 site (Figure 4A), a significant daily freeze–thaw cycle occurs from a soil depth of 5–40 cm. The duration of the daily freeze–thaw cycle during the thawing period is significantly longer than the freezing period. As the soil depth increases, the duration of the daily freeze–thaw cycle gradually decreases. In a freeze–thaw cycle, the maximum duration of the daily freeze–thaw cycle at the soil surface (5 cm) is 37 days. In the thawing period, the duration of the daily freeze–thaw cycle is 27 days. There is almost no daily freeze–thaw cycle at 80 cm (it only occurs in the monitoring period for 3 days). From the beginning and ending times of the daily freeze–thaw cycle, there is a clear lag at each depth. The daily freeze–thaw cycle occurred on October 12, 2017 at the 5-cm layer, while the daily freeze–thaw cycle occurred at a 20-cm depth 1 month later. The daily freeze–thaw cycle appeared at the 80-cm depth on December 28 after 78 days and only lasted for 1 day (Table 2).
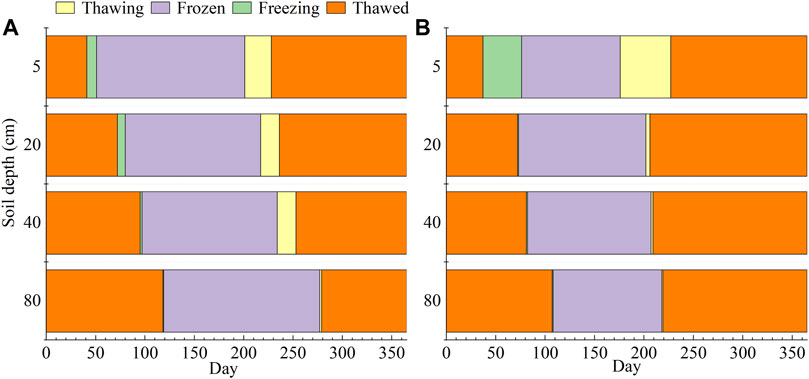
FIGURE 4. Daily freezing-thawing cycles occurred at 5∼80 cm of TS-04 and TS-05 sites (2017.9.1–2018.9.1).
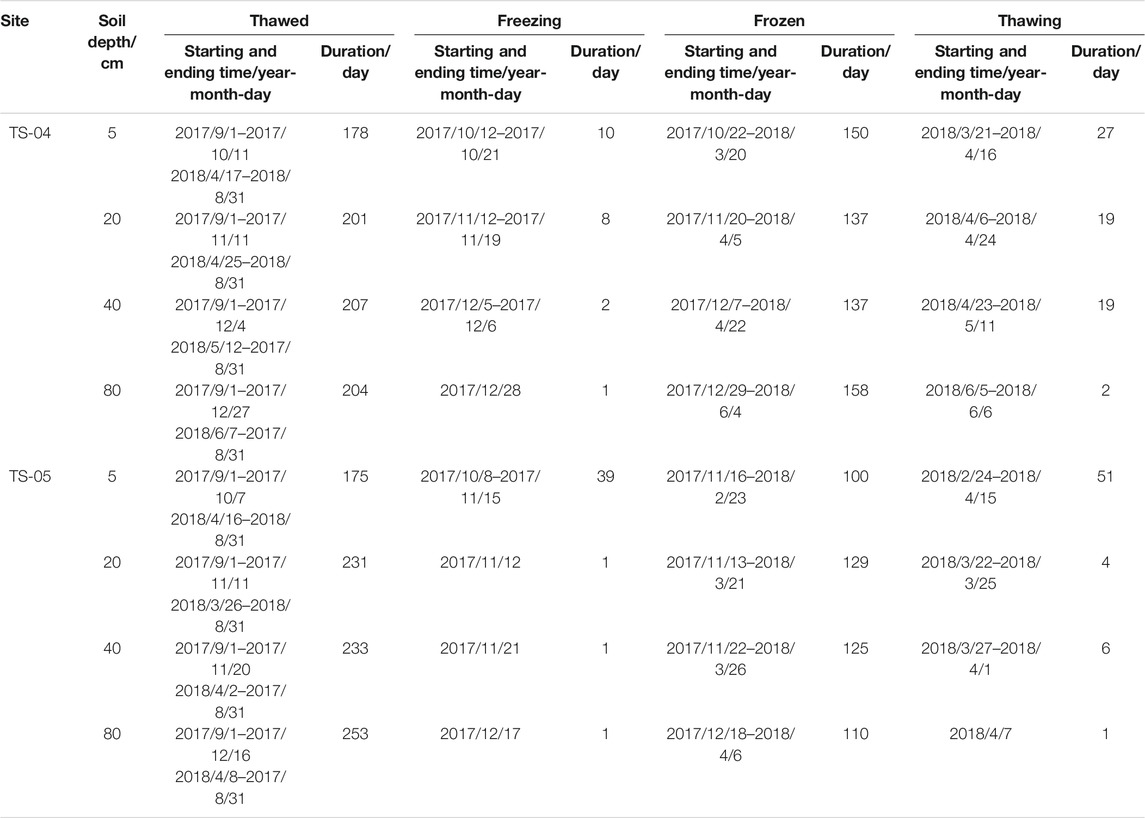
TABLE 2. The time of soil freeze-thaw process at different depths.
At the TS-05 site, the depth of the daily soil freeze–thaw cycle is less than that at the TS-04 site. The daily soil freeze–thaw cycle at TS-05 almost only occurs at the 5-cm layer (Figure 4B), while the depth of the daily freeze–thaw cycle at TS-04 reached 40 cm. The daily freezing–thawing cycle first occurred at 5 cm on October 8, 2017, and its duration of 39 days was much longer than that of soil under 5 cm. After 69 days, only a day-long freeze–thaw cycle occurred at a depth of 80 cm. The daily freeze–thaw cycle of soil at a depth of 5 cm during the thawing period began on February 24, 2018 and lasted for 51 days. In general, the characteristics of the daily freezing-thawing cycles at TS-05 and TS-04 are as follows: the duration of the daily freezing–thawing cycles in spring is longer than that in autumn, and the duration of the daily freeze–thaw cycle decreases with an increase of depth. In addition, TS-05 has a longer duration freeze–thaw cycle, but TS-04 has a deeper freeze–thaw depth than TS-05. The daily vertical transfer rate of the TS-05 freeze–thaw cycle in the thawing period (1.95 cm/d) is higher than that in freezing period (1.16 cm/d), but both values are higher than those at TS-04 (1.04 cm/d).
The monitoring results of a complete freeze–thaw cycle were analyzed in Figure 5. Both sites reflect the characteristics of “one-way freezing and two-way thawing” of seasonal frozen soil. The ground at TS-04 first entered the continuous freezing stage on October 21, 2017 (Figure 5A). During this stage, with a decrease of temperature, the soil in the seasonal frozen layer successively entered the frozen state. The freezing rate was relatively slow at the beginning, then with the decrease of temperature, the freezing rate began to accelerate. With the continuous downward movement of the freezing front, the soil reached maximum freezing depth on March 18, 2018. The maximum freezing depth was approximately 2.2 m. As the temperature rises, each layer of soil enters the thawing period, and the surface and the bottom of the seasonal frozen layer begin to absorb heat and thaw almost simultaneously. However, the soil at the bottom of the seasonal frozen layer changes very slowly, and the warming rate is only 0.1 cm/d. According to the preliminary analysis, the temperature differences of deep soil are very small such that the temperature gradient is small and leads to the slow soil warming. The thawing process from the surface downward begins at a relatively slow rate. The melting rate of soil begins to accelerate when the melting front reaches a depth of approximately 1 m. The two opposite melting processes (from the surface downward and from the bottom upward) finally met at a depth of 2 m on June 27, 2018. At this point, the seasonal frozen layer was completely melted.
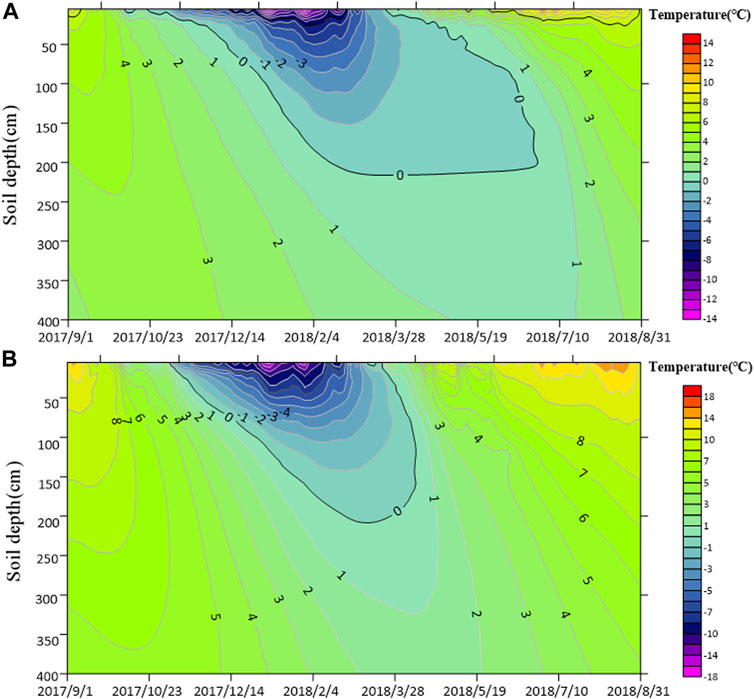
FIGURE 5. Soil temperature contour map of two sites:(A) TS-04 site and (B) TS-05 site.
For TS-05 in Figure 5B, the soil temperature at 5 cm began to exhibit negative temperatures continuously on November 6, 2017. Then, as the temperature decreased, the freezing front moved downward. The soil reached its maximum freezing depth (about 2.1 m) on March 8 of the following year, and the freezing rate was 1.74 cm/d. The topsoil and subsoil of the seasonal frozen layer entered the bidirectional thawing stage on March 21 and 9, 2018, respectively. The two melting fronts met at a depth of approximately 160 cm on April 10, and the melting rates were 7.62 cm/d (from top to bottom) and 1.52 cm/d (from bottom to top). After that, the soil entered the warming stage.
Difference Between Air Temperature and Soil Temperature at a 5 cm Depth
Vegetation is the interface of water and heat exchange between Earth and air and plays an important role in energy transfer; the difference in air temperatures can reflect the heat insulation effect of vegetation.
Ground–air temperature difference generally refers to the difference between air temperature and soil temperature at 5 cm; it can accurately reflect the influence of vegetation on the underlying soil temperature. The soil temperature trend at 5 cm was the same as that of air temperature (Figure 6). At TS-04 where the vegetation cover is vast, the maximum value of the ground–air temperature difference occurred in January 2018 (5.32°C), and the minimum value was in August 2018 (0.48°C), with an average temperature difference of 2.83°C (Figure 6A). However, in contrast to TS-04, the maximum (5.08°C) and minimum (0.67°C) ground-temperature difference at TS-05 (small vegetation coverage) occurred in summer (September) and winter (December), respectively (Figure 6B). Compared with TS-04, the average annual temperature difference at TS-05 increased by 0.48–3.31°C: greater vegetation coverage affects the heat balance of air and soil at the site through plant transpiration and water exchange between the atmosphere and soil. Thus, the 5-cm soil temperature at TS-04 (large vegetation coverage) will not dramatically rise or fall during the heating or cooling stage: this temperature helped with insulation in the cold season and cooling in the warm season.
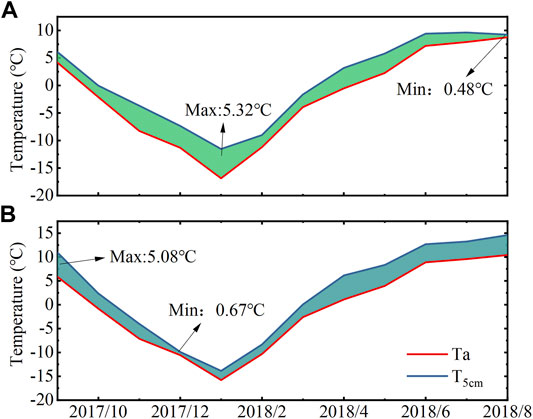
FIGURE 6. The difference of soil temperature at 5 cm with air temperature:(A) TS-04 site and (B) TS-05 site.
Soil Moisture Under Various Amounts of Vegetation Cover
Variation of Unfrozen Soil Water Content During a Freezing–Thawing Cycle
The variation of soil moisture in the seasonal frozen layer reflects the dry and wet conditions of soil and is an important part of the water cycle in the ground–air system. Through the analysis of unfrozen soil water content during the study period in Figure 7, the vertical variation of soil water at TS-04 was evident (Figure 7A). In the unfrozen period, there is a low aquifer and two high aquifers in the change curve of unfrozen soil water content. The low aquifer is about 40 cm (about 15% water content), and the high aquifer is about 20 cm (about 25% water content) and 160 cm (about 27% water content), respectively. Due to the frost process of soil, the unfrozen water content of soil at different depths varies greatly in a complete freeze–thaw cycle. With an increase of depth, the change of the soil moisture content has an obvious lag (Figure 8A). This is because the soil moisture content of the site is generally high, and sufficient heat needs to be released or absorbed in the freezing and thawing processes to change the soil moisture. The unfrozen water content in the shallow layer (0–20 cm) changed sharply and the fluctuation gradually weakened with an increase of depth. Thus, the soil over 20 cm at the site frequently exchanged water and heat with the atmosphere, and the soil moisture changed dramatically. Meanwhile, the deep soil was less affected by the external environment such that the overall trend was relatively stable.
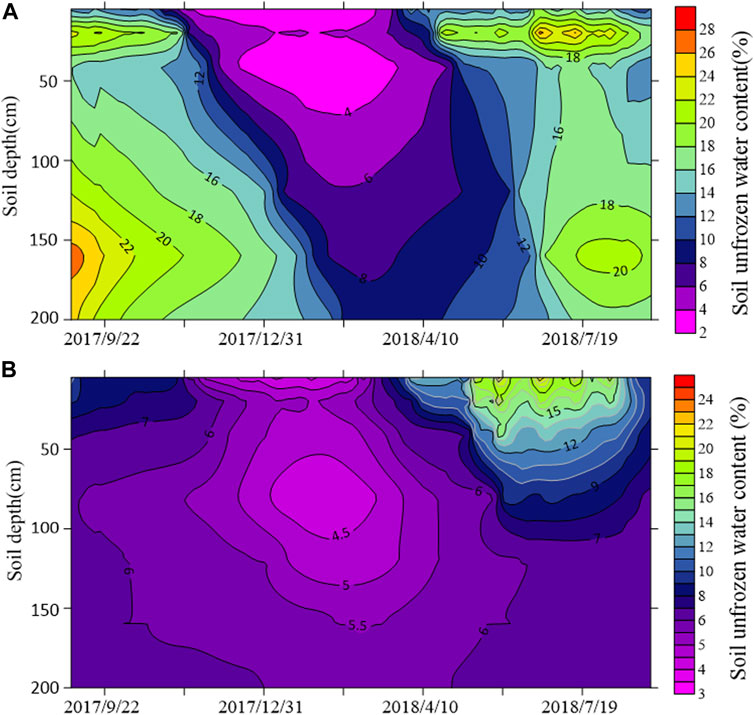
FIGURE 7. Isoline map of soil unfrozen water content in two sites:(A) TS-04 site, (B) TS-05 site.
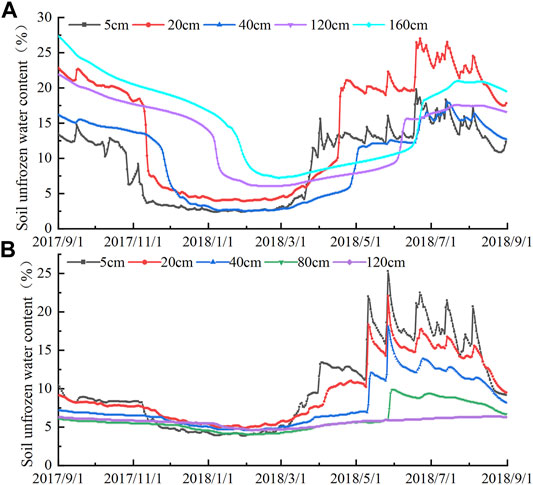
FIGURE 8. Change curves of soil unfrozen water content at different depths in TS-04 site (A) and TS-05 site (B).
The content of unfrozen water at TS-05 was analyzed. Based on Figure 7B, the soil moisture in the unfrozen period gradually decreased with an increase in depth. The unfrozen water content of the soil at different depths during the freeze–thaw stage shows little variation. The amplitude of the change curve of unfrozen soil water content was relatively small in the cold season, but the change was more intense in the warm season and the shallow layer has a higher unfrozen water content. The soil moisture at TS-05 was generally low, and the unfrozen water content did not change significantly in the freeze–thaw stage (Figure 8B). The rainfall has a strong effect on unfrozen soil water content within 1 m in summer when rainfall is greatest. The unfrozen water content at TS-04 is generally much greater than that at TS-05, and the unfrozen water content changes more widely in the phase transition of water.
Soil Moisture Replenishment by Rainfall
In addition to the changes of unfrozen soil water content under freeze–thaw, rainfall also plays an important role in supplementing soil moisture. In the rainfall–soil moisture system, the surface characteristics (especially vegetation) directly affect the soil response time to rainfall and the depth of infiltration. To study the influence of different vegetation coverages on the underlying soil moisture, the response time and depth of soil moisture during rainfall events were selected for analysis. As seen in Figure 9, the distribution of precipitation at the two sites is nearly the same; the annual rainfall at TS-04 and TS-05 is 410.18 and 347.27 mm, respectively. Rainfall events are mainly concentrated in June, July, and August, accounting for about 70% of the annual rainfall. The rainfall events from June 2018 to August 2018 were counted. A total of 31 rainfall events occurred at TS-04, 18 of which caused a response of soil moisture. There were seven low-intensity rainfall events (Figure 10). A total of 27 rainfall events occurred at TS-05, of which only four rainfall events were able to elicit a response of soil moisture (all occurred in high-intensity rainfall areas). A rainfall of 5.33 mm within 6 h at TS-04 can cause a response of the soil moisture at a depth of 5 cm, while TS-05 needs a continuous 9.5 h of rainfall to reach 12.54 mm. From the point of view of the infiltration depth of rainfall (Figure 11), six of the 18 effective rainfall events (i.e., those that can cause a response of soil moisture) at TS-04e could cause a change in the soil moisture at 20 cm; the minimum rainfall was 7.56 mm (lasting for 1.5 h). However, the four effective rainfall events at TS-05 only caused a response of the soil moisture at 5 cm.
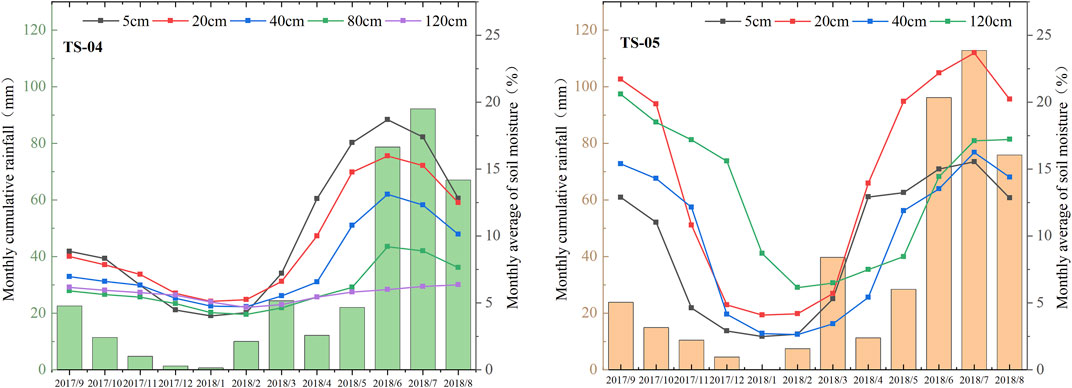
FIGURE 9. Monthly accumulated precipitation and monthly average unfrozen water content of soil at TS-04 site and TS-05 site.
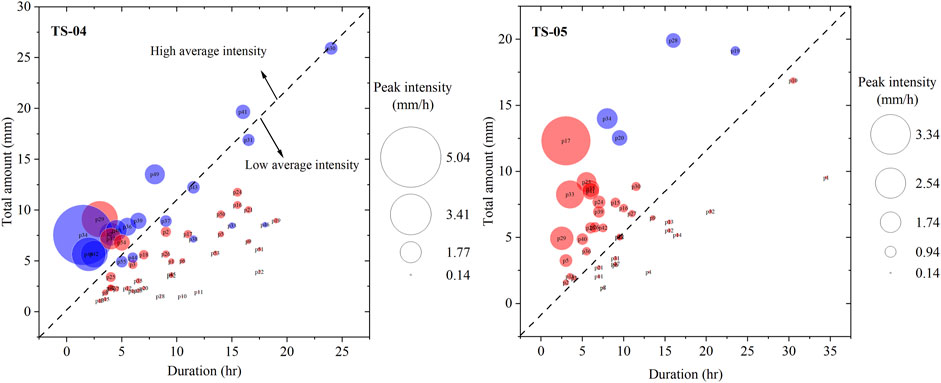
FIGURE 10. Bubble plots of the intensity of rainfall in the summer and the response of soil moisture at TS-04 and TS-05 sites.
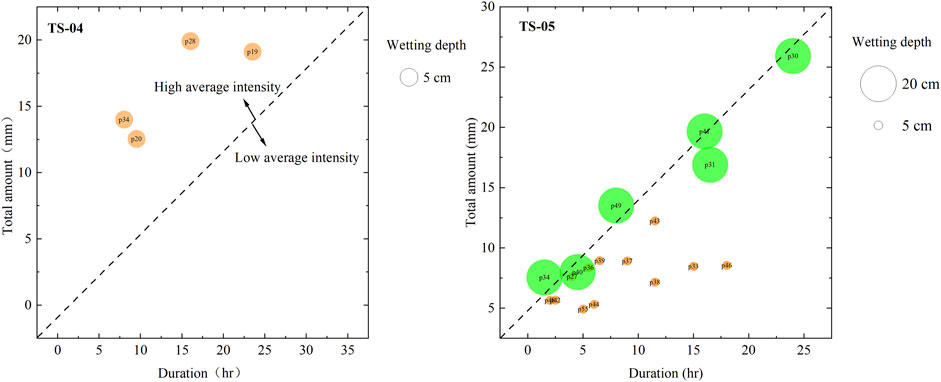
FIGURE 11. Depth of soil moisture response to rainfall at TS-04 and TS-05 sites.
Discussion
Effects of Vegetation Coverage on the Thermal Condition of the Soil
Vegetation is an important component of terrestrial ecosystems, participating in a variety of physical, chemical and biological processes between the atmosphere and soil (Van Hall et al., 2017; Pang et al., 2019; Gu et al., 2020). At high altitudes, intense solar radiation can cause dramatic changes in surface temperature. Vegetation can effectively reduce near-surface radiation through photosynthesis and leaf shielding, thus reducing the range of surface temperature variation, which is very important for frozen soil (Fedorov et al., 2019). The TS-04 site has 90% vegetation coverage, and dense vegetation can greatly reduce solar radiation reaching the ground. Although the radiation of TS-05, where vegetation coverage is relatively smaller, can also be reduced to a certain extent, it is much less of a change than that of TS-04. Thus, the soil temperature at all depths at TS-05 were higher than that at TS-04 (Figure 12). However, this difference gradually decreased with the soil depth. When the soil reaches a certain depth, the impact of vegetation on the soil is very weak, and the soil temperature difference between the two stations is very small. In permafrost regions, another factor affecting soil thermal conditions of vegetation is the process of freezing and thawing. Vegetation coverage impacts soil heat transfer efficiency (Domine et al., 2016). Vegetation slows down the heat transfer rate between the ground and air during soil freezing–thawing, resulting in delayed soil heat absorption or heat dissipation. This process delays the initial time of soil freezing and thawing and slows down the freezing–thawing rate (Guo et al., 2011). This further explains the differences in freeze–thaw processes between the two sites in Figure 5.
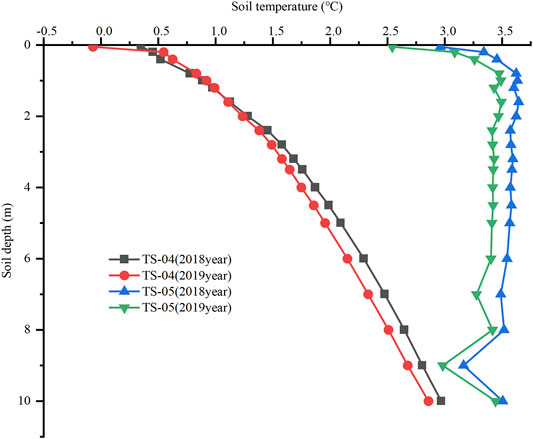
FIGURE 12. Envelope of soil temperature under different vegetation coverage.
Vegetation covers the surface and has a large impact on the surface soil. The thermal insulation of vegetation inhibits the temperature change of shallow soil caused by temperature changes. Some studies show that there is a significant negative correlation between vegetation coverage and surface temperature (Weng et al., 2004). The 5-cm heat flux and ground–air temperature difference at the two stations shows that vegetation coverage has a profound impact on the thermal state of shallow soil. Interestingly, the variation range of the 5-cm soil heat flux at TS-04 was greater than that at TS-05. It is reasonable that the vegetation coverage at TS-04 is higher, so it greatly reduces the heat transfer at the 5-cm soil depth, but the result is the opposite. Soil temperature and soil moisture are not independent variables, and their mutual coupling is a real law. In the frozen soil region, the coupling process is very complex due to the particularity of frozen soil. The phase change of soil moisture has a profound impact on the change of the soil heat flux. The unfrozen soil water content at TS-04 can double that at TS-05. The soil with a higher content of unfrozen water has higher ice content in the cold season, so TS-04 (greater vegetation coverage) will release more heat. In the warm season, because the thermal conductivity of ice is greater than that of soil, ice will preferentially absorb more heat and melt into water. As temperatures and rainfall increase and vegetation enters the growing season, the plant canopy reduces the amount of solar radiation reaching the ground. Therefore, although the air temperature continued to rise, the heat flux at TS-04 decreased. The annual average soil heat flux of the two stations is negative, indicating that the heat transfer direction in this area is from soil to atmosphere, which is more conducive to the development of frozen soil.
The influence of vegetation on soil thermal conditions is multifaceted and complex. Vegetation reduces 1) wind speed near the surface, 2) evaporation of water from the topsoil and 3) the release of heat from the soil to the air. Vegetation can also increase or decrease the heat transfer properties of soil by changing the soil environment. In addition to vegetation, winter snow in Tianshan also affects the thermal conditions of soil. Snow will generally reduce the soil temperature, but a particular snow depth also plays a role in thermal insulation. This paper has not studied the impact of snow on soil thermal conditions in Tianshan, but it is clear that the impact of snow on soil temperature cannot be ignored.
Effects of Vegetation Coverage on Soil Water Content
The soil moisture content in frozen soil areas can determine the degree of soil freezing in the cold season. Vegetation is the main interface of soil water exchange with the outside environment, which will have an important impact on the content of the soil water. Generally, soil water retention is controlled by vegetation characteristics and soil properties. The change of vegetation and soil properties will inevitably lead to a change in soil water retention (Dai et al., 2020). Soil organic matter can increase the adsorption of water and affect the soil water retention, which is the most important factor affecting the soil water of alpine grasslands (Wang et al., 2016). The abundant vegetation at the TS-04 site increases the content of soil organic matter, which changes the distribution of the soil water. At the TS-04 site, plant roots are most concentrated at a soil depth of 20 cm. Plant roots can increase the soil water retention of rhizosphere soil, but more mucus produced by roots will reduce the saturated hydraulic conductivity at a 20-cm depth; thus, it will reduce the soil moisture at adjacent depths. This process explains why the unfrozen water content of soil at a 20-cm depth at the TS-04 site rapidly increases (Figure 13). Studies have shown that a higher degradation of grassland produces a lower soil moisture content (Pan et al., 2017). In this study, the overall soil moisture of the TS-04 site, where the vegetation coverage is greater, is higher than that at TS-05.
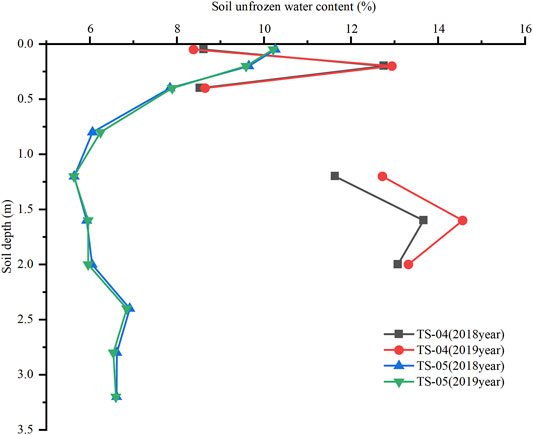
FIGURE 13. Envelope of soil unfrozen water content under different vegetation coverage.
Importantly, vegetation affects soil moisture content through the response of vegetation to precipitation. Plant roots affect the infiltration capacity and rate by indirectly affecting the characteristics of soil structure and changing soil channels. Therefore, the precipitation infiltration rates of soil with different vegetation types and vegetation coverage vary (Cui et al., 2019). Studies have shown that the infiltration rate of alpine grassland with large vegetation coverage is 125% higher than that with small vegetation coverage. In this study, the response of soil moisture to rainfall at the two sites with different amounts of vegetation coverage was significantly different; large vegetation coverage showed better permeability. Therefore, the soil moisture at the TS-04 site continuously accumulates during rainfall such that the overall moisture content is much greater than that of the TS-05 site. The TS-05 site has small vegetation coverage and a weak water infiltration capacity. Only heavy rainfall events can cause a change in the 5-cm shallow soil water.
Topography also has a great influence on the distribution of soil moisture. The slope of the TS-05 site is steeper than that of the TS-04 site, which is also an important factor affecting the response of soil moisture to rainfall. Sites with steeper slopes have difficulty storing rainwater because most of the rainwater is lost through surface runoff and cannot supplement the soil moisture. This process is also an important explanation of the difference between soil moisture at the two sites.
Conclusion
The results showed that the change in vegetation cover significantly affected the soil freeze–thaw process. Because of the heat insulation of vegetation, the start time of soil freezing–thawing was delayed and the rate of soil freezing–thawing decreased at the site with high vegetation coverage. A smaller vegetation coverage correlates to a shallower and longer duration soil daily freeze–thaw cycle. The duration of daily freeze–thaw cycles during the thawing period was significantly longer than that in the freezing period, and the number of days experiencing a daily freeze–thaw cycle significantly decreased with an increase in the soil depth.
The effect of vegetation is mainly reflected in the winter thermal insulation and summer cooling. A greater vegetation coverage correlates to a larger temperature difference between the ground and air in the cold season, a smaller temperature difference between the ground and air in the warm season, and better insulation of the soil. A higher vegetation coverage correlates to a greater impact of the soil moisture on the soil thermal conditions.
Rainfall easily accumulates in areas with high vegetation coverage. The overall soil moisture content at the site with large vegetation coverage is greater than that at the site with small vegetation coverage.
Data Availability Statement
The original contributions presented in the study are included in the article/supplementary material, further inquiries can be directed to the corresponding author.
Author Contributions
All authors listed have made a substantial, direct, and intellectual contribution to the work and approved it for publication.
Funding
This work was funded by the Independent Project of the State Key Laboratory of Frozen Soils Engineering (Grant No. SKLFSE-ZQ-55).
Conflict of Interest
The authors declare that the research was conducted in the absence of any commercial or financial relationships that could be construed as a potential conflict of interest.
Publisher’s Note
All claims expressed in this article are solely those of the authors and do not necessarily represent those of their affiliated organizations, or those of the publisher, the editors and the reviewers. Any product that may be evaluated in this article, or claim that may be made by its manufacturer, is not guaranteed or endorsed by the publisher.
Acknowledgments
We thank the reviewers for their valuable comments and suggestions that helped to improve the manuscript.
References
Chen, H., Nan, Z., Zhao, L., Ding, Y., Chen, J., and Pang, Q. (2015). Noah Modelling of the Permafrost Distribution and Characteristics in the West Kunlun Area, Qinghai-Tibet Plateau, China. Permafrost Periglac. Process. 26 (2), 160–174. doi:10.1002/ppp.1841
Cheng, H., Wang, G., Hu, H., and Wang, Y. (2008). The Variation of Soil Temperature and Water Content of Seasonal Frozen Soil with Different Vegetation Coverage in the Headwater Region of the Yellow River, China. Environ. Geol. 54 (8), 1755–1762. doi:10.1007/s00254-007-0953-x
Cui, Z., Wu, G.-L., Huang, Z., and Liu, Y. (2019). Fine Roots Determine Soil Infiltration Potential Than Soil Water Content in Semi-arid Grassland Soils. J. Hydrol. 578, 124023. doi:10.1016/j.jhydrol.2019.124023
Dai, L., Yuan, Y., Guo, X., Du, Y., Ke, X., Zhang, F., et al. (2020). Soil Water Retention in alpine Meadows under Different Degradation Stages on the Northeastern Qinghai-Tibet Plateau. J. Hydrol. 590, 125397. doi:10.1016/j.jhydrol.2020.125397
Dai, Y., Shangguan, W., Duan, Q., Liu, B., Fu, S., and Niu, G. (2013). Development of a China Dataset of Soil Hydraulic Parameters Using Pedotransfer Functions for Land Surface Modeling. J. Hydrometeorology 14 (3), 869–887. doi:10.1175/jhm-d-12-0149.1
Dickinson, R. E. (1986). Biosphere/Atmosphere Transfer Scheme (BATS) for the NCAR Community Climate Model. Technical report. NCAR.
Domine, F., Barrere, M., and Sarrazin, D. (2016). Seasonal Evolution of the Effective thermal Conductivity of the Snow and the Soil in High Arctic Herb Tundra at Bylot Island, Canada. The Cryosphere 10 (6), 2573–2588. doi:10.5194/tc-10-2573-2016
Dunkerley, D. (2008). Identifying Individual Rain Events from Pluviograph Records: a Review with Analysis of Data from an Australian Dryland Site. Hydrol. Process. 22 (26), 5024–5036. doi:10.1002/hyp.7122
Fedorov, A. N., Konstantinov, P. Y., Vasilyev, N. F., and Shestakova, A. A. (2019). The Influence of Boreal forest Dynamics on the Current State of Permafrost in Central Yakutia. Polar Sci. 22, 100483. doi:10.1016/j.polar.2019.100483
Genxu, W., Shengnan, L., Hongchang, H., and Yuanshou, L. (2009). Water Regime Shifts in the Active Soil Layer of the Qinghai-Tibet Plateau Permafrost Region, under Different Levels of Vegetation. Geoderma 149 (3), 280–289. doi:10.1016/j.geoderma.2008.12.008
Groffman, P. M., Hardy, J. P., Fashu-Kanu, S., Driscoll, C. T., Cleavitt, N. L., Fahey, T. J., et al. (2011). Snow Depth, Soil Freezing and Nitrogen Cycling in a Northern Hardwood forest Landscape. Biogeochemistry 102 (1), 223–238. doi:10.1007/s10533-010-9436-3
Gu, C., Mu, X., Gao, P., Zhao, G., Sun, W., and Tan, X. (2020). Distinguishing the Effects of Vegetation Restoration on Runoff and Sediment Generation on Simulated Rainfall on the Hillslopes of the Loess Plateau of China. Plant Soil 447 (1), 393–412. doi:10.1007/s11104-019-04392-4
Guo, D., Yang, M., and Wang, H. (2011). Characteristics of Land Surface Heat and Water Exchange under Different Soil Freeze/thaw Conditions over the central Tibetan Plateau. Hydrol. Process. 25 (16), 2531–2541. doi:10.1002/hyp.8025
Li, W., Wu, J., Bai, E., Jin, C., Wang, A., Yuan, F., et al. (2016). Response of Terrestrial Carbon Dynamics to Snow Cover Change: A Meta-Analysis of Experimental Manipulation (II). Soil Biol. Biochem. 103, 388–393. doi:10.1016/j.soilbio.2016.09.017
Lin, H., and Zhou, X. (2008). Evidence of Subsurface Preferential Flow Using Soil Hydrologic Monitoring in the Shale Hills Catchment. Eur. J. Soil Sci. 59 (1), 34–49. doi:10.1111/j.1365-2389.2007.00988.x
Lozano-Parra, J., Schnabel, S., and Ceballos-Barbancho, A. (2015). The Role of Vegetation Covers on Soil Wetting Processes at Rainfall Event Scale in Scattered Tree woodland of Mediterranean Climate. J. Hydrol. 529, 951–961. doi:10.1016/j.jhydrol.2015.09.018
Nan, Z. T., Li, S. X., and Liu, Y. Z. (2002). Mean Annual Ground Temperature Distribution on the Tibetan Plateau: Permafrost Distribution Mapping and Further Application. J. Glaciology Geocryology 24 (2), 142–148. (in Chinese).
Natali, S. M., Schuur, E. A. G., Trucco, C., Hicks Pries, C. E., Crummer, K. G., and Baron Lopez, A. F. (2011). Effects of Experimental Warming of Air, Soil and Permafrost on Carbon Balance in Alaskan Tundra. 17(3), 1394–1407. doi:10.1111/j.1365-2486.2010.02303.x
Pan, T., Hou, S., Wu, S., Liu, Y., Liu, Y., Zou, X., et al. (2017). Variation of Soil Hydraulic Properties with alpine Grassland Degradation in the Eastern Tibetan Plateau. Hydrol. Earth Syst. Sci. 21 (4), 2249–2261. doi:10.5194/hess-21-2249-2017
Pang, Z., Jiang, L., Wang, S., Xu, X., Rui, Y., Zhang, Z., et al. (2019). Differential Response to Warming of the Uptake of Nitrogen by Plant Species in Non-degraded and Degraded alpine Grasslands. J. Soils Sediments 19 (5), 2212–2221. doi:10.1007/s11368-019-02255-0
Sellers, P. J., Mintz, Y., Sud, Y. C., and Dalcher, A. (1986). A Simple Biosphere Model (SIB) for Use within General Circulation Models. J. Atmos. Sci. 43 (6), 505–531. doi:10.1175/1520-0469(1986)043<0505:asbmfu>2.0.co;2
Van Hall, R. L., Cammeraat, L. H., Keesstra, S. D., and Zorn, M. (2017). Impact of Secondary Vegetation Succession on Soil Quality in a Humid Mediterranean Landscape. CATENA 149, 836–843. doi:10.1016/j.catena.2016.05.021
Wang, X., Yi, S., Wu, Q., Yang, K., and Ding, Y. (2016). The Role of Permafrost and Soil Water in Distribution of alpine Grassland and its NDVI Dynamics on the Qinghai-Tibetan Plateau. Glob. Planet. Change 147, 40–53. doi:10.1016/j.gloplacha.2016.10.014
Weng, Q., Lu, D., and Schubring, J. (2004). Estimation of Land Surface Temperature-Vegetation Abundance Relationship for Urban Heat Island Studies. Remote Sensing Environ. 89 (4), 467–483. doi:10.1016/j.rse.2003.11.005
Wu, Q. B., Shen, Y. P., and Shi, B. (2003). Relationship between Frozen Soil Together with its Water-Heat Process and Ecological Environment in the Tibetan Plateau. J. Glaciology Geocryology 25 (3), 250–255.
Wu, X. B., Nan, Z. T., Wang, W. Z., and Zhao, L. (2018). Simulation of the Impact of Vegetation and Soil Characteristics on Permafrost over the Tibetan Plateau Based on the Noah Land Surface Model. J. Glaciology Geocryology 40 (2), 279–287. (in Chinese).
Xiao, Y., Zhao, L., Dai, Y., Li, R., Pang, Q., and Yao, J. (2013). Representing Permafrost Properties in CoLM for the Qinghai-Xizang (Tibetan) Plateau. Cold Regions Sci. Tech. 87, 68–77. doi:10.1016/j.coldregions.2012.12.004
Keywords: frozen ground, vegetation coverage, soil freezing-thawing cycle, hydrothermal process, Tianshan Mountains
Citation: Ma S, Yang B, Zhao J, Tan C, Chen J, Mei Q and Hou X (2022) Hydrothermal Dynamics of Seasonally Frozen Soil With Different Vegetation Coverage in the Tianshan Mountains. Front. Earth Sci. 9:806309. doi: 10.3389/feart.2021.806309
Received: 31 October 2021; Accepted: 23 December 2021;
Published: 01 February 2022.
Edited by:
Sizhong Yang, GFZ German Research Centre for Geosciences, GermanyReviewed by:
Wei Shan, Northeast Forestry University, ChinaShuying Zang, Harbin Normal University, China
Copyright © 2022 Ma, Yang, Zhao, Tan, Chen, Mei and Hou. This is an open-access article distributed under the terms of the Creative Commons Attribution License (CC BY). The use, distribution or reproduction in other forums is permitted, provided the original author(s) and the copyright owner(s) are credited and that the original publication in this journal is cited, in accordance with accepted academic practice. No use, distribution or reproduction is permitted which does not comply with these terms.
*Correspondence: Ji Chen, chenji@lzb.ac.cn