Influence of Internal Structure on Breaking Process of Short-Lived Landslide Dams
 Chu-Ke Meng
 Kun-Ting Chen
 Zhi-Pan Niu
 Bao-Feng Di1
 - 1Institute for Disaster Management and Reconstruction, Sichuan University, Chengdu, China
- 2Compound Disaster Prevention Research Center, General Research Service Center, National Pingtung University of Science and Technology, Pingtung, Taiwan
- 3Department of Soil and Water Conservation, National Pingtung University of Science and Technology, Pingtung, Taiwan
- 4State Key Laboratory of Hydraulics and Mountain River Engineering, Sichuan University, Chengdu, China
The diversity of the landslide dam structure will result in the difference in the dam body’s seepage. In this paper, based on two kinds of soil bodies of different particle gradations, fourteen groups of structures of the landslide dam are designed to generalize different seepage developments and breaking processes. The study shows that the saturation and seepage evolution characteristics of the landslide dam's seepage have a considerable influence on the landslide dam’s breaking characteristics. An empirical formula is fitted according to the time-seepage degree curve of the landslide dams of different breaking processes to predict the breaking forms of the landslide dams before the dam break. During the water storage process of the landslide dam, the seepage's saturation process inside the dam body reduces the stability of the landslide dam, thus affecting the evolution of the failure process after it has started. In the experiment, it is found that the growth rate of the seepage degree of the landslide dam is inversely proportional to the growth rate of the dam breach area. Although the internal penetration of landslide dams is usually undervalued, the result verifies that the study on the seepage process before the breaking of landslide dam is conductive for further understanding the breaking mechanism of the landslide dam.
Introduction
Landslide dam is like a knife on the neck of the downstream residents. Once it breaks, the lives and property of the downstream residents will be devastated (Costa and Schuster, 1988; Casagli et al., 2003). The larger the capacity of the barrier lake, the more devastating the flood will be. For a long-lived landslide dam, due to the long-term blockage of the channel, the water quantity in front of the reservoir will gradually accumulate and increase, so the destructive power after breaking will be stronger to the downstream. Although the dam failure risk of this kind of barrier lake is still high, most of its failure is a gradual process. Researchers usually have enough time to enter the site to collect data, analyze and work out the disposal plan. After manual treatment, the danger of this kind of dam will be greatly reduced. However, although its storage capacity is small and its destructive power to the downstream is weak for a short-lived landslide dam, researchers can hardly arrive at the site in time before its breaking. This kind of landslide dam usually bursts naturally and causes no less loss to the downstream than the long-lived landslide dam. For example, Tangjiashan landslide dam, the most dangerous dam in the 2008 Wenchuan earthquake in China (Chen et al, 2009; Cui, 2009), had no casualties after manual disposal. However, in 2014, the Hsiaolin landslide dam was caused by a rainstorm, breaking naturally within an hour after its formation, causing 398 deaths (Chen et al., 2014). Therefore, it is urgent to study short-lived landslide dams’ failure mechanisms.
The breaking process of a landslide dam is affected by numerous factors. The upstream hydrological conditions of the landslide dam will affect the inflow and the water content of the dam. The topography of the landslide dam (the width and the depth of the river channel, the slope of the river banks on both sides, and the soil properties, etc.) nearby will affect the type and the physico-mechanical properties of a landslide dam (Costa and Schuster, 1988). The scholars in relevant fields usually study the breaking mechanism and breaking process of the landslide dam based on model tests. Morris et al. (2007) and Höeg K et al. (2004) carried out experiments indoors and in the field to study the flow process when the landslide dam break and how the horizontal expansion of the breach evolves as a function of dam body composition. Niu Zhi-Pan (Niu et al., 2012) studied the breaking mechanism and breaking process under specific circumstances with “the pile group positioning method” based on dam models with different seepage conditions and different particle gradations, with and without channels, and the considering two cascade dam. Jiang and Cui (2016) carried out model tests on landslide dams for different dam shapes and inflows and conducted in-depth research on the breach’s longitudinal evolution during the dam break. Ding-Zhu et al. (2017) studied the widening process of landslide dam breaches by analyzing the dam section data under the tests of different dam heights and dam slope ratios.
The scholars usually adopted uniform materials so that the dam bodies’ mechanical properties did not vary. Consequently, the test results may differ considerably from the actual situations (Ming et al., 2020). This is because the seepage characteristics (refer to the changing mechanism of the flow field inside the dam) and the soil’s anti-erosion ability in each part of the dam body will greatly impact the breaking process (Annandale, 2005). The evolution of breaches (e.g., type, shape, duration) and dam failure floods (e.g., the shape of the hydrograph and peak discharge) is dependent on the specific composition of each landslide dam (Costa and Schuster, 1988; Casagli et al., 2003). The particle size and physico-mechanical properties of a landslide dam at different internal parts are quite different, which causes various changes in seepage evolution and dam failure forms. If the dam break process is simulated according to a uniform material, it may not reflect the actual failure process. For example, Tangjiashan, the biggest landslide dam induced by the 2008 Wenchuan earthquake, its soil structure is mainly composed of upper and lower parts. The upper part is covered with a layer of loose gravel soil, and the bottom is accumulated with strong weathered debris clastic rocks and weakly weathered clastic rocks (Li et al., 2010; Zhenming et al., 2016). In 2014, the Ludian Magnitude-6.5 Earthquake in Yunnan Province formed Hongshiyan Barrier Lake on Niulanjiang River. The composition of the landslide dam is complex. The major structure of the dam is the up-down structure. The upper soil layer is mainly composed of isolated stones, block stones, gravel, and a small amount of sandy soil and isolated block stones (Liu, 2014; Wang and Du, 2015). Due to the loose accumulation of large rocks and obvious gaps among rocks, the permeability coefficient of the upper soil layer is likely to be large. The lower part of the dam body is covered by three soil layers. The soil layers are different in lithology, but generally, the permeability coefficient is low, which means that seepage failure is unlikely to occur. In 2018, Baige Landslide Dam was formed by two landslides. The material comprising the landslide dam is mainly comprised of fine particles, but the upstream slope and the downstream soil body mainly consist of coarse-grained particles (Cai et al., 2019; Deng et al., 2019; Zhong et al., 2020). As seepage increases and develops, the physico-mechanical properties of the substances inside the landslide dam will change greatly. For example, the shear strength, plasticity index, and liquidity index will change considerably so that the physico-mechanical properties of the whole dam body will change accordingly, and the stability of the dam body will be greatly different from that before the seepage. Further research is needed on the mechanics of breach formation and development of the dam bodies with non-uniform internal mechanical properties in the process of seepage and erosion by water flow.
This paper carried out model tests based on fourteen kinds of landslide dams with different structures to study the previous problems. Such landslide dams have different permeability characteristics before the formation of the breach. Firstly, the landslide dam's saturation and the evolution of the saturation line under various circumstances are analyzed, and the similarities and differences are summarized. Afterward, the breaking characteristics such as the evolution mechanism of the dam breach, the change process of breach flow are analyzed and summarized under various circumstances. Finally, the influences of the seepage process on the dam failure characteristics are investigated.
Experimental Test
Test Design
Figure 1 shows the overall experiment device. The width of the experiment section of the water channel is 0.5 m, and the length is 7 m. The water channel's sidewalls on both sides of the landslide dam are made of tempered glass. When the bed slope of the flume is low, the landslide dam will not break instantaneously. But when the bed slope of the flume is high, the possibility of instantaneous dam break of the landslide dam under the same conditions is greatly increased, and this kind of problem is rarely studied. Therefore, to simulate the instantaneous dam break of the landslide dam, the slope of the flume is set at 15°in this experiment.
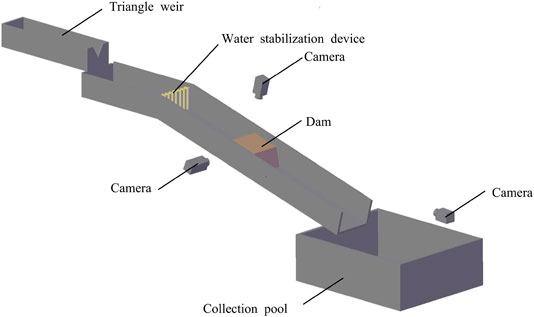
FIGURE 1. Experimental setup.
In the experiment, the water is supplied by the circulating water supply system that consists of a reservoir, pump room, water leveling tower, water supply pipe, and a water return channel. The model’s inlet head is connected to the water supply pipe, and a valve controls the incoming water. The inlet head is equipped with water measuring facilities, water leveling facilities, and rectifying facilities. The initial inflow of the model is measured by a right-triangle thin-walled measuring weir. The computational formula is Q = C0H2.5, in which Q refers to the outflow flow, C0 refers to the flow coefficient of the right-triangle thin-walled measuring weir, and H refers to the head above the weir crest. According to the specific size of the triangular weir used in the experiment and relevant application experience, C0 = 1.4. The head above the weir crest is measured with a measuring needle whose measurement precision is 0.1 mm. The inflow of this experiment is 0.6 ± 0.1 L/s.
Three high-speed cameras are used to capture the whole process. The side camera beside the water channel’s sidewall is used to capture the dam edge’s saturation by the water flow and the change of the water level behind the dam. A camera is placed at the top of the dam to monitor the dam crest’s saturation and the dam breach by the overtopping water. A camera is placed in front of the dam to monitor the downstream slope's erosion by the water flow.
Materials and Data
The erodibility of the landslide deposit is one of the most important intrinsic factors governing a landslide dam’s erosion process due to overtopping (Chang and Zhang, 2010). Under the same inflow test, the higher the soil erodibility is, the larger the breach size is, the shorter the breach time is, and the higher the peak outflow rate is (Chang and Zhang, 2010). With different dam structures, the seepage characteristic and erodibility of the dams differ considerably, which are the main variables in this study. Besides, the particle gradation and the proportion of coarse and fine particles in the soil slope will affect the formation mechanism of soil failure and debris flow initiation (Cui et al., 2017; Liu et al., 2020), which are critical issues in the study of landslide dam breaking mechanism.
Based on the importance of particle grading and the landslide dam’s internal structure, the dam body is composed of coarse-grained soil and fine-grained soil to simulate the difference in the landslide dam’s permeability. The gradations of the soil bodies composed of coarse-grained soil and fine-grained soil used in this experiment are shown in Figure 2, and the initial parameters are shown in Table 1. The coarse-grained soil’s median particle diameter is 2.8 mm, the nonuniformity coefficient is 1.5, the water content rate is 8.5%, and the permeability coefficient is 5 × 10⁻¹ cm/s. In this study, we consider this type of soil as high permeability. The fine-grained soil's median particle diameter is 0.85 mm, the nonuniformity coefficient is 4.4, the water content rate is 8.7%, and the permeability coefficient is 6 × 10⁻⁴ cm/s. In this study, we consider this type of soil as low permeability. The permeability of the landslide dam made up of these two kinds of soils is closely related to their location and content. The dam body's permeability coefficient is generally between that of the coarse-grained soil and that of the fine-grained soil. For the landslide dam with the up-down structure, the permeability coefficient is slightly lower than 5 × 10⁻¹ cm/s. For the landslide dam with the front-back structure, the permeability coefficient is slightly higher than 6 × 10⁻⁴ cm/s. In this paper, the mechanism of the seepage characteristic of the dam is one of the main research objects.
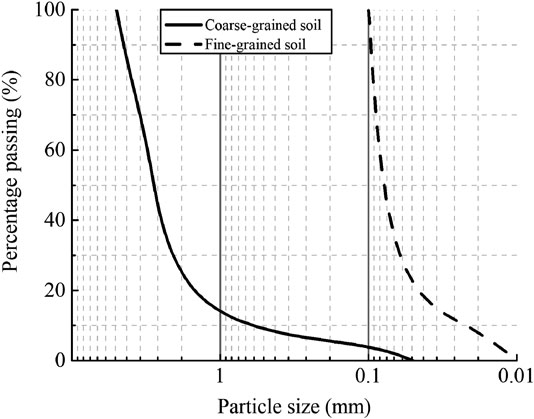
FIGURE 2. The particle size distribution of the experiment material.

TABLE 1. Soil mechanical parameters: d50 is the median particle size; Cu is the coefficient of nonuniformity.
The test arrangements are shown in Table 2. Test 1 and Test 2 are about the landslide dams composed of uniform soil. Such dam forms are adopted by many researchers and are taken as the reference group. In order to study practical cases that are composed of layered soils and the influence thereof on the breaking process, a variety of possible combinations need to be considered. In this experiment, Test 3–1, Test 3–2, Test 3–3, Test 4–1, Test 4–2, and Test 4–3 generalize the up-down structure of the landslide dam, and Test 5–1, Test 5–2, Test 5–3, Test 6–1, Test 6–2, and Test 6–3 generalize the front-back structure of the landslide dam to scrutinize the seepage and breaking characteristics of various structures in actual situations.
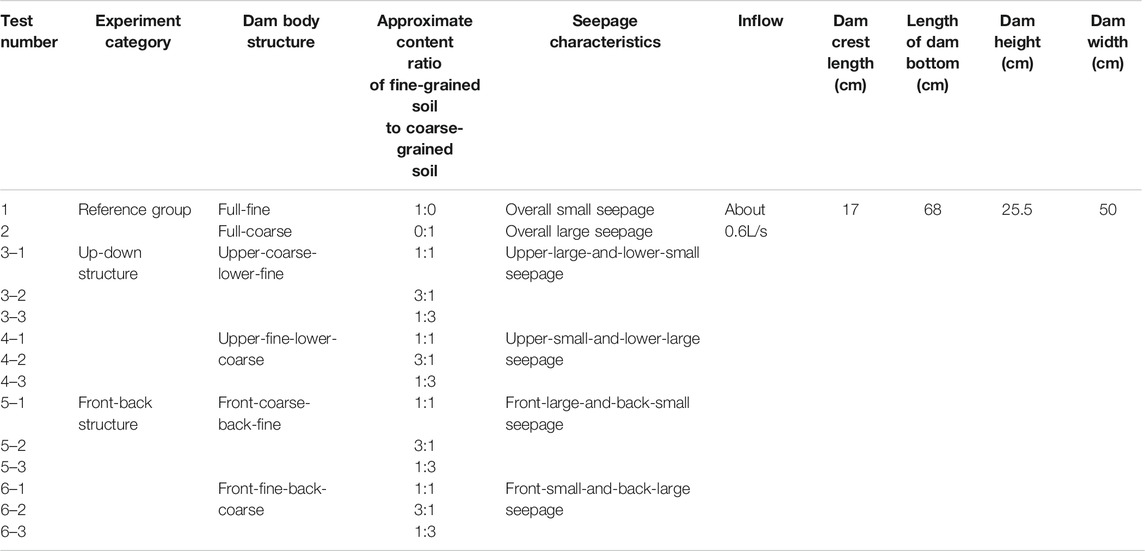
TABLE 2. Test arrangements for fourteen types of dams.
Test Methods
Seepage Degree
The development of the saturation lines began before the dam break, and the seepage evolution before the dam break is an important influencing factor that induces different dam failure forms. Therefore, this paper conducted an in-depth analysis of the seepage evolution before the dam break. To quantify the development of the saturation line and find the mechanism for different forms of dam break in the experiment, this paper uses a dimensionless index p in the experiment to represent the seepage degree of the landslide dam, which is defined as:
In the formula, p is the seepage degree at a specific moment, representing the length of development when the front end of the saturation line develops along the longitudinal direction of the water channel, L0 is the length of development when the front end of the saturation line develops along the longitudinal direction of the water channel, and L is the length of the dam body in such direction. The value-taking method is shown in Figure 3. When p = 0, there is no or only a small amount of water permeating through the dam body; when 0 < p < 1, there is a certain amount of water permeating through the dam body and the seepage channel inside the dam is developing; and when p = 1, a stable seepage channel has been formed inside the dam body.
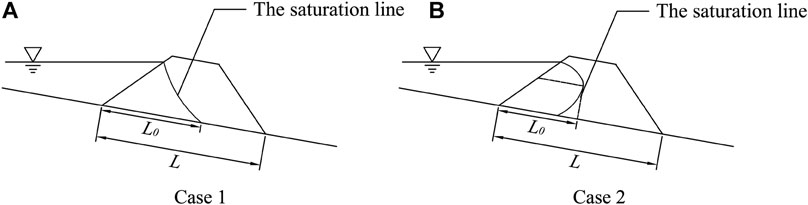
FIGURE 3. The calculation of the seepage degree. The experiment parameters, including the length of development when the front end of the saturation line develops along the longitudinal direction of the water channel L0 and the length of the dam body L, are shown. Two kinds of experiments are shown: (A) When the foremost end of the saturation line appears at the bottom of the dam; (B) When the foremost end of the saturation line does not appear at the bottom of the dam.
Dam Breach Area
According to the computational formula of the broad-crested weir, the discharge flow of the dam breach is closely related to the size of the dam breach. In this study, the cross section of the breach is assumed to be trapezoidal (Chang and Zhang, 2010). The change in the depth and width of the dam breach will lead to the flow change at the dam breach, and the dam breach area will be affected by the depth and the top and bottom widths of the dam breach, which can well reflect the law of change in the size of the dam breach during the dam break. The computational diagram is shown in Figure 4, and the formula is as follows:
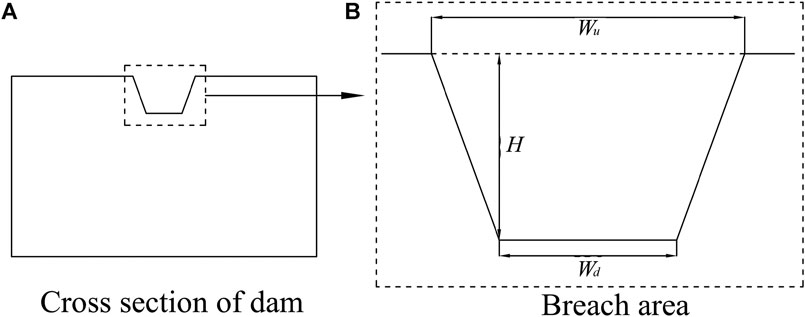
FIGURE 4. The calculation of dam breach area. Wu is the top width of the dam breach (m), Wd is the bottom width of the dam breach (m), and H is the depth of the dam breach (m), respectively. Different perspectives of dam body: (A) the cross section of the dam; (B) the breach area of the cross section of the dam.
In the formula, Ab is the dam breach area (m2), Wu is the top width of the dam breach (m), Wd is the bottom width of the dam breach (m), and H is the depth of the dam breach (m).
Dam Breach Flow
In this experiment, the camera placed at the side of the landslide dam model monitors the change of the water level behind the dam in real-time. By analyzing the law of change of the water level behind the dam, the flow process of the dam breach during the test can be obtained with the dynamic equilibrium equation of water quantity. The specific dam breach flow is calculated as follows:
The following formula is about the relationship between the water storage in front of the dam V and the water depth h. The schematic diagram is shown in Figure 5.
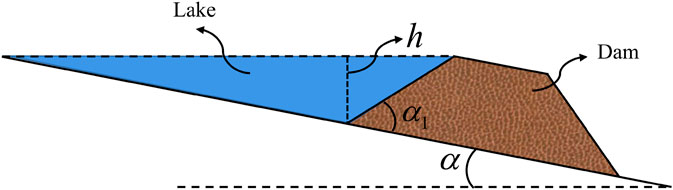
FIGURE 5. Side view of the dam: h is the distance between the water surface and the upstream slope foot (m), α is the slope of the water channel (°), and α1 is the upstream slope angle (°) of the dam body, respectively.
In the formula, V is the storage capacity (m3), D is the width of the water channel (m), h is the distance between the water surface and the upstream slope foot (m), α is the slope of the water channel (°), and α1 is the upstream slope angle (°) of the dam body.
In this test, the process of change of the water level behind the dam can be obtained through the camera, i.e., after h is known, the dam breach flow at a certain moment can be calculated with the dynamic equilibrium equation of water quantity. Before and after the upstream inflow reaches the dam, it will permeate through the soil. There is no accurate measuring method for such part of the flow, and this part of the flow is relatively small, with little influence on the overall trend of the flow curve. Therefore, the seepage flow is ignored in the flow calculation in this test. After adjustment, the dynamic equilibrium equation of water quantity is as follows:
In the formula, Qin is the inflow (L/s), Qout is the flow at the dam breach (L/s), V is the storage capacity (m3), and t is the time (s).
Test Result
Breaking Process and Mechanism
Before the barrier lake is fully filled, the internal seepage process of the dam develops slowly. There is very small overflow or no overflow, and the dam can remain stable. After the barrier lake is full, the overflowing water washes the top of the dam, causing the landslide dam failure. This is the most common way to break a landslide dam, and many scholars have described and defined this kind of phenomenon (Costa and Schuster, 1988; Cai et al., 2001). The breaking process of Test 1, Test 3–1, Test 3–2, Test 3–3, Test 5–1, Test 5–2, Test 5–3, Test 6–1, Test 6–2, and Test 6–3 was similar to the above phenomenon. According to the experimental phenomenon and the research of related scholars, this phenomenon is assumed as overtopping, which is also the most common breaking mechanism in this experiment.
As the dam that blocks the river, whether it is an artificially constructed dam or a naturally formed landslide dam, there is a danger of being damaged by seepage (Wrachien and Mambretti, 2009). In Test 2, Test 4–1, Test 4–2, Test 4–3, before the barrier lake is full, the internal seepage process of the dam body develops rapidly. After the soil at the bottom of the landslide dam is saturated and the shear strength decreases, the upper dam body loses stability along the shear plane, causing the dam to break. This phenomenon is assumed as dam slope instability.
Evolution Process of Saturation Line
After the upstream inflow begins to impound in front of the landslide dam, it is likely to permeate downstream in the form of seepage inside the dam body. Seepage evolution exists in the whole process from the beginning of water storage to the end of a dam break. Figure 6 shows the development of the saturation line at the side of the dam body before the landslide dam breaks, from the time when the upstream inflow just arrives at the front of the dam to the instability and collapse of the dam body or the overtopping and break of the dam body.
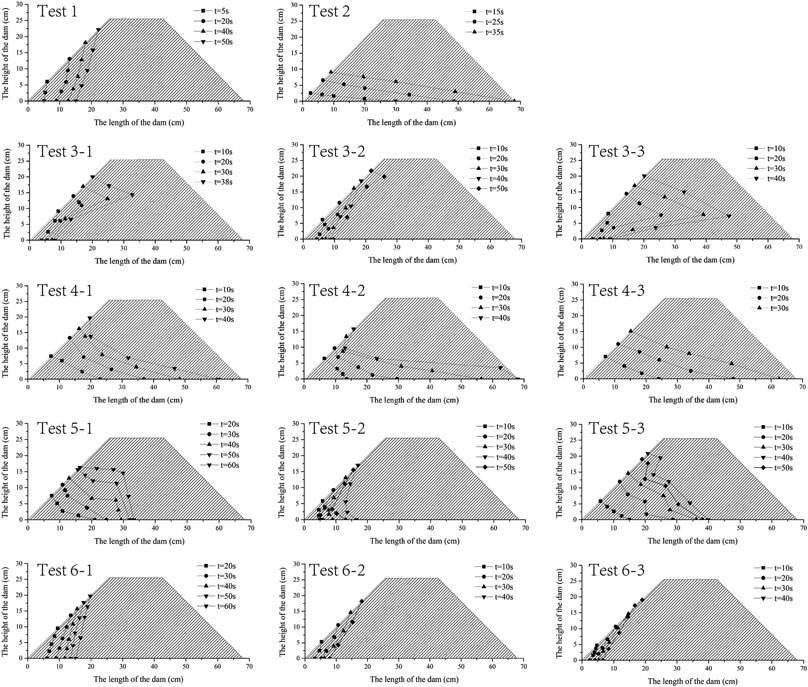
FIGURE 6. The development process of the saturation line.
The dam body structures of the two groups of landslide dams in the reference group are full-coarse and full-fine dam structures (Test 1 and Test 2), respectively. Due to the uniform substances comprising the dam bodies, Test 1 and test 2’s shapes of the saturation lines are relatively regular, i.e., the shapes of the saturation lines are “narrow bottom triangle” and “wide bottom triangle” respectively, as shown in Figures 6A,B. For the dam body with the upper-coarse-lower-fine dam structure (Test 3–1, Test 3–2, and Test 3–3), the permeability of the lower soil is poor, and the saturation rate is slow when the water level is low. When the water level gradually rises, the saturation rate at the junction of the two types of soils is relatively fast. The saturation line is “protruding in the middle”, as shown in Figures 6C–E, respectively. For the dam body with the upper-fine-lower-coarse dam structure (Test 4–1, Test 4–2, and Test 4–3), when the water level is lower than the lower soil, the saturation rate of the lower soil by the water flow is relatively fast; as the water level rises, the lower saturation line continues to develop downstream, while the saturation line of the upper soil develops slowly; and when the water level reaches the dam crest, the saturation line of the lower soil is very close to the downstream slope foot, and the saturation line is “caving in the middle”, as shown in Figures 6F–H, respectively. For the dam body with the front-coarse-back-fine structure (Test 5–1, Test 5–2, and Test 5–3), the front half of the dam body is the soil of high permeability. Such soil below the water level is easy to reach saturation in a short time; as the water level rises, the saturation line mainly develops upwards, while the downstream development is relatively slow; and its saturation line has a shape of “platform”, as shown in Figures 6I–K, respectively. For the dam body with the front-fine-back-coarse structure (Test 6–1, Test 6–2, and Test 6–3), the front half of the dam body is the soil of low permeability. The saturation line develops very slowly at the beginning, similar to that of the landslide dam with the full-fine structure, and its saturation line has a shape of “narrow bottom triangle”, as shown in Figures 6L–N, respectively.
Figure 7A is the seepage degree curves of all tests. On the whole, the coarse-grained soil layer of high permeability is one of the important factors affecting the development of the permeation degree P. As the water level in front of the dam gradually rises, the seepage degree of the soil layer of high permeability inside the dam body will increase gradually, while the shear strength will decrease gradually, thus reducing the overall stability of the dam body. During the rise of the water level in front of the dam, the landslide dam may break due to structural instability. If the landslide dam remains stable during the water level rise in front of the dam, it will be eroded by the overtopping water eventually.
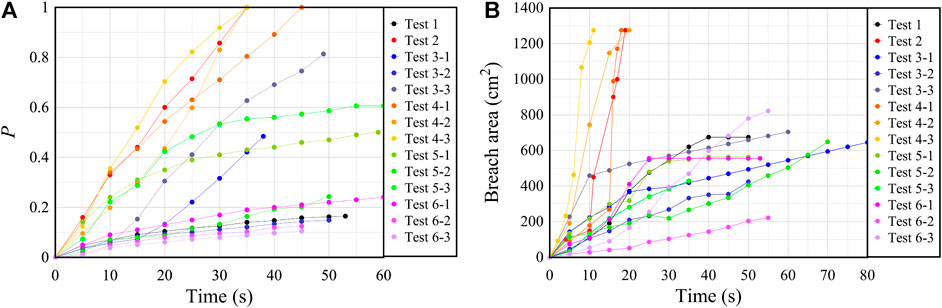
FIGURE 7. (A) The seepage degree curves in the experiment; (B) The breach area curves in the experiment.
The dams’ growth rates of saturation with the full-coarse and full-fine structures are approximately at two extremes. The overall growth rate of the seepage degree curve of the landslide dam composed of fine-grained soil is low and gradually converges. In contrast, the overall growth rate of the seepage degree curve of the landslide dam composed of coarse-grained soil is relatively high, and the value of p reaches 1, which means that seepage channels have been formed inside it. The seepage degree curves of the landslide dams composed of the two kinds of soils show different development at different stages. In the test, the growth rate of the seepage degree curve of the landslide dam with the up-down structure remains a high value before the overtopping, which can be concluded that when the inflow is relatively small, such kind of landslide dam has a high risk of dam slope instability. In contrast, the seepage degree curve of the landslide dam with the front-back structure gradually converges and its value increases slowly, so it is difficult to form seepage channels in a short time. The dam slope instability risk of such kind of landslide dam is relatively low.
Figure 8 reflect the dimensionless relation between p and T. T =t/ts, in which t refers to the difference between the present moment and the moment when the upstream inflow just arrives at the front of the dam, i.e., the current survival time of the landslide dam and ts refers to the difference between the moment when the dam slope instability or the overtopping occurs and the moment when the upstream inflow just arrives at the front of the dam, i.e., the life of the landslide dam.
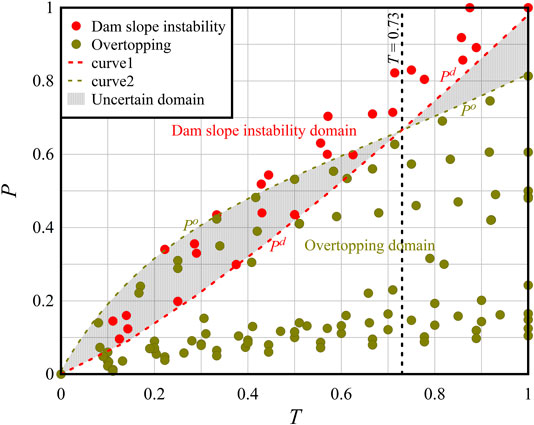
FIGURE 8. The dimensionless relation between p and T: p is the seepage degree, and T is the dimensionless parameter of time. The expression of curve one is Eq. 5, the expression of curve two is Eq. 6. The shaded area is the uncertain domain. Above the uncertain domain is the dam slope instability domain. Below the uncertain domain is the overtopping domain.
By fitting the lateral points of the dam slope instability data and the overtopping data, respectively, we can obtain that:
In the formula, Po is the upper limit of the overtopping domain, Pd is the lower limit of the dam slope instability domain, and the values of Po and Pd range from 0 to 1; the value of T also ranges from 0 to 1. Both p and T are dimensionless quantities.
By substituting p = L0/L and T = t/ts into Eq. 5 and Eq. 6, we can obtain:
ts can be calculated with the following formula:
In the formula, Lo and Ld are permeation distance parameters, L is the bottom length of the landslide dam, Vw is the storage capacity (m3), Qin is the inflow (m3/s), and Qp is the seepage flow (m3/s). For the landslide dam that is damaged by overtopping, the seepage flow is usually small. Thus, in the process of practical application, compared with the situation in which the inflow is relatively small, Qp can be ignored.
When an existing landslide dam has not broken yet after its formation, if its L0 is known, the possible breaking form of the dam can be judged based on the following circumstances:
when
If
If
when
If
If
Analysis of the Breaking Process
Figure 9 shows the breaking situations of the landslide dam under different tests. The change process of the dam breach area of the landslide dam in the test is shown in Figure 7B. The dam breach area of the landslide dam damaged by dam slope instability (Test 2, Test 4–1, Test 4–2, and Test 4–3) is much larger than that of the landslide dam damaged by overtopping (Test 1, Test 3–1, Test 3–2, Test 3–3, Test 5–1, Test 5–2, Test 5–3, Test 6–1, Test 6–2, and Test 6–3). Its dam breach area increases sharply in a short time, from which we can see that the development of the landslide dam damaged by dam slope instability is violent. For the dam body with the upper-coarse-lower-fine dam structure (Test 3–1, Test 3–2, and Test 3–3), because of the coarse-grained soil in the upper part, the growth rate of the dam breach area is relatively high at the beginning, but when flow begins to erode fine-grained soil in the lower part, the development becomes extremely slow. This is because when the dam body is high, the potential energy of the overtopping water is great so that the water flow can wash away more silt. When the dam height is low, the low hydraulic gradient makes the water flow less dynamic so that the water flow can only wash away limited silt. As a result, the lower eroding force and the larger anti-erosion ability of the soil in the lower part make the breaking time longer.
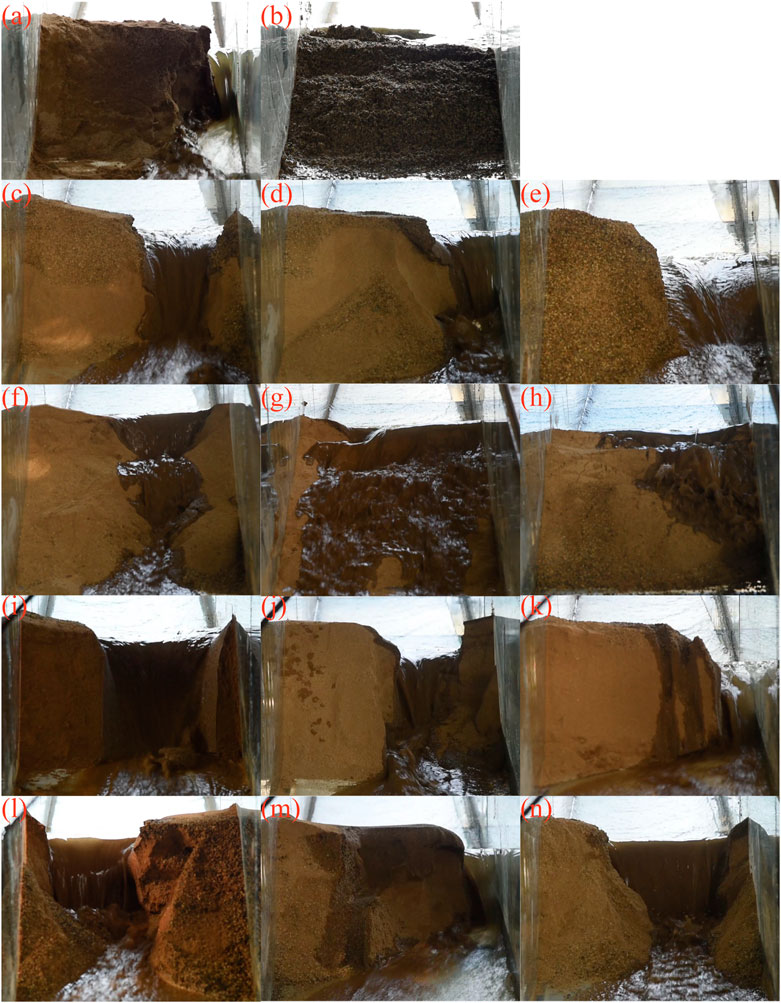
FIGURE 9. The breaking situations of fourteen types of dams: (A) Test 1; (B) Test 2; (C) Test 3–1; (D) Test 3–2; (E) Test 3–3; (F) Test 4–1; (G) Test 4–2; (H) Test 4–3; (I) Test 5–1 (J) Test 5–2 (K) Test 5–3 (L) Test 6–1 (M) Test 6–2 (N) Test 6-3.
Table 3 shows the specific values of seepage and breach parameters of overtopping landslide dams. It can be seen in Figure 7B that the overtopping water flow is an important factor in determining the expansion speed and final size of the dam breach at the breaking stage of the landslide dam. The overflowing water flow is inversely correlated with the seepage flow when the inflow is constant. In the overtopping process, the greater the amount of overflow per unit time is, the greater the hydro energy will be, and the more intense the scouring to the dam body will be. For example, the landslide dam represented by Test 1 has the lowest growth rate of seepage degree, indicating that its seepage flow is the lowest, its overtopping flow is the highest, the scouring to the soil on the surface of the dam is more violent, and the dam breach area may be larger. By further analyzing in the tests of this paper in which the breaking form is overtopping, we found that the growth rate of the dam breach area during overtopping and dam break is inversely proportional to the growth rate of the seepage degree before the dam break and that the final dam breach area is also inversely proportional to the final seepage degree before the dam break. The fitted curve is shown in Figure 10, and the fitting formula is as follow:
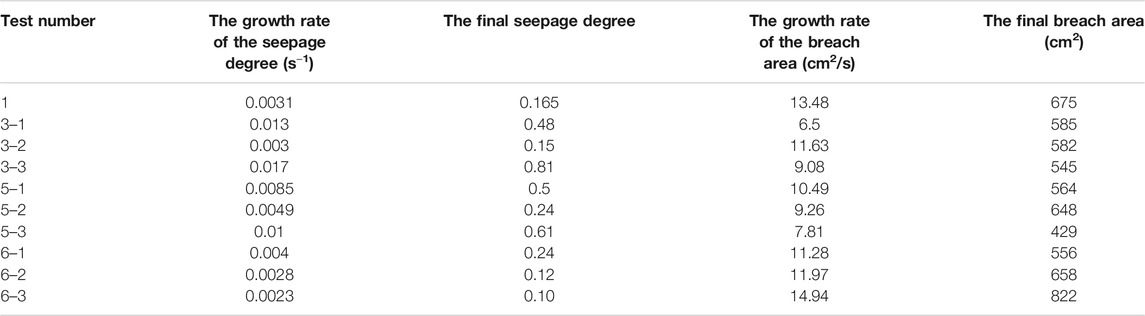
TABLE 3. The parameters of the seepage and the dam breach.
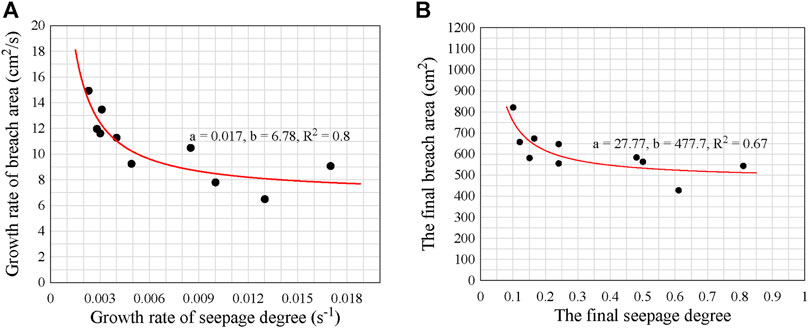
FIGURE 10. (A) The relationship between the growth rate of seepage degree and the growth rate of dam breach area; (B) The relationship between the seepage degree and the dam breach area. a and b are fitting parameters.
In the formula, y is the parameter represented by ordinate, x is the parameter represented by abscissa, a and b are fitting parameters, and the specific values are shown in Figure 10.
Analysis of the Breach Flow
Figure 11 shows the flow curves, Table 4 shows the flow characteristics of the dams. Although the landslide dams' structures are different, most of the flow curves increase to the peak first and gradually decrease. It can be seen that compared with the landslide dam with overtopping as the breaking form, for the landslide dam with dam slope instability as the breaking form, the duration of dam break is concise, and the peak flow is tremendous. As for the landslide dam with overtopping as the breaking form, most of their flow curves have only one peak point, but a few curves have two peak points, which is result from the irregular variation of the dam breach. For a uniform dam body, its dam breach flow usually peaks after its crest and downstream slope are scoured and reduced to a certain extent (Chang and Zhang, 2010), while for a non-uniform dam body, its flow during the dam break and the moment when the peak flow occurs need to be determined according to a specific test. For example, the landslide dam's peak flow with the upper-coarse-lower-fine structure appears relatively early, and the duration of the dam break is relatively long. The main reason is that the erosion resistance of the upper soil is weak, the potential energy of the overtopping water is large, and the scouring ability is strong, so the dam height is reduced quickly, and the peak flow occurs. After the upper soil with weak erosion resistance is washed away, the lower soil has strong erosion resistance and poor permeability coefficient, and the scouring ability of the water flow is weakened to a certain extent as the dam height is reduced, so the erosion rate of the dam body by the water flow becomes slower.
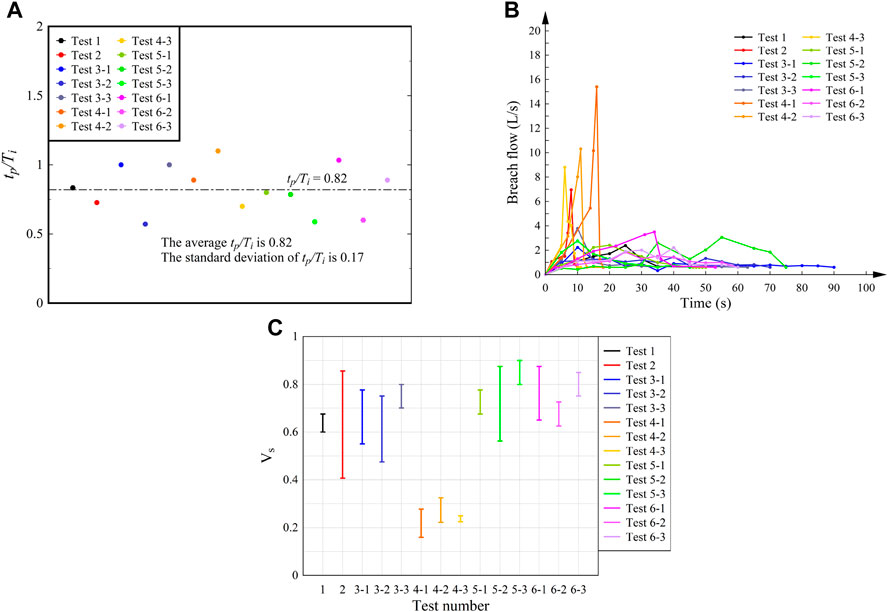
FIGURE 11. (A) Flow characteristics in different tests. tp is the moment when the peak flow occurs (s), and Ti is the duration of the severe break (s); (B) The flow curves of the dam breach; (C) Flow velocity of breach in different tests. Vs is the flow velocity (m/s).
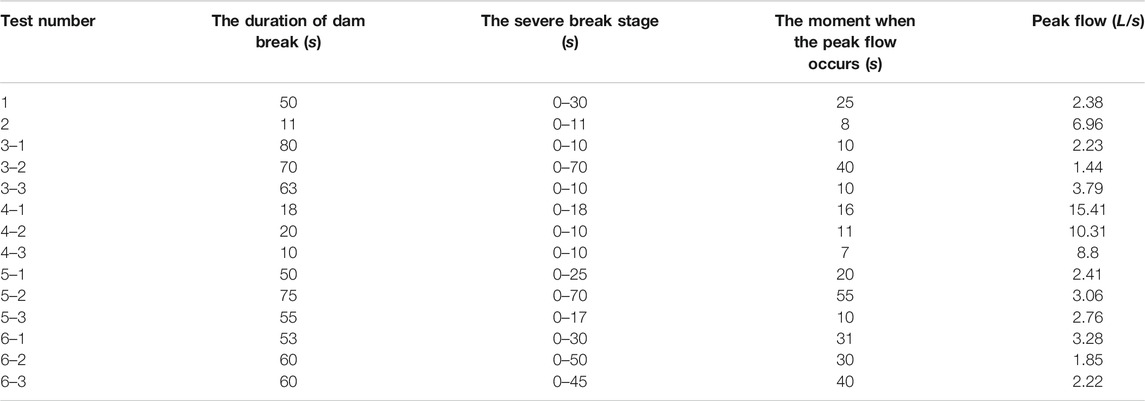
TABLE 4. The flow characteristics of the dams.
The severe break stage refers to the period of the relatively large growth rate of dam breach area within the duration of the landslide dam break. The comparison between the moment when the peak flow occurs and the severe break stage is shown in Figure 11. tp is the moment when the peak flow occurs, and Ti is the duration of the severe break. The average tp/Ti of the six groups of dams is about 0.82, and the standard deviation of tp/Ti of the six groups of dams is about 0.17. Thus, it can be seen that the moment when the peak flow occurs usually appears at the end of the severe break stage.
The erosion of water flow on the landslide dam has a significant impact on the failure process. For the experiment’s each test, we collected the flow velocity (Vs) data at two different moments when the breach is eroded by the water flow, as shown in Figure 11. Because the real-time water depth data could not be obtained, we decided to use the average water depth value during the breaking process to calculate the range of Floude number. The calculated Froude number ranges from 0.26 to 8.27. The Floude number of landslide dam is almost greater than one when the breach is eroding by overflowing water. According to the Froude similarity criterion, the prototype and the experiment will be similar under gravity when the Froude number of the prototype is close to that of the experiment.
Discussion
Fourteen settings of structures of landslide dam were performed to investigate the influence of the development of seepage on the breaking process of the landslide dam. Through analysis, an empirical formula to evaluate the breaking form of the landslide dam on the spot was presented, the relationship between the growth rate of the dam breach area and the growth rate of the saturation degree, and the final dam breach area and the final saturation degree were proposed, as well as the mechanism of the moment when the peak flow occurs was found. Combined with early identification of high-risk areas of landslide dam and life prediction of landslide dam (Chen et al., 2019a; Chen et al., 2019b; Nian et al., 2020), the pre-burst disaster assessment of the short-lived landslide dams could be more effective.
The dimensionless blockage index (DBI) is a practical method to evaluate landslide dams’ stability (Ermini and Casagli, 2003). After calculation, the DBI values of 14 groups of tests are 0.97, which means the landslide dams in our experiment are stable dams. However, they all broke in 2 min, and their stability is quite different (life span, flow rate, etc.), which is due to the great influence of the internal structure and particle size of the dam on the breaking mechanism. Therefore, it is necessary to pay more attention to the internal structure of the landslide dams.
The relationship between the growth rate of the dam breach area and the growth rate of the seepage degree and the final dam breach area and the final seepage degree may not be applicable to all situations, and the development of landslide dam failure is also affected by many factors. But judging from this experiment’s results, this relationship between them is established when only the dam structure is changed.
In this experiment, the Froude number ranges from 0.26 to 8.27. According to the Froude similarity criterion, the prototype and the experiment will be similar under gravity when the Froude number of the prototype is close to that of the experiment. Therefore, this paper’s conclusions will be further applied. Scale effect is a major problem in this field's research, especially for model experiments. In the past, when researchers studied similar problems, they often considered macroscopic factors such as similar particle size, similar dam shape, or similar gravity (Gregoretti et al., 2010; Zhao et al., 2016; Jiang and Cui, et al., 2016; Zhou et al., 2019; Liu B. X et al., 2020). However, it is difficult to make model tests similar in experimental phenomena to meet these conditions. To make the experimental phenomena closer to reality, the similarity of coupled water and soil motion is also necessary (Nian et al., 2020). Due to the limitations, researchers can only make the experimental models meet similarity criteria as much as possible. Experiments that can make the model more similar to the prototype will be our research direction in the future.
Conclusion
(1) This paper, based on the model tests of 14 groups of landslide dams of different structures, the breaking forms of landslide dams in the experiment are mainly divided into two categories, namely, overtopping (Test 1, Test 3–1, Test 3–2, Test 3–3, Test 5–1, Test 5–2, Test 5–3, Test 6–1, Test 6–2, Test 6–3) and dam slope instability (Test 2, Test 4–1, Test 4–2, and Test 4–3). This paper discussed the influence of seepage on the breaking form of landslide dam and found that as for the landslide dams with different structures, the saturation lines show different shapes during seepage failure.
(2) The physical quantity of seepage degree is introduced to quantify the development degree of the seepage channel inside the dam body, and based on analysis it is found that the higher the seepage degree is, the higher the probability of the occurrence of dam slope instability to the landslide dam will be, and that the lower the seepage degree is, the greater the probability of the occurrence of overtopping to the landslide dam will be. According to this phenomenon, this paper derives the empirical formula on seepage length L0 to evaluate the breaking form of the landslide dam on the prototype and mitigate disasters, risks, and the consequences thereof.
(3) The dam breach area of the landslide dam damaged by dam slope instability is much larger than that of the landslide dam damaged by overtopping. By further analyzing in the tests of this paper in which the breaking form is overtopping, we found that the growth rate of the dam breach area during overtopping and dam break is inversely proportional to the growth rate of the seepage degree before the dam break and that the final dam breach area is also inversely proportional to the final seepage degree before the dam break.
(4) In the process of flow change during the dam break, the moment when the peak flow occurs usually appears at the end of the severe break stage, and the average ratio of the moment when the peak flow occurs to the duration of severe break of the fourteen groups of landslide dams is about 0.82.
Data Availability Statement
The raw data supporting the conclusions of this article will be made available by the authors, without undue reservation.
Author Contributions
ZN, KC, and BD contributed to the conception of the study; CM, KC and YY performed the experiment; ZN and KC contributed significantly to analysis and manuscript preparation; MC, KC and NZ performed the data analyses and wrote the manuscript, and made all figures; ZN, BD, KT, YY and CM helped perform the analysis with constructive discussions.
Funding
This research was supported by the National Key Research and Development Plan of China (Grant No. 2019YFC1510704; Grant No. 2018YFC1505004), the National Natural Science Foundation of China (Grant No. U19A2049), Science and Technology Department of Sichuan Province (Grant No.2020YJ0321), and the Fundamental Research Funds for the Central Universities (Grant No.YJ201832).
Conflict of Interest
The authors declare that the research was conducted in the absence of any commercial or financial relationships that could be construed as a potential conflict of interest.
References
Cai, H., Liu, H., and Zhang, Z., (2001). Preliminarily stability analysis of natural rock field dam resulting from damming landslide. Geol. Sci. Technology Inf. 20 (1), 77–80. doi:10.3969/j.issn.1000-7849.2001.01.017
Cai, Y., Luan, Y., Yang, Q., Xu, F., Zhang, S., Shi, Y., et al. (2019). Study on structural morphology and dam-break characteristics of Baige barrier dam on Jinsha River. Yangtze River 50 (03), 15–22. doi:10.16232/j.cnki.1001-4179.2019.03.004
Casagli, N., Ermini, L., and Rosati, G. (2003). Determining grain size distribution of the material composing landslide dams in the Northern Apennines: sampling and processing methods. Eng. Geol. 69, 83–97. doi:10.1016/S0013-7952(02)00249-1
Chang, D. S., and Zhang, L. M. (2010). Simulation of the erosion process of landslide dams due to overtopping considering variations in soil erodibility along depth. Nat. Hazards Earth Syst. Sci. 10, 933–946. doi:10.5194/nhess-10-933-2010
Chen, K.-T., Chen, X.-Q., Hu, G.-S., Kuo, Y.-S., Huang, Y.-R., and Shieh, C.-L. (2019a). Dimensionless assessment method of landslide dam formation caused by tributary debris flow events. Geofluids. 2019, 1–14. doi:10.1155/2019/7083058
Chen, K.-T., Chen, X.-Q., Niu, Z.-P., and Guo, X.-J. (2019b). Early identification of river blocking induced by tributary debris flow based on dimensionless volume index. Landslides 16, 2335–2352. doi:10.1007/s10346-019-01221-8
Chen, K.-T., Kuo, Y.-S., and Shieh, C.-L. (2014). Rapid geometry analysis for earthquake-induced and rainfall-induced landslide dams in Taiwan. J. Mt. Sci. 11, 360–370. doi:10.1007/s11629-013-2664-y
Chen, X., Zhuang, J., Cui, P., Zhu, Y. -Y., and Han, Y. S. (2009). Emergency risk assessment of dammed lakes caused by the Wenchuan earthquake on May 12,2008. Geosci. Front. 015 (4), 244–249. doi:10.1007/s10346-009-0160-9
Costa, J. E., and Schuster, R. L. (1988). The formation and failure of natural dams. Geol. Soc. Am. Bull. 100, 1054–1068. doi:10.1130/0016-7606(1988)100<1054:tfafon>2.3.co;2
Cui, P. (2009). Distribution and risk analysis of dammed lakes reduced by Wenchuan earthquake. J. Sichuan University(Engineering Sci. Edition) 41 (3), 35–42. doi:10.1142/9789812833471_0001
Cui, Y.-F., Zhou, X.-J., and Guo, C.-X. (2017). Experimental study on the moving characteristics of fine grains in wide grading unconsolidated soil under heavy rainfall. J. Mt. Sci. 14, 417–431. doi:10.1007/s11629-016-4303-x
Deng, J., Gao, Y., Yu, Z., and Xie, H. (2019). Analysis on the formation mechanism and process of baige landslides damming the upper reach of jinsha river,China. J. Sichuan University(Engineering Sci. Edition) 051, 9–16. doi:10.15961/j.jsuese.201801438
Ding-Zhu, L., (2017). Experimental study on breach broadening process of landslide dam. Sci. Soil Water Conservation 15 (06), 19–26. doi:10.16843/j.sswc.2017.06.003
Ermini, L., and Casagli, N. (2003). Prediction of the behaviour of landslide dams using a geomorphological dimensionless index. Earth Surf. Process. Landforms 28, 31–47. doi:10.1002/esp.424
Gregoretti, C., Maltauro, A., and Lanzoni, S. (2010). Laboratory experiments on the failure of coarse homogeneous sediment natural dams on a sloping bed. J. Hydraul. Eng. 136, 868–879. doi:10.1061/(asce)hy.1943-7900.0000259
Jiang, X., and Cui, P., (2016). Experiments investigation on longitudinal breaching of natural dam. J. Sichuan University(Engineering Sci. Edition) (4), 38–44. doi:10.15961/j.jsuese.2016.04.006
Li, S., Li, X., Zhang, J., He, J., Li, S., and Wang, Y. (2010). Study of geological origin mechanism of tangjiashan landslide and entire stability of landslide dam. Chin. J. Rock Mech. Eng. 29 (S1), 2908–2915. http://CNKI:SUN:YSLX.0.2010-S1-049
Liu, B. X., (2020). Experiments research on breach broadening process of landslide dam under different channel bed slope. J. Eng. Geology. 1-11, 25–11. doi:10.13544/j.cnki.jeg.2019-514
Liu, D., Cui, Y., Guo, J., Yu, Z., Chan, D., and Lei, M. (2020). Investigating the effects of clay/sand content on depositional mechanisms of submarine debris flows through physical and numerical modeling. Landslides 17, 1863–1880. doi:10.1007/s10346-020-01387-6
Liu, N. (2014). Hongshiyan landslide dam danger disposal and coordinated management. Strateg. Study CAE 16 (10), 39–46. doi:10.3969/j.issn.1009-1742.2014.10.006
Ming, P., Kaifang, W., Gongding, Z., Chenyi, M., and Yan, Z. (2020). Review of model experimental studies on break of landslide dams. J. Eng. Geology. 28 (05), 1007–1015. doi:10.13544/j.cnki.jeg.2020-348
Morris, M. W., Hassan, M. A. A. M., and Vaskinn, K. A. (2007). Breach formation: field test and laboratory experiments. J. Hydraulic Res. 45, 9–17. doi:10.1080/00221686.2007.9521828
Nian, T. K., Wu, H., Li, D. Y., Zhao, W., Takara, K., and Zheng, D. F. (2020). Experimental investigation on the formation process of landslide dams and a criterion of river blockage. Landslides 17, 2547–2562. doi:10.1007/s10346-020-01494-4
Niu, Z. P., Wei-Lin, X. U., Nai-Wen, L. I., Xue, Y., and Chen, H. Y. (2012). Experimental investigation of the failure of cascade landslide dam. J. Hydrodynamics Ser B 24 (3), 430–441. doi:10.1016/S1001-6058(11)60264-3
Wang, Z. G., and Du, K. (2015). Analysis and research of the hongshiyan landslide dam and its foundation engineering geological features. Yunnan Water Power 31 (05), 70–72+92. doi:10.3969/j.issn.1006-3951.2015.05.021
Wrachien, D. D., and Mambretti, S. (2009). Dam-break problems solutions and case studies. Southampton, UK: WIT Press.
Xu, Q., Zheng, G., Li, W., He, C., Dong, X., Guo, C., et al. (2018). Study on successive landslide damming events of jinsha river in baige village on octorber 11 and november 3, 2018. J. Eng. Geology. 26 (06), 1534–1551. doi:10.13544/j.cnki.jeg.2018-406
Zhao, T. L., Chen, S.-S., Wang, J.-J., Zhong, Q., and Fu, C.-J. (2016). Centrifugal model tests overtopping failure of barrier dams. Chin. J. Geotechnical Eng. 38 (11), 1965–1972. doi:10.11779/CJGE201611005
Zhenming, S., Hongchao, Z., Ming, P., and Limin, Z., (2016). Breaching mechanism analysis of landslide dams considering different spillway schemes—a case study of tangjiashan landslide dam. J. Eng. Geology. 24 (05), 741–751. doi:10.13544/j.cnki.jeg.2016.05.003
Zhong, Q., Chen, S., Wang, L., and Shan, Y. (2020). Back analysis of breaching process of Baige landslide dam. Landslides 17, 1681–1692. doi:10.5772/intechopen.92893
Keywords: landslide dam, overtopping, dam slope instability, dam breach area, peak flow
Citation: Meng C-K, Chen K-T, Niu Z-P, Di B-F and Ye Y-J (2021) Influence of Internal Structure on Breaking Process of Short-Lived Landslide Dams. Front. Earth Sci. 9:604635. doi: 10.3389/feart.2021.604635
Received: 10 September 2020; Accepted: 12 February 2021;
Published: 15 April 2021.
Edited by:
Jie Dou, Nagaoka University of Technology, JapanCopyright © 2021 Meng, Chen, Niu, Di and Ye. This is an open-access article distributed under the terms of the Creative Commons Attribution License (CC BY). The use, distribution or reproduction in other forums is permitted, provided the original author(s) and the copyright owner(s) are credited and that the original publication in this journal is cited, in accordance with accepted academic practice. No use, distribution or reproduction is permitted which does not comply with these terms.
*Correspondence: Zhi-Pan Niu, niuzhipan@sina.com
†These authors have contributed equally to this work