Impact of Intraseasonal Oscillations on the Activity of Tropical Cyclones in Summer Over the South China Sea: Nonlocal Tropical Cyclones
 Zheng Ling
 Yuqing Wang
 Guihua Wang
 Hailun He
- 1College of Ocean and Meteorology, Guangdong Ocean University, Zhanjiang, China
- 2State Key Laboratory of Satellite Ocean Environment Dynamics, Second Institute of Oceanography, Ministry of Natural Resources, Hangzhou, China
- 3Department of Atmospheric Sciences and International Pacific Research Center, School of Ocean and Earth Science and Technology, University of Hawaii at Manoa, Honolulu, HI, United States
- 4Department of Atmospheric and Oceanic Sciences, Institute of Atmospheric Sciences, Fudan University, Shanghai, China
In addition to tropical cyclones (TCs) locally formed in the South China Sea (SCS), there are also TCs that initially form over the Northwest Pacific (NWP) and move westward to enter the SCS (often called nonlocal TCs). It is unclear how those nonlocal TCs are modulated by the intraseasonal climate variability. In this study, the impacts of two types of intraseasonal oscillations, namely the Madden–Julian Oscillation (MJO) and the quasi-biweekly oscillation (QBWO), on nonlocally formed TCs over the SCS in summer (May–September) are analyzed based on best-track TC data and global reanalysis during 1979–2018. Results show that in the convective phases of both MJO and QBWO, the western Pacific subtropical high shifted more eastward, and more TCs entered the SCS. This is mainly because more TCs formed in the NWP in the convective phases of intraseasonal oscillations and the genesis locations of the NWP TCs shifted westward and closer to the SCS. In addition to TC count, intraseasonal oscillations also affected the intensity of nonlocal TCs entered the SCS, with the influence of QBWO being more significant than MJO. In the convectively active phases of QBWO (phases 2–5), 34 nonlocal TCs reached typhoon intensity, while only two nonlocal TCs reached typhoon intensity in the convectively inactive phases (phases 1, 6, 7, 8). Further analysis indicates that nonlocal TCs often moved with the northwestward propagating convective signals of QBWO, resulting in more and stronger TCs that entered the SCS in the convective phases of QBWO. The mean location that the nonlocal TC entered the SCS also shifted northward with the northward propagation of intraseasonal oscillations.
Introduction
The South China Sea (SCS) is affected by two types of tropical cyclones (TCs) based on their genesis locations, namely, TCs locally formed over the SCS (local TCs) and TCs formed over the Northwest Pacific (NWP) and moved westward to enter the SCS (nonlocal TCs). The impacts of intraseasonal oscillations, namely the Madden–Julian oscillation (MJO, Madden and Julian, 1971, Madden and Julian, 1972) and the quasi-biweekly oscillation (QBWO, Jia and Yang, 2013), on local TCs in summer over the SCS were investigated by Ling et al. (2016). The results show that more (less) TCs formed in the convectively active (inactive) phases of intraseasonal oscillations, and the genesis locations shifted northward with the northward propagation of the convective signals of intraseasonal oscillations. Both MJO and QBWO also played an important role in modulating the tracks of the eastward moving TCs. Compared with local TCs, nonlocal TCs are more frequent and often stronger and vary out-of-phase with local TCs in summer over the SCS (Ling et al., 2015). Both local and nonlocal TCs can affect the ocean stratification, circulation, and primary production in the SCS (Chu et al., 2000; Lin et al., 2003; Wang et al., 2009; Ling et al., 2011; Wang et al., 2014) while the activity of nonlocal TCs has not been extensively investigated, in particular their modulations by intraseasonal variability.
The impacts of MJO on NWP TCs have been extensively studied. The results show that the TC genesis is enhanced (suppressed) in the convective (non-convective) phases of MJO (Liebmann et al., 1994; Kim et al., 2008; Li and Zhou 2013a; Zhao et al., 2015a; Zhao et al., 2015b). In addition to the genesis frequency, MJO can also modulate the genesis location of TCs over the NWP (Kim et al., 2008; Li and Zhou 2013a). Li et al. (2012) found that the modulation of MJO on TCs over the NWP is enhanced during El Nino events. Li and Zhou (2013a, b) studied the impact of both MJO and QBWO on NWP TCs. Their results show that TC genesis is enhanced (suppressed) in the convective (non-convective) phases of QBWO, the TC genesis location shifts northwestward with the northwestward propagation of the convective signals of QBWO, and the impact of QBWO on NWP TCs is often modulated by MJO. They also showed that both MJO and QBWO can modulate the motion of NWP TCs and significantly affect TC landfall locations. Zhao et al. (2015a) also investigated the influence of the MJO and QBWO on the genesis of NWP TCs and found that the low-level absolute vorticity and the mid-level relative humidity are two key factors by which intraseasonal oscillations modulate tropical cyclone genesis. Shi et al. (2019) found that the QBWO can modulate the supper typhoon tracks over the NWP by changing the steering flow. In the decline (mature) stage of QBWO, an anticyclonic circulation covers the entire WNP and SCS (mid-eastern NWP), which is favorable for typhoons move westward (eastward).
Nonlocal TCs formed in the NWP, moved westward and entered the SCS. Most previous studies considered NWP TCs as a whole, including those over the SCS. It is unclear how the nonlocal TCs are affected by the intraseasonal climate variability. In this study, we focus on the impacts of MJO and QBWO on nonlocal TCs in summer over the SCS. We will show that both MJO and QBWO can significantly affect the genesis frequency and location, intensity and motion of nonlocal TCs over the SCS. The rest of the paper is organized as follows. “Data and Methodology” section briefly introduces the data and method used in this study. The impacts of MJO and QBWO on the activity of nonlocal TCs over the SCS are discussed in “Results” section. The major results are summarized in the last section.
Data and Methodology
The best track TC data during 1979–2018 were obtained from the Japan Meteorological Agency, which includes six hourly TC location (longitude and latitude of each TC center), minimum central sea level pressure, and 10-min mean maximum surface wind speed (available for TCs with maximum surface wind speed equal to or greater than 35 knots). The European Centre for Medium-range Weather Forecasting Interim reanalysis data (ERA-Interim, Dee et al., 2011), including geopotential height at 500 hPa and winds from 300 to 850 hPa during the period 1979–2018 were used to calculate the steering flow and intraseasonal variability. The steering flow used in this study is defined as the mass-weighted mean flow between 300 and 850 hPa (Holland 1983). The ERA-Interim has a spatial resolution of 0.75° longitude × 0.75° latitude on 37 pressure levels in the vertical. The interpolated outgoing longwave radiation (OLR) dataset for the period 1979–2018 was obtained from the NOAA/OAR/ESRL/PSD, Boulder, Colorado, USA (Liebmann and Smith 1996), whose temporal and spatial resolutions are daily and 2.5° latitude × 2.5° longitude, respectively.
As done in previous studies (Kim et al., 2008; Huang et al., 2011; Jia and Yang 2013; Li and Zhou, 2013a; Li and Zhou, 2013b, Ling et al., 2016), the empirical orthogonal function (EOF) analysis was employed to get the dominant modes of MJO and QBWO in the domain of (0–30°N, 100–170°E) using the 30–60 and 10–20 days filtered OLR. Based on their respective first two principal components, the MJO and the QBWO modes are then divided into 8 phases as done in Jia and Yang (2013). In this study, the domain of SCS is referred to as 98°–121°E and 0–23°N, and the phase to which a nonlocal TC belongs is determined based on the day the TC passed 121°E and entered the SCS since this study focused on TC activity in the SCS.
Results
Frequency of Nonlocal Tropical Cyclones in Different Madden-Julian Oscillation and Quasi-Biweekly Oscillation Phases
As listed in Table 1, among 591 NWP TCs (the local TCs formed over the SCS were excluded), 145 (nonlocal TCs) entered the SCS in summer during 1979–2018. Among those nonlocal TCs, 97 entered the SCS in phases 1, 6, 7, and 8 of MJO, while only 48 entered the SCS in the other four phases of MJO. In total, 110 entered the SCS in phases 2, 3, 4 and 5 of QBWO, while only 35 entered the SCS in the other four QBWO phases. Note that the phase of the nonlocal TCs is based on the day that the nonlocal TCs entered the SCS as mentioned above. As shown in Ling et al., 2016, most local TCs also formed in phases 1, 6, 7, and 8 of MJO and phases 2, 3, 4, and 5 of QBWO, indicating that both local and nonlocal TCs are active when the convective signals of MJO and QBWO are located over the SCS. The daily entering rate, defined as the daily nonlocal TC number in each phase (namely the number of nonlocal TCs divided by the days of each phase), shows a significantly enhanced activity of nonlocal TCs over the SCS in phases 7 and 8 of MJO and phases 3 and 4 of QBWO, while a significantly suppressed activity in phases 4 and 5 of MJO and phases 6, 7, and 8 of QBWO.
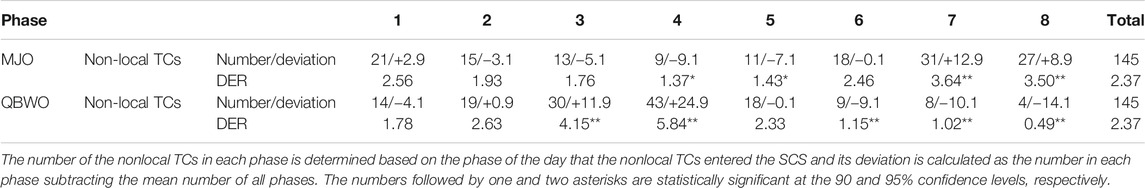
TABLE 1. The number and daily entering rate (DER) of nonlocal TCs in each phase of MJO and QBWO phase.
Previous studies have shown that the motion of NWP TCs is strongly controlled by the western Pacific subtropical high (Chan and Gray 1982; Holland 1983; Harr and Elsberry 1991; Ren et al., 2008; Wang and Wang 2013). Ling et al. (2015) found that when the western Pacific subtropical high shifts eastward (westward) in summer, fewer (more) NWP TCs entered the SCS because most TCs over the NWP recurved northward (moved westward). As we can see from Figures 1 and 2, the mass-weighted steering flow between 300 and 850 hPa is favorable (unfavorable) for NWP TCs to enter the SCS when the western Pacific subtropical high shifts westward (eastward) with its associated easterlies to the south extending westward (retreating eastward). Although the western Pacific subtropical high shifts more eastward in phases 1, two and eight of MJO and phases 3, 4, and 5 of QBWO, many nonlocal TCs entered the SCS in these phases (Table 1). This is mainly due to the fact that more TCs over the NWP formed in the previous or present phases when the convective signals of MJO and QBWO were located over the NWP (Li and Zhou 2013a; Zhao et al., 2015a, Zhao et al., 2015b). As shown in Table 2, among 591 NWP TCs, 380 and 318 NWP TCs formed in phases 1, 2, 7, and 8 of MJO and in phases 2, 3, 4, and 5 of QBWO, respectively.
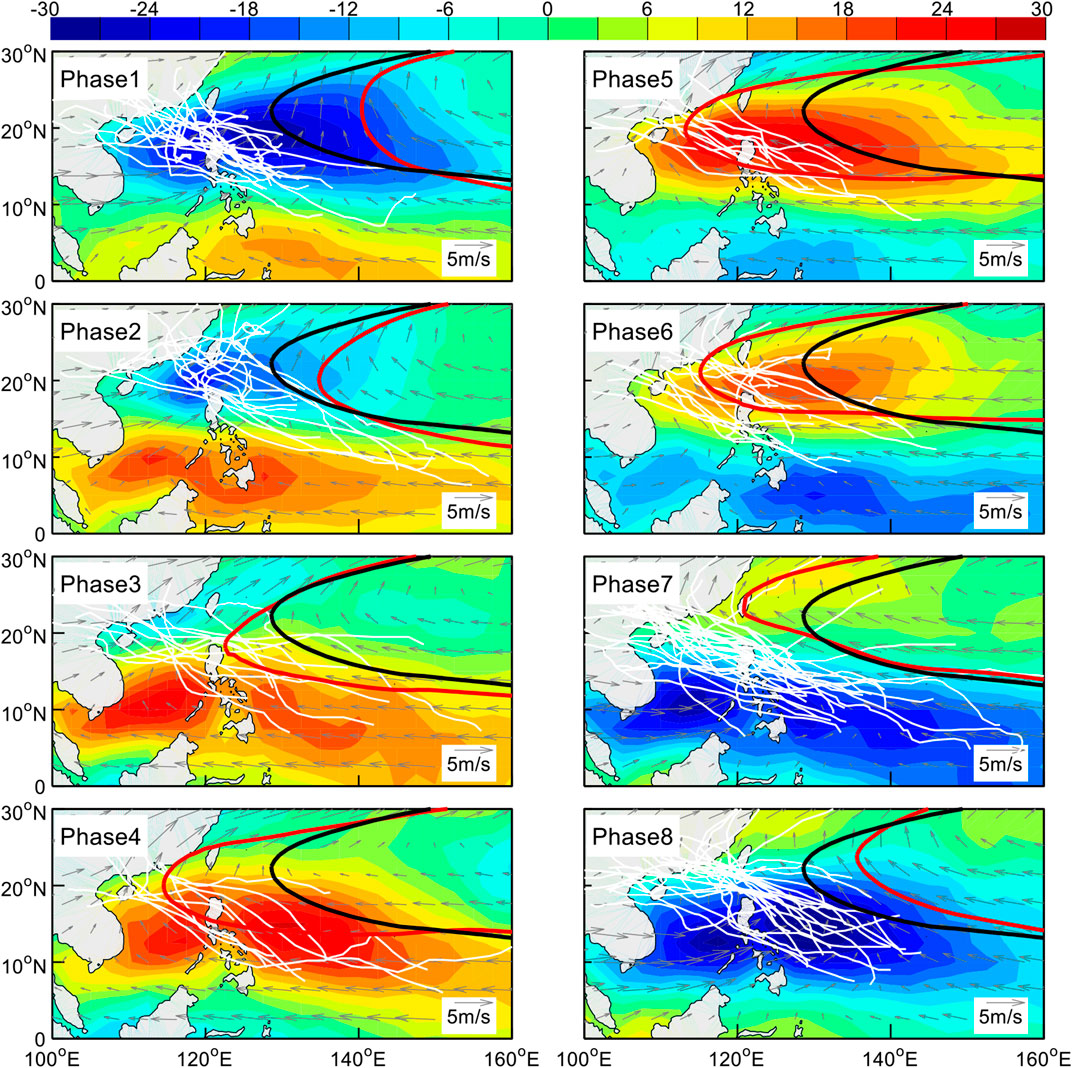
FIGURE 1. The composite OLR anomalies (color, W m−2), tracks of nonlocal TCs (white lines), the location of the western Pacific subtropical high and 300–850 hPa mass-weighted steering flow (vectors, m s−1) in each phase of MJO. Black curves denote the climatological 5,870 geopotential height at 500 hPa, the red curves denote the 5,870 geopotential height over 500 hPa in each phase of MJO. The phase of the TC is based on the day that the nonlocal TCs enter the SCS.
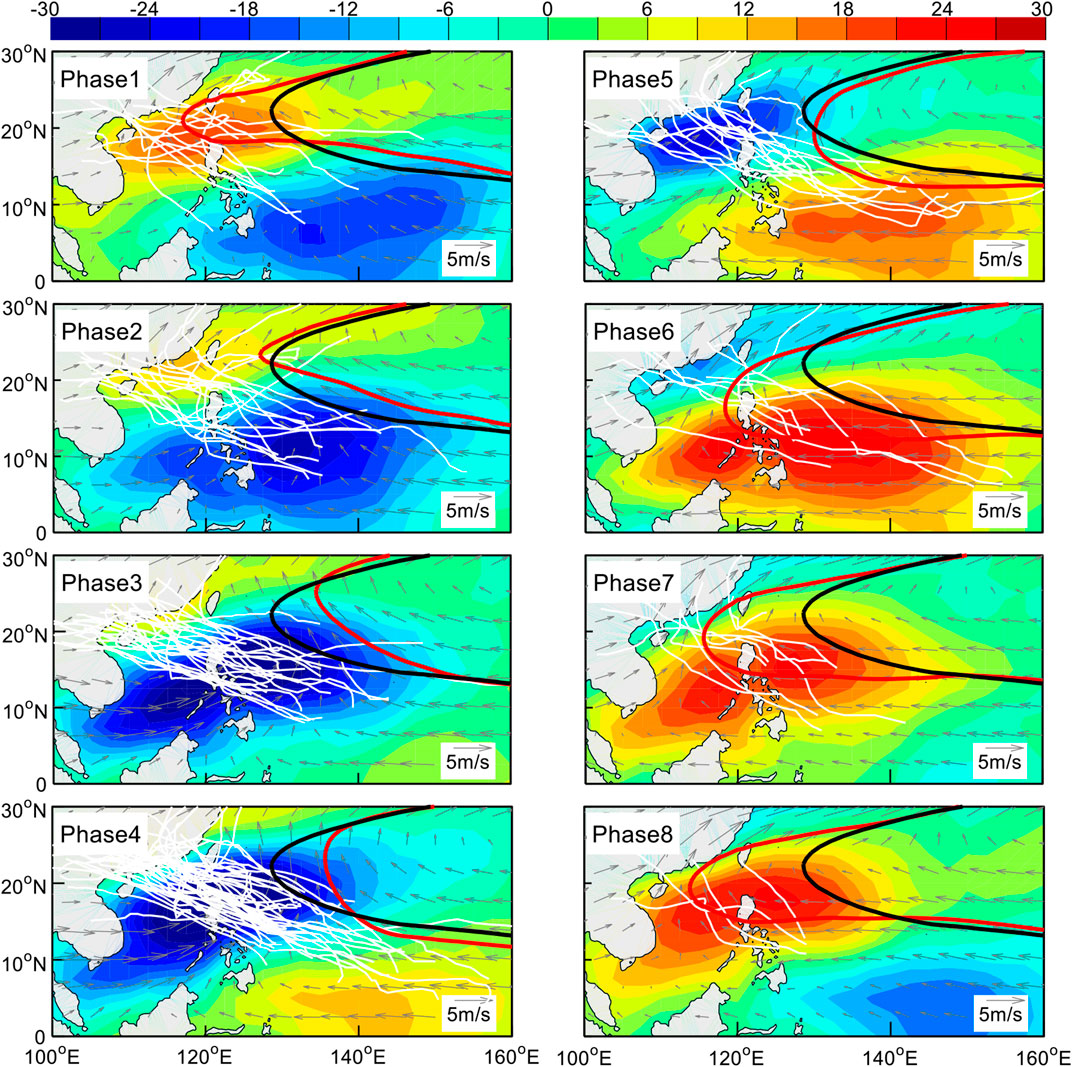
FIGURE 2. The same as in Figure 1 but for each phase of QBWO.
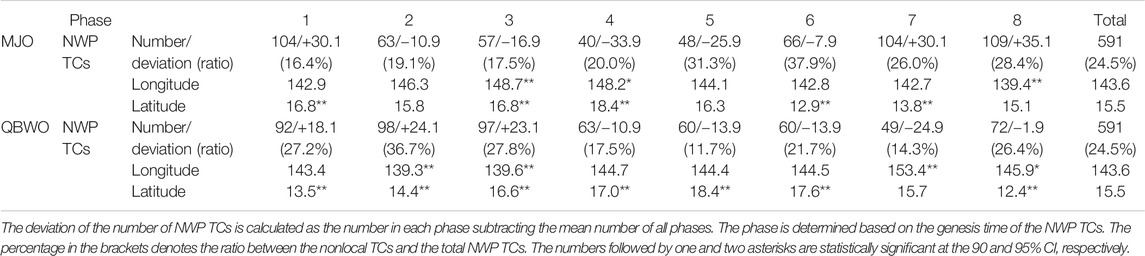
TABLE 2. The number and mean genesis location of NWP TCs (excluding local TCs that formed over the SCS) in each phase of MJO and QBWO.
Comparing the percentage of the nonlocal TCs among the total NWP TCs in Figure 3, we can see that the percentages are higher in phases 5, 6, 7, and 8 of MJO and phases 1, 2, 3, and 8 of QBWO. Among those phases, the western Pacific subtropical high shifted westward relative to the climatological mean position in phases 5, 6, and 7 of MJO and phases 1 and 8 of QBWO (Figures 1 and 2), which is favorable for NWP TCs to move westward and enter the SCS (Li and Zhou 2013b; Ling et al., 2015). However, high proportion of NWP TCs entered the SCS when the western Pacific subtropical high shifted eastward in phase 8 of MJO (28.4%) and phase 3 of QBWO (27.8%), and the percentage of the nonlocal TCs among the total NWP TCs is the highest (36.7%) in phase 2 of QBWO when the western Pacific subtropical high is nearly in its climatological position. This is mainly due to the westward shift in TC genesis locations over the NWP. The TC genesis locations in phase 8 of MJO and phases 2 and 3 of QBWO significantly shift westward (above 95% confidence level), with their mean longitudes being the most westward, 139.4°E in phase 8 of MJO and 139.3, 139.6°E in phases 2 and 3 of QBWO, respectively (Table 2). Since most NWP TCs move westward or northwestward after their formation, the genesis location close to the SCS implies more TCs to enter the SCS. As shown in Figure 4, the mean genesis longitude of nonlocal TCs is more westward than that of the total NWP TCs in each phase of intraseasonal oscillations, indicating that TCs formed over the NWP close to the SCS have higher potential to enter the SCS.
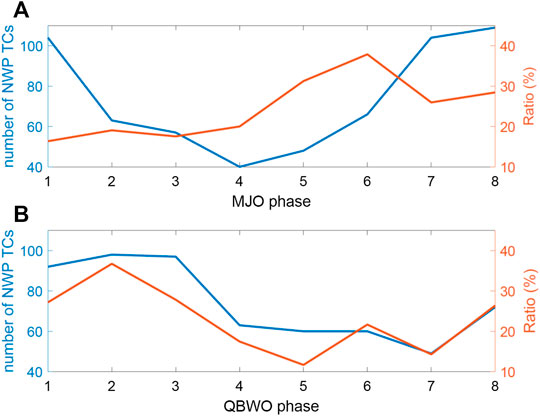
FIGURE 3. The number of total NWP TCs (blue) and the ratio (red) of the nonlocal TCs and the total NWP TCs in each phase of (A) MJO, and (B) QBWO.
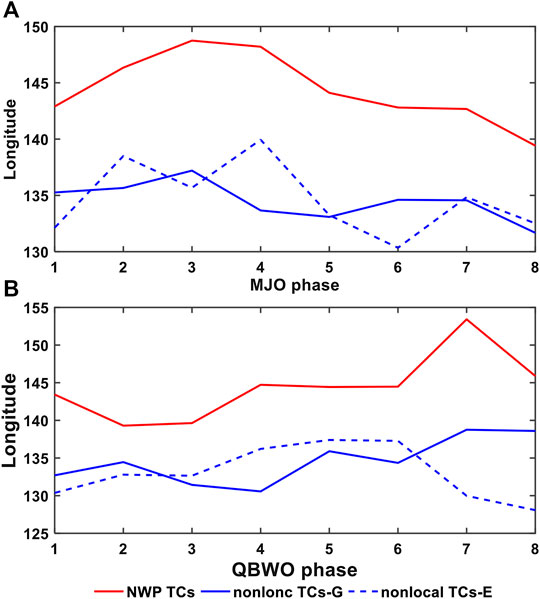
FIGURE 4. The mean genesis longitude for total NWP TCs (red line) and nonlocal TCs (blue lines) in each phase of MJO (A), and QBWO (B). The nonlocal TCs-G and nonlocal TCs-E denote the phases composited based on the genesis day and the day that the nonlocal TCs entered the SCS, respectively.
For nonlocal TCs in the phases composited based on the genesis day of nonlocal TCs (TCs-G), the variation of the genesis longitude of nonlocal TCs is consistent with that of total NWP TCs in different phases of intraseasonal oscillations. For MJO (Figure 4A), the genesis locations of the TCs shift eastward from phase 1 to phase 3, and then shift gradually westward from phase 3 to phase 8. Note that the genesis location of nonlocal TCs-G slightly shifts eastward in phases 6 and 7. For QBWO (Figure 4B), the genesis locations of the NWP TCs shift eastward from phase 2 to phase 7 and then shift westward from phase 7 to phase 2. The variation of the genesis location of nonlocal TCs-G is similar to that of the NWP TCs except that the genesis location of nonlocal TCs shifts westward from phase 2 to phase 4. For nonlocal TCs in the phases composited based on the day that the nonlocal TCs entered the SCS (nonlocal TCs-E), the genesis location exhibits different variation from that of the NWP TCs. Generally, the genesis location of nonlocal TCs-E shifts eastward and westward in inactive phases (phases 2, 3, 4 and 5) and active phases (phases 6, 7, eight and 1) of MJO, respectively. The genesis location of nonlocal TCs-E shifts eastward from phase 1 to phase 6 and then shift westward from phase 6 to phase 8 of QBWO. It is interesting to note that the location of the western Pacific subtropical high is most westward in phase 8 of QBWO and the genesis location of nonlocal TCs-E is also most westward, but only 4 TCs entered the SCS in phase 8 of QBWO and thus this may not be representative and no statistically meaningful.
To examine the combined effect of MJO and QBWO on the activity of nonlocal TCs over the SCS, we define phases 1 6, 7, and 8 of MJO and phases 2, 3, 4, and 5 of QBWO as active phases and the other phases as inactive phases based on the location of the ISO convective and non-convective centers and the number of the nonlocal TCs. Among 145 nonlocal TCs, 80 TCs entered the SCS in the active phases of both MJO and QBWO and 30 (17) TCs entered the SCS in the inactive (active) phases of MJO along with the active (inactive) phases of QBWO, while 18 TCs entered the SCS in the inactive phases of both MJO and QBWO, confirming that both MJO and QBWO have significant impacts on the activity of nonlocal TCs over the SCS (Figure 5). The number of nonlocal TCs in the active phases of MJO and the inactive phases of QBWO is nearly the same as that in the inactive phases of both MJO and QBWO, indicating that the activity of nonlocal TCs over the SCS is significantly suppressed in the inactive phases of QBWO.
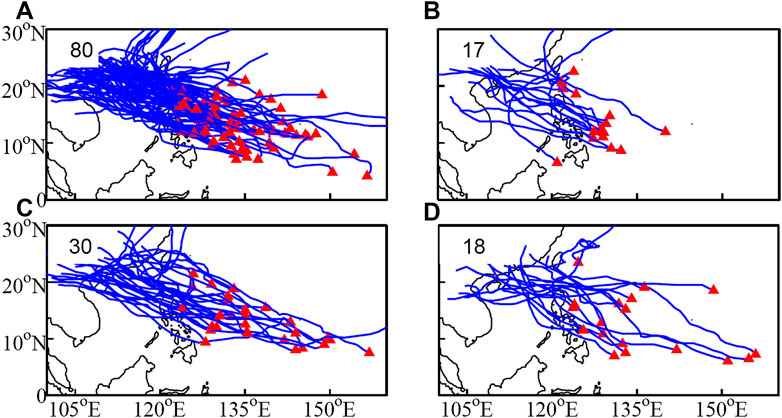
FIGURE 5. Tracks of nonlocal TCs in the combined phases of QBWO and MJO. Red triangles represent the genesis locations of non-local TCs. (A) is for the active phases of both MJO and QBWO, (B) is for the active phases of MJO along with the inactive phases of QBWO, (C) is for the inactive phases of MJO along with the active phases of QBWO, and (D) is for the inactive phases of both MJO and QBWO.
Entry Location and Intensity in Different Madden-Julian Oscillation and Quasi-Biweekly Oscillation Phases
Most nonlocal TCs made landfall in the Philippines before they entered the SCS. The entry location and intensity of nonlocal TCs are two interesting parameters. As we can see from Figure 6, the mean latitude where the nonlocal TC entered the SCS (note that 121°E is defined as the eastern boundary of the SCS) ranged from 16.7 to 20.8°N in different MJO phases and ranged from 16.3 to 19.4°N in different QBWO phases. The mean latitude where the nonlocal TCs entered the SCS shifted more southward (northward) in phases 3, 4, 5, 6, and 7 of MJO and phases 1, 2, 3, and 8 of QBWO (in phases 1, 2, and 8 of MJO and phases 4, 5, 6, and 7 of QBWO). Overall, the entry location significantly shifts northward in phases 2 and 8 of MJO and phase 4 of QBWO, and southward in phase 7 of MJO, all statistically significant above 95% confidence level. The entry location varies irregularly with the MJO phase, with more northward (southward) shift when the western Pacific subtropical high shifts eastward (westward) in phases 1, 2, and 8 (phases 3, 4, 5, 6, and 7) of MJO. The entry location varies quite regularly with the QBWO phase, with the entry location shifting northward from phase 2 to phase 4, then gradually shifting southward from phase 4 to phase 8. This variation is consistent with the movement of the western Pacific subtropical high, which shifts eastward (westward) from the phase 2 to phase 4 (from phase 4 to phase 8), along with the northward propagation of convective (non-convective) signals (Figure 2). In addition, the genesis locations of NWP TCs also shifted northward with the northward shift of convective signals of QBWO (Table 2), which may also contribute to the northward shift of the entry location in the active phases of QBWO.
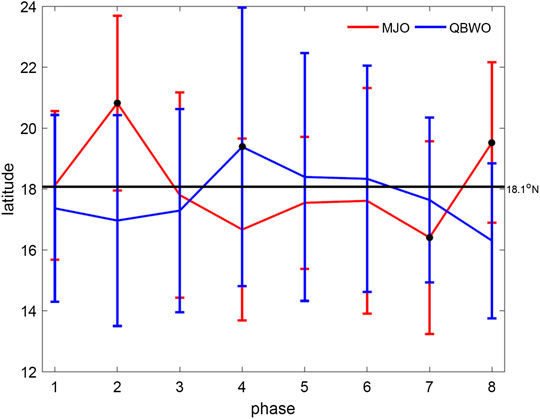
FIGURE 6. The mean latitude and its standard deviation of nonlocal TCs entering the SCS in each phase of MJO (blue) and QBWO (red). The black line indicates the mean entry location. The black dots indicate the values exceeding 95% confidence level basing on the Student’s t test.
The best-track dataset from Japan Meteorological Agency only provides the maximum wind speed equal to or greater than 35 knots, so we used the minimum sea level pressure to represent the intensity of a TC. Figure 7 shows the mean minimum sea level pressure of nonlocal TCs when they entered the SCS in each phase of MJO and QBWO, respectively. Overall, nonlocal TCs were stronger (weaker) in the active (inactive) phases of MJO and QBWO when they entered the SCS. This can be attributed to the fact that in the active (inactive) phases, the area east of the Luzon Island was dominated by large negative (positive) OLR and cyclonic (anticyclonic) circulation (Figures 1 and 2), which were favorable (unfavorable) for the development/intensification of nonlocal TCs prior to they crossed the Luzon Island. The entry intensity of nonlocal TCs is significantly enhanced in phases 4 of QBWO, while it is significantly suppressed in phases 7 and 8 of QBWO and phase 4 of MJO. The nonlocal TCs were the strongest in phases 7 and 8 of MJO and phases 3 and 4 of QBWO. As shown in Table 1, the number of nonlocal TCs is also the largest in these phases, indicating that the nonlocal TCs were active and stronger in the active phases of MJO and QBWO. However, it should be noticed that the large variability in TC intensity exists in all phases except in phases 7 and 8 of QBWO.
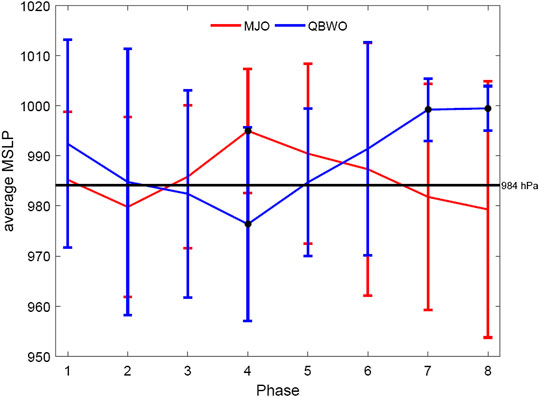
FIGURE 7. The average minimum sea level pressure (MSLP, hPa) and its standard deviation of the nonlocal TCs when they entered the SCS in each phase of MJO (red) and QBWO (blue). The black line indicates the mean entry intensity. The black dots denote the values exceeding 95% confidence level basing on the Student’s t test.
Figure 8 shows the number and ratio of nonlocal TCs for different entry intensities. For MJO (Figures 8A,C), the number of tropical depressions increased from phase 2 to phase 7, while the number of tropical storms decreased from phase 1 to phase 7. More (less) severe tropical storms and typhoons entered the SCS in the active (inactive) phases, especially the number of typhoons significantly increased in phases 7 and 8 MJO, respectively. The percentage of nonlocal TCs with typhoon intensity among the total nonlocal TCs in phases 7 and 8 of MJO are also high (38.7 and 28.6%, respectively). It should be noted that the ratio of TCs with typhoon intensity in phase 2 is the second highest (33.3%), but few nonlocal TCs (15) entered the SCS in phase 2 of MJO.
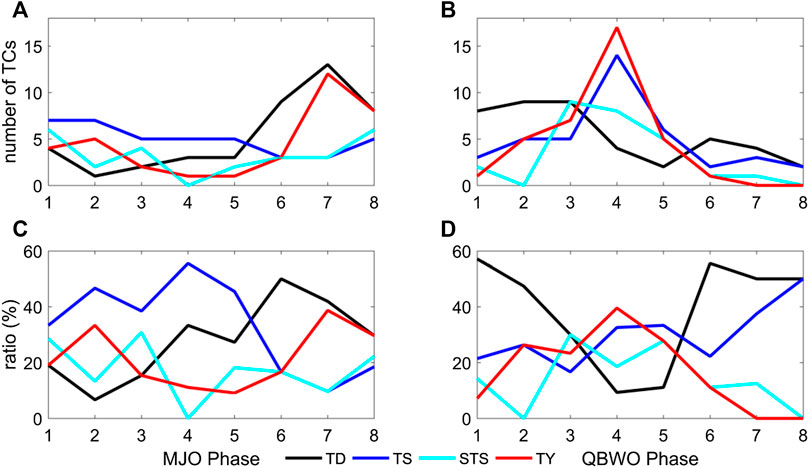
FIGURE 8. The number (A, B) and ratio (C, D) of nonlocal TCs of each intensity category in each phase of MJO (A, C) and QBWO (B, D).
For QBWO (Figures 8B,D), the number of nonlocal TCs peaks in phase 3 for tropical depressions and severe tropical storms, and in phase 4 for tropical storms and typhoons. The number of tropical depressions is larger in phases 1, 2, and 3, and then decreases from phase 3 to phase 5. The number of severe tropical storms decreases from phase 3 to phase 8. The number of tropical storms and typhoons increases from phase 1 to phase 4 and decreases from phase 4 to phase 8. Among all intensity categories, the intensity variation of typhoons is the largest. In the active phases (phases 2–5), 34 typhoons entered the SCS, while only two typhoons entered the SCS in the inactive phases. The ratio between the nonlocal TCs at different intensities and the total nonlocal TCs (Figure 8D) shows an out-of-phase relationship between tropical depressions and typhoons. Namely, the ratio of tropical depressions decreases (increases) from phase 1 to phase 4 (from phase 4 to phase 6), while that of typhoons increases (decreases) from phase 1 to phase 4 (from phase 4 to phase 8). It also shows that the QBWO can significantly affect the entry intensity of nonlocal TCs. The ratio of tropical storms shows an increasing trend from phase 1 to phase 8 with the two lowest values in phase 3 and phase 6, while the ratio of severe tropical storms is high in active phases except phase 2 and decreases from phase 5 to phase 8. For typhoons, the ratio increases from phase 1 to phase 4 and decreases from phase 4 to phase 8. It should be noted that the ratio of typhoons is the highest among all categories in phases 4 and about 40% nonlocal TCs can reach typhoon intensity when they entered the SCS.
To understand how the QBWO affects the entry intensity of nonlocal TCs over the SCS, we show in Figure 9 the composited 10–20 day band-pass filtered OLR and 850 hPa wind fields several days before the nonlocal TCs entered the SCS for both the active and inactive phases of QBWO. In the active phase (left panels in Figure 9), the composite OLR around the TC center was negative and the wind at 850 hPa was cyclonic. These signals moved westward with TCs and were favorable for TCs to intensify, resulting in stronger nonlocal TCs in the active phases. In the inactive phases (right panels in Figure 9), the composite OLR around the TC center was also negative but much weaker than that in the active phases. We noticed that this was probably related to TCs themselves since TCs can also significantly contribute to intraseasonal oscillations (Hsu et al., 2008). The area east of the Luzon Island was dominated by large positive OLR anomalies and anticyclonic circulation, which was unfavorable for TC intensification, resulting in relatively weaker nonlocal TCs in the inactive phases of QBWO. Overall, these results demonstrate that the impact of QBWO is more significant than that of MJO on both the number and entry intensity of nonlocal TCs over the SCS.
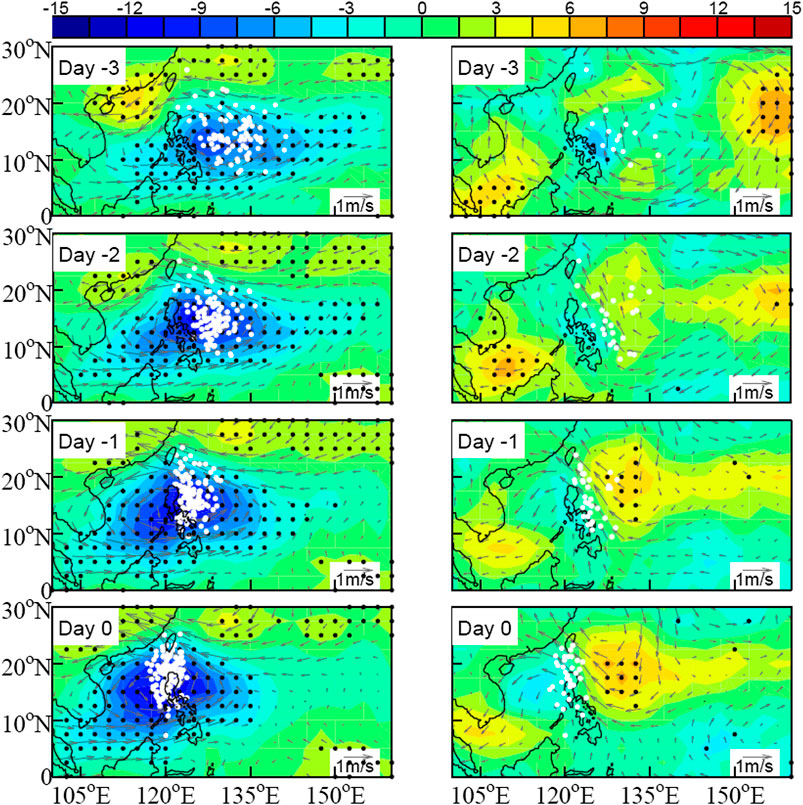
FIGURE 9. The composite 10–20 days filtered OLR anomalies (color, W m−2) and 850 hPa wind vectors (m s−1) for nonlocal TCs entering the SCS in the active (left panels) and inactive (right panels) phases of MJO. The number means the days before the date that the nonlocal TCs entered the SCS. The stippling indicates the statistical significance of OLR at the 95% CI.
Impact of Quasi-Biweekly Oscillation Convective Signals on Nonlocal Tropical Cyclone Motion
As discussed above, the QBWO can significantly affect both the number and the entry intensity and location of nonlocal TCs over the SCS. During the active phases of QBWO, the western Pacific subtropical high shifted eastward, with more nonlocal TCs affecting the SCS, which was inconsistent with previous results (Ling et al., 2015). In addition, more nonlocal TCs can reach typhoon category in the active phases of QBWO. Based on these results together with the fact that both nonlocal TCs and the convective signals of QBWO moved northwestward as a whole, we may hypothesize that TCs developed and embedded in the convective regions of QBWO could move following the convective signals of QBWO. To verify this hypothesis, we chose phase 4 as an example, in which most TCs entered the SCS and most TCs reached severe tropical storm and typhoon categories. We can see from Figure 10 that in general TCs moved with the convective signals of QBWO. The TC center was coincident with the center of the cyclonic circulation of QBWO except for day 0 when the coupled system was likely affected by the Philippine Island. When TCs were embedded in the convective signals, the strong easterly to the north of the circulation center prevented the TCs from moving northward. As a result, those TCs moved westward and entered the SCS although the western Pacific subtropical high shifted eastward. In addition, the cyclonic circulation and negative OLR were also favorable for TC intensification. This explains why about 40% nonlocal TCs in phase 4 of QBWO could reach typhoon category when they entered the SCS.
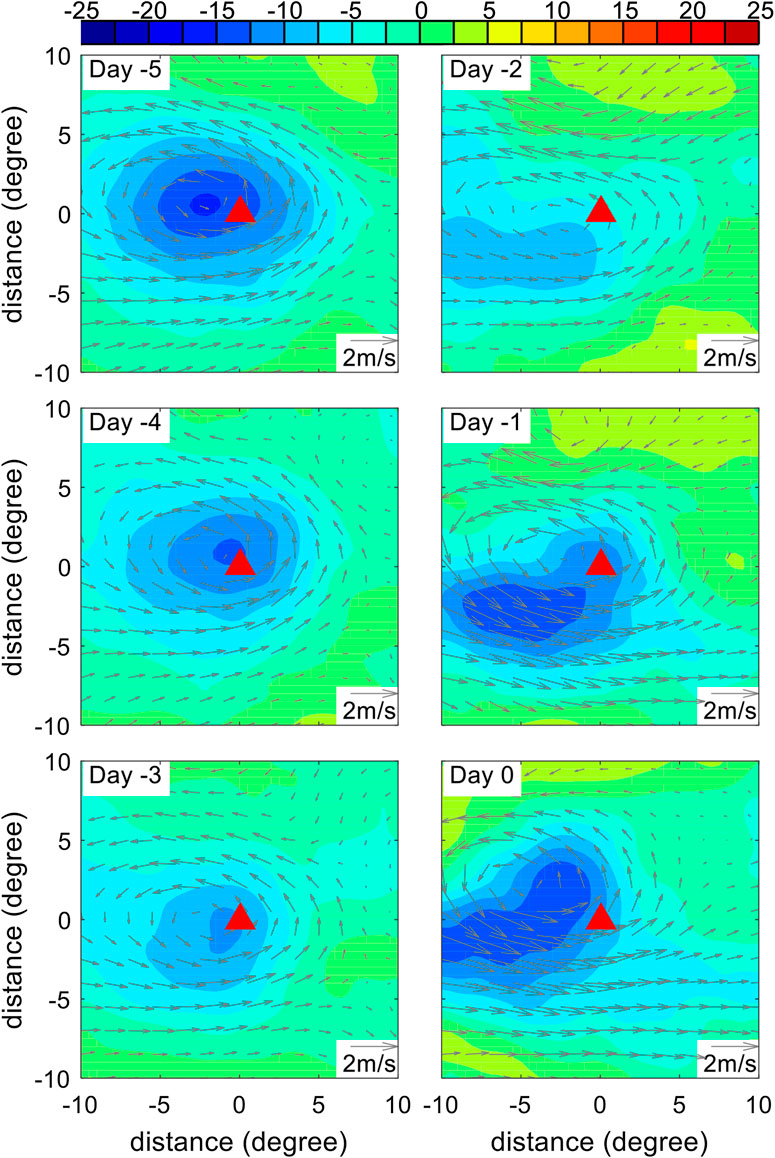
FIGURE 10. The composite 10–20 days filtered OLR anomalies (color, W m−2) and 300–850 hPa mass-weighted steering flow (vectors, m s−1) around the TC center for nonlocal TCs entering the SCS in phase 4 of QBWO. The number means the days before the date that the TCs entered the SCS. The red triangle represents the TC center.
Conclusion and Discussion
In this study, the impacts of intraseasonal oscillations, including both MJO and QBWO, on the frequency, motion and intensity of TCs that formed over the NWP and entered the SCS (nonlocal TCs over the SCS) in summer have been investigated. Results show that in general, in the active (inactive) phases of MJO and QBWO, more (less) and stronger (weaker) nonlocal TCs can affect the SCS. In the active (inactive) phases, more (less) TCs formed over the NWP with the mean genesis location closer to (far away from) the SCS, corresponding to more (less) NWP TCs to enter the SCS although the western Pacific subtropical high shifted eastward (westward). The area east of the Luzon Island was dominated by negative (positive) OLR anomalies and low-level cyclonic (anticyclonic) circulation in the active (inactive) phases, leading to stronger (weaker) TCs to enter the SCS. Compared with MJO, the effect of QBWO on the entry intensity of nonlocal TCs is more significant. An interesting result is that nonlocal TCs moved with the convective signals of QBWO, which thus imposed a more significantly effect on the intensity of nonlocal TCs. In addition to the number and entry intensity, intraseasonal oscillations also affected the entry location of nonlocal TCs over the SCS. Generally, the entry location shifted northward (southward) in active (inactive) phases of the two intraseasonal oscillations. With the northward propagation of the convective (non-convective) signals of QBWO, the entry location of nonlocal TCs shifted northward (southward), which is consistent with the eastward (westward) shift of the western Pacific subtropical high.
Since most nonlocal TCs made landfall over the Philippines before they entered the SCS, results from this study thus indicate that intraseasonal oscillations, especially the QBWO, can significantly affect the landfall location and intensity of nonlocal TCs over the Philippines. This may be helpful for forecasting landfall TCs over the Philippines and also the intensity of nonlocal TCs entering the SCS since most strong TCs making landfall in South China are nonlocal TCs with relatively large size after they cross the Philippines (Chou et al., 2011). Therefore, monitoring the activity of intraseasonal oscillations is of great importance to accurate prediction of TC activity over the SCS and their impact on Southeast Asia.
Data Availability Statement
The original contributions presented in the study are included in the article/Supplementary Material, further inquiries can be directed to the corresponding author.
Author Contributions
ZL performed the analysis and prepared the first drafted of the manuscript. YW and GW helped design the research and helped improve the manuscript. HH joined discussions on the interpretation of the results.
Acknowledgments
This study was supported by the China Ocean Mineral Resources Research and Development Association Program (DY135-E2-3-01), the National Key Research and Development Program of China (2019YFC1510100), Natural science team program of Guangdong (2016A030312004), National program on Global Change and Air-Sea interaction (GASI-02-SCS-YGST2-02), Project of Enhancing School with Innovation of Guangdong Ocean University (GDOU2016050240) and program for scientific research start-up funds of Guangdong Ocean University (R17073). The Japan Meteorological Agency best track TC dataset was downloaded from http://www.jma.go.jp/jma/jma-eng/jma-center/rsmc-hp-pub-eg/besttrack.html. The ERA-Interim data were downloaded from http://apps.ecmwf.int/datasets/. The OLR data were downloaded from http://www.esrl.noaa.gov/psd/.
Conflict of Interest
The authors declare that the research was conducted in the absence of any commercial or financial relationships that could be construed as a potential conflict of interest.
References
Chan, J. C. L., and Gray, W. M. (1982). Tropical cyclone movement and surrounding flow relationships. Mon. Weather Rev. 110, 1354–1374. doi:10.1175/1520-0493(1982)110<1354:TCMASF>2.0.CO;2
Chou, K. H., Wu, C. C., Wang, Y., and Chih, C. H. (2011). Eyewall evolution of typhoons crossing the Philippines and Taiwan: An observational study. Terr. Atmos. Ocean Sci. 22, 535–548. doi:10.3319/TAO.2011.05.10.01(TM)
Chu, P. C., Veneziano, J. M., Fan, C., Carron, M. J., and Liu, W. T. (2000). Response of the South China Sea to tropical cyclone Ernie 1996. J. Geophys. Res., 105, 13991–14009. doi:10.1029/2000JC900035
Dee, D. P., Uppala, S. M., Simmons, A. J., Berrisford, P., Poli, P., Kobayashi, S., et al. (2011). The ERA-Interim reanalysis: configuration and performance of the data assimilation systems. Quart. J. Roy. Meteor. Soc. 137, 553–597. doi:10.1002/qj.828
Harr, P. A., and Elsberry, R. L. (1991). Tropical cyclone track characteristics as a function of large-scale circulation anomalies. Mon. Weather Rev. 119, 1448–1468. doi:10.1175/1520-0493(1991)119<1448:TCTCAA>2.0.CO;2
Holland, G. J. (1983). Tropical cyclone motion: Environmental interaction plus a beta effect. J. Appl. Meteorol. 15, 1252–1264. doi:10.1175/1520-0469(1983)040<0328:TCMEIP>2.0.CO;2
Hsu, H. H., Hung, C. H., Lo, A. K., Wu, C. C., and Hung, C. W. (2008). Influence of tropical cyclones on the estimation of climate variability in the tropical western North Pacific. J. Clim. 21, 2960–2975. doi:10.1175/2007JCLI1847.1
Huang, P., Chou, C., and Huang, R. (2011). Seasonal modulation of tropical intraseasonal oscillations on tropical cyclone geneses in the western North Pacific. J. Clim. 24, 6339–6352. doi:10.1175/2011JCLI4200.1
Jia, X., and Yang, S. (2013). Impact of the quasi‐biweekly oscillation over the western North Pacific on East Asian subtropical monsoon during early summer. J. Geophys. Res.-Atmos. 118, 4421–4434. doi:10.1002/jgrd.50422
Kim, J. H., Ho, C. H., Kim, H. S., Sui, C. H., and Park, S. K. (2008). Systematic variation of summertime tropical cyclone activity in the western North Pacific in relation to the Madden–Julian oscillation. J. Clim. 21, 1171–1191. doi:10.1175/2007JCLI1493.1
Li, R. C., Zhou, W., Chan, J. C. L., and Huang, P. (2012). Asymmetric modulation of western North Pacific cyclogenesis by the Madden–Julian oscillation under ENSO conditions. J. Clim. 25, 5374–5385. doi:10.1175/JCLI-D-11-00337.1
Li, R. C., and Zhou, W. (2013a). Modulation of western North Pacific tropical cyclone activity by the ISO. Part I: genesis and intensity. J. Clim. 26, 2904–2918. doi:10.1175/JCLI-D-12-00210.1
Li, R. C., and Zhou, W. (2013b). Modulation of western North Pacific tropical cyclone activity by the ISO. Part II: tracks and landfalls. J. Clim. 26, 2919–2930. doi:10.1175/JCLI-D-12-00211.1
Liebmann, B., Hendon, H. H., and Glick, J. D. (1994). The relationship between tropical cyclones of the western Pacific and Indian Oceans and the Madden–Julian oscillation. J. Meteor. Soc. Japan 72, 401–412. doi:10.2151/jmsj1965.72.3_401
Liebmann, B., and Smith, C. A. (1996). Description of a Complete (interpolated) outgoing longwave radiation dataset. Bull. Am. Meteorol. Soc., 77, 1275–1277. doi:10.1175/1520-0477(1996)077<1255:EA>2.0.CO;2
Lin, I. I., Liu, W. T., Wu, C. C., Wong, G. T., Hu, C., Chen, Z., et al. (2003). New evidence for enhanced ocean primary production triggered by tropical cyclone. Geophys. Res. Lett. 30, 1718. doi:10.1029/2003GL017141
Ling, Z., Wang, G., Wang, C., and Fan, Z. S. (2011). Different effects of tropical cyclones generated in the South China Sea and the northwest Pacific on the summer South China Sea circulation. J. Oceanogr. 67, 347–355. doi:10.1007/s10872-011-0044-1
Ling, Z., Wang, G., and Wang, C. (2015). Out-of-phase relationship between tropical cyclones generated locally in the South China Sea and non-locally from the Northwest Pacific Ocean. Clim. Dynam. 45 (3–4), 1129–1136. doi:10.1007/s00382-014-2362-7
Ling, Z., Wang, Y., and Wang, G. (2016). Impact of intraseasonal oscillations on the activity of tropical cyclones in summer over the South China Sea. Part I: local tropical cyclones. J. Clim. 29, 855–868. doi:10.1175/JCLI-D-15-0617.1
Madden, R. A., and Julian, P. R. (1972). Description of global-scale circulation cells in the Tropics with a 40–50 day period. J. Atmos. Sci. 29, 1109–1123. doi:10.1175/1520-0469(1972)029<1109:DOGSCC>2.0.CO;2
Madden, R. A., and Julian, P. R. (1971). Detection of a 40-50 day oscillation in the zonal wind in the tropical Pacific. J. Atmos. Sci., 28, 702–708. doi:10.1175/1520-0469(1971)028<0702:DOADOI>2.0.CO2;
Ren, S. L., Ren, Y. M., and Wu, G. X. (2008). Interaction between typhoon and western Pacific subtropical anticyclone: data analyses and numerical experiments, Acta Meteorol. Sin. 022 (003), 329–341. doi:10.1029/2007JD008874
Shi, Y., Du, Y., Chen, Z., and Wang, C. (2019). Impact of the quasi-biweekly oscillation on the super typhoon tracks in winter over the western North Pacific. Clim. Dynam. 53 (1–2), 793–804. doi:10.1007/s00382-019-04614-6
Wang, C., and Wang, X. (2013). Classifying El Nino Modoki I and II by different impacts on rainfall in southern China and typhoon tracks, J. Clim. 26, 1322–1338. doi:10.1175/JCLI-D-12-00107.1
Wang, G., Ling, Z., and Wang, C. (2009). Influence of tropical cyclones on seasonal ocean circulation in the South China Sea. J. Geophys. Res. Atmos., 114, C10022. doi:10.1029/2009JC005302
Wang, X., Wang, C., Han, G., Li, W., and Wu, X. (2014). Effects of tropical cyclones on large-scale circulation and ocean heat transport in the South China Sea. Clim. Dynam. 43, 3351–3366. doi:10.1007/s00382-014-2109-5
Zhao, H., Jiang, X., and Wu, L. (2015a). Modulation of Northwest Pacific tropical cyclone genesis by the intraseasonal variability. J. Meteor. Soc. Japan 91 (1), 81–97. doi:10.2151/jmsj.2015-006
Keywords: South China Sea, tropical cyclones, Madden-Julian oscillation, quasi-biweekly oscillation, western pacific subtropical high
Citation: Ling Z, Wang Y, Wang G and He H (2020) Impact of Intraseasonal Oscillations on the Activity of Tropical Cyclones in Summer Over the South China Sea: Nonlocal Tropical Cyclones. Front. Earth Sci. 8:609776. doi: 10.3389/feart.2020.609776
Received: 24 September 2020; Accepted: 17 November 2020;
Published: 16 December 2020.
Edited by:
Pang-chi Hsu, Nanjing University of Information Science and Technology, ChinaReviewed by:
Yingxia Gao, Inner Mongolia University, ChinaHaikun Zhao, Nanjing University of Information Science and Technology, China
Copyright © 2020 Ling, Wang, Wang and He. This is an open-access article distributed under the terms of the Creative Commons Attribution License (CC BY). The use, distribution or reproduction in other forums is permitted, provided the original author(s) and the copyright owner(s) are credited and that the original publication in this journal is cited, in accordance with accepted academic practice. No use, distribution or reproduction is permitted which does not comply with these terms.
*Correspondence: Yuqing Wang, yuqing@hawaii.edu