Response of Westerly Jet Over the Northern Hemisphere to Astronomical Insolation During the Holocene
 Peng Zhou
 Zhengguo Shi
 Xinzhou Li2,5
 - 1Interdisciplinary Research Center of Earth Science Frontier, Beijing Normal University, Beijing, China
- 2State Key Laboratory of Loess and Quaternary Geology, Institute of Earth Environment, Chinese Academy of Sciences, Xi’an, China
- 3Center for Excellence in Quaternary Science and Global Change, Chinese Academy of Sciences, Xi’an, China
- 4Institute of Global Environmental Change, School of Human Settlements and Civil Engineering, Xi’an Jiaotong University, Xi’an, China
- 5Center for Excellence in Tibetan Plateau Earth Sciences, Chinese Academy of Sciences, Beijing, China
The westerly jet (WJ) in the upper troposphere, an important atmospheric circulation system, is critical for influencing global climate by changes of its north–south migration and intensity. However, its variations during the Holocene across the Eurasian and North America are not well evaluated, which restricts our understanding of climate change in those regions. Using general circulation model experiments, here we simulate the variations of WJ over the past 10 ka to show its intensity and position of WJ responding to astronomical insolation. Our results suggest that the summer WJ gradually migrates southward and strengthens over the Central Asia (CA), Japan, and North America from the early Holocene (EH) to late Holocene (LH); meanwhile, the positions of the winter WJ barely move and its intensity slightly change. These seasonally asymmetric changes can be attributed to the temperature structure, in which the surface latent and sensible heat flux both contribute.
Introduction
The westerly jet (WJ), located in the upper troposphere, is the strong and narrow westerly wind belt with horizontal and vertical wind shears over the Northern Hemisphere (NH) throughout whole year. It is an important planetary-scale atmospheric circulation system affecting weather and climate anomalies; especially, its variations in the intensity and position play a vital role in affecting precipitation patterns in the middle and low latitudes (Yang et al., 2002; Schiemann et al., 2009; Zhao et al., 2014). Given the significance of WJ for global and regional climate, its variations have been widely investigated in recent years (Liang and Wang, 1998; Sung et al., 2006; Sampe and Xie, 2010; Huang et al., 2013, 2015; Wei et al., 2017).
Taken into consideration of the topographical complexity, such as the uneven of land and sea distribution and the topography of the Tibetan Plateau, the WJ has unique structural and seasonal characteristics in Asia (Kuang and Zhang, 2005; Shi et al., 2015). In view of the blocking effect of the Tibet Plateau, the south branch of the WJ is located at the south side of the Tibet Plateau in spring and winter with gradually northward migration in May; whereas it rapidly jumps to north site of Tibetan Plateau in June with continually northward migration in July away from the Tibetan Plateau (Lin and Lu, 2008). Due to intensification of the westerlies across the Tibetan Plateau, a pronounced enhancement of the East Asian rain band during the pre-Meiyu stage is proposed (Chiang et al., 2019).
Based on the synchronically occurrence time of modern westerly circulation and East Asian summer monsoon (EASM) precipitation, the synergistic changes of WJ and EASM during the Holocene have been widely investigated (Nagashima et al., 2007, 2011, 2013; Zhang et al., 2018; Herzschuh et al., 2019). By analysis of geochemical data of marginal sediments in Japan sea, Nagashima et al. (2007) proposed that, on the orbital timescale, the southward migration of WJ is accompanied by the intensified winter monsoon and southeastward migration of summer monsoon when the summer solar insolation decreased in NH. From 101 fossil pollen records, Herzschuh et al. (2019) proposed that the WJ-stream axis shifted gradually southward during the Holocene, which significantly influences the position of EASM rainband.
In addition to paleoclimate proxies, climate simulations have been employed to study the Holocene westerlies and monsoon changes, which are closely associated with the precipitation or moisture over Central and East Asia (Jin et al., 2012; Shi et al., 2012; Li et al., 2013; Chiang et al., 2015; Shi, 2016; Zhang et al., 2016, 2017; Kong et al., 2017). Nevertheless, there are apparently significant differences of westerly winds during the Holocene. For example, a strengthening trend of westerly during the Holocene in NW China has been suggested by the coupled climate models (Jiang et al., 2007; Jin et al., 2012; Zhang et al., 2016, 2017); meanwhile, the transient simulation, forced by Earth’s orbital parameters, draw an opposite relationship between the westerly and precipitation during the Holocene (Li et al., 2013).
Although the geological archives and modeling simulations gave useful information, the basic mechanisms for WJ during Holocene are still unclear and controversial. Thus, a better understanding of the temporal and spatial variation of the WJ and its forcing mechanisms is important for validating the regional-scale moisture conditions, which are paramount in assessing future climate change impacts. In this study, based on the Community Earth System Model (CESM) with a relatively high horizontal resolution, we explore the seasonal characteristics of WJ in the NH, especially the Asia, during the Holocene responding to astronomical insolation.
Numerical Model and Transient Experiments
The CESM, released by National Center for Atmospheric Research (NCAR), was conducted in this study. The CESM is a fully coupled model of the earth system, mainly including atmosphere, ocean, ice, river, and carbon cycle (Kay et al., 2015). It is a flexible and extensible tool for studying global change and can be applied to explore the relationship of subsystems in the earth system at multiple time and spatial scale, providing up-to-date simulations of the earth’s past, present, and future. To save calculation resources, the atmospheric module CAM5 is coupled with a slab ocean, in which only the feedback of sea surface temperature is included. The horizontal resolution of the atmospheric module is chosen to be 0.47° × 0.63° in latitude and longitude, so that it provides a relatively high resolution to better capture regional features.
We conducted an accelerated transient experiment covering the past 10 ka by orbit acceleration technology (Li et al., 2013). In the simulation, only the changes in orbital parameters are included to purely examine the effect of astronomical insolation on the westerlies. Setting the orbital parameters to 10 ka BP, the model is integrated for 50 years as a spin up time. After that, the orbital parameters are prescribed to the values of every 50-year intervals at the end of each model year. Hence, a total of 200 model years are calculated for the whole of 10 ka by accelerating the variations in the orbital cycles with a factor of 50.
In addition, a more modern reanalysis product, the European Centre for Medium-Range Weather Forecasts (ECMWF)-Interim reanalysis (ERA-Interim) dataset from 1979 to 2014 is used for comparison with the simulated results. The horizontal resolution of the ERA data is 0.75° × 0.75°. In the analysis, the climate state in boreal summer refers to the average of June, July, and August (JJA), and the winter refers to the average of December, January, and February (DJF).
Results
Model Validation
To verify the reliability on the spatiotemporal changes of WJ, the model results are compared with the observed meteorological data (Figures 1, 2). Figure 1 shows the winter and summer mean surface temperature in NH from the ERA data and the averaged data for 1-0 ka BP in our experiments. The model slightly underestimates the summer surface temperature over the high latitudes and overestimate over the North America and Eurasia (Figures 1A,B). Similarly, the simulated mean surface temperature in winter is also slightly lower than that of the ERA data over the high latitudes (Figures 1C,D). Considered that the simulated temperature is averaged for the last 1 ka, the spatial distributions of the simulated summer and winter mean surface temperature are in good agreement with the ERA data.
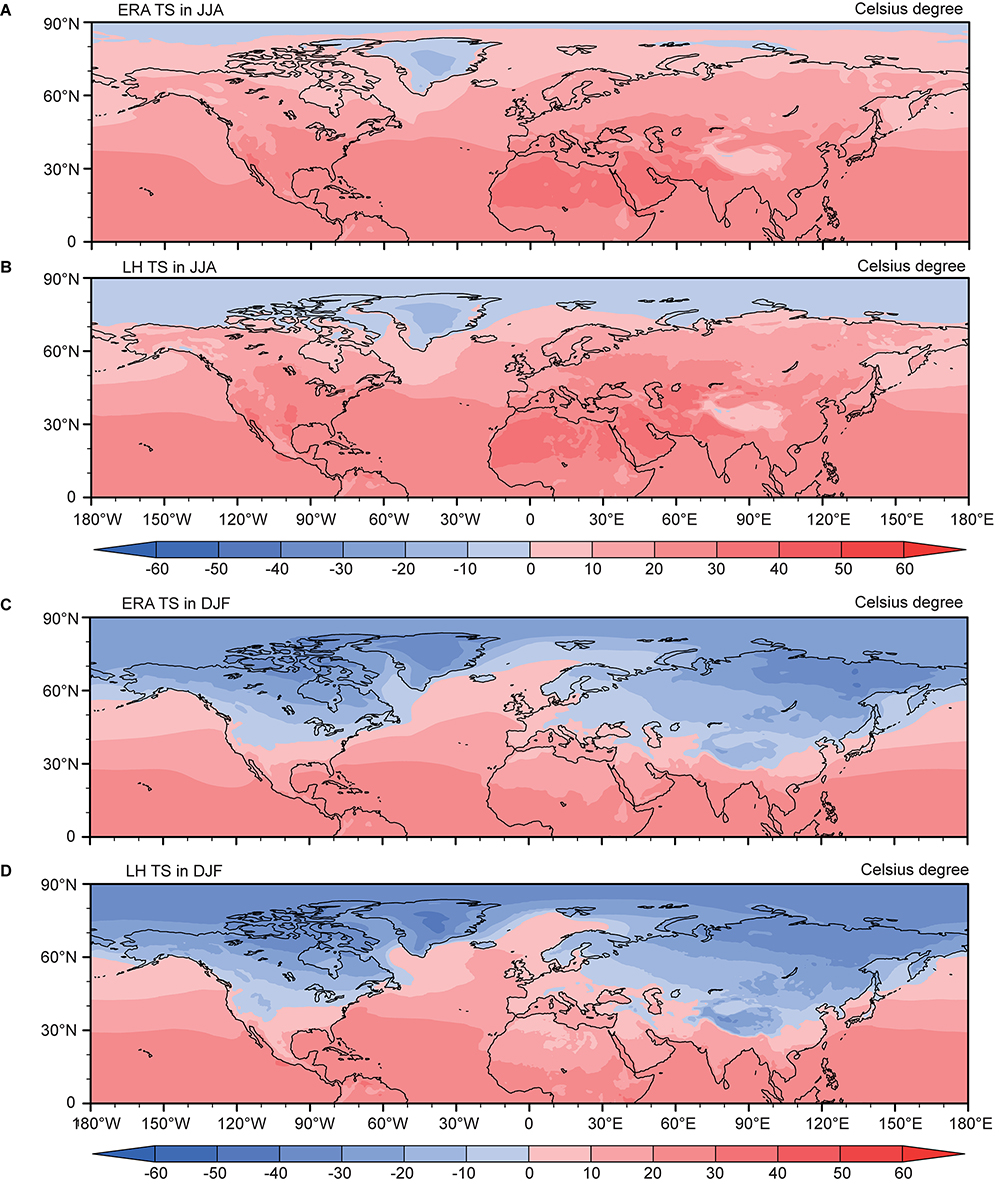
Figure 1. Northern Hemisphere surface temperature (°C). The ERA-Interim reanalysis data for 1979–2014 (A,C), and the simulated results averaged for 1-0 ka BP (B,D).
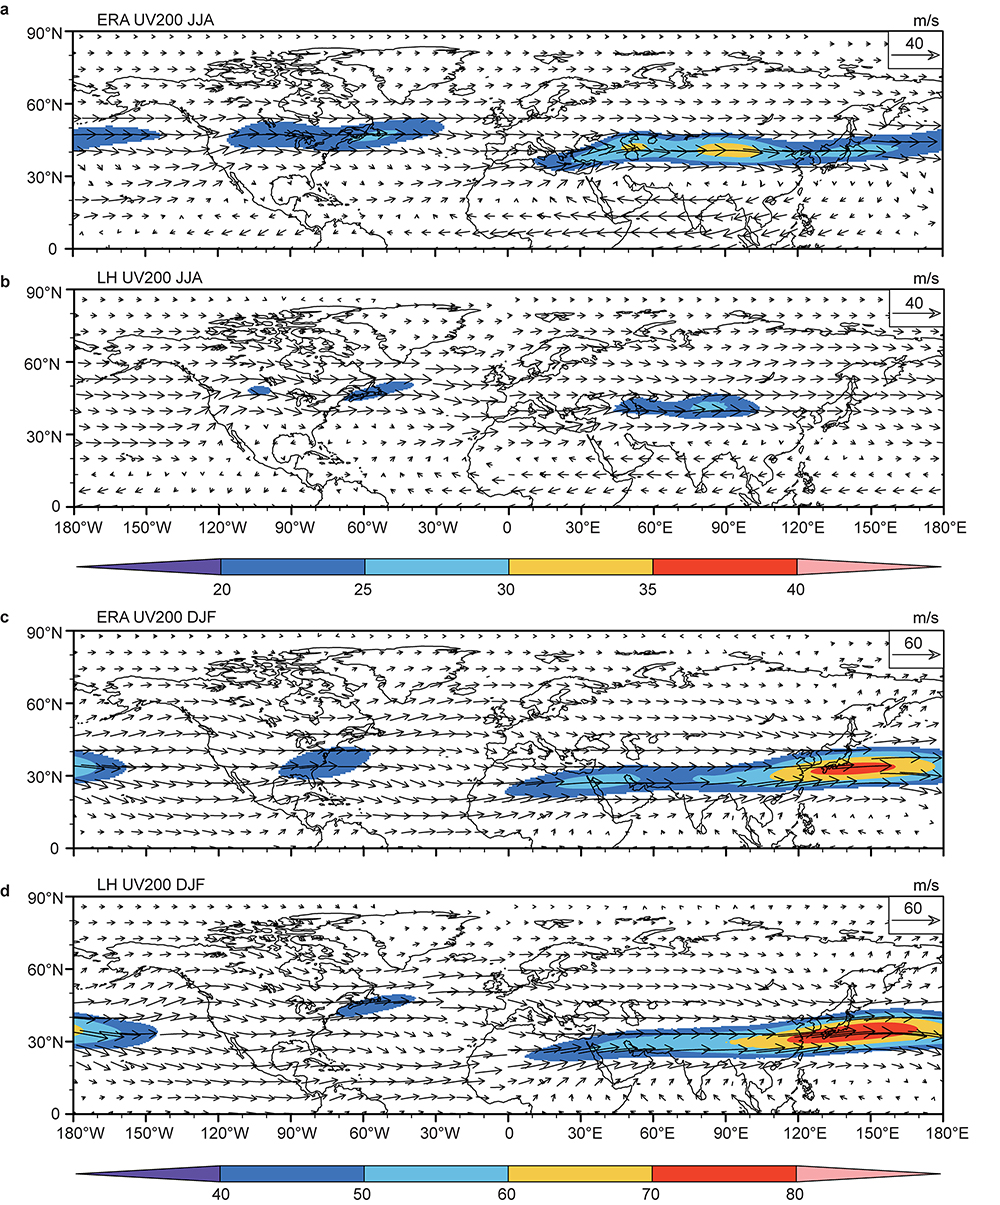
Figure 2. The 200 hPa wind fields (m/s) in boreal summer and winter for the ERA-Interim reanalysis data for 1979–2014 in (a,c) and simulated results averaged for 1-0 ka BP (b,d). Vectors are the 200 hPa horizontal winds (m/s) and the shading represents the jets with wind speeds more than 20 m/s in summer and 40 m/s in winter, respectively.
The spatial distributions and values of simulated summer and winter WJ are broadly consistent with the general features of ERA data, especially over the Asia (Figure 2). In summer, the WJ is located at 40°N with the center of the north of the Tibetan Plateau (Figures 2a,b). Our simulation underestimates the intensity of summer WJ, especially in the Japan and North America. In winter, the WJ generally shifts southward and the center over the North Pacific Ocean becomes stronger. Overall, both the intensity and position of WJ are well captured by our simulation, allowing us to further analyze the response of WJ to astronomical insolation during the Holocene.
The Spatiotemporal Variations of WJ
In order to evaluate the changes of WJ, we focus on three center areas including: the Central Asia (CA; 70–100°E, 15–55°N), the Japan (125–155°E, 15–55°N), and Northern America (NA; 60–100°W, 15–55°N). The intensity of WJ is defined as the mean 200 hPa wind speed in which the maximum westerly wind located on each longitude and its position is corresponding to the latitude of maximum wind speed at each region. Figure 3 illustrates the changes in intensity and position of winter and summer WJ over the three regions during the Holocene. Over the CA, the intensity and position of summer WJ show a gradual increasing trend (Figure 3a) and southward migration (Figure 3b) during the Holocene, respectively. In contrast, the intensity and position of winter WJ demonstrate a weakening but not significant trend (Figure 3c) and northward migration, respectively (Figure 3d). The intensity and position of summer WJ over the Japan illustrate a similar pattern with highly sensitive of its position compared with that of the CA (Figure 3f). A weakened trend of winter WJ is noticeable over the Japan (Figure 3g). However, the changes in intensity and position over the NA during the Holocene are quite different with that of the CA and Japan. The position of WJ in NA shows a southward migration both in summer and winter (Figures 3j,l), with almost no significant change in intensity (Figures 3i,k).
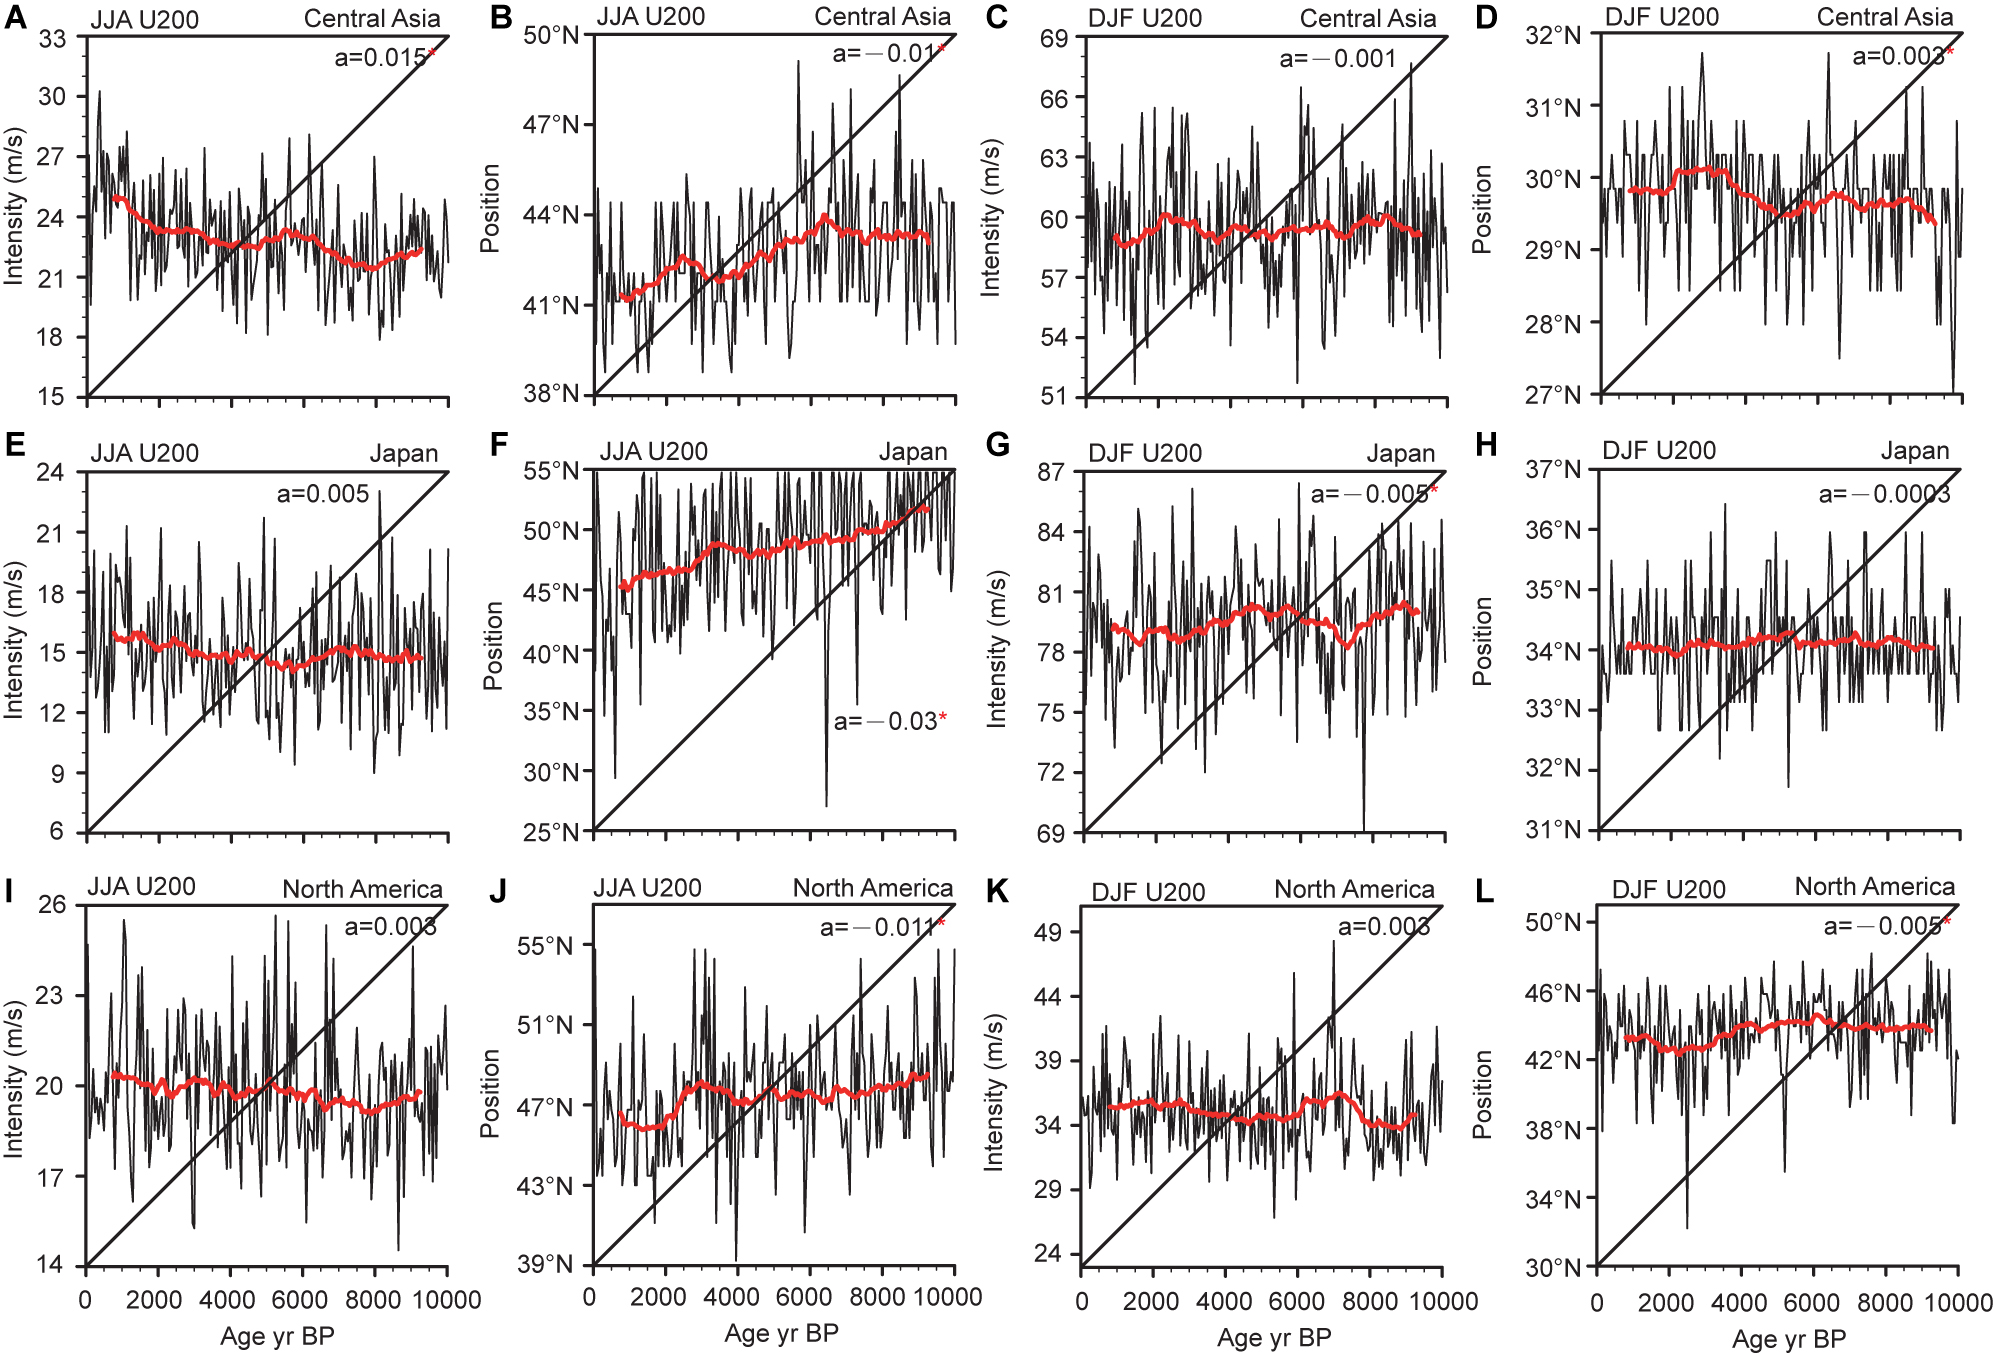
Figure 3. Simulated changes in the intensity and position of WJ during the Holocene over Central Asia (a–d), Japan (e–h), and North America (i–l). The red line represents a 31-simulation-year moving average. The red pentagram indicates that slope is significant at the 99% significance level.
To examine the spatial features of the WJ, we compared the 200 hPa wind vector difference between early Holocene (EH; 10–9 ka BP) and late Holocene (LH; 1-0 ka BP) in summer and winter. A long band-shaped region with positive values of westerly wind speed at 15–40°N in summer indicates obvious southward shift during the Holocene over the CA, Japan and NA (Figure 4a). However, the wind field in winter shows a quite different distribution (Figure 4b). There is showing a striking anticyclone-like pattern over the Northern Pacific, eastern North Atlantic Ocean, and Northwest Siberia and a cyclone-like pattern over the Eastern America and Mediterranean. As illustrated in vertical structure, the summer westerlies occupy the north of 30°N with the strongest centers at 40–50°N over CA, Japan, and NA (Figures 5a,e,i). The difference of LH-minus-EH shows significant maximal positive values at approximately 30–40°N, implying intensified and southward summer WJ during the LH (Figures 5b,f,j). The intensified WJ spreads from middle to high troposphere. The winter westerlies in CA are located at north of 15°N (Figure 5c) with a slightly northward migration and a decreasing trend during the LH. This result is evidently supported by the distribution of differences of LH-minus-EH, which show a slightly negative value at 15–55°N (Figure 5d). The changes of winter WJ in Japan are illustrated in Figure 5g, which shows a dramatic increasing trend in winter and locates at north of 15°N. Both of positive and negative values in difference of LH-minus-EH between 15 and 55°N in Japan are suggested, revealing a slightly decreasing trend of intensity in winter WJ (Figure 5h). In NA, the westerlies reach the maximum at 35°N (Figure 5k). The differences of LH-minus-EH show a slightly positive value, indicating strengthened westerlies during the Holocene (Figure 5l).
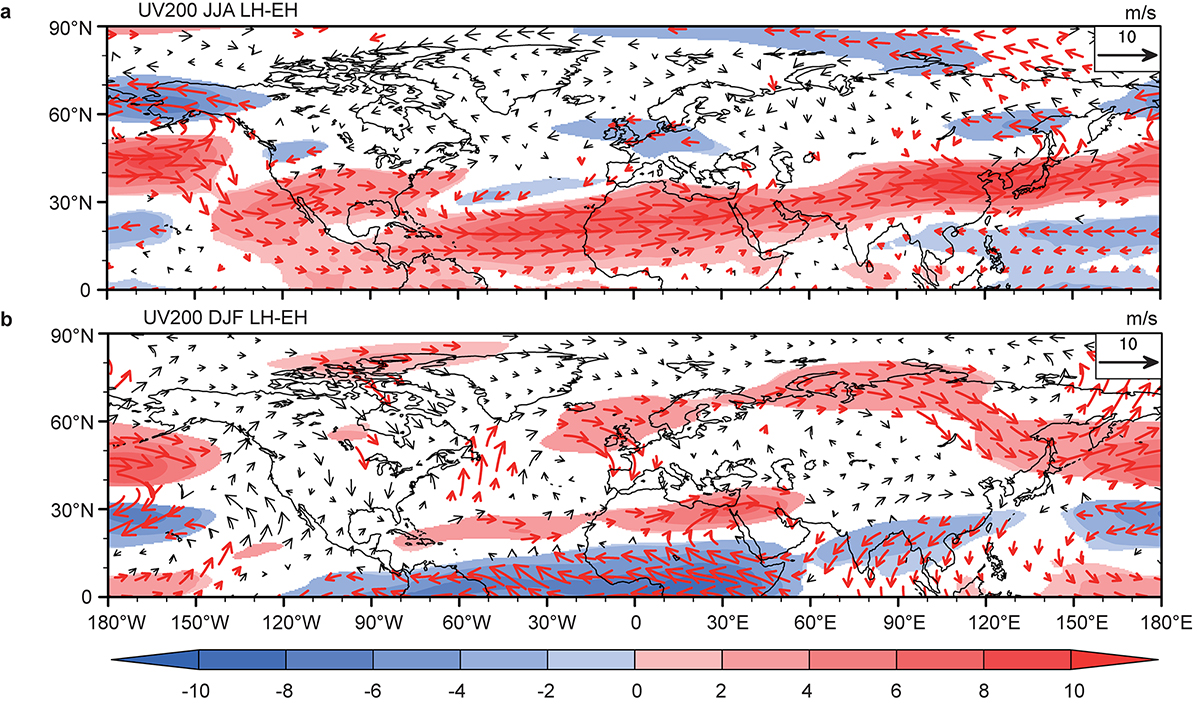
Figure 4. The differences in 200 hPa wind field (m/s) between late Holocene and early Holocene in summer (a) and winter (b). Red vectors indicate that the differences are significant at the 95% confidence level and the shading represents the differences in 200 hPa westerly winds are significant.
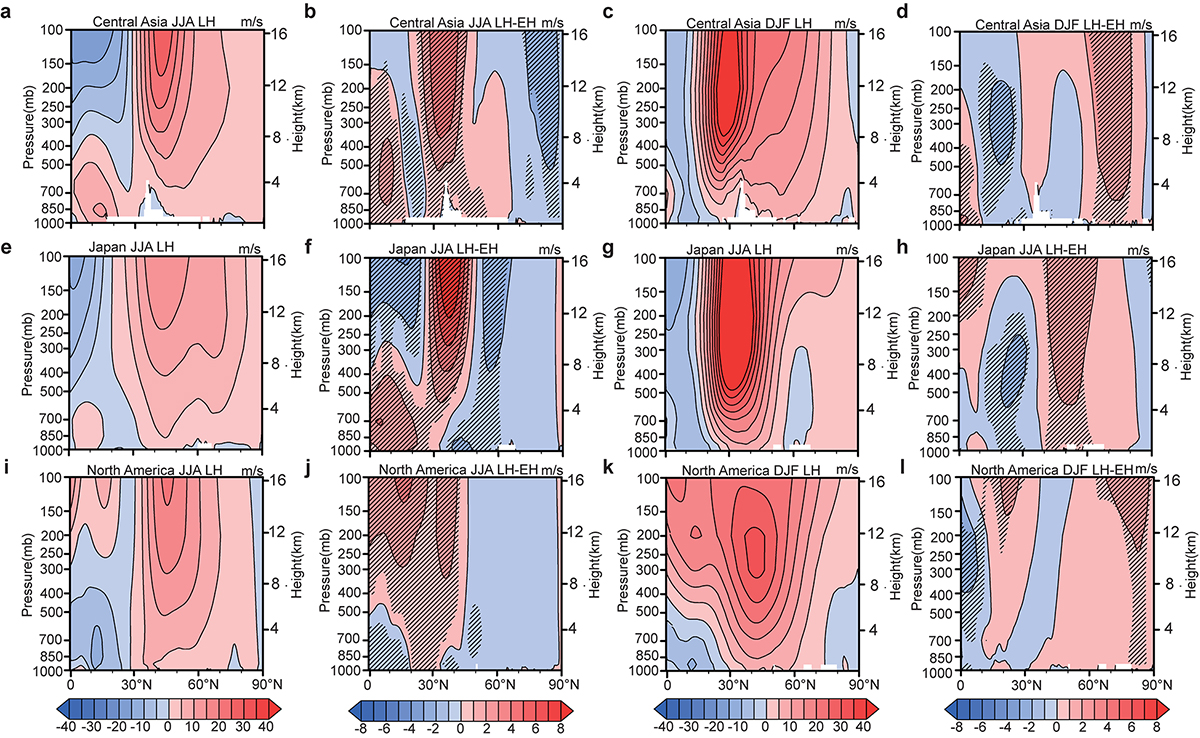
Figure 5. Vertical profile of zonal mean westerly winds in boreal summer and winter averaged for Central Asia (a–d), Japan (e–h), and North America (i–l). The values for LH and the differences between LH and EH are both shown. Black shades indicate the differences at the 95% significance level.
We calculate the monthly variations of the intensity and position of WJ during the Holocene to examine the seasonal characteristics (Figure 6). From the seasonal variation of the WJ wind speed, the intensity of the WJ is strongest in winter and weakest in summer (Figures 6a–c). The maximum intensity of difference between the LH and EH periods appears in summer, slightly changing in other seasons. Comparison with the intensity, the position of WJ also shows highly seasonal variations. The WJ shifts to the northernmost position in summer, while it moves to the southernmost position in winter (Figures 6b–d). Over the CA and Japan, the WJ during the Holocene gradually and significantly shifted southward in spring and summer whereas it migrated northward in autumn and winter. Nevertheless, the shift of WJ over the NA is quite different with that of CA and Japan. It shifts southward in summer and winter whereas northward in spring and autumn. The maximum position of difference between the LH and EH appears in summer over the CA and Japan while in winter over the NA.
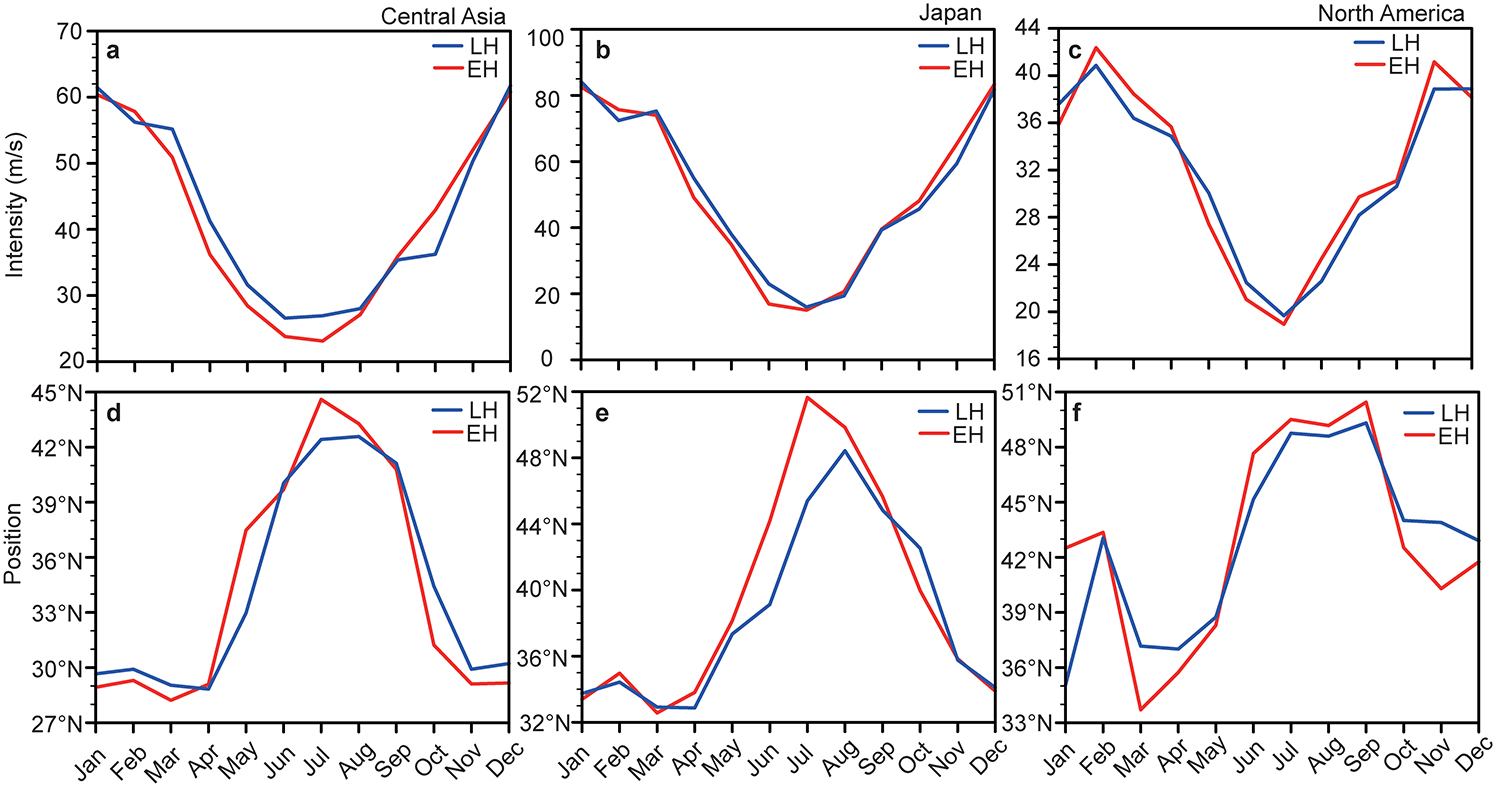
Figure 6. Monthly variation of intensity and position of WJ over Central Asia (a,d), Japan (b,e), and North America (c,f). The red and blue lines represent the EH and LH, respectively.
Physical Mechanisms for WJ Variations
As shown in Figure 7, the most significant response of the 200 hPa geopotential height disturbance occurs over the NH, which is consistent with the pattern of wind vector. The negative LH-minus-EH differences in geopotential height disturbances in summer lie over northern North Pacific, Mediterranean, and Southern Siberia (Figure 7B), corresponding with the cyclone-like pattern in the wind field (Figure 4a). However, the positive LH-minus-EH differences in geopotential height disturbances in winter occupy Northern Pacific, eastern North Atlantic Ocean, and Northwest Siberia (Figure 7D), which are consistent with the anticyclone-like pattern in the wind field (Figure 4b). As illustrated in Figures 7, 8, the upper tropospheric geopotential height disturbance and the mid-tropospheric temperature disturbance are highly synchronized in the spatial patterns. The results show that the anomaly areas of geopotential height disturbance are broadly synchronous with that of temperature disturbance (Figure 8). The geographic distribution of averaged 500 hPa temperature and the zonal mean for LH as well as its differences (LH-EH) over the North Hemisphere are shown (Figure 9). During the LH, the summer temperature at 500 hPa exhibits a decreasing trend from low to high latitudes (Figure 9A). While the difference of LH-minus-EH is generally showing negative values with the minimum at the mid-latitudes around 60°N, which clearly imply that the summer temperature at 500 hPa in EH is higher and its variation is stronger in mid and high latitudes (Figure 9B). The winter temperature at 500 hPa during the LH demonstrates a decreasing trend with increased latitudes (Figure 9C). The LH-minus-EH difference indicates that the winter warming reaches the maximum value at 30°N with declining for both polarward and equatorward (Figure 9D). In addition, the profile of zonal mean surface air temperature during the LH and the difference of LH-minus-EH (Figure 10) are generally coeval with the temperature pattern at 500 hPa (Figure 9), which supports that the 500 hPa temperature is largely controlled by the surface.
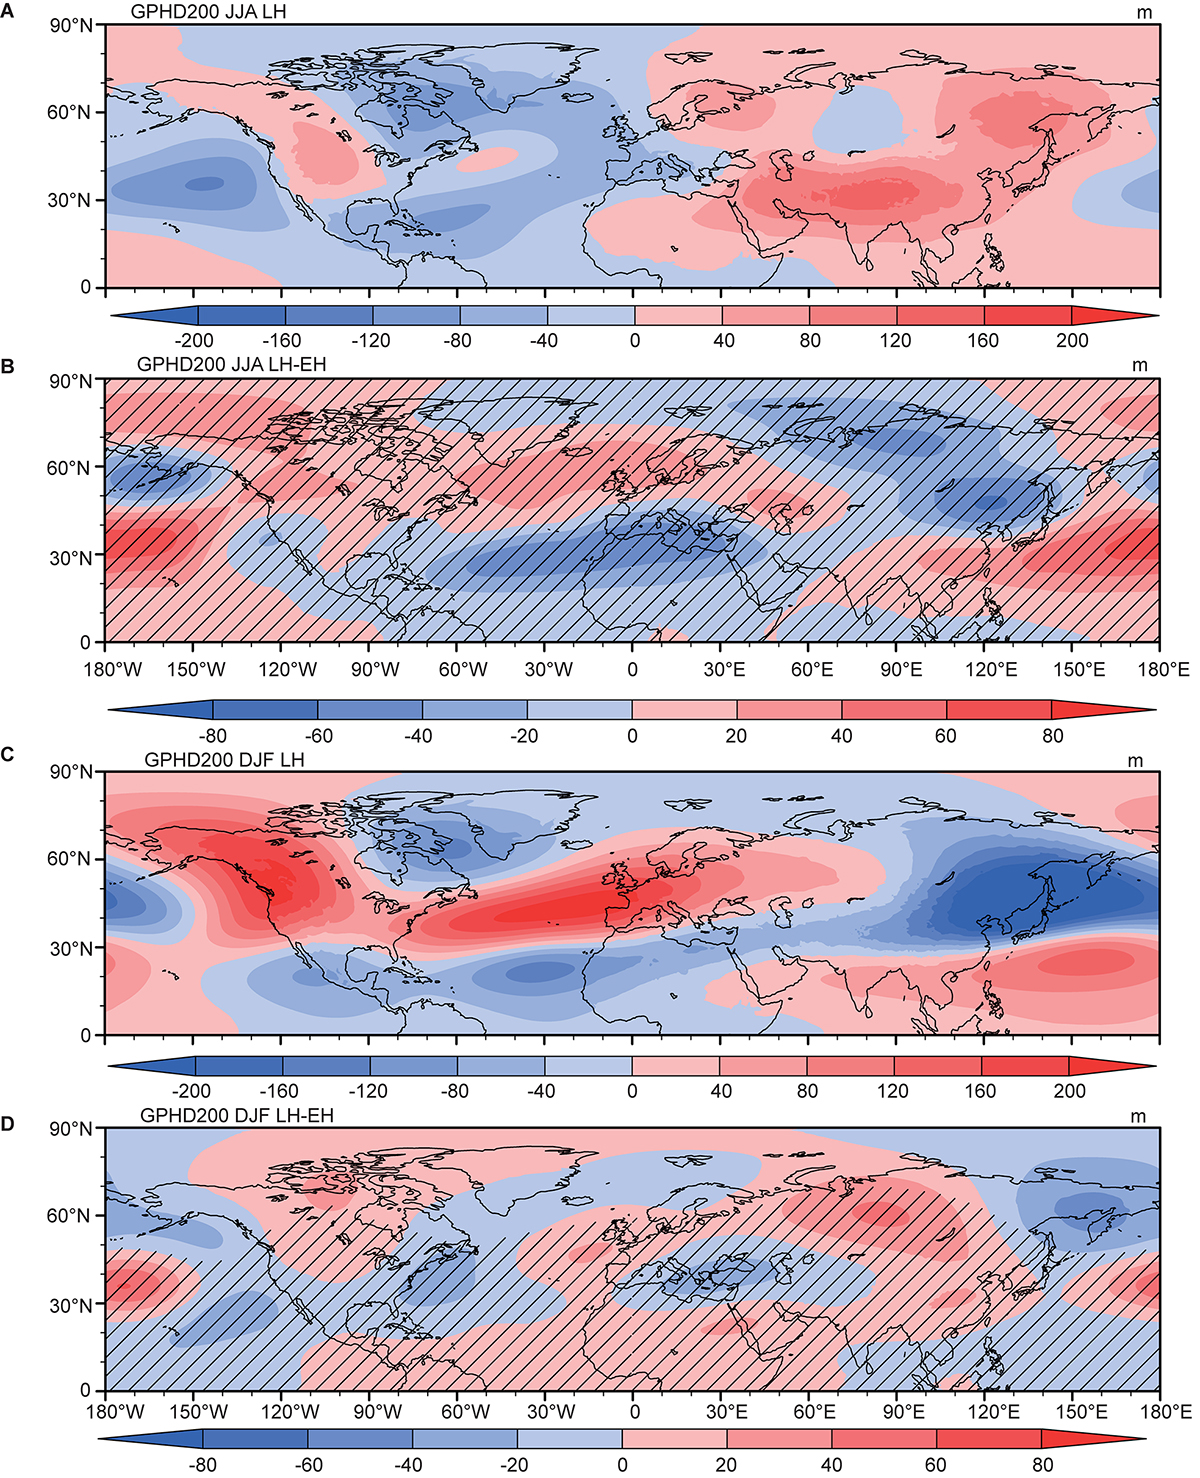
Figure 7. The 200 hPa geopotential height disturbance over the Northern Hemisphere during the Holocene. Summer and winter 200 hPa geopotential height disturbance in LH (A,C) and the LH-minus-EH difference (B,D). The line indicates the differences at the 95% significance level.
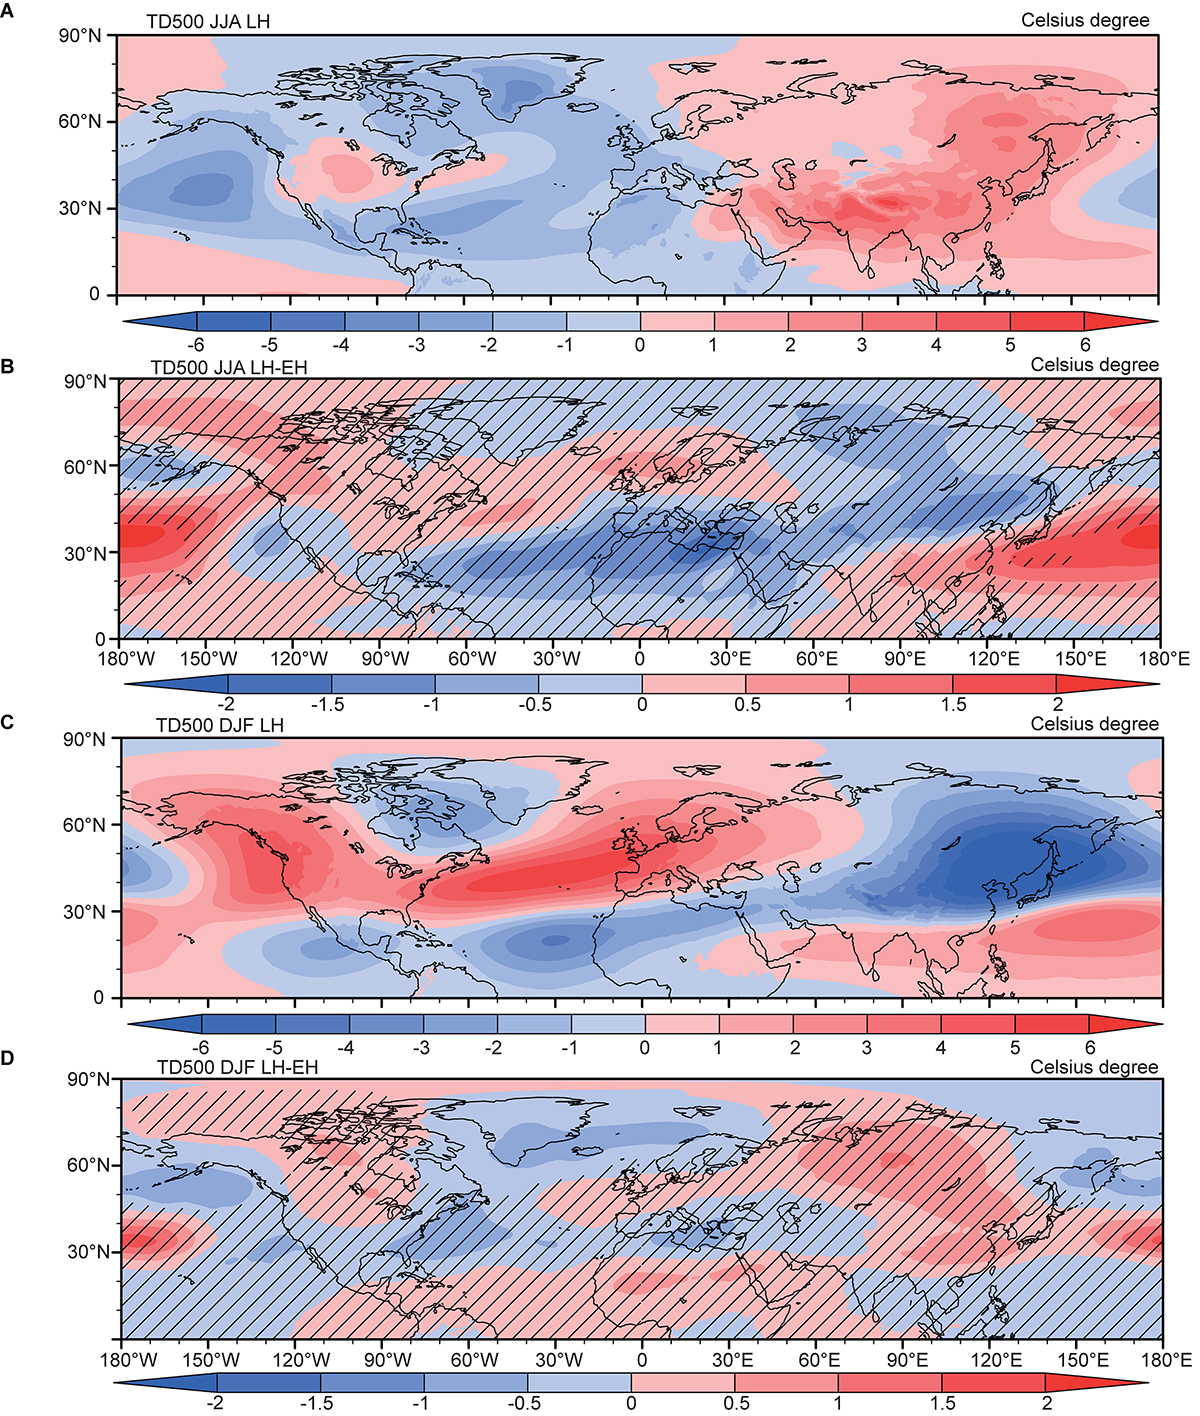
Figure 8. The 500 hPa temperature disturbance over the Northern Hemisphere during the Holocene. Summer and winter 500 hPa temperature disturbance in LH (A,C) and the LH-minus-EH difference (B,D). The line indicates the differences at the 95% significance level.
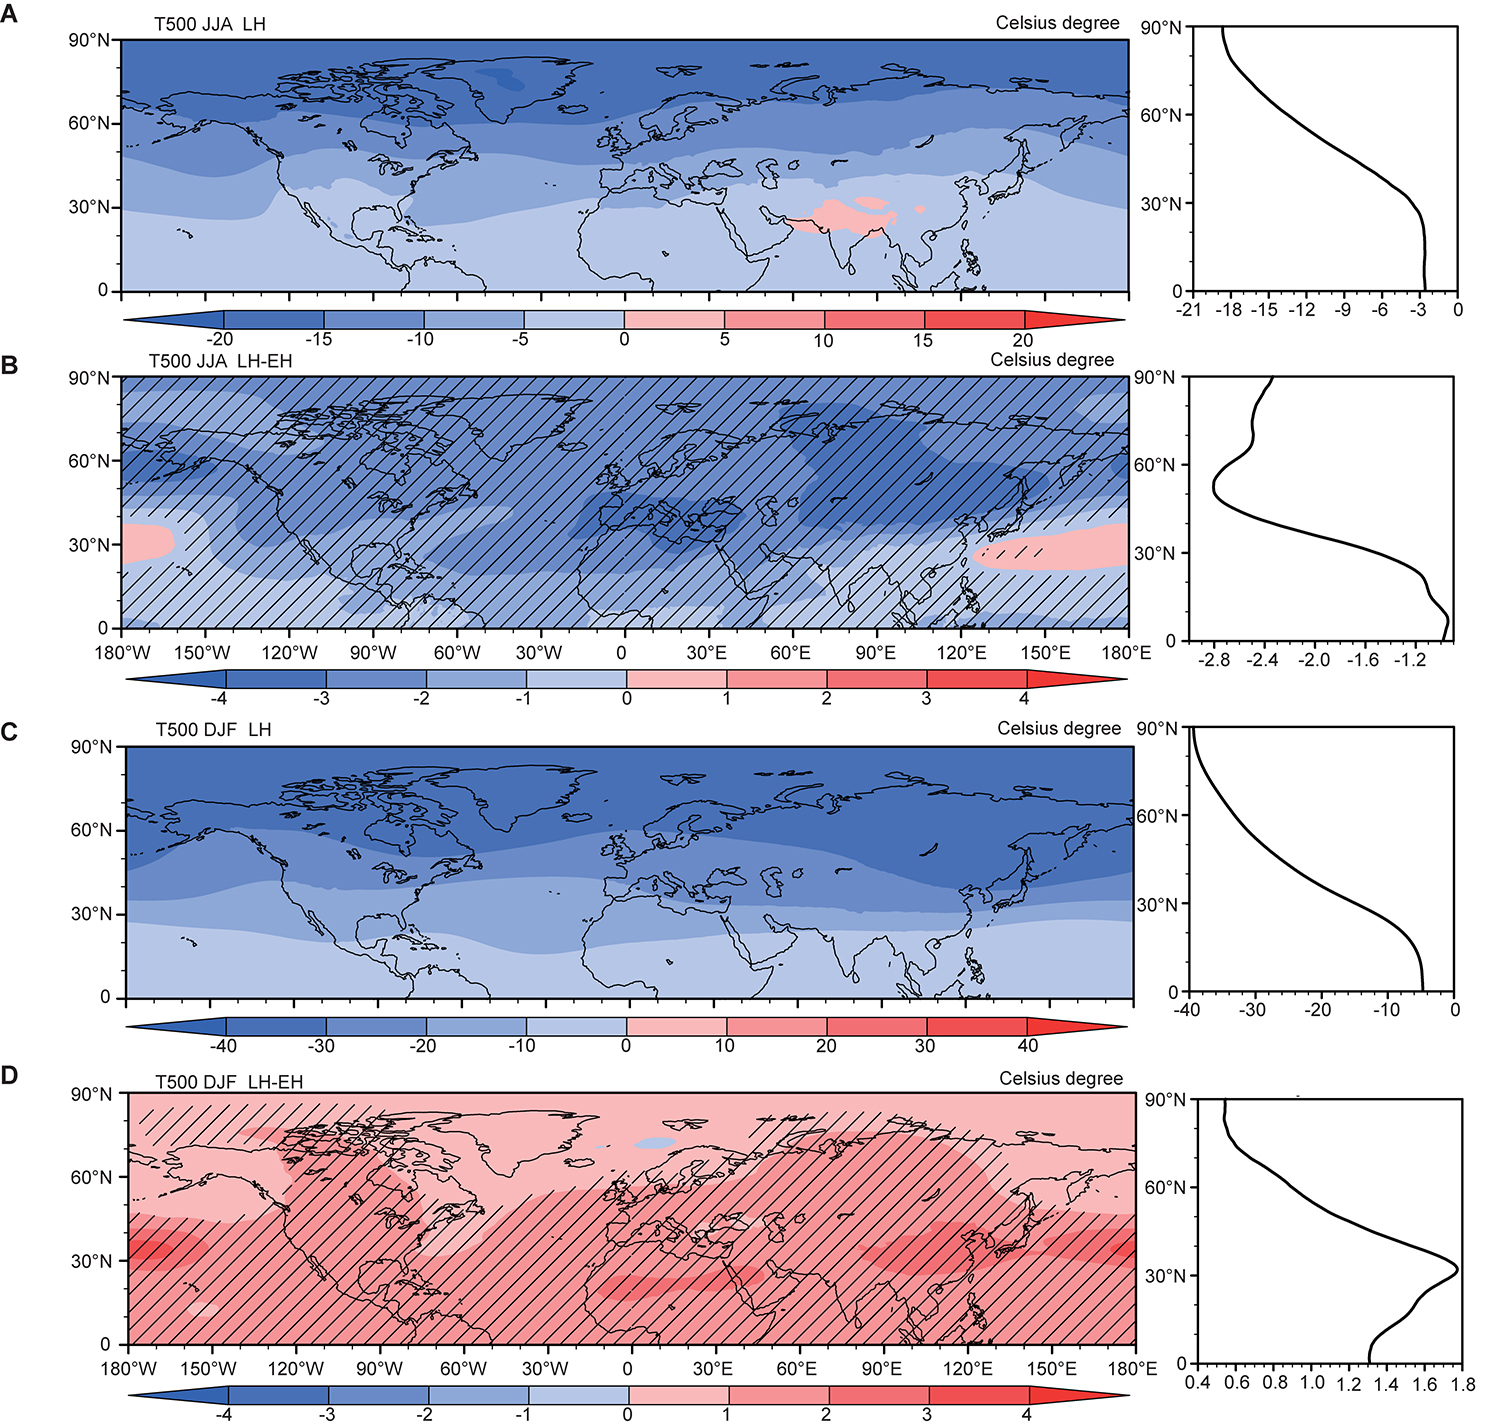
Figure 9. The 500 hPa temperature distributions and the zonal mean temperature profiles. Summer and winter 500 hPa temperature distributions and zonal mean temperature profiles in LH (A,C) and the LH-minus-EH difference (B,D). The line indicates the differences at the 95% significance level.
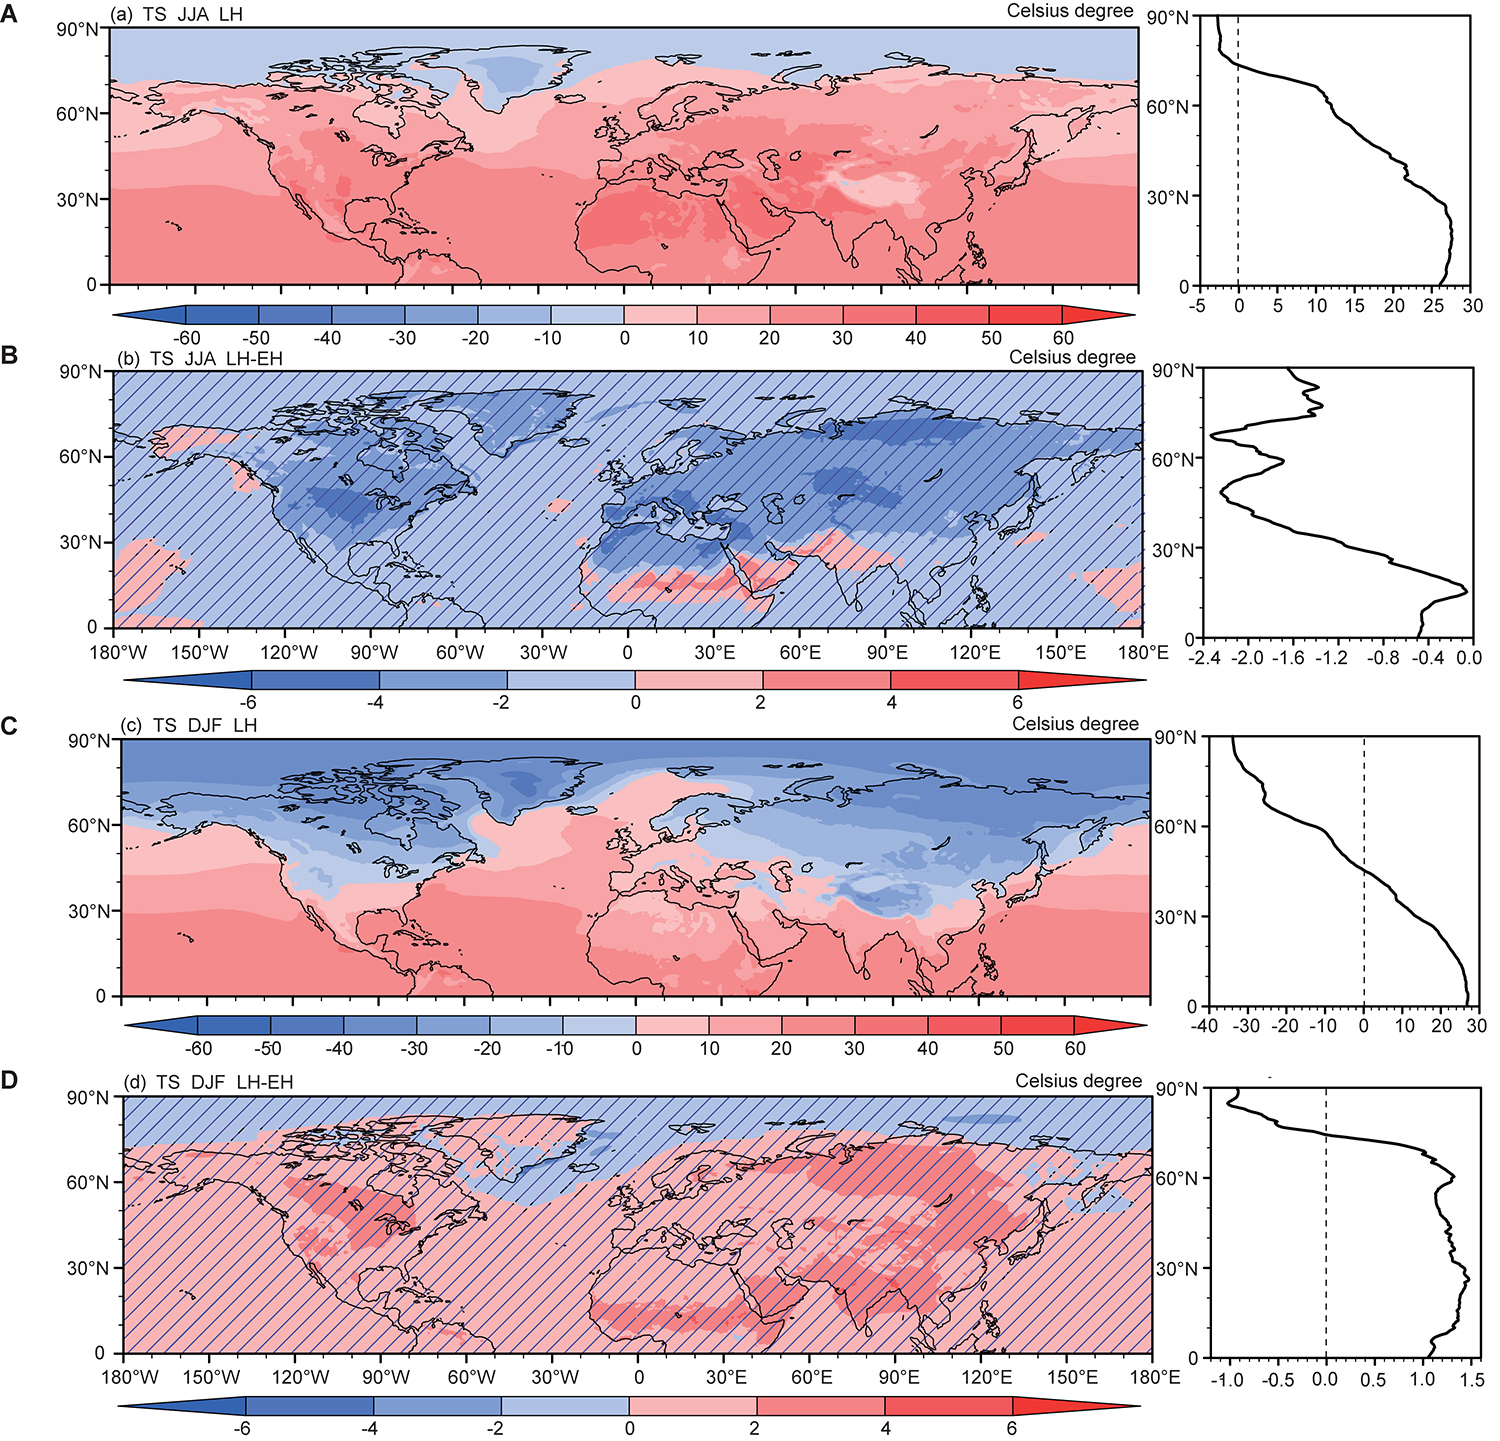
Figure 10. Surface temperature distributions and the zonal mean temperature profiles. Summer and winter surface temperature distributions and zonal mean temperature profiles in LH (A,C) and the LH-minus-EH difference (B,D). The line indicates the differences at the 95% significance level.
The surface temperature is presumably associated with the influence of solar insolation, surface latent and sensible heat flux during the Holocene (Figures 11–13). From the forcing of astronomical insolation, the absolute maximum solar insolation of the LH-minus-EH difference appears at the equator in summer and winter (Figures 11B,D). However, the surface air temperature difference reaches the negative maximum around 60°N in summer and positive maximum around 30°N in winter (Figures 10B,D). In summer, both the negative peaks of LH-minus-EH differences for the surface latent and the sensible heat flux at 60°N, probably modulated by the land-sea distribution, are roughly similar with that of the surface air temperature (Figures 12B, 13B). The positive maximum of latent heat flux at 30°N is larger in winter which means more contributions on the surface air temperature (Figures 12D, 13D). Therefore, we can conclude that the surface air temperature influenced by the latent and sensible heat flux has shown significant local characteristics with seasonal changes, which further result in seasonal changes in the intensity and position of the WJ.
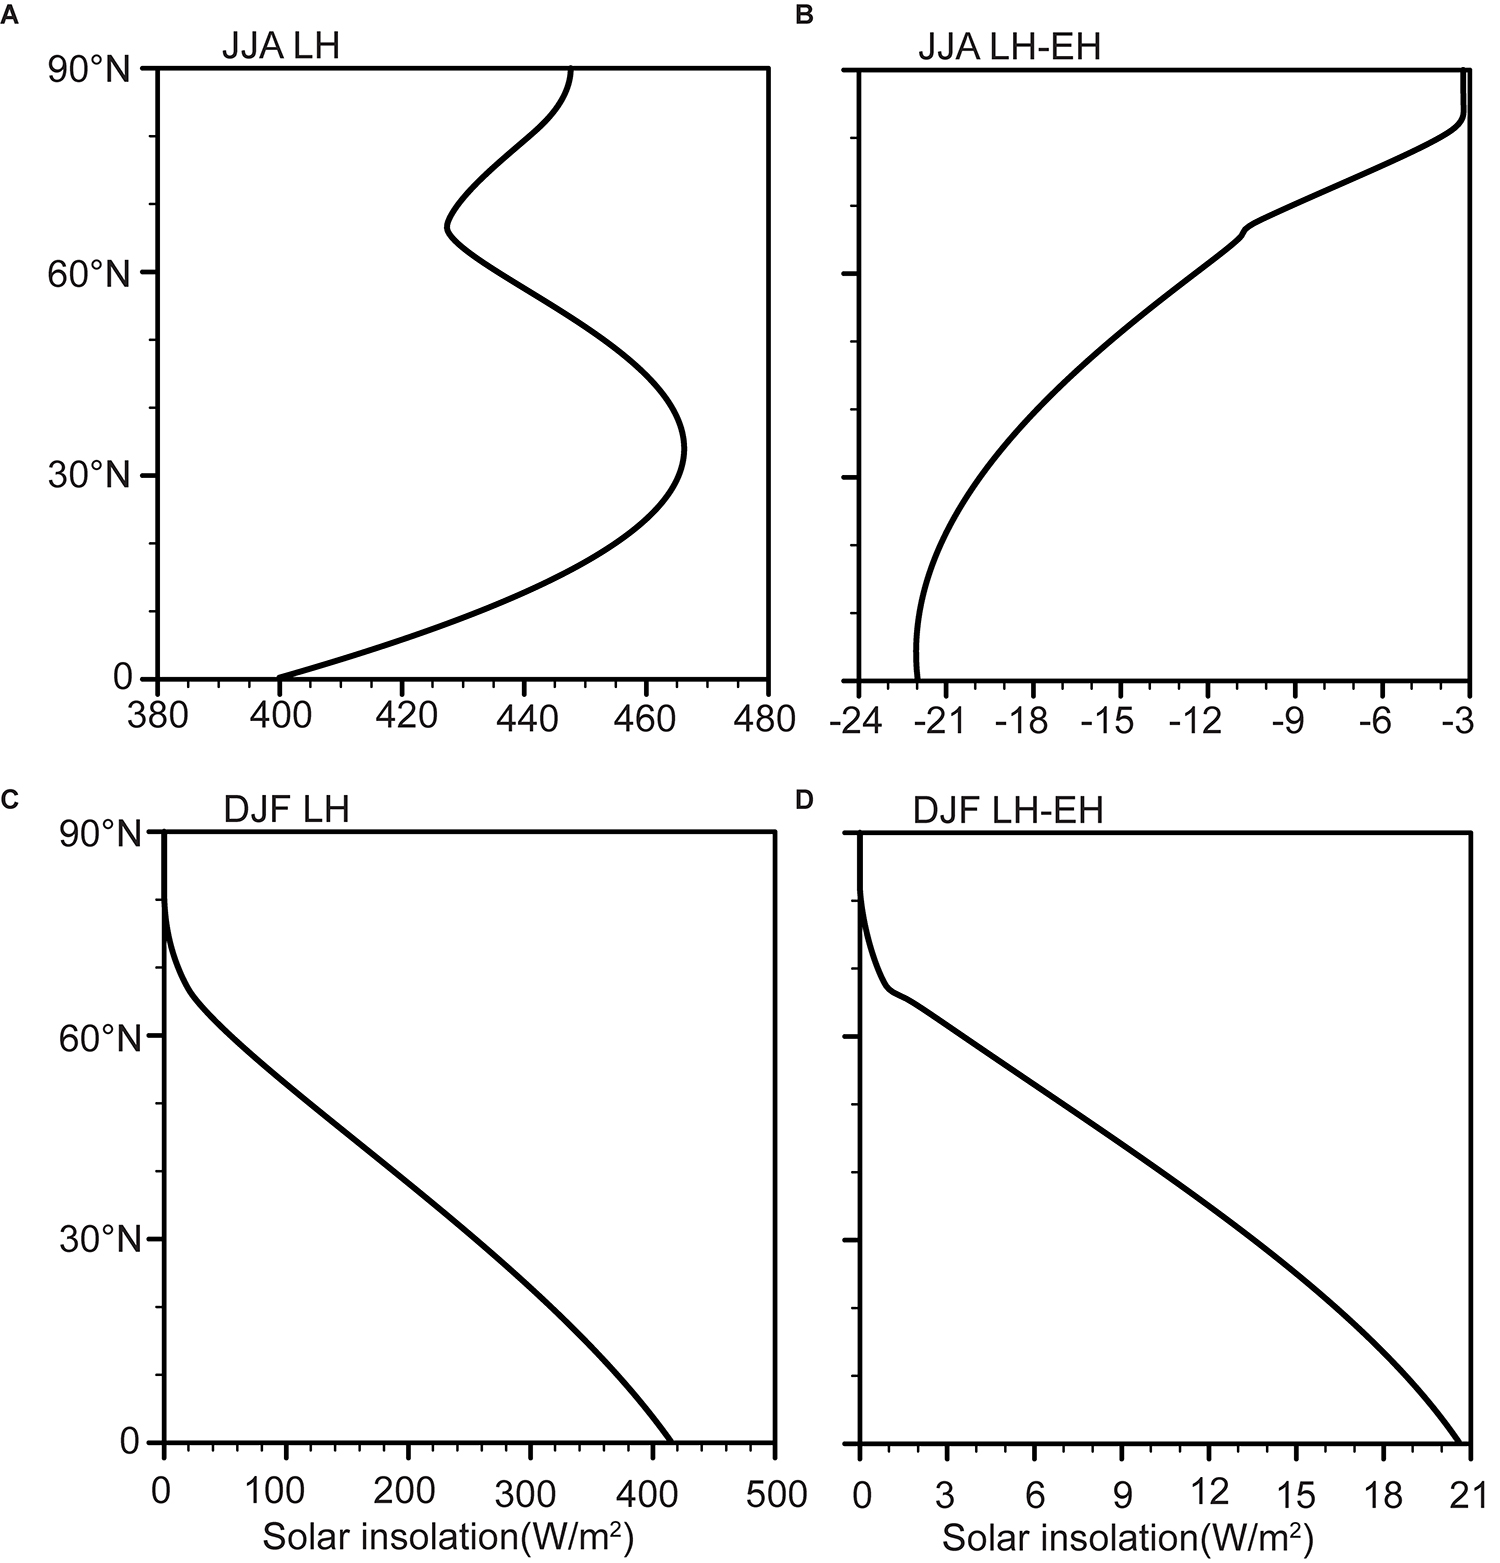
Figure 11. Zonal mean profiles of solar insolation. Summer and winter solar insolation in LH (A,C) and the LH-minus-EH difference (B,D).
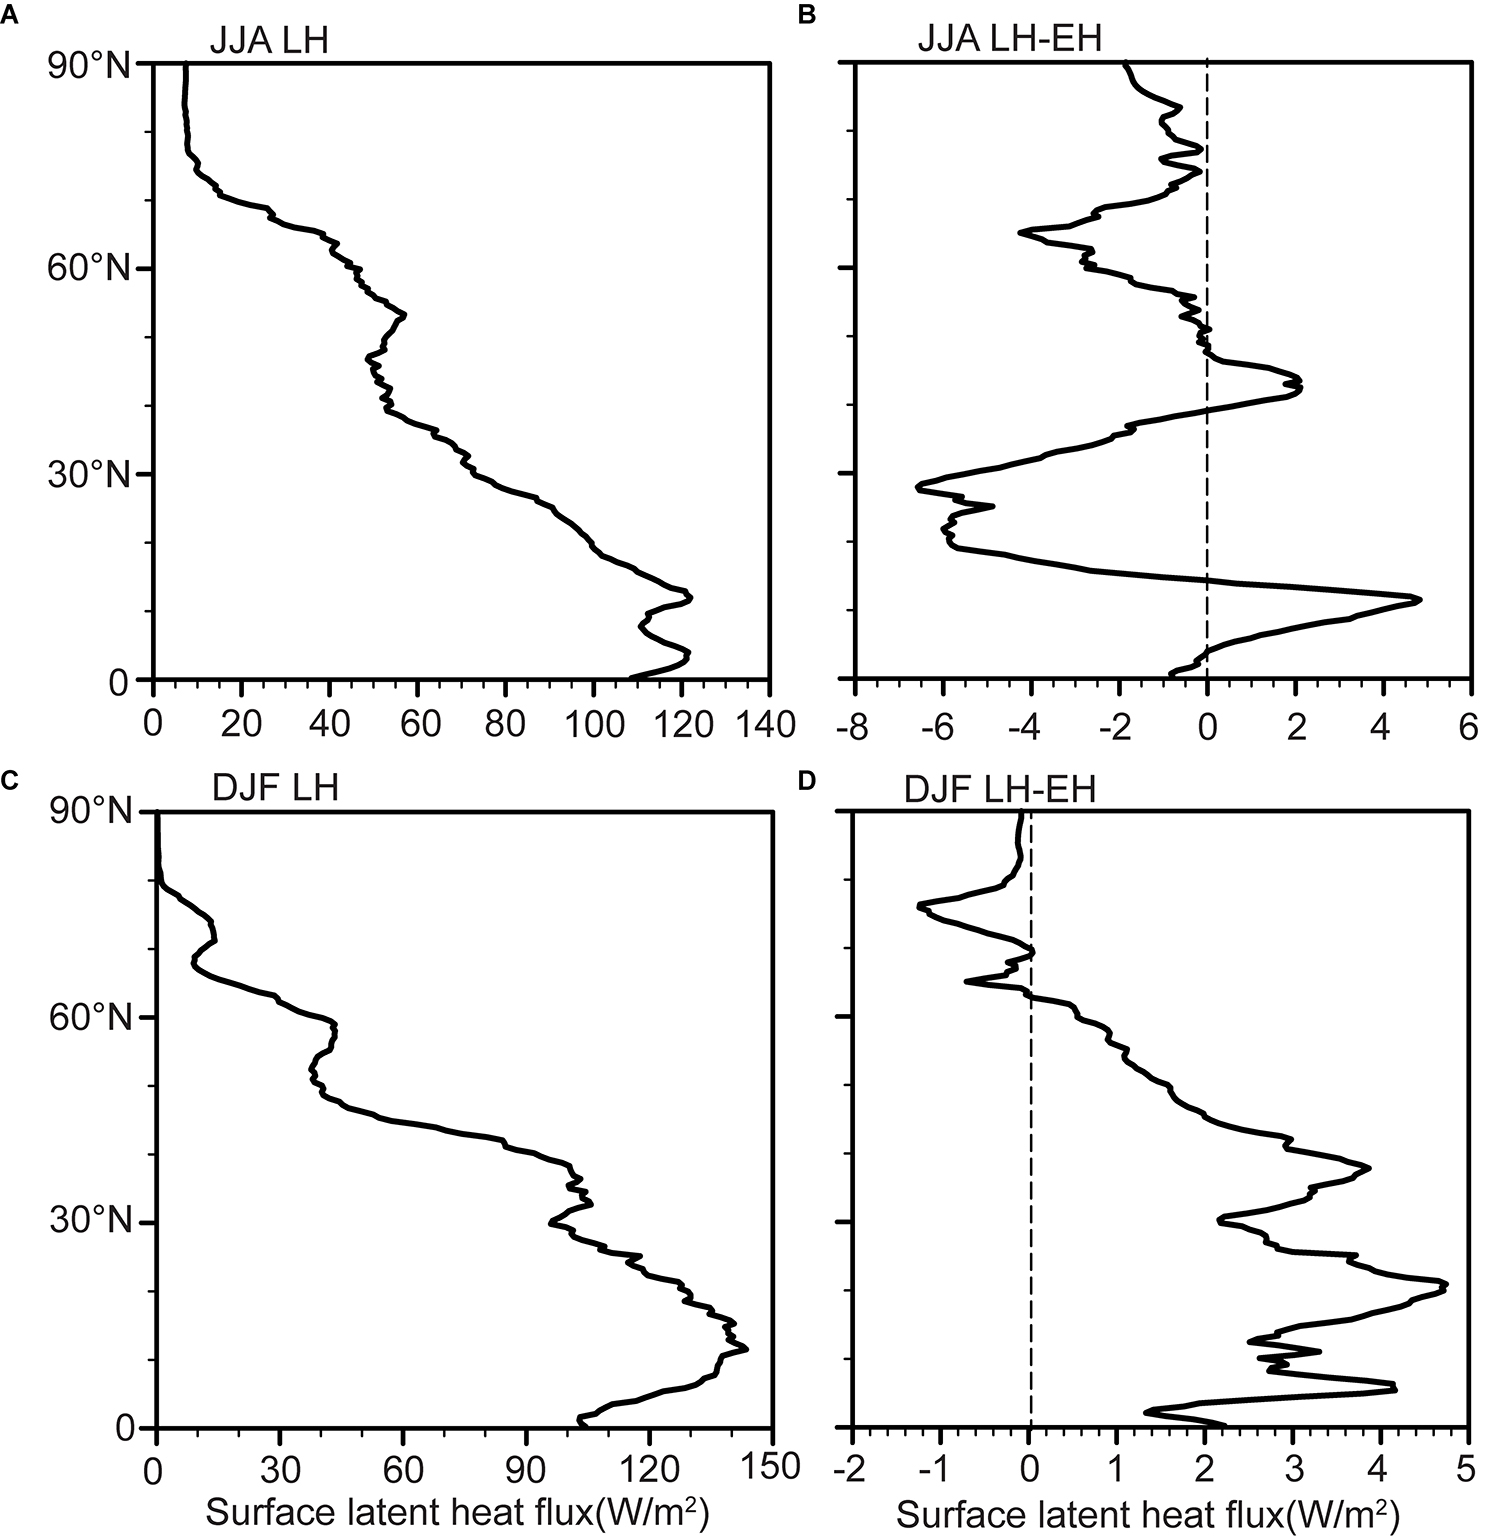
Figure 12. Zonal mean surface latent heat flux. Summer and winter surface latent heat flux in LH (A,C) and the LH-minus-EH difference (B,D).
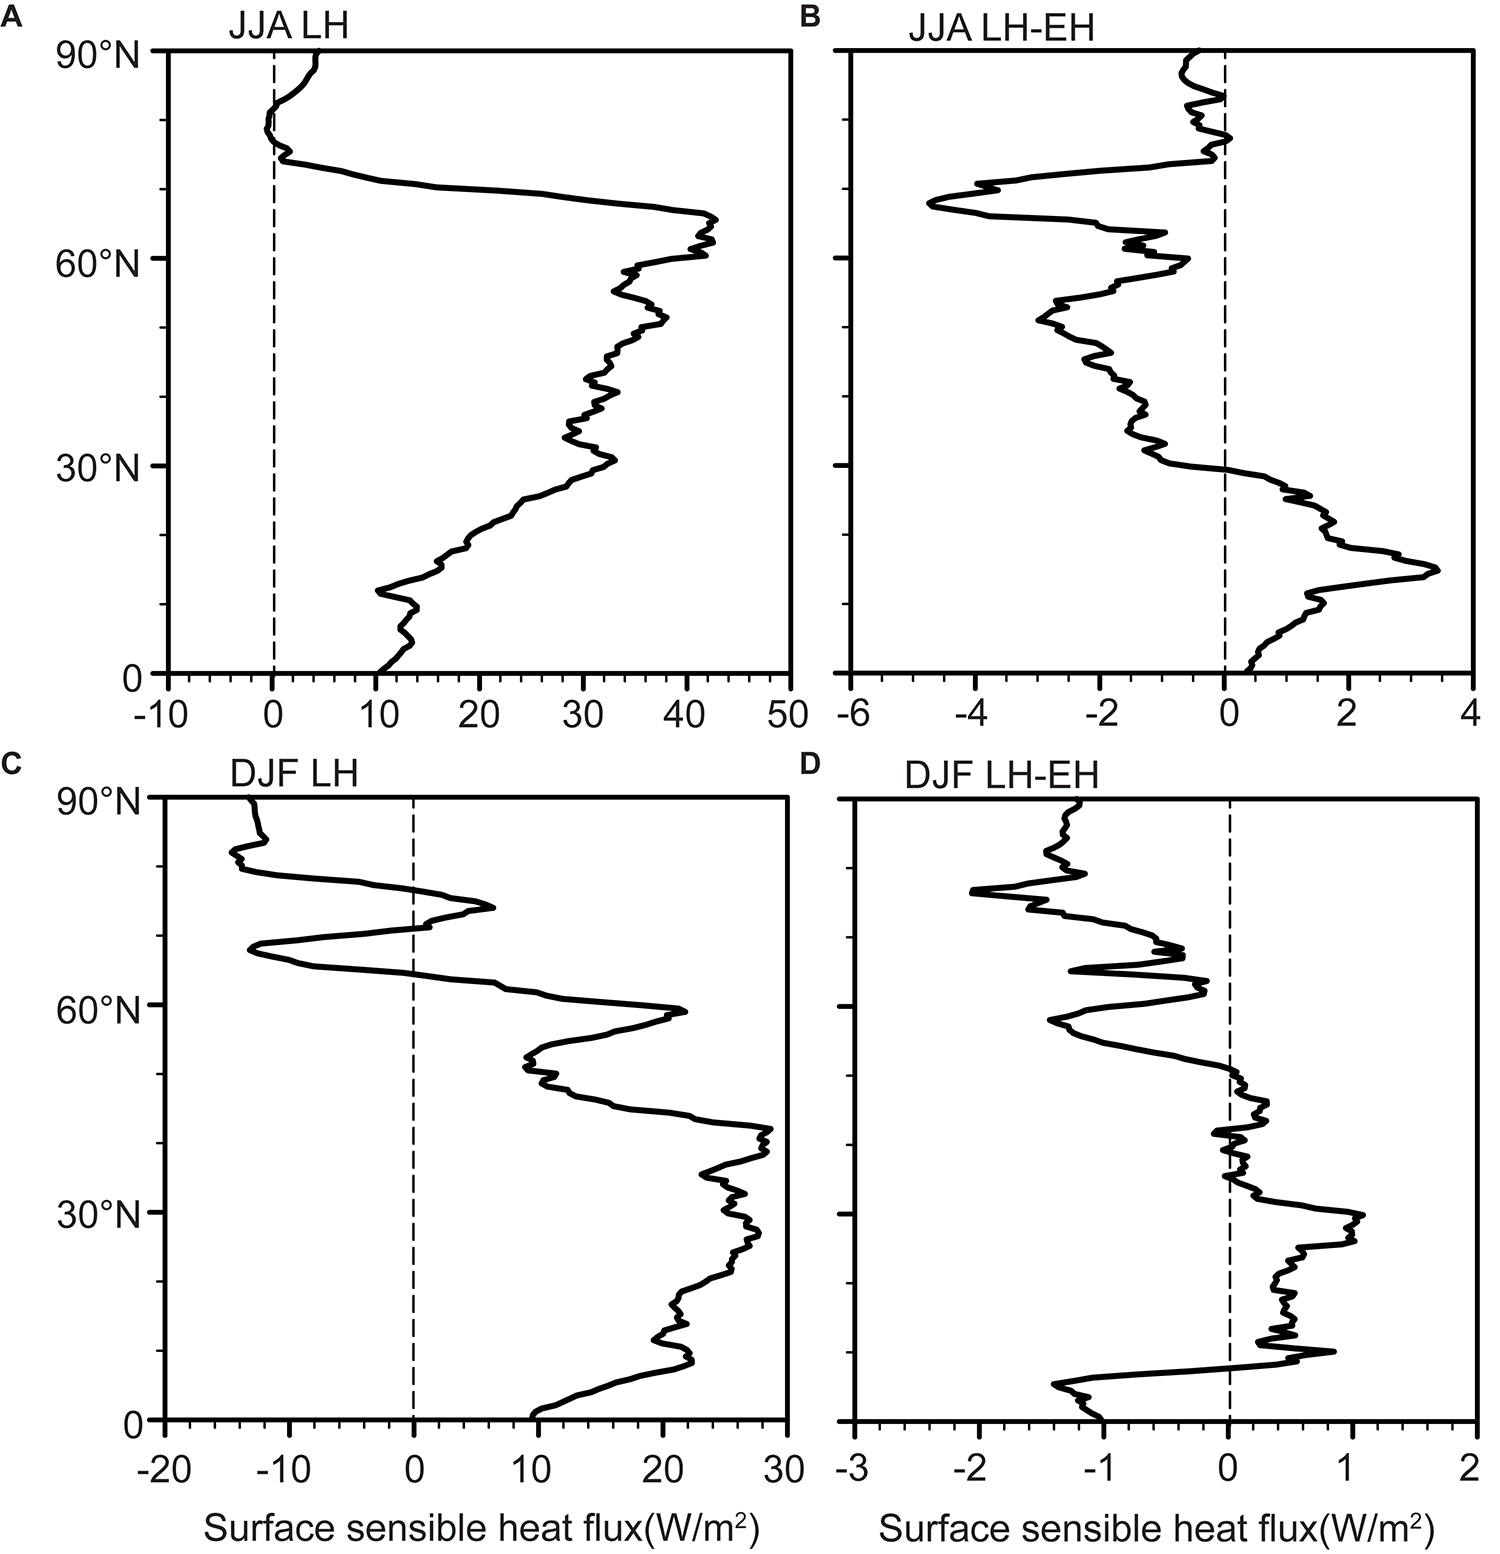
Figure 13. Zonal mean surface sensible heat flux. Summer and winter surface sensible heat flux in LH (A,C) and the LH-minus-EH difference (B,D).
Discussion
By analysis of this study, the summer WJ has experienced a substantial change both in term of intensity and position in CA, Japan, and NA. The summer WJ migrated southward and showed a strengthening trend during the Holocene. The WJ carries out a large amount of heat and water vapor from the middle and low latitude oceans to Eurasian and Northern American continents and then has a profound impact on the climate and environmental changes in those regions. It has been widely recognized that change of precipitation in northwestern China and CA during the Holocene is also closely related to the change of WJ, transporting the water vapor from North Atlantic Ocean, Mediterranean Ocean, Black Sea, and Caspian Sea (Chen et al., 2008; Jin et al., 2012; Wang et al., 2013; Huang et al., 2015; Xu et al., 2019; Zhang et al., 2020). Furthermore, as a recent study, Cai et al. (2017) have illustrated precipitation seasonality in CA, in which implies that precipitation in most of CA occurs in summer half year. Therefore, the southward and strengthened summer WJ during the Holocene probably results in an increasing trend of precipitation in CA. Indeed, a growing body of evidence, including lake sediments, loess-paleosol sequences, and peats, has revealed a generally wetting trend in the ACA during the Holocene (Wang and Feng, 2013; Hong et al., 2014; Long et al., 2014, 2017; Chen et al., 2016), which might indicate an increasing trend of WJ as simulated by our experiments. In addition to the multi-proxy records, a long-term transient simulation by another climate model, forced by changes in orbital parameters, also demonstrated a strengthening trend of WJ during the Holocene (Zhang et al., 2016), which supports that this response of WJ during Holocene is not model dependent.
Beside the climate over CA, the change of WJ has also significantly influenced on the EASM by its north–south migration (Lin and Lu, 2008; Chiang et al., 2015; Lan et al., 2020). The sway of the WJ axis is closely associated to the intensity of EASM (Nagashima et al., 2011), and consequently influence on the latitudinal location of the summer monsoon precipitation through changes in its residence time on the north and south sides of the Tibetan Plateau (Sampe and Xie, 2010; Nagashima et al., 2011; Chiang et al., 2015; Herzschuh et al., 2019). When the NH summer solar insolation decreased, the southward migration of WJ accompanied by the intensified winter monsoon and southeastward migration of summer monsoon should decrease (increase) precipitation in northern (southern) EASM area (Chiang et al., 2015). For example, based on oppositional precipitation changes during the Heinrich event 1 (H1) and Younger Dryas (YD) indicated by the ratio of trace elements and oxygen isotope in stalagmite at Haozhu Cave in the middle Yangtze River, Zhang et al. (2018) have suggested that the westerly circulation regulates the changes in precipitation in central and eastern China by affecting the length of the Meiyu period in East Asia. Our results reveal that the summer WJ also shows a southward migration during the Holocene, which means longer time stay on the southern side of the Tibetan Plateau during the Holocene. It should block the northward movement of the EASM, causing more precipitation in southern part of EASM region. Recently, Herzschuh et al. (2019) also found that the southward migration of WJ-stream axis during the Holocene was tracked by the summer monsoon rain band, resulting in a gradual southward migration of the precipitation maximum.
Conclusion
In this study, we evaluated the response of position and intensity of WJ to the astronomical insolation during the Holocene based on a high-resolution transient simulation. Our results reveal that the changes in the position and intensity of WJ in CA, Japan, and NA are broadly consistent in summer, which have experienced southward migration and strengthening trend during the Holocene. However, the changes position and intensity of winter WJ over the three regions have shown regional features, with northward migration and weakening over the CA, slightly southward migration and weakening over the Japan, and southward migration and strengthening over the NA, respectively. We therefore suggest that the WJ is primarily controlled by the surface air temperature, ultimately triggered by the surface latent heat and sensible heat flux. Further researches are necessary to understand the influences and forcing mechanisms of WJ on regional precipitation/moisture variations, especially interplays between the WJ and EASM during the Holocene, which would provide helpful information for the human-induced global warming.
Data Availability Statement
The raw data supporting the conclusions of this article will be made available by the authors, without undue reservation.
Author Contributions
PZ performed the data analyses, drew the figures, and wrote the manuscript. ZS designed the research and also joined the analyses. XL conducted the climate model experiment. All authors contributed to the discussion and improvement of the manuscript.
Funding
This work was jointly supported by the Strategic Priority Research Program of Chinese Academy of Sciences (XDB40030000) and National Natural Science Foundation of China (41690115 and 41977382). ZS also acknowledges the support of Youth Innovation Promotion Association CAS.
Conflict of Interest
The authors declare that the research was conducted in the absence of any commercial or financial relationships that could be construed as a potential conflict of interest.
References
Cai, Y., Chiang, J. C. H., Breitenbach, S. F. M., Tan, L., Cheng, H., Edwards, R. L., et al. (2017). Holocene moisture changes in western China, Central Asia, inferred from stalagmites. Quat. Sci. Rev. 158, 15–28. doi: 10.1016/j.quascirev.2016.12.014
Chen, F., Jia, J., Chen, J., Li, G., Zhang, X., Xie, H., et al. (2016). A persistent Holocene wetting trend in arid central Asia, with wettest conditions in the late Holocene, revealed by multi-proxy analyses of loess-paleosol sequences in Xinjiang, China. Quat. Sci. Rev. 146, 134–146. doi: 10.1016/j.quascirev.2016.06.002
Chen, F., Yu, Z., Yang, M., Ito, E., Wang, S., Madsen, D. B., et al. (2008). Holocene moisture evolution in arid central Asia and its out-of-phase relationship with Asian monsoon history. Quat. Sci. Rev. 27, 351–364. doi: 10.1016/j.quascirev.2007.10.017
Chiang, J. C. H., Fischer, J., Kong, W., and Herman, M. J. (2019). Intensification of the pre-meiyu rainband in the Late 21st Century. Geophys. Res. Lett. 46, 7536–7545. doi: 10.1029/2019gl083383
Chiang, J. C. H., Fung, I. Y., Wu, C.-H., Cai, Y., Edman, J. P., Liu, Y., et al. (2015). Role of seasonal transitions and westerly jets in East Asian paleoclimate. Quat. Sci. Rev. 108, 111–129. doi: 10.1016/j.quascirev.2014.11.009
Herzschuh, U., Cao, X., Laepple, T., Dallmeyer, A., Telford, R. J., Ni, J., et al. (2019). Position and orientation of the westerly jet determined Holocene rainfall patterns in China. Nat. Commun. 10:2376. doi: 10.1038/s41467-019-09866-8
Hong, B., Gasse, F., Uchida, M., Hong, Y., Leng, X., Shibata, Y., et al. (2014). Increasing summer rainfall in arid eastern-Central Asia over the past 8500 years. Sci. Rep. 4:5279. doi: 10.1038/srep05279
Huang, W., Chen, F., Feng, S., Chen, J., and Zhang, X. (2013). Interannual precipitation variations in the mid-latitude Asia and their association with large-scale atmospheric circulation. Chin. Sci. Bull. 58, 3962–3968. doi: 10.1007/s11434-013-5970-4
Huang, W., Chen, J., Zhang, X., Feng, S., and Chen, F. (2015). Definition of the core zone of the “westerlies-dominated climatic regime”, and its controlling factors during the instrumental period. Sci. China Earth Sci. 58, 676–684. doi: 10.1007/s11430-015-5057-y
Jiang, Q., Shen, J., Liu, X., Zhang, E., and Xiao, X. (2007). A high-resolution climatic change since Holocene inferred from multi-proxy of lake sediment in westerly area of China. Chin. Sci. Bull. 52, 1970–1979. doi: 10.1007/s11434-007-0245-6
Jin, L., Chen, F., Morrill, C., Otto-Bliesner, B. L., and Rosenbloom, N. (2012). Causes of early Holocene desertification in arid central Asia. Clim. Dynam. 38, 1577–1591. doi: 10.1007/s00382-011-1086-1
Kay, J. E., Deser, C., Phillips, A., Mai, A., Hannay, C., Strand, G., et al. (2015). The community Earth system model (CESM) large ensemble project: a community resource for studying climate change in the presence of internal climate variability. B. Am. Meteorol. Soc. 96, 1333–1349. doi: 10.1175/bams-d-13-00255.1
Kong, W., Swenson, L. M., and Chiang, J. C. H. (2017). Seasonal transitions and the westerly jet in the holocene East Asian summer monsoon. J. Clim. 30, 3343–3365. doi: 10.1175/jcli-d-16-0087.1
Kuang, X., and Zhang, Y. (2005). Seasonal variation of the East Asian Subtropical Westerly Jet and its association with the heating field over East Asia. Adv. Atmos. Sci. 22, 831–840. doi: 10.1007/BF02918683
Lan, J., Xu, H., Lang, Y., Yu, K., Zhou, P., Kang, S., et al. (2020). Dramatic weakening of the East Asian summer monsoon in northern China during the transition from the Medieval Warm Period to the Little Ice Age. Geology 48, 307–312. doi: 10.1130/g46811.1
Li, X., Liu, X., Qiu, L., An, Z., and Yin, Z.-Y. (2013). Transient simulation of orbital-scale precipitation variation in monsoonal East Asia and arid central Asia during the last 150 ka. J. Geophy. Res 118, 7481–7488. doi: 10.1002/jgrd.50611
Liang, X.-Z., and Wang, W.-C. (1998). Associations between China monsoon rainfall and tropospheric jets. Q. J. Roy. Meteor. Soc. 124, 2597–2623. doi: 10.1002/qj.49712455204
Lin, Z., and Lu, R. (2008). Abrupt northward jump of the East Asian upper-tropospheric jet stream in midsummer. J. Meteorol. Soc. Jpn. 86, 857–866. doi: 10.2151/jmsj.86.857
Long, H., Shen, J., Chen, J., Tsukamoto, S., Yang, L., Cheng, H., et al. (2017). Holocene moisture variations over the arid central Asia revealed by a comprehensive sand-dune record from the central Tian Shan, NW China. Quat. Sci. Rev. 174, 13–32. doi: 10.1016/j.quascirev.2017.08.024
Long, H., Shen, J., Tsukamoto, S., Chen, J., Yang, L., and Frechen, M. (2014). Dry early Holocene revealed by sand dune accumulation chronology in Bayanbulak Basin (Xinjiang, NW China). Holocene 24, 614–626. doi: 10.1177/0959683614523804
Nagashima, K., Tada, R., Matsui, H., Irino, T., Tani, A., and Toyoda, S. (2007). Orbital- and millennial-scale variations in Asian dust transport path to the Japan Sea. Palaeogeogr. Palaeoclimatol. Palaeoecol. 247, 144–161. doi: 10.1016/j.palaeo.2006.11.027
Nagashima, K., Tada, R., Tani, A., Sun, Y., Isozaki, Y., Toyoda, S., et al. (2011). Millennial-scale oscillations of the westerly jet path during the last glacial period. J. Asian Earth. Sci. 40, 1214–1220. doi: 10.1016/j.jseaes.2010.08.010
Nagashima, K., Tada, R., and Toyoda, S. (2013). Westerly jet-East Asian summer monsoon connection during the Holocene. Geochem. Geophys. Geosyst. 14, 5041–5053. doi: 10.1002/2013gc004931
Sampe, T., and Xie, S.-P. (2010). Large-scale dynamics of the meiyu-baiu rainband: environmental forcing by the westerly jet. J. Clim. 23, 113–134. doi: 10.1175/2009jcli3128.1
Schiemann, R., Lüthi, D., and Schär, C. (2009). Seasonality and interannual variability of the westerly jet in the tibetan plateau region. J. Clim. 22, 2940–2957. doi: 10.1175/2008jcli2625.1
Shi, Z. (2016). Response of Asian summer monsoon duration to orbital forcing under glacial and interglacial conditions: implication for precipitation variability in geological records. Quat. Sci. Rev. 139, 30–42. doi: 10.1016/j.quascirev.2016.03.008
Shi, Z., Liu, X., and Cheng, X. (2012). Anti-phased response of northern and southern East Asian summer precipitation to ENSO modulation of orbital forcing. Quat. Sci. Rev. 40, 30–38. doi: 10.1016/j.quascirev.2012.02.019
Shi, Z., Liu, X., Liu, Y., Sha, Y., and Xu, T. (2015). Impact of mongolian plateau versus tibetan plateau on the westerly jet over North Pacific Ocean. Clim. Dyn. 44, 3067–3076. doi: 10.1007/s00382-014-2217-2
Sung, M.-K., Kwon, W.-T., Baek, H.-J., Boo, K.-O., Lim, G.-H., and Kug, J.-S. (2006). A possible impact of the North Atlantic Oscillation on the east Asian summer monsoon precipitation. Geophys. Res. Lett. 33:L21713. doi: 10.1029/2006gl027253
Wang, W., and Feng, Z. (2013). Holocene moisture evolution across the Mongolian Plateau and its surrounding areas: a synthesis of climatic records. Earth Sci. Rev. 122, 38–57. doi: 10.1016/j.earscirev.2013.03.005
Wang, W., Feng, Z., Ran, M., and Zhang, C. (2013). Holocene climate and vegetation changes inferred from pollen records of Lake Aibi, northern Xinjiang, China: a potential contribution to understanding of Holocene climate pattern in East-central Asia. Quat. Int. 311, 54–62. doi: 10.1016/j.quaint.2013.07.034
Wei, W., Zhang, R., Wen, M., and Yang, S. (2017). Relationship between the Asian westerly jet stream and summer rainfall over Central Asia and North China: roles of the indian monsoon and the South Asian High. J. Clim. 30, 537–552. doi: 10.1175/jcli-d-15-0814.1
Xu, H., Zhou, K., Lan, J., Zhang, G., and Zhou, X. (2019). Arid Central Asia saw mid-Holocene drought. Geology 47, 255–258. doi: 10.1130/g45686.1
Yang, S., Lau, K.-M., and Kim, K.-M. (2002). Variations of the East Asian jet stream and Asian–Pacific–American winter climate anomalies. J. Clim. 15, 306–325.
Zhang, D., Chen, X., Li, Y., Wang, W., Sun, A., Yang, Y., et al. (2020). Response of vegetation to Holocene evolution of westerlies in the Asian Central Arid Zone. Quat. Sci. Rev. 229:106138. doi: 10.1016/j.quascirev.2019.106138
Zhang, H., Griffiths, M. L., Chiang, J. C. H., Kong, W., Wu, S., Atwood, A., et al. (2018). East Asian hydroclimate modulated by the position of the westerlies during Termination I. Science 362, 580–583. doi: 10.1126/science.aat9393
Zhang, X., Jin, L., Chen, J., Chen, F., Park, W., Schneider, B., et al. (2017). Detecting the relationship between moisture changes in arid central Asia and East Asia during the Holocene by model-proxy comparison. Quat. Sci. Rev. 176, 36–50. doi: 10.1016/j.quascirev.2017.09.012
Zhang, X., Jin, L., Huang, W., and Chen, F. (2016). Forcing mechanisms of orbital-scale changes in winter rainfall over northwestern China during the Holocene. Holocene 26, 549–555. doi: 10.1177/0959683615612569
Keywords: westerly jet, insolation, Holocene, Asia, climate model
Citation: Zhou P, Shi Z, Li X and Zhou W (2020) Response of Westerly Jet Over the Northern Hemisphere to Astronomical Insolation During the Holocene. Front. Earth Sci. 8:282. doi: 10.3389/feart.2020.00282
Received: 10 April 2020; Accepted: 18 June 2020;
Published: 23 July 2020.
Edited by:
Hai Xu, Tianjin University, ChinaReviewed by:
Li Wu, Anhui Normal University, ChinaJun Cheng, Nanjing University of Information Science and Technology, China
Copyright © 2020 Zhou, Shi, Li and Zhou. This is an open-access article distributed under the terms of the Creative Commons Attribution License (CC BY). The use, distribution or reproduction in other forums is permitted, provided the original author(s) and the copyright owner(s) are credited and that the original publication in this journal is cited, in accordance with accepted academic practice. No use, distribution or reproduction is permitted which does not comply with these terms.
*Correspondence: Zhengguo Shi, shizg@ieecas.cn