The Debris Flow Occurred at Ru Secco Creek, Venetian Dolomites, on 4 August 2015: Analysis of the Phenomenon, Its Characteristics and Reproduction by Models
 Carlo Gregoretti
 Massimo Degetto
 Martino Bernard
 Mauro Boreggio
- Department Land Environment Agriculture and Forestry, University of Padova, Legnaro, Italy
On 4 August 2015, a very high intensity storm, 31.5 mm in 20 min (94.5 mm/h), hit the massif of Mount Antelao on the Venetian Dolomites triggering three stony debris flows characterized by high magnitude. Two of them occurred in the historical sites of Rovina di Cancia and Rudan Creek and were stopped by the retaining works upstream the inhabited areas, while the third routed along the Ru Secco Creek and progressively reached the resort area and the village of San Vito di Cadore, causing fatalities and damages. The main triggering factor of the Ru Secco debris flow was a large rock collapse on the northern cliffs of Mount Antelao occurred the previous autumn. The fallen debris material deposited on the Vallon d'Antrimoia inclined plateau at the base of the collapsed cliffs and, below it, on the Ru Salvela Creek, covering it from the head to the confluence with the Ru Secco Creek. The abundant runoff, caused by the high intensity rainfall on 4 August 2015, entrained about 52,500 m3 of the debris material laying on the Vallon d'Antrimoia forming a debris flow surge that hit and eroded the debris deposit covering the downstream Ru Salvela Creek, increasing its volume, about 110,000 m3 of mobilized sediments. This debris flow routed downstream the confluence, flooding the parking of a resort area where three people died, and reached the village downstream damaging some buildings. A geomorphological analysis was initially carried out after surveying the whole basin. All liquid and solid-liquid contributions to the phenomenon were recognized together with the areas subjected to erosion and deposition. The elaboration of pre and post-event topographical surveys provided the map of deposition-erosion depths. Using the rainfall estimated by weather radar and corrected by the nearest rain gauge, about 0.8 km far, we estimated runoff by using a rainfall-runoff model designed for the headwater rocky basins of Dolomites. A triggering model provided the debris flow hydrographs in the initiation areas, after using the simulated runoff. The initial solid-liquid surge hydrographs were, then, routed downstream by means of a cell model. The comparison between the simulated and estimated deposition-erosion pattern resulted satisfactory. The results of the simulation captured, in fact, the main features of the occurred phenomenon.
1. Introduction
The Boite Valley in Venetian Dolomites (Northestern Italian Alps) was affected by several runoff generated debris flows during the summer of 2015 (Baglioni and De Marco, 2015). The evening of 4 August a high intensity storm hit the top area of the Monte Antelao massif and caused three stony debris flows of high magnitudo on the sites, South to North of Rio Rudan Creek, Rovina di Cancia channel and Ru Secco Creek (Figure 1). The first two sites are periodically affected by debris flows (Gregoretti and Dalla Fontana, 2008) and are defended by a check dam and some retaining basins respectively that reduced and stopped the solid part of the solid-liquid waves. Ru Secco Creek just experienced its first debris flow since 1950s and was without any defense. Consequently, the debris flow flooded from it causing three deaths in the parking of a resort area and partially damaging some buildings of the village of San Vito di Cadore downstream. The runoff generated debris flows are very common in the Boite Valley (Berti and Simoni, 2005; Gregoretti and Dalla Fontana, 2008) as elsewhere on Alps (Theule et al., 2012; Navratil et al., 2013; Tiranti and Deangeli, 2015; Destro et al., 2018) and worldwide (Imaizumi et al., 2006; Cannon et al., 2008; Coe et al., 2008; Okano et al., 2012; Kean et al., 2013; Hurlimann et al., 2014; Hu et al., 2016). These phenomena, increased in number due to the climate change, are among the most dangerous natural hazards for human settlements in the Boite Valley since the last two centuries. According to Mattea et al. (2016), Thiene et al. (2017) and Stancanelli et al. (2017), they could have a strong socio-economic impact. The aim of the present research is the study of this debris flow event by means of pre and post-event topographical data, post-event direct surveys and its reproduction by modeling the physical processes associated to its occurrence. Multi-temporal topographical data and direct post-event surveys are important for identifying the phenomenon and its characteristics. The phenomenon reconstruction through models is also important, because it shows the evolution of the event. In addition, it is a reliability test of the models. Models, in fact, can play a crucial role in hazard assessment and in risk analysis, and, only the use of models satisfactorily tested against field data can provide reliable results. Consequently, we propose the use of a methodology for simulating the cascade of the physical processes that origin a debris flow phenomenon by models. After the debris flow occurrence, all the areas surrounding the Ru Secco Creek were carefully surveyed with the scope of identifying the development of the phenomenon and its characteristics. This field survey gave the general view of all the single phenomena that contributed to the formation and routing of the solid-liquid surge along the Ru Secco Creek. All the areas that provided solid-liquid or liquid flows were identified with the corresponding watersheds. These results were used for identifying the watersheds where modeling runoff and solid-liquid hydrographs as well the debris flow routing. After building the DEMs of all the contributing watersheds, needed for the hydrological simulations, pre and post-event topographical data were used for building the pre and post-event DEMs of the area affected by the occurred debris flow. The difference between the pre and post-event DEMs provided the map of the deposition-erosion depths and the total sediment volume mobilized during the event. The result of field surveys and analysis of this map showed the main features of the occurred phenomenon. Rainfalls on the contributing watershed were obtained through radar estimates corrected by rainfall depths measurements given by a rain gauge placed at the base of the southern rock walls of Mount Antelao, in the contiguous basin of Rovina di Cancia at an altitude of about 2,150 m a.s.l. (Figure 1). Runoff hydrographs were, then, modeled by the rainfall-runoff model proposed by Gregoretti et al. (2016a) for headwater rocky basins while the solid-liquid hydrographs were modeled extending the method proposed by Gregoretti et al. (2016b). Finally, we used an updated version of the GIS-based cell model of Gregoretti et al. (2016b) that ensures a fully bi-phase routing for modeling the debris flow propagation downstream the initiation areas. This updated version, proposed by Gregoretti et al. (2018), allows a better simulation of the entrainment processes that have a crucial role in the estimation of the sediment volume transported by a debris flow that is needed for an efficient hazard assessment. The transported sediment volume, in fact, influences the extension and height of the inundation (Iverson et al., 1998; Rickenmann, 1999; Santi et al., 2008; Reid et al., 2016), that are decisive to evaluate the impact of debris flow. The comparison between the simulation results with the deposition-erosion depth map accounts for the reliability of the phenomenon reconstruction, that is the capturing of its main features.
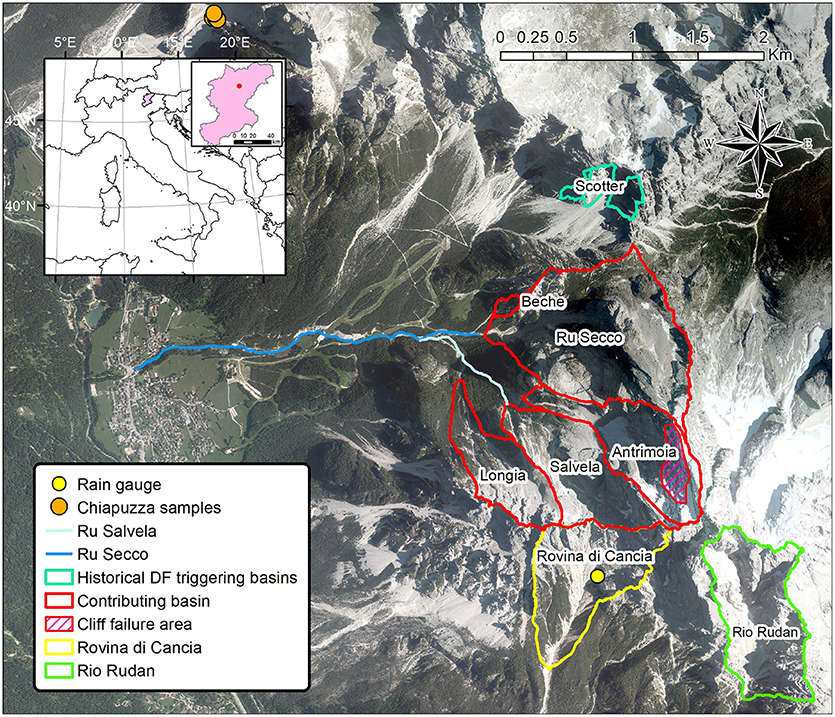
Figure 1. Aerial view of whole area with the contributing hydrological basins and the basins of Rovina di Cancia and Rudan.
The remainder of this paper is organized as follows. Section 2 describes the materials and methods, divided in four sub-sections concerning: the study site of Ru Secco Creek with the big rock fall occurred on November 2014, the topographical data and the set up of pre and post-event DEMs, the correction of the radar rainfalls estimates and the models used for the simulations. The field surveys and the geomorphical analysis of the occurred phenomena are presented in section 3, while section 4 shows the reconstruction of the phenomenon by models. Section 5 discusses the results and, finally, section 6 reports the conclusions.
2. Materials and Methods
2.1. The Study Site and the Rock Fall Occurred on 14 November 2014
The storm event of the 4 August 2015 hit all the areas contributing to Ru Secco Creek. Figure 1 shows the plan view of the sub-basins that provided runoff and the routing paths. Figure 2 shows a frontal view of the upper part of the study area, where the arrows point the path of the liquid and solid-liquid contributions to the whole phenomenon. Ru Secco Creek origins downstream Forcella Piccola Fork and following a quasi straight route reaches the bottom of the Boite Valley where it crosses the village of San Vito di Cadore and flows into the Boite river. It initially flows between two rocky walls and after a drop, it runs on the bottom of the valley between the northern rocky slopes of Mount Antelao, where Ru Salvela Creek origins (Figure 1), and the slopes starting at the feet of the rocky massif between Bel Pra and Scotter tops along Northwest-Southeast direction. Along its route, downstream the drop, Ru Beche and Ru Salvela Creeks join it on the right and left side (Figure 3a) respectively. About 800 m downstream the second confluences, the Ru Secco Creek is culverted to allow the joining of a slope ski on the right side with a chairlift located on the left side of the creek (Figure 3b). In the reach from a location about 300 m upstream the culvert to the inhabitated of San Vito di Cadore, the bed of the Ru Secco creek is protected by a series of check dams. At the entrance of the inhabitated of San Vito di Cadore the Ru Secco is again culverted, and after the exit, it flows into the Boite river. This area, located in the Venetian Dolomites, is dominated by carbonatic Platform formations. The rocky massifs are formed of a thick succession of the calcareous “‘Dolomia Principale” Formation with overlaying limestones of the “Calcari Grigi” Formation. The night of 12 November 2014 a cliff failure on the northern side of Mount Antelao (Figures 1, 4) caused a large rock fall that part deposited on the rocky sloping surface of Vallon d'Antrimoia at the base of the collapsed cliffs and part traveled downstream along the Ru Salvela Creek. It reached the confluence with the Ru Secco Creek and stopped just a hundred meters downstream. All the Ru Salvela Creek, and the Ru Secco Creek from the confluence to a hundred meters downstream, were covered by a thick layer of debris material. In Figures 3a, 4 the debris thick layer covering the Ru Salvela and Ru Secco Creeks (about 175,000 m3 according to the computations of section 3). Starting from the Ru Secco Creek, debris material began to be removed: Figure 3a shows the situation about 1 month before the occurrence of the debris flow event with the works for reducing the large debris deposits on the Ru Salvela Creek.
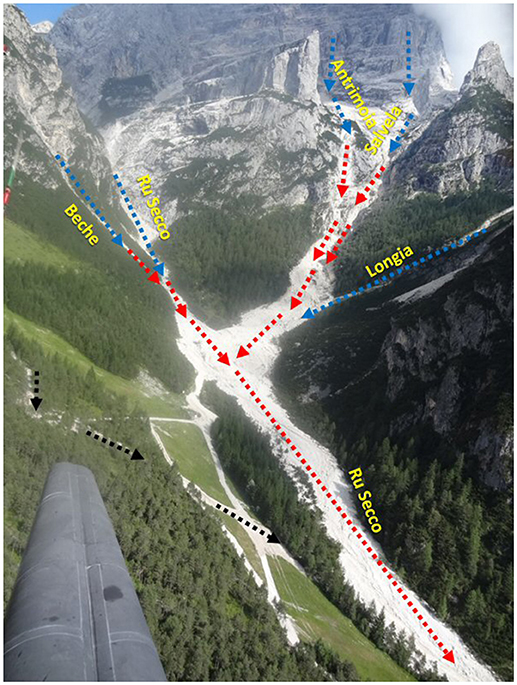
Figure 2. Frontal view of the upper basins that contributed to the phenomenon. The blue arrows show the runoff routing, the red arrows the debris flow starting locations and its routing, and the black arrows the path of the debris flow on the right slope, that did not contribute significatively to solid-liquid wave routing along Ru Secco (flight of 5 August 2015).
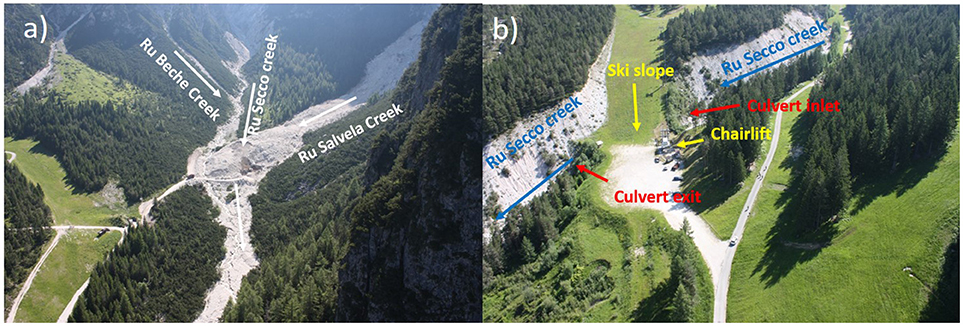
Figure 3. Pre-event images: view of the large debris deposits covering the Ru Salvela and Ru Secco creeks during their removal (flight of 1 July 2015) (a) and the culverting of the Ru Secco in correspondence with the ski resort area (b).
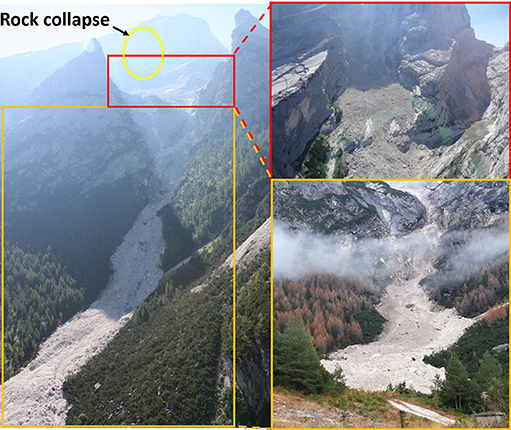
Figure 4. View of the collapsed cliff on the northwestern side of the Mount Antelao (flight of 1 July 2015) and the deposits of debris material from the base of the collapsed cliff to just upstream the confluence with Ru Secco creek. Top right insert shows the debris material covering the Vallon d'Antermoia rocky surface at the base of the collapsed cliff (flight of 1 July 2015). Bottom right insert shows the Ru Salvela creek covered by debris material till the confluence with Ru Secco creek that was obstructed (picture taken on November 2014).
About the characteristics of sediments forming the debris deposits that were eroded by runoff and debris flows, we can refer to the grain size analysis carried out through the frequency-by-weight method, on five samples taken on the channelized initiation area of Chiapuzza debris flow (about 1 km north) located on the scree of Cadino dei Ross formed by the rocks collapsed from the overhanging rocky walls of Punta Ross Top. Both the debris deposits on the sites of Vallon d'Antrimoia-Ru Salvela Creek and Cadin dei Ross formed for the collapse of the overhanging rocky cliffs with the same geological Formations. For these reasons, the properties and the characteristics of the debris material are assumed to be quite the same. The five samples of material have a composition ranging in the following intervals for each type of soil: 4% silt (0.002 ≤ d < 0.063 mm), 33–50% sand (0.063 ≤ d < 2 mm), 48–58% gravel (2 ≤ d < 63 mm), and 1–3% cobbles (63 ≤ d < 200 mm), with a mean density of 2.62 kg/m3 and a solid volumetric concentration of 0.73. The static friction angle, 39°, was also estimated through triaxial tests.
2.2. Topographical Data
Topographical data are given by two LiDARs flights held on November 2011 and 2015, the photogrammetric restitution of photos of the large debris deposit taken 1 month before the event, a drone photogrammetric flight held 2 days after the event and direct GPS survey held about 2 months after the event. Figure 5 gives a schematic view of the cover provided by the different topographical data. The pre-event Digital Elevation Model (DEM) is built by using the LiDAR 2011 for all the areas but the debris deposit covering the Ru Salvela Creek till the confluence with Ru Secco Creek where photogrammetric points provided by photos elaboration, are used. The post-event DEM is built using the GPS points, the drone photogrammetric points and for the areas uncovered by this flight the LiDAR 2015. GPS points corresponding to the check dams are also used for the pre-event DEM because they remained substantially unchanged. The DEMs for the hydrological simulations of the basins depicted in Figure 1 were built by using the LiDAR 2015. LiDAR 2011, in fact, does not cover the upper part of the basins that in part changed after the cliff failure of November 2014, and, the DEMs derived by points along the contour lines of the Regional Techinical Map are characterized by a poor accuracy that could cause a noticeable underestimation of the simulated peak discharge (Degetto et al., 2015). Therefore, as only a part of the surface of the Vallon d'Antrimoia changed after the event due to the erosion, with no significative influence on the hydrological simulation, we used the LiDAR 2015. Density points of the LiDAR 2011 survey is about 1.2 pts/m2 while that of LiDAR 2015 is about 1.5 pts/m2. Points provided by the drone flight have a larger density, about 30 pts/m2. The photogrammetric restitution through the photos relative to the Ru Salvela Creek after the rock fall of November 2014 and before the debris flow event (one is that shown in Figure 3a), was carried out by using the software 3DF Zephyr (Lo Brutto and Meli, 2013).
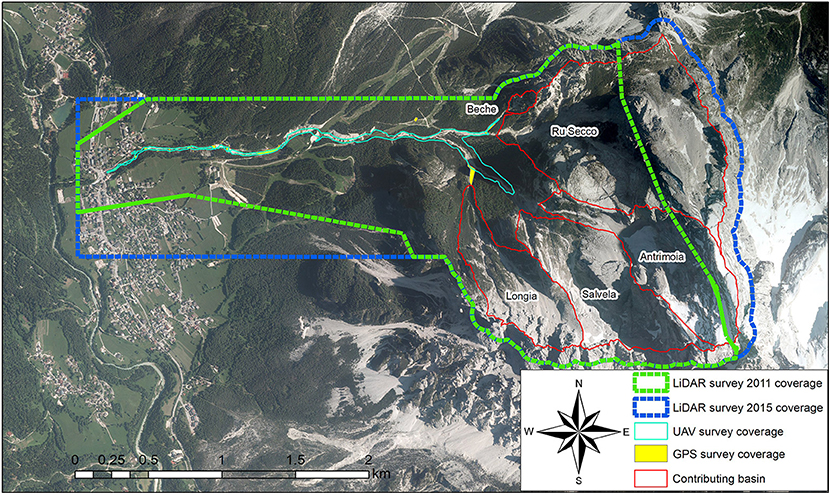
Figure 5. Schematic view of the cover of the topographical data.
Usually, the accuracy assessment of DEMs is carried out through independent topographic survey points called checkpoints, which should be at least three times more accurate than the DEM elevations being evaluated (Höhle and Höhle, 2009). Unfortunately, an unchanged and significative area, where independent ground control points could be taken, was not available because of the restoration works. This hampered the possibility to perform an extensive vertical accuracy assessment of each employed topographic dataset in a common area. About LiDAR2015 an extensive vertical accuracy assessment was performed using independent Real Time Kinematic GPS measurements, acquired according to a cross-sections morphological-guided spatial sampling scheme along the upper part of the Rovina di Cancia channel on November 2015 (Boreggio et al., 2018). The median of the errors was equal to 0.020 m, and it represents the systematic vertical shift between LiDAR point cloud and the GPS validation data. Conversely, the robust standard deviation of the errors (i.e., the Normalized Median of Absolute Errors) was equal to 0.237 m, which corresponds to the random error component of the LiDAR dataset. More details are in Boreggio et al. (2018). About “photogrammetric points” and “drone points,” on some small areas of the Ru Salvela Creek that remained unchanged during the debris flow event we compared the two points data sets. It resulted a nearly good agreement with average differences of about 0.1 m and the largest of 0.4 m.
2.3. The Precipitation
The rainfall on the five basins depicted in Figure 1 that mainly contributed to the event was obtained after the correction of weather radar estimates with the data of the rain gauge of the monitoring and alarm system installed on the Rovina di Cancia channel by the Province of Belluno. This rain gauge is located at the base of the southeastern cliffs of the Monte Antelao group, at an altitude of 2,150 m a.s.l. and is about 0.8 km far from the centroids of the Salvela and Antrimoia hydrological basins (Figure 1). Figure 6 shows the rainfall depths sampled at 5 min by the rain gauge with those of the corrected radar estimates for each of the five considered hydrological basins. On average the observed rainfall depths are just a slightly smaller than those given by the radar corrected estimates. The core of the precipitation that caused the larger quantity of runoff lasted 20 min and ranged in a 31.5–36.2 mm interval for all the five basins. The corresponding mean intensity values ranged between 94.5 and 108.6 mm/h, while the largest intensity values corresponding to the depth in 5 min, between 118.8 and 159.6 mm/h. This very high intensity and short duration rainfall is a typical precipitation causing the runoff generated debris flows that occur along the Boite valley (Bacchini and Zannoni, 2003; Berti and Simoni, 2005; Gregoretti and Dalla Fontana, 2007).
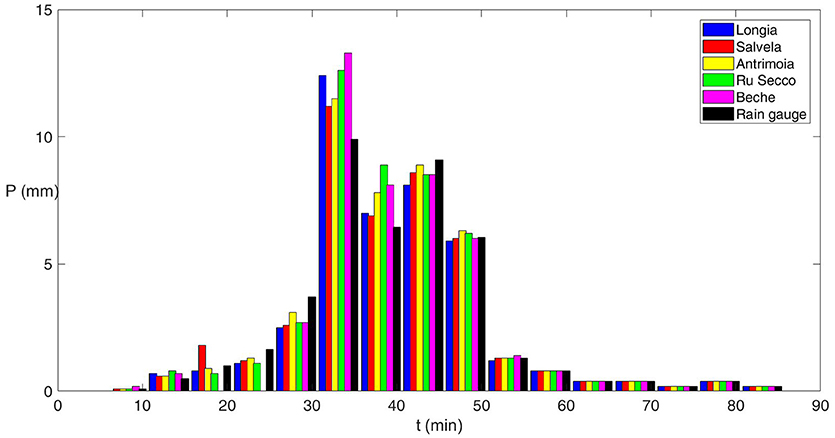
Figure 6. Hyetograph of the rainfall depths from the rain gauge and the corrected radar estimates.
2.4. The Models
In this section, the models used for modeling rainfall-runoff and debris flow routing are presented.
2.4.1. Hydrological Modeling
The hydrological model used in the present study was proposed for headwater rocky catchments by Gregoretti et al. (2016a), after directly testing it by runoff discharge measurements at the outlet of a rocky channel incised on the cliffs of the Dimai Peak (14 km far from Ru Secco Creek), and also indirectly by the debris flow/runoff transit in the initiation area of two other dolomitic catchments, the Acquabona and Rovina di Cancia basins according to Rengers et al. (2016). The centroids of these basins are 8 and 1 km far from the Antrimoia hydrological basin centroid respectively. All these catchments belong to the same geological context and have very similar morphological features.
The excess rainfall Pe contributing to the runoff discharge is computed by coupling the SCS-CN method with a simplified Horton equation that assumes a constant infiltration rate fc. At each time step t, Pe is given by:
where Ia is the initial abstraction, tIa is the time within Ia occurs, Ia = 0.2S, S is the potential maximum retention (S = 1000/CN − 10), I is the mean rainfall intensity during the time step Δt, and PeSCS is the excess rainfall of the total precipitation determined through the SCN-CN method. The empirical parameter CN depends on the type, use, and antecedent moisture condition (AMC) of the terrain. Three AMCs are assumed: I, dry condition; AMC II, standard condition; AMC III, wet condition. Following Gregoretti et al. (2016a) for mountain watersheds Ia = 0.1S while Bernard (2018), after examining a larger number of runoff events, diminishes to 2 days the previous rainfall depth for determining the antecedent moisture conditions (AMC). Excess rainfall is conveyed to the channel network along the steepest direction, with a constant value of runoff velocity U, that varies with the terrain typology. The contributes to the channel network are routed to the outlet of the basin using the matched diffusivity kinematic-wave model proposed by Orlandini and Rosso (1996), providing the liquid hydrograph.
2.4.2. The GIS-Based Cell Model
The routing model here introduced is the bi-phase version of the GIS-based cell model proposed by Gregoretti et al. (2016b) that provides a better simulation of the entrainment process (Gregoretti et al., 2018). The governing flow equations are those of mass and momentum conservation coupled with the Exner equation and a modified version of the empirical law of Egashira and Ashida (1987) to express the rate of change of the bed elevations. The mass conservation is stated by means of the continuity equations of the mixture and of the solid phase, while the momentum conservation by means of simplified motion equations of the mixture after assuming equal velocities for both the solid and liquid phases according to Rosatti and Begnudelli (2013). The flow pattern is discretized by the square cells of the DEM. At the cell scale, the continuity equations read:
where A is the area of the cell, t is time, z is the bottom elevation, h is the flow depth, c is the sediment volumetric concentration of the mixture, c* is the solid volumetric concentration of the dry bed, and Qk is the discharge exchanged with the surrounding cells along the k − th direction (Figure 7a), assumed to be positive if outflowing and negative otherwise. Following the kinematic wave approach, a uniform flow equation is locally applied if the flow occurs along positive slopes while a broad-crested weir equation is considered if the flow occurs along adverse slopes (Figure 7b). The discharges are expressed by the following relationships:
where Δx is the cell size (= A0.5), θk is the angle formed with the horizontal by the line joining the center of the considered cell with that of the k − th adjacent cell, C is the conductance coefficient (Tsubaki, 1972), and Cq is a discharge coefficient, assumed equal to that of the water (0.385) because of the missing of experimental observations. The two weighting functions wk and sk are introduced for partitioning the flow along the eight (n + m ≤ 8) different directions issuing from a given cell to the adjacent cells, provided that the corresponding bed (θk) and flow surface (h − zk) drops are positive.
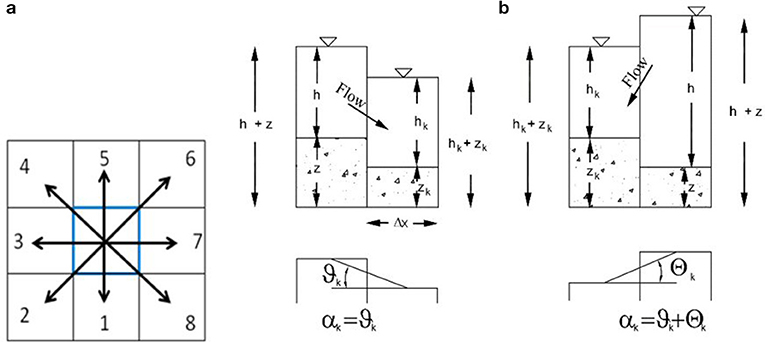
Figure 7. The eight possible flow directions (a) and the two possible flow conditions of the routing model (b); partial redrawing of the Figures 1 and 2 of Gregoretti et al. (2016b).
The choice of the kinematic approach, also used by Lenzi et al. (2003), is justified by the analysis of Arattano and Savage (1994), and Di Cristo et al. (2014) for which a kinematic model can provide reliable simulations of debris flow propagation along sloping channels. The uniform flow Equation (4) can be straightforwardly derived by integrating along the flow depth the dispersive normal stress given by Bagnold (1954), typical of a grain-collision dominated rheology that rules the stony debris flows dynamics (Takahashi, 2007). The use of such a law (i.e., the assumption of grain-inertial rheology) is here justified by the absence of clay and the poor percentages of silt in the material sampled in the initiation areas of the neighboring areas of Chiapuzza (see section 2.1) and Rovina di Cancia (Gregoretti et al., 2018), that have nearly the same characteristics of that eroded on Vallon d'Antrimoia and Ru Salvela Creek. Takahashi (2007) provided also an expression for the conductance coefficient C, depending on an empirical constant that can vary on a large interval, and consequently C up to ten times (Gregoretti, 2000; Takahashi, 2007; Armanini et al., 2009). Therefore, it should be calibrated against field measurements. The Exner equation:
provides the rate of change of the cell elevation by the difference between the deposition (D) and erosion (E) rates. This difference is modeled modifying the empirical relationship of Egashira and Ashida (1987) (see also Brufau et al., 2000; Egashira et al., 2001):
where K is an empirical constant, ranging between 0 and 1, αk = θk in the case of the uniform flow described by Equation (4), and αk = Θk + θk in the case of the weir flow associated with Equation (5), with Θk the angle that the horizontal forms with the line joining the center of the flow surface of the considered cells along which the flow is directed (Figure 7b). Erosion and deposition are computed along the steepest direction, where the maximum value Vmax of the mean velocities contributing to the discharges Qk is attained. In particular, deposition occurs if Vmax < VLIM and αk < θLIM, while erosion requires that Vmax > VLIM and αk > θLIM. The limiting values VLIM and θLIM are different for deposition (VLIM−D, θLIM−D) and erosion (VLIM−E, θLIM−E). Note that, considering a generic direction transversal to the steepest direction could lead to unrealistically large depositions. Furthermore, a cell could be subjected to both erosion and deposition at the same time.
In addition three more conditions descending from the debris flow physics are imposed. Erosion is computed only if dh/dt > 0 because according to the field observations of Berger et al. (2011) erosion generally occurs during the passage of the debris flow front, and starts before the maximum value of the flow depth is reached. Moreover, erosion cannot indefinitely occur (i.e., sediment concentration tending to unity) and is allowed within a given cell if c < 0.9c*, maximum transport concentration value according to Takahashi (2007). Likewise deposition can take place if c > cD.
The limiting concentration for deposition, cD = 0.05, is introduced to prevent c from becoming negative if large deposition rates occur, even though no substantial quantitative differences have been observed by setting cD = 0.
The original law of Egashira and Ashida (1987) was adapted after eliminating the reasons for the equilibrium angle because it can lead to uncorrect results. In Gregoretti et al. (2016b) more details about it with its physical justification. Please note that also Hussin et al. (2012) use, even if more simplified, a similar approach to estimate the bed deposition/entrainment rate.
An explicit scheme is used to solve numerically the model equations with the time step computed according to the Courant-Friedrichs-Lewy stability condition. Flow discharges and the rate of change bed elevation are computed for each cell by Equations (4–7) and used in Equation (2) to provide the flow depth. Finally Equation (3) provides the sediment concentration. The reader is referred to Gregoretti et al. (2016b) for more details and explanations about the numerical integration.
3. The Debris Flow Event: Geomorphological Analysis
The geomorphological analysis is essential for understanding whichever gravitative mass movement on earth, and allowing its reliable reproduction by models. It also provides information about its occurrence and behavior to be used in future studies as recommendations for countermeasures. All the basin was carefully surveyed to identify all the contributions, liquid or solid-liquid, to the debris flow that routed along Ru Secco. The entrained and deposited sediment volumes were estimated through the deposition-erosion depths map (Figures 8a, 9) that was obtained differencing the pre and post-event DEMs. The deposition and erosion depths are grouped into classes of 2 m size, about twenty and five times larger the average and maximum error (that of photogrammetric points) respectively. The map of Figure 9 allows the computation of the sediment volumes deposited and entrained: 108,700 and 57,165 m3, respectively. Their difference 51,535 m3 is the sediment volume that runoff entrained on the Vallon d'Antrimoia sloping plateau, upstream the Ru Salvela head. This volume is increased to 52,535 m3 to consider the sediment volume that reached the Boite River, so that the total mobilized sediment volume raises up to about 110,000 m3. Therefore, the debris flow event was triggered upstream the Ru Salvela Creek. Abundant runoff descending the northern cliffs of Mount Antelao corresponding to the basins of Antrimoia and Salvela in Figure 1, hit the debris deposits laying on the Vallon d'Antrimoia inclined plateau (upper blue arrows in Figure 2) and entrained enough sediment to generate a solid-liquid surge. This surge descended along the rock chutes linking the Vallon d'Antrimoia with the Ru Salvela head (upper red arrows in Figure 2) and propagated over the debris deposit covering the Ru Salvela Creek. This deposit (Figures 3a, 4) has a volume of 175,000 m3 obtained differencing the pre-event DEM with that before the rock collapse on November 2014, obtained through the LiDAR 2011 points. During the propagation over the rock fall deposits on Ru Salvela Creek, it entrained the debris material and meanwhile received the liquid contribution from Ru Longia (blue arrow on the right in Figure 2), that increased its erosive power. At the confluence with Ru Secco Creek, the well formed debris flow was supplied with the stream flow descending along Ru Secco Creek and the solid-liquid contribution from the debris flow triggered along the Ru Beche. These contributions increased its solid-liquid volume. The large runoff amount and the entrained sediments deriving from cliffs collapse in absence of clay and low percentage of silt, point out to a debris flow of stony type (Takahashi, 2007). The deposition-erosion map of Figure 8a clearly shows the erosion occurred along the middle part, in longitudinal sense, of the debris deposit covering the Ru Salvela Creek where the solid-liquid surge, descending from the Vallon d'Antrimoia inclined plateau, excavated a channel (bottom middle insert of Figure 8a). Both the sides of this channel are characterized by small debris deposits, i.e., the typical lateral levee that debris flow creates during its routing. These deposits usually occur on debris flow sides when the relative flow depth is small and terrain roughness is able to stop the flowing material. Upstream the confluence, debris flow began also to deposit significative quantities of sediments anticipating that occurred in larger size on the right side of Ru Secco Creek just before and in correspondence of the confluence. Figure S1 shows the bottom longitudinal profile of the channel excavated by debris flow on the debris deposit covering Ru Salvela Creek with some cross-sections. It can be observed that in the upstream part, debris flow entrained most of the debris material of deposit from the rock collapse while in the downstream part it did not. Debris flow, then, channelized along Ru Secco mainly depositing sediments on the sides and eroding the bed in the middle. About 380 m upstream the first culvert inlet, debris flow began to deposits. This reach is in fact protected by check dams and the bed slope diminishes. The debris flow front reached the inlet culvert where it stopped. Photos taken during the sediment removal operations and located in the Supplemental Material (Figure S2) show some big rocks obstructing inlet, i.e., the debris flow front that stopped, while the culvert is not clogged of sediments. In the same Figure S2, the exit of the culvert just after the event appears mainly free. The stoppage of the front imposed the deposition of the solid part of the current flowing behind it, that extended both in depth and upstream (up to 380 m), interesting all the creek cross-section and only the liquid part flowed downstream. Figure S3 of the Supplemental Material shows the pre and post-event bottom longitudinal profiles along Ru Secco Creek from the confluence to the village with nine cross-sections (A–I). Upstream the culvert, the bottom is in general raised up respect to the pre-event situation. Nevertheless, the rear part of the solid-liquid current, flowing over this large deposit, reached the culvert and flooded all the area surrounding it. This overflow caused sediments deposition on the main part of the parking and flow returned to the Ru Secco Creek after eroding all the border area of the parking on the creek side (top right insert of Figure 8a). The overflow on the terrain above the culvert eroded it creating an erosion channel. Top right and bottom left inserts of Figure 8a shows the downstream view of this channel and its cross section respectively. The re-channalized flow routed downstream causing erosion on some bends and mainly downstream the check dams (top left insert of Figure 8a) because of the large drop (see also sections E and F of Figure S3). The distribution of the volumes of deposited and eroded sediments is analyzed after dividing the flow pattern in five significative areas. Figure 9 shows the areas with a table listing the corresponding entrained and deposited sediment volumes: most of erosion downstream the Vallon d'Antrimoia inclined plateau, occurred on the debris deposit covering the Ru Salvela Creek (35,400 m3, about 63% of the total), while most of deposition occurred along Ru Secco between the confluence with the Ru Salvela Creek and the culvert inlet (62,700 m3, about 55% of the total). The values of the volumes of the deposited and eroded sediments downstream the culvert, about 29,581 and 12,721 m3 respectively, show that debris flow transformed in an hyperconcentrated flow. This occurred for two main reasons: (1) the large deposition occurred upstream the culvert that stopped the anterior part of debris flow that is usually richer of sediments; (2) the bed slope, that in this reach decreases from 11 and 2°, is not able to guarantee the transport of large quantities of sediments. The view of the cross-sections E–I, downstream the culvert with the pre and post-event bottom longitudinal profiles of the Ru Secco Creek (Figure S3) shows that some reaches were subjected to deposition (the larger part), while other subjected to erosion. In Figure 2 it can be also observed a small debris flow channel joining the Ru Secco on its right side. Direct field survey showed that its contribution was negligible and for this reason it was not considered in the routing simulations. Until late '50s the slopes on the right side were routed by debris flow providing the main solid-liquid contributions to Ru Secco (Figures S4, S5). The works for transforming this area in a touristic resort area stopped them. About 200 m downstream the base of the overhanging rocky cliffs, the slope was reshaped, and, where needed, some protection works (walls and pottings) were built. The small debris flow routed a new path on the reshaped slope, avoiding, the protection works.
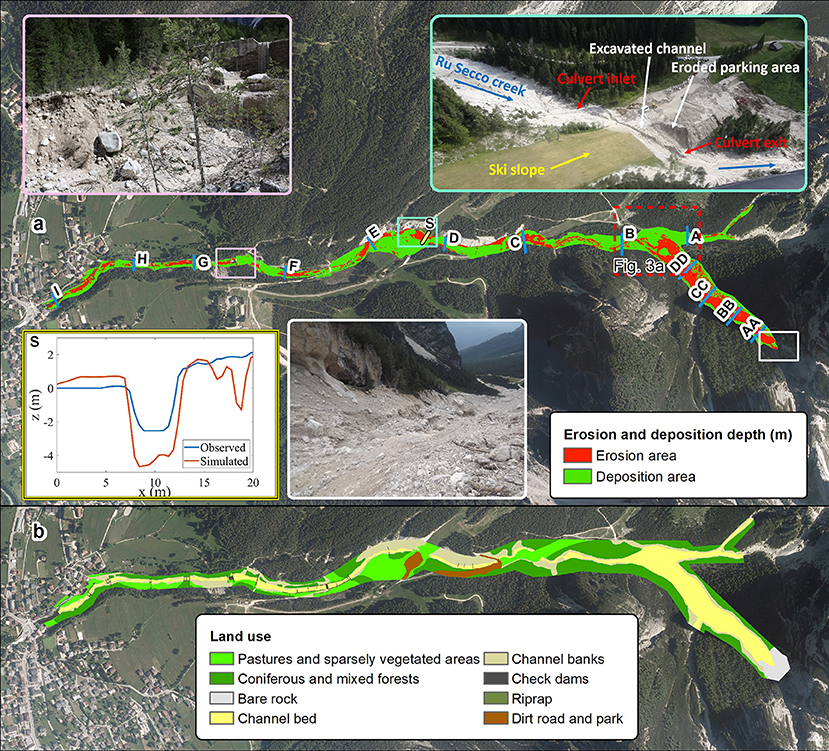
Figure 8. View of the area subjected to deposition or erosion and land use. The upper image (a) is the general view of the areas routed by debris flows and subjected to deposition or erosion. The top right insert is the post-event view of the area depicted in Figure 3b while the other three inserts show the downstream view of debris flow route incising the debris material covering the Ru Salvela creek (bottom middle), the observed and simulated cross-section of the channel excavated by debris flow above the culvert (bottom left) and a particular of a bank erosion after the upper culvert (top left). The position of the cross-sections that are shown in the Supplemental Materials is also indicated. The lower image (b) is the landuse of terrain for the routing simulation.
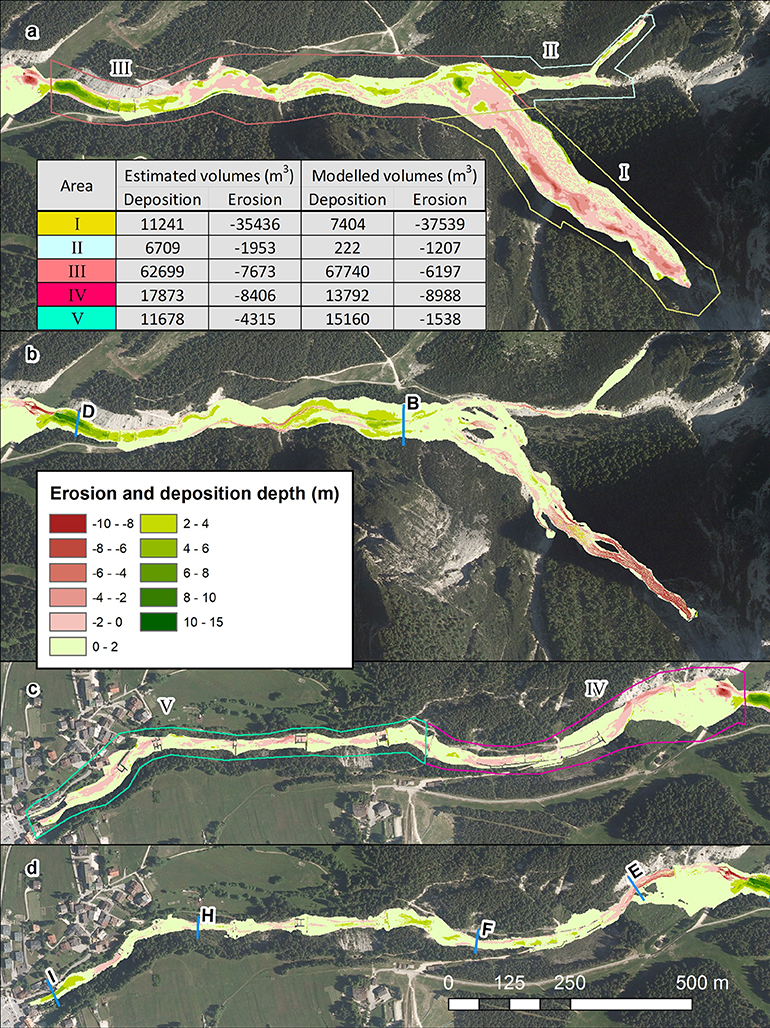
Figure 9. Deposition and erosion depths map for the two groups of reaches. Upper image (a) is the map of estimated deposition and erosion for the reaches I-III, while the image below (b) is that simulated. Images (c,d) are the corresponding of (a,b) for the reaches IV-V respectively. The position of the six sections (B, D, E, F, H, and I) is also shown.
4. The Phenomenon Reproduction by Models
This section concerns the reproduction of the entire phenomenon by models. It is divided in three subsections relative to the hydrological modeling, the solid-liquid hydrographs determination and the debris flow routing. The hydrological modeling provides runoff hydrographs that directly contributed to the phenomenon or entrained the debris material forming the solid-liquid hydrographs of the initial surges. Both runoff and solid liquid hydrographs are the input for the routing modeling.
4.1. Hydrological Simulations
The rainfall-runoff modeling for the five basins depicted in Figure 1 was carried out by the model of Gregoretti et al. (2016a). The model computes the excess rainfall for each cell of the basin and routes it through the steepest path to the channel network. The routing to the channel network occurs with constant velocity while that along the channel network to the outlet is ruled by means of a matched-diffusivity kinematic wave model. Parameters for the excess rainfall computation and slope routing are CN, the infiltration rate fC and slope velocity U which assume different values for each soil typology covering the basin. The values of these parameters are shown in Table 1 with those of CN and fC for rocky soil updated by Bernard (2018). Parameters for channel network routing are the roughness coefficient , the channel width at the outlet, b0, and a morphological exponent, b1 = 0.26. The values of b0 were measured in the case of the basins of Ru Longia, Ru Secco and Ru Beche, while for the Salvela and Antrimoia basins, they were obtained by LiDAR 2015 data. These values are shown in Table 2. The event occurred in AMC I conditions, because it did not rain in the previous 2 days (Bernard, 2018). The flow path from each cell of the basin to the channel network is obtained through the DEM (see Gregoretti et al., 2016a for details). The channel network cannot be provided by cells with a drainage area larger than 0.005 km2 as proposed by McGlynn and Seibert (2003) and McGuire et al. (2005). This threshold value was successfully tested by Gregoretti et al. (2016a) in the head water rocky basin of Dimai that has the same morphological features of those investigated here and about 10 km far but, unfortunately, it cannot be applied to the Ru Beche basin. Its area is too small (about 0.022 km2) and that threshold does not work because too large. For this reason, we investigated the transition from slope to channel routing by using two different methodologies: (1) the convergence of the upslope drainage area values after using different techniques (Wilson and Gallant, 2000); (2) the slope scaling method (Ijjasz-Vasquez and Bras, 1995). The first method examines the convergence of values of the upslope drainage area computed following the D8 and D∞ methods (Tarboton, 1997). The value where the values of drainage areas converge, is the area threshold value for determining the channel network. The second method explores the behavior of the drainage area vs. its mean slope. The drainage area values, where there is a discontinuity, correspond to the transition from slope routing to channel routing. The two methods provide the same results supporting the reliability of the obtained threshold value for the determining the channel network. Figure S6 shows the results of the two methods. These values together those of the morphometric characteristics of the basins are shown in Table 2. Simulations were carried out using both the radar estimates and the observed rainfall depths. Results are shown in Figure 10. Simulations corresponding to the corrected radar estimates provide runoff hydrographs slightly larger except that of the Ru Secco basin whose peak value is about 25% larger.
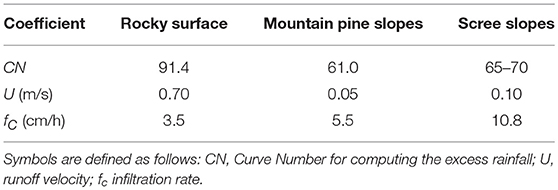
Table 1. Parameters adopted in the hydrological model.
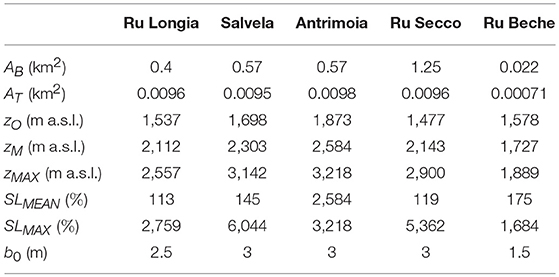
Table 2. Morphometric characteristics of the basins: AB, basin area; AT, threshold area for channel network; zO, basin outlet altitude; zM, mean basin altitude; zMAX, maximum basin altitude; SLMEAN, mean slope; SLMAX, maximum slope; b0, outlet width.
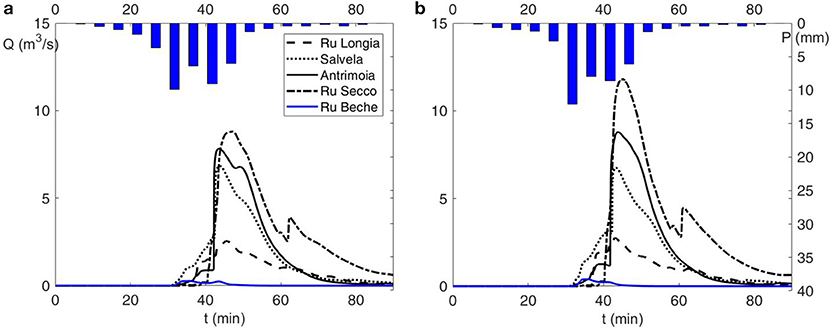
Figure 10. Modeled runoff hydrographs for the five basins corresponding to the measures (a) and corrected radar estimates (b) of rainfall depth.
4.2. The Solid-Liquid Hydrographs
The sites on the Vallon Antrimoia sloping plateau where the solid-liquid surges formed after the impact of runoff with the debris deposits could not be surveyed because of their inacessibility. Therefore, we determineted the solid-liquid hydrographs at the middle of the rock chute following the methodology proposed by Gregoretti et al. (2018). We adopted a triangular shape of the solid-liquid hydrograph with an abrupt raise to peak and a less rapid decreasing because downstream the triggering area, the debris flow surge tends to assume such a shape. The solid-liquid volume is given by the sum of the solid volume with the volumes of runoff contributing to debris flow and of the interstitial water of the entrained sediments as also proposed by Gregoretti et al. (2012, 2016a). Because of the high intensity precipitation and the quite high permeabilty of the debris, deposits are assumed to be nearly in saturated conditions. The solid volume can be obtained by the volume of sediments entrained on the Vallon d'Antrimoia that is provided by the difference between the computed deposited and eroded sediment volumes downstream it: 108,700−57,165 = 51,535 m3. This volume is increased to 52,535 m3 to consider the sediment volume that reached the Boite River (see the previous section). The solid volume is the entrained sediments volume multiplied by c*. The runoff contributing to debris flow is the part of runoff hydrograph where the runoff discharge is larger than the triggering discharge (see also Gregoretti et al., 2016b and Han et al., 2017). In the present case, the inaccessibility of the triggering site prevented direct measurements, and the unit width triggering discharge was estimated as 0.05 m2/s through the relationship proposed by Gregoretti and Dalla Fontana (2008) after assuming reasonable values of sediments mean size (0.1 m) and bed slope angle (30°). The interstitial water volume is given by the difference between the entrained sediments volume and the just computed solid volume. The solid-liquid hydrograph is the triangle with the height equal to the peak discharge value and the base equal to the ratio between the double of the solid-liquid volume and the peak value. The peak solid-liquid discharge, QP, is computed following the relationship provided by Lanzoni et al. (2017):
where cF is the solid volumetric concentration of the debris flow front, and, Q0 is the runoff peak discharge. The value for c* is assumed equal to 0.62 (value proposed by Gregoretti et al., 2016b for unchannelized debris deposits that are not subjected to compaction) and that for cF equal to 0.9c* (0.558) according to Takahashi (2007). The two solid-liquid hydrographs are computed by using the runoff hydrograph of the two basins of Antrimoia and Salvela after partioning the sediments volume (52,535 m3) in 38,035 and 14,500 m3, respectively. The Antrimoia basin, in fact, occupies the larger part of the Vallon Antrimoia sloping plateau where debris deposits lie. The resulting solid-liquid hydrographs are shown in Figure S7.
4.3. Routing Simulations
Parameters of debris flow routing simulation depend on the terrain (channel, scree, grass, wood) and slope because flow resistance and deposition-entrainment processes vary with them. Figure 8b shows the land use of the terrain interested by the phenomenon. The values of parameters used for the routing simulation are shown in Table 3. This set of parameters, until the culvert, is that used by Gregoretti et al. (2016b, 2018) for reproducing two occurred debris flows after a sensitivity analysis based on the comparison between simulations and observations of deposition/erosion depths. Only the conductance coefficient, C, respect to Gregoretti et al., 2016b, was increased from 3 to 5 where the flow is channelized. Gregoretti et al. (2016b) in fact simulated the dispersion in several directions on a fan of a debris flow of high magnitude while in present case the flow is channelized. In the case of channelized flow, estimates of C, from field data of stony debris flows with a magnitude much lower than that here studied (Gregoretti, 2000; Hurlimann et al., 2003; Okano et al., 2012), mostly range in the interval 1–3. Flume experiments of Tognacca (1999) and Lanzoni et al. (2017) on stony debris flows show that the velocity increases with the triggering discharge much more than the flow depth, and consequently also the conductance coefficient C increases with it. Figure S8 shows, in fact, the growth of the experimental values of C with the triggering discharge. This means that the debris flow discharge, and thus the magnitude of the debris flow, increases with the amount of the runoff generating the event, while the flow resistance decreases. Therefore, the value of the conductance coefficient was raised to 5 because this event, characterized by a magnitude higher than that of the observed and above referenced debris flows, was triggered by a larger runoff amount. Downstream the culvert, debris flow transforms to hyperconcentrated flow because most of solid material deposited upstream and bed slope decreases from 11° to 2° along the flow direction. This means an increase of the conductance coefficient and a decrease of the limit values of angle and velocity both for deposition and entrainment because the transported solid concentration decreases (Armanini, 2015). The values of parameters downstream the culvert were assigned after calibration. For all the channelized flows, different values of parameters were adopted for the banks where, due to the low submergence, flow resistance is larger and for the wooded and grass areas. The value of the parameter relevant for erosion, θlim−E, was assumed equal to 16°, inferior angle associated to the occurrence of mature channalized stony debris flows according to the experiments of Lanzoni et al. (2017). This value was also confirmed by the field observations of Jordan (1994). According to Gregoretti et al. (2018), we also adopted values of K equal to 0.1 and 0.5 for deposition and entrainment respectively.
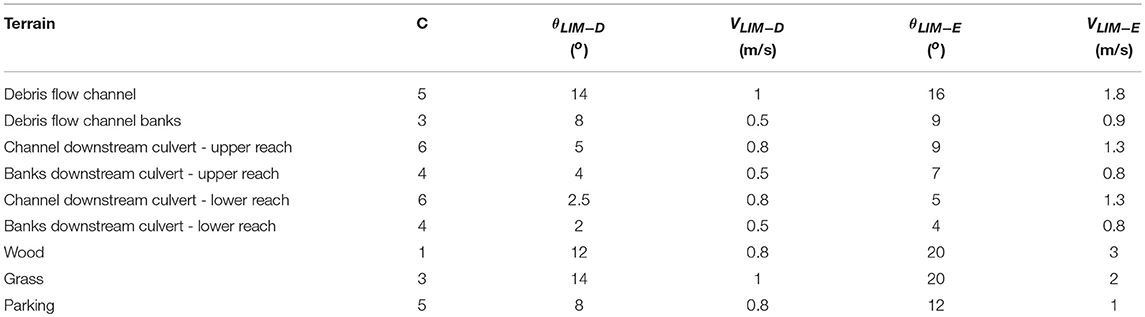
Table 3. Values of the parameters used in the routing simulations for the different terrains.
The simulated deposition and erosion depths are shown together those estimated in Figure 9. The flow pattern, for a better comparison between simulation and estimate of the deposited and eroded sediments volume, has been divided in five reaches: the Ru Salvela Creek (I), the Ru Beche (II), the Ru Secco Creek upstream the culvert (III), the Ru Secco Creek downstream the culvert with a mean bed slope of 8° (IV) and the ending reach with a mean bed slope of 4.5° (V). In particular both the simulated and estimated deposition and erosion depths are shown in two groups of reaches, I–III and IV–V respectively, allowing a more detailed analysis together with a table the values of the simulated and estimated sediment volumes, that were eroded and deposited for each reach. The comparison of simulation results with the observations (Figure 9) shows that the main features of the deposition-erosion pattern are captured by the simulation except at the confluence of Ru Salvela with Ru Secco Creek and in the downstream part of the ending reach where the bed sloping angle decreases to a value of about 2°. The simulated volumes of deposited and eroded sediments are 104,318 and 55,469 m3, respectively. Both of them underestimate those observed of 4 and 3% respectively. This overall satisfactorily agreement between observations and simulations, obtained using the same parameters for reproducing two other debris flows in the Dolomites, points to a validation of the routing model here used for simulating solid-liquid flows in the grain-inertial range. The examination of the results reach by reach allows a better understanding of the model capability to simulate the occurred phenomenon. In reach I (that of Ru Salvela creek), the simulated eroded sediment volume quasi coincides with that estimated but it is more concentrated in the upstream part of Ru Salvela. This could be due to an imperfect reproduction of the pre-event DEM at the head of the Ru Salvela. This zone is just under the cliffs and some three dimensional shapes of debris deposits could be not detectable by the photos by which the pre-event DEM has been built. For this reason, in the upstream part, the simulated debris flow front mainly concentrated in a narrow path that was highly eroded. Resulting debris surge was too concentrated and, therefore, eroded a smaller amount of sediments in the downstream part. About deposition, the large deposits at the confluence were not satisfactory reproduced due to missed local bed reproduction of the terrain in the pre-event DEM. The deposits on this area were subjected to excavation during the restoration works in the month between the photo time and the event. Therefore, some path and the flat area built by the excavators, that we could not to reproduce, could have significatively conditioned the flow routing. Sediment volume that did not deposited there during simulation, in fact, deposited just downstream the confluence (beginning of reach III). In fact simulated deposition depths, there, are on average larger than those estimated. Routing along Ru Beche (reach II) was satisfactory simulated but not that along the Ru Secco Creek between the two confluences with Ru Beche and Ru Salvela Creeks. This could be a result of the missed deposition of flow arriving from the Ru Salvela Creek, explained above. There is a quite good agreement between simulation results and observations along reach III: nearly coincidence of areas subjected to the main deposition and erosion phenomena combined with the nearly coincidence of the simulated and estimated sediments volumes that were depositated and entrained (the percentage of simulated deposited sediments volume is 8% higher than that observed due to the missing of simulated deposits at the confluence). The flooding of the park and the erosion of it, together the excavation of a channel in the terrain overlaying the culvert, is also nealry satisfactory simulated. The bottom left insert of Figure 8a shows the comparison between the surveyed and simulated cross section of the excavated channel. The simulation of the excavation appears fairly satisfactorily, even if larger. For the reach IV visual inspection of Figures 9c,d shows that erosion and deposition pattern is well reproduced and the simulated eroded sediments volume nearly coincides with that estimated. Only the deposition volume is underestimated. For the reach V, the agreement is not so satisfactory both for the volumes and the areas. In fact the erosion on its downstream part is not captured, while conversely deposition is overestimated. Figure 11 shows the simulated solid-liquid and solid discharge, Q (left) and QS (right) respectively, for the six sections shown in Figure 9. The solid-liquid discharge reaches its maximum after the confluence and then it begins to decrease. The solid discharge is consistent until section F (Figure 9) due to the large erosion occurred upstream. After that, it decreases to negligible values, characteristics of bed-load sediment transport.
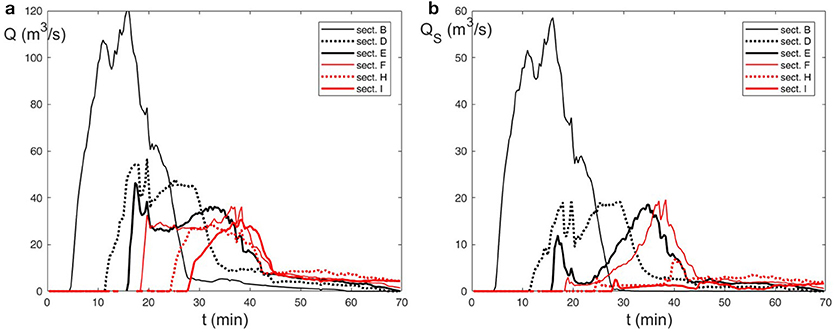
Figure 11. Simulated hydrographs of solid-liquid (a) and solid discharge (b), Q and QS respectively, corresponding to the the traces of the six sections of Figure 9.
5. Discussion of Results
The direct post-event field survey and the analysis of the pre-event morphology during time allowed the geomorphological analysis of the event. It consisted in the recognition of the phenomenon occurrence and of its main features. The analysis of the pre-event morphology between '50s and nowadays also showed that slopes on the right side of Ru Secco Creek were routed by debris flows before their transformation in a ski resorting area while the left side was not subjected to debris flow phenomena (Figures S4, S5). In the present case study, the environmental changes due to man works can stop or reduce debris flow activity in areas prone to debris flow susceptibility, while those due to natural causes, as the formation of debris deposits caused by local terrain instabilities, if connected to the channel network (Cavalli et al., 2013; Tiranti et al., 2016, 2018), allow the conditions for debris flow occurrence, where it never did. Both the historical basins where debris flows formed until '50s and the new one of Ru Salvela are debris flow dominated according to the geomorphic indexes: the ruggedness number of Melton close or larger than 1 [0.75 is the inferior threshold value according to DeScally and Owens (2004)] and local slope larger than 0.6 m/m in the schematic diagram between local slope and drainage area proposed by Montgomery and Foufoula-Georgiou (1993) for the hillslope to valley transition also used by Tarolli and Dalla Fontana (2009). Therefore, even if the basins are prone to debris flow activity according to the geomorphic indexes above, debris flow occurrence is determined by sediment availability as the concentration of abundant runoff on it. Finally, the geomorphological analysis, providing a reliable description of the occurred phenomenon, is at the base of simulation of the phenomenon by models. The reproduction of the occurred phenomenon was the results of two phases: a careful survey of all the sub-basins supplying solid-liquid and liquid flows both the debris deposits covering Ru Salvela Creek and the Ru Secco Creek, allowed the identification of all the significative solid-liquid and liquid contributions (1); simulation by models of the formation and routing of these contributions and their impact on debris deposits (2). Reliable models results were allowed by trustworthy rainfall estimates that provided the input to the hydrological model and by topographical data that provided the base for running and testing them. The pre-event topographical data provided the DEM for running the routing simulations. The post-event topographical data were used for determining the post-event DEM of the area routed by debris flow that, subtracted to the pre-event DEM, provided the deposition-erosion depths map, essential for understanding the phenomenon and testing the modeling. For this reason, the availability of pre and post-event data becomes fundamental for a reliable understanding of the phenomenon, as for its reproduction by models. Unfortunately, the simultaneous availability of pre and post-event data is not frequent but rare because in many cases the pre event terrain topography is usually unknown: previous occurred debris flow phenomena, also of small magnitude, and local instability phenomena (rock falls from upstream cliff and/or channel bank failures) can significatively change the flow path morphology, and consequently, debris flow routing could not be captured by simulations.
The reproduction of the occurred phenomenon, shown in the previous section, appears, in general, satisfactory. The deposition and erosion pattern, in fact, is quite well reproduced both in terms of areas and volumes apart some parts of the Ru Salvela Creek and of the ending reach. The simulation in the upstream reaches of Ru Salvela and Ru Secco Creeks is conditioned by pre-event local topographical data that are partially inaccurate and missing respectively. In the first case, the exact shape of pre-event debris deposit at the head of the Salvela Creek was not captured, while in the second case, due to the restoration work, the topography of some areas close to the confluence of Ru Salvela Creek with Ru Secco Creek changed. The presence of excavator tracks and flat areas due to the debris deposits reworking could have significatively conditioned the local routing simulation. As a consequence the deposition at the confluence was understimated. The simulation downstream these reaches provides quite good results: the areas subjected to large phenomena of deposition and erosion are captured. Only the deposition depths upstream the culvert slightly overstimate those observed because of the missed deposition at the confluence of Ru Salvela Creek with Ru Secco Creek, and some areas subjected to erosion in the ending reach are missed. Moreover, the shape of the channel excavated by the debris flow after the culvert occlusion is nearly approximated (bottom left insert of Figure 8a). The analysis of the solid-liquid and solid discharges (Figure 11) allows a better understanding of the occurred phenomenon. After the confluence of Ru Salvela with Ru Secco the debris flow discharge peak has the maximum value and that of solid discharge is nearly the half (cross-section B). Just upstream the culvert (cross-section D) the solid-liquid discharge peak is reduced to less than 50% while that of solid one to about 30% due to the large deposition phenomena mostly due to the culvert occlusion. In the reach upstream the culvert solid-liquid and liquid discharge are in phase while in the downstream reach, it does not occur. In the cross-section E, downstream the culvert, the discharge in the first ten minutes is mostly liquid because the occlusion at the culvert inlet causes the deposition of most of solid phase. Solid discharge, in fact after an initial but moderate increase, decreases to a neglegible value and then increases again to a value nearly the half of the total discharge. This behavior is the consequence of the initial erosion on the bend downstream the culvert followed by that of the parking on the Ru Secco side and on the terrain overlaying the culvert. Figure 12 shows the time evolution of the simulated deposition and erosion pattern with the flow depth in correspondence of the culvert: at the beginning there is only a mainly liquid flow over the terrain downstream the culvert inlet that reaches the Ru Secco and causes the erosion on its right side as shown by Figures 12a–c. This is coherent with the initial moderate solid discharge peak in cross-section E (Figure 11). In the following 20 min the deposition and erosion on parking become consistent with the excavation of the channel just over the culvert (Figures 12d–f) that is responsible of the second solid discharge peak in cross–section E (Figure 11b). In cross-section F the behavior is analogous but for the absence of the initial moderate peak of solid discharge, reasonably due to an upstream deposition. Along cross-sections H and I solid-liquid peak discharge remains unchanged while flow volumes diminish because of the deposition. The solid discharge, in fact, decreases to negligible values, typical of bed load sediment transport. This could be the main reason for the not satisfactory simulation of the end part of the last reach V. In fact the hyperconcentrated flow transforms to a flow with low concentration values that on bed sloping angles of about 4.5° the cell model could be not able to simulate with efficacy.
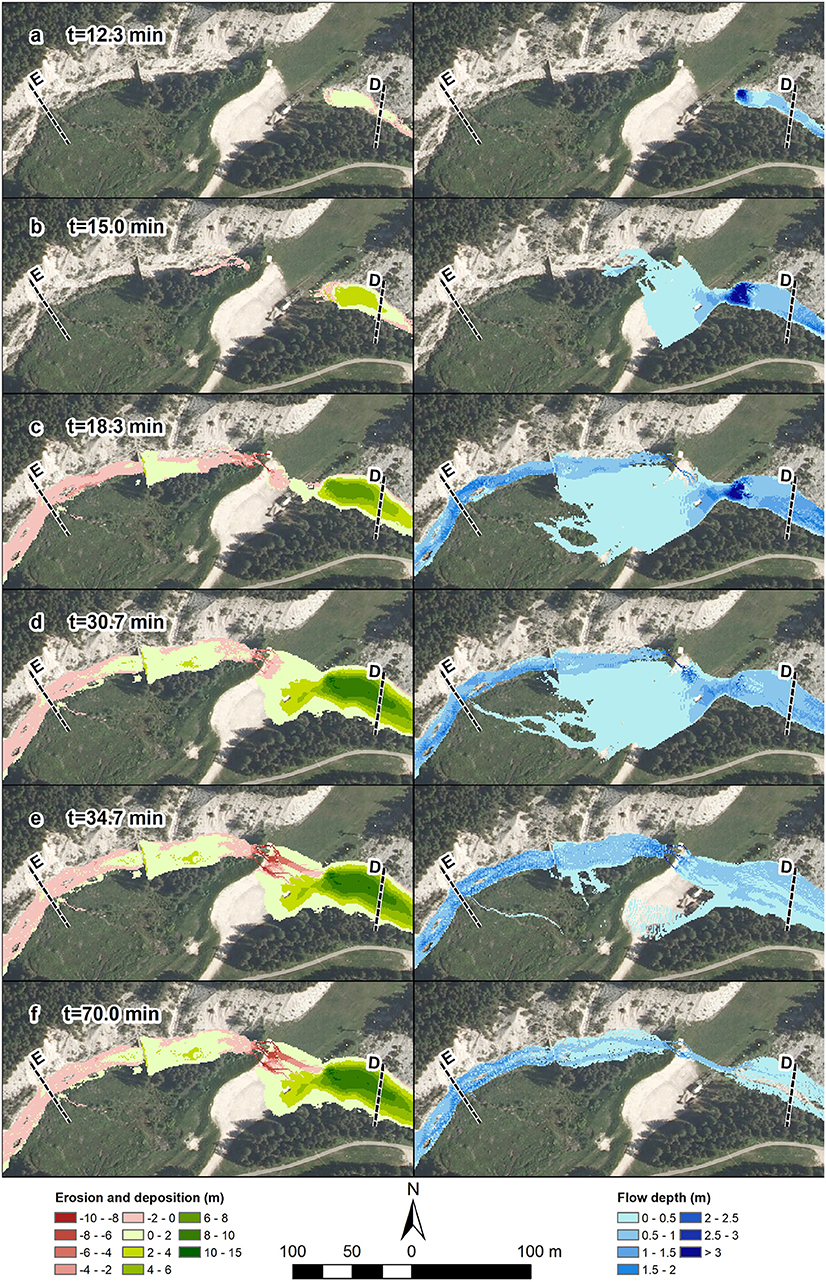
Figure 12. The deposition and erosion depths (Left) and flow depths (Right) maps at different times [(a) t = 12.3 min, (b) t = 15.0 min, (c) 18.3 min, (d) t = 30.7 min, (e) t = 34.7 min, (f) t = 70.0 min] from the beginning of the simulation of the area close to the culvert and parking.
The in general satisfactory and reliable reproduction of the occurred phenomenon provides a confirm of the methodology here followed for simulating a runoff generated debris flow when information on the triggering site are scarce: simulation of runoff, determination of the solid-liquid hydrograph in the initiation area and simulation of its downstream routing. Concerning the debris flow initiation, McGuire et al. (2017) proposed a more general and refined mathematical modeling, here not usable due to lack of information on the triggering area that resulted inaccessible. However, the simple and direct determination of the solid-liquid hydrograph, here proposed, proved to be reasonable and reliable. For debris flow routing, only models that consider deposition and entrainment should (Chen et al., 2006; Medina et al., 2008; Armanini et al., 2009; Hussin et al., 2012; Frank et al., 2015; Cuomo et al., 2016) should be used, provided their capability to simulate these processes. Finally, present work of back analysis of the phenomenon is also important, because it provides the framework and data needed for testing other models.
6. Conclusions
The 4th of August 2015, a high intensity storm concentrated on a square of about two kilometers and triggered some in-channel debris flows on Venetian Dolomites. The debris flow occurred on Ru Secco Creek was of large magnitude with about 100,000 m3 entrained sediments. Ru Secco Creek was not routed by debris flows since late 50s after works for transforming its right side generally affected by debris flows, into a ski resort area. The debris flow of August 2015 started, in fact, on the opposite side because of the presence of very large debris deposits at the base of northeastern cliffs of Mount Antelao after a rock collapse occurred on November 2014. Direct field surveys and the analysis of pre and post-event topography allowed the recognition of liquid and solid-liquid contributions to the occurred phenomenon and its main features, as well as the map of deposition and erosion depths. Finally the phenomenon was modeled from rainfall-runoff transformation to deposition-erosion processes with satisfactory results: most of entrainment and deposition processes were captured except where initial topography data were partially inaccurate or missing or when solid discharge decreased to values typical of bed load. For the part strictly concerning the routing, these results were mainly due to the cell model of Gregoretti et al. (2018) that allows a better simulation of the entrainment process.
Based on these analysis and modeling results, the main conclusions of this work can be summarized as follows. One of the main triggering factor for runoff generated debris flows is the sediment availability. The presence of debris deposits, due to local terrain instability phenomena, lead to the occurrence of a debris flow where it never occurred before. Furthermore, the satisfactorily results obtained in the reproduction of the phenomenon suggest that a reliable reproduction of an occurred debris flow should be based on four factors:
1. an accurate geomorphic analysis showing the main processes that caused it and occurred during its evolution. This analysis provides a guide for the implementation of the models simulating the physical processes concurrent to its development as well as the initial conditions;
2. a sufficiently accurate topographic base for the generation of DEMs on which models should run. Inaccuracy of topographical data or their missing can lead to unexpected and unreliable results;
3. a models cascade simulating all the physical processes associated to the debris flow occurrence;
4. the capability of the used models of capturing the main features of the phenomena associated to debris flow occurrence as the impulsive response of runoff to rainfall at the base of rocky cliffs and the entrainment and deposition processes occurring during the debris flow routing.
The in general satisfactory reproduction of the phenomenon by models proved the reliability of both the used methodology and single models. It should be stressed that the values of parameters used for running the models are mostly those resulting from the comparison between observations and simulations of other events. This is a good outcome because it shows the predictability characteristics of the models here used. Reliability of models is very important because a trustworthy prediction of debris flow routing (discharge hydrograph, deposition and erosion depths as the inundated area) is essential in any analysis of hazard assessment and countermeasures planning. At this purpose, the capability of the routing model to adequately simulate the entrainment process has a crucial role because the solid-liquid discharge peak and the transported sediments volume mainly depend on it. At least the updated cell model used here for the routing simulation proved to give reliable results also for hyperconcentrated flow and bed slopes larger than 8°.
Author Contributions
CG carried out the surveys, determined the solid-liquid hydrographs, provided the cell routing model and run the routing simulations. MD carried out the surveys, analyzed the topografical data, built the pre and post-event DEMs, studied the hydrological groups of terrain and its morphology preparing most data for running the hydrological model. MBe helped in the pre and post-event DEM building, provided the hydrological model and run the hydrological simulation, contributed to the solid-liquid hydrographs determination prepared the file data for running the routing simulations, helped in run the routing simulations, analyzed the results, made figures. MBo helped in the pre and post-event DEM building, run the occurrence model, prepared the file data for running the routing simulations, helped in run the routing simulations, analyzed the results, made figures.
Conflict of Interest Statement
The authors declare that the research was conducted in the absence of any commercial or financial relationships that could be construed as a potential conflict of interest.
Acknowledgments
This work was supported by the municipality of San Vito di Cadore that is thanked by the authors. Authors wish also to thank the Regional Civil Work Agency of Veneto for the LiDAR 2015, the drone flight, the photos of the helicopter flights of 1 July and 5 August 2015 and the documentation relative to the occurred debris flow; the Regional Environment Protection Agency of Veneto and the Department of Soil Defence of the Province of Belluno for the meteorological data; the Department Land Defence and Civil Protection of the Province of Belluno for the LiDAR 2011, the Meteorological Service of the Province of Bolzano for the weather radar observations. Finally, the authors wish to thanks the reviewers for their criticisms and suggestions that helped to improve significantly the manuscript. Data are available under request to the corresponding author.
Supplementary Material
The Supplementary Material for this article can be found online at: https://www.frontiersin.org/articles/10.3389/feart.2018.00080/full#supplementary-material
References
Arattano, M., and Savage, W. (1994). Modelling debris flows as kinematic waves. Bull. Int. Assoc. Eng. Geol. 49, 3–13. doi: 10.1007/BF02594995
Armanini, A. (2015). Closure relations for mobile bed debris flows in a wide range of slopes and concentrations. Adv. Water Resour. 81, 75–83. doi: 10.1016/j.advwatres.2014.11.003
Armanini, A., Fraccarollo, L., and Rosatti, G. (2009). Two-dimensional simulation of debris flows in erodible channels. Comput. Geosci. 35, 993–1006. doi: 10.1016/j.cageo.2007.11.008
Bacchini, M., and Zannoni, A. (2003). Relation between rainfall and triggering of debris flow: case stydu of cancia (dolomites, northeastern italy). Nat. Hazards Earth Syst. Sci. 3, 71–79. doi: 10.5194/nhess-3-71-2003
Baglioni, A., and De Marco, P. (2015). Fenomeni di colata detritica ed inondazione verificatosi nel bacino del Ru Secco (San Vito di Cadore) il 4/8/2015. Osservazioni geologiche preliminari. Technical Report - Regional Civil Work Agency of Veneto Region.
Bagnold, R. A. (1954). Experiments on a gravity-free dispersion of large solid spheres in a newtonian fluid under shear. Proc. R. Soc. Lond. Ser. A 225, 45–63. doi: 10.1098/rspa.1954.0186
Berger, C., McArdell, B., and Schlunegger, F. (2011). Direct measurement of channel erosion by debris flows, illgraben, switzerland. J. Geophys. Res. 116:F01002. doi: 10.1029/2010JF001722
Bernard, M. (2018). Analysis of Rainfalls Triggering Debris Flows and Modelling of Corresponding Runoff. PhD. Thesis - Università degli Studi di Padova.
Berti, M., and Simoni, A. (2005). Experimental evidences and numerical modelling of debris flow initiated by channel runoff. Landslide 2, 171–182. doi: 10.1007/s10346-005-0062-4
Boreggio, M., Bernard, M., and Gregoretti, C. (2018). Evaluating the influence of gridding techniques for digital elevation models generation on debris flow routing modelling: a case study From Rovina di Cancia basin (North-Eastern Italian Alps). Front. Earth. Sci. 6:89. doi: 10.3389/feart.2018.00089
Brufau, P., Garcia-Navarro, P., Ghilardi, P., Natale, L., and Savi, F. (2000). 1-d mathematical modelling of debris flow. J. Hydraul. Res. 38, 435–446. doi: 10.1080/00221680009498297
Cannon, S., Gartner, J. E., Wilson, R. C., Bowers, J. C., and Laber, J. L. (2008). Storm rainfall conditions for floods and debris flows from recently burned areas in southwestern colorado and southern california. Geomorphology 96, 250–269. doi: 10.1016/j.geomorph.2007.03.019
Cavalli, M., Trevisano, M., Comiti, F., Bowers, J. C., and Marchi, L. (2013). Geomorphometric assessment of spatial sediment connectivity in small alpine catchments. Geomorphology 188, 31–41. doi: 10.1016/j.geomorph.2012.05.007
Chen, H., Crosta, G., and Lee, C. (2006). Erosional effect on run-out of fast landslide, debris flows and avalanches: a numerical investigation. Geotechnique 56, 305–322. doi: 10.1680/geot.2006.56.5.305
Coe, J. A., Kinner, D. A., and Godt, J. W. (2008). Initiation conditions for debris flows generated by runoff at Chalk Cliffs, Central Colorado. Geomorphology 96, 270–297. doi: 10.1016/j.geomorph.2007.03.017
Cuomo, S., Pastor, M., Capobianco, V., and Cascini, L. (2016). Modelling the space- time bed entrainment for flow-like landslide). Eng. Geol. 212, 10–20. doi: 10.1016/j.enggeo.2016.07.011
Degetto, M., Gregoretti, C., and Bernard, M. (2015). Comparative analysis of the differences between using lidar contour-based dems for hydrological modeling of runoff generating debris flows in the dolomites. Front. Earth Sci. 3:21. doi: 10.3389/feart.2015.00021
DeScally, F., and Owens, I. (2004). Morphometric controls and geomorphic responses on fans in the southern alps, new zealand. Earth Surf. Process. Landforms 29, 311–322. doi: 10.1002/esp.1022
Destro, E., Amponsah, W., Nikolopoulos, E., Marchi, L., Marra, F., Zoccatelli, D., et al. (2018). Coupled prediction of flash flood response and debris flow occurrence: application on an alpine extreme flood event. J. Hydrol. 558, 225–237. doi: 10.1016/j.jhydrol.2018.01.021
Di Cristo, C., Iervolino, M., and Vacca, A. (2014). Applicability of kinematic, diffusion and quasi-steady dynamic wave models to shallow mud flows. J. Hydrol. Eng. 19, 956–965. doi: 10.1061/(ASCE)HE.1943-5584.0000881
Egashira, S., and Ashida, K. (1987). “Sediment transport in steep slope flumes,” in Proceedings of the RoC Japan Joint Seminar on Water Resources.
Egashira, S., Honda, N., and Itoh, T. (2001). Experimental study on the entrainment of bed material into debris? ow. Phys. Chem. Earth (C) 26, 645–650.
Frank, F., McArdell, B., Huggel, C., and Vieli, A. (2015). The importance of entrainment and bulking on debris flow runout modeling: examples from the swiss alps. Nat. Hazards Earth Syst. Sci. 15, 2569–2583. doi: 10.5194/nhess-15-2569-2015
Gregoretti, C. (2000). “Estimation of the maximum velocity of a surge of debris flow propagating along an open channel,” in International Symposium Interpraevent 2000 Villach 26-30 June, 99–108.
Gregoretti, C., Adams, M., Hagen, K., Laigle, D., Liebault, F., Degetto, M., et al. (2012). “Forecast system guidelines debris flows. guidelines for the implementation of forecast system against debris flow hazard (wp6),” in Project PARAmount imProved Accessibility: Reliability and Security of Alpine Transport Infrastructure Related to Mountainous Hazards in a Changing Climate, Alpine Space, European Regional Development Fund (ERDF) (Brussels).
Gregoretti, C., and Dalla Fontana, G. (2007). “Rainfall threshold for the initiation of debris flows by channel bed failure of the dolomites,” in Proceedings of the Fourth International Conference on Debris Flow Hazards Mitigation, eds C. L. Chen and J. J. Major (Chengdu: Balkema), 11–21.
Gregoretti, C., and Dalla Fontana, G. (2008). The triggering of debris flow due to channel-bed failure in some alpine headwater basins of the dolomites: analyses of critical runoff. Hydrol. Process. 22, 2248–2263. doi: 10.1002/hyp.6821
Gregoretti, C., Degetto, M., Bernard, M., Crucil, G., Pimazzoni, A., De Vido, G., et al. (2016a). Runoff of small rocky headwater catchments: field observations and hydrological modeling. Water Resour. Res. 52, 8138–8158. doi: 10.1002/2016WR018675
Gregoretti, C., Degetto, M., and Boreggio, A. (2016b). Gis-based cell model for simulating debris flow runout on a fan. J. Hydrol. 534, 326–340. doi: 10.1016/j.jhydrol.2015.12.054
Gregoretti, C., Stancanelli, L. M., Bernard, M., Boreggio, M., Degetto, M., and Lanzoni, S. (2018). Relevance of erosion processes when modelling in-channel gravel debris flows for efficient hazard assessment. doi: 10.1016/j.jhydrol.2018.10.001
Han, X., Chen, J., Xu, P., and Zhan, J. (2017). A well-balanced numerical scheme for debris flows run-out predictions in the xiaojia gully considering different hydrologic designs. Landslide 14, 2105–2114. doi: 10.1007/s10346-017-0850-7
Höhle, J., and Höhle, M. (2009). Accuracy assessment of digital elevation models by means of robust statistical methods. ISPRS J. Photogrammet. Remote Sens. 64, 398–406. doi: 10.1016/j.isprsjprs.2009.02.003
Hu, W., Dong, X. J., Wang, G. H., van Asch, T. W. J., and Hicher, P. Y. (2016). Initiation processes for run-off generated debris flows in the wenchuan earthquake area of china. Geomorphology 253, 468–477. doi: 10.1016/j.geomorph.2015.10.024
Hurlimann, M., Abanco, C., Moya, J., and Villalosana, I. (2014). Results and experiences gathered at the rebaixader debris-flow monitoring site, central pyrenees, spain. Landslide 2, 161–175. doi: 10.1007/s10346-013-0452-y
Hurlimann, M., Rickenmann, D., and Graf C. (2003) Field and monitoring data debris-flow events in the Swiss Alps. Can. Geotech. J. 40, 161–175. doi: 10.1139/T02-087
Hussin, H., Quan Luna, B., Van Westen, C., Christen, M., Malet, J., and van Asch, T. (2012). Parameterization of a numerical 2-d debris flow model with entrainment: a case study of the faucon catchment, southern french alps. Nat. Hazards Earth Syst. Sci. 12, 3075–3090. doi: 10.5194/nhess-12-3075-2012
Ijjasz-Vasquez, E., and Bras, L. (1995). Scaling regimes of local slope versus contributing area in digital elevation models. Geomorphology 12, 299–311. doi: 10.1016/0169-555X(95)00012-T
Imaizumi, F., Sidle, R. C., Tsuchiya, S., and Ohsaka, O. (2006). Hydrogeomorphic processes in a steep debris flow initiation zone. Geophys. Res. Lett. 33, 157–171. doi: 10.1029/2006GL026250
Iverson, R. M., Schilling, S. P., and Vallance, J. W. (1998). Objective delineation of lahar-hazard zones downstream from volcanoes. Geol. Soc. Am. Bull. 110, 972–984.
Jordan M. (1994). Debris Flows in the Southern Coast Mountains, British Columbia: Dynamic Behaviour and Physical Properties. PhD. thesis, University of British Coulumbia, Vancouver, BC.
Kean, J., McCoy, S. W., Tucker, G. E., Staley, D. M., and Coe, J. A. (2013). Runoff-generated debris flows: observations and modeling of surge initiation, magnitude and frequency. J. Geophys. Res. 118, 2190–2207. doi: 10.1002/jgrf.20148
Lanzoni, S., Gregoretti, C., and Stancanelli, M. (2017). Coarse-grained debris flow dynamics on erodible beds. J. Geophys. Res. 122, 592–614. doi: 10.1002/2016JF004046
Lenzi, M. A., D'Agostino, V., Gregoretti. C., and Sonda D. (2003). “A simplified numerical model for debris-flow hazard assessment: DEFLIMO,” in Third International Conference On Debris Flow Hazard Mitigations: Mechanics, Prediction and Assessment (Davos).
Lo Brutto, M. C., and Meli, P. (2013). “Performance evaluation of 3d web-services and open-source software for digital modeling of archeological finds,” in Proceedings of Archeofoss, eds F. Stanco and G. Gallo, 11–21.
Mattea, S., Franceschinis, C., Scarpa, R., and Thiene, M. (2016). Valuing landslide risk reduction programs in the Italian Alps: The effect of visual information on preference stability. Land Use Policy 59, 176–184. doi: 10.1016/j.landusepol.2016.08.032
McGlynn, B, L., and Seibert, J. (2003). Distributed assessment of contributing area and riparian buffering along stream networks. Water Resour. Res. 39:1082. doi: 10.1029/2002WR001521
McGuire, K. J., McDonnell, J. J., Weiler, M., Kendall, C., McGlynn, B. L., Welker, J. M., et al. (2005). The role of topography on catchment-scale water residence time. Water Resour. Res. 41:W05002. doi: 10.1029/2004WR003657
McGuire, L., Rengers, J., Kean, J., and Staley, D. (2017). Debris flow initiation by runoff in a recently burned basin: is grain-by-grain. Geophys. Res. Lett. 44, 7310–7319. doi: 10.1002/2017GL074243
Medina, V., Hurlimann, M., and Bateman, A. (2008). Application of flatmodel, a 2d a finite volume code to debris flows in the northeastern part of the iberian peninsula. Landslide 5, 127–142. doi: 10.1007/s10346-007-0102-3
Montgomery, D., and Foufoula-Georgiou, E. (1993). Channel network source representation using digital elevation models. Water Resour. Res. 29, 3925–3934. doi: 10.1029/93WR02463
Navratil, O., Liebault, F., Bellot, H., Travaglini, E., Theule, J., Chambon, G., et al. (2013). High-frequency monitoring of debris flows propagation along the real torrent, southern french alps. Geomorphology 201, 157–171. doi: 10.1016/j.geomorph.2013.06.017
Okano, K., Suwa, H., and Kanno, T. (2012). Characterization of debris flows by rainstorm condition at a torrent on the mount yakedake volcano, Japan. Geomorphology 136, 88–94. doi: 10.1016/j.geomorph.2011.04.006
Orlandini, S., and Rosso, R. (1996). Diffusion wave modeling of distributed catchment dynamics. J. Hydrol. Eng. 1, 103–113. doi: 10.1061/(ASCE)1084-0699(1996)1:3(103)
Reid, M. E., Coe, J. A., and Dianne, L. B. (2016). Forecasting inundation from debris flows that grows volumetrically during travel, with application to the Oregon Coast Range, USA. Geomorphology 273, 396–411. doi: 10.1016/j.geomorph.2016.07.039
Rengers, F. K., McGuire, L. A., Kean, J. W., and Hobley, D. E. (2016). Model simulations of flood and debris flow timing in steep catchments after wildfire. Water Resour. Res. 52:6041. doi: 10.1029/2015WR018176
Rickenmann, D. (1999). Empirical relationships for debris flows. Nat. Hazards 19, 47–77. doi: 10.1023/A:1008064220727
Rosatti, G., and Begnudelli, L. (2013). Two dimensional simulations of debris flows over mobile beds: enhancing the trent2d model by using a well-balanced generalized roe-type solver. Comput. Fluids 71, 179–185. doi: 10.1016/j.compfluid.2012.10.006
Santi, P. M., deWolfe, V. G., Higgins, J. D., Cannon, S. H., and Gartner, J. E. (2008). Sources of debris flow material in burned areas. Geomorphology 96, 310–321. doi: 10.1016/j.geomorph.2007.02.022
Stancanelli, L. M., Peres, D. J., Cancelliere, A., and Foti, E. (2017). A combined triggering-propagation modeling approach for the assessment of rainfall induced debris flow susceptibility. J. Hydrol. 550, 130–143. doi: 10.1016/j.jhydrol.2017.04.038
Takahashi (2007). Debris Flow, Mechanics, Prediction and Countermeasures. Leiden: Taylor and Francis/Balkema.
Tarboton, D. (1997). A new method for the determination of flow directions and upslope areas in grid digital elevation models. Water Resour. Res. 33, 309–319. doi: 10.1029/96WR03137
Tarolli P., and Dalla Fontana G. (2009). Hillslope-to-valley transition morphology: new opportunities from high resolution DTMs. Geomorphology 113, 47–56. doi: 10.1016/j.geomorph.2009.02.006
Theule, J., Liebault, F., Loye, A., Laigle, D., and Jaboyedoff, M. (2012). Sediment budget monitoring of debris flow and bedload transport in the manival torrent, se france. Nat. Hazard Earth Sci. 12, 731–749. doi: 10.5194/nhess-12-731-2012
Thiene, M., Shaw, W. D., and Scarpa, R. (2017). Perceived risks of mountain landslides in Italy: stated choices for subjective risk reductions. Landslides 14, 1077–1089. doi: 10.1007/s10346-016-0741-3
Tiranti, D., Cavalli, M., Crema, S., Comiti, F., Zerbato, M., Graziadei, M., et al. (2016). Semi-quantitative method for the assessment of debris supply from slopes to river in ungauged catchments. Sci. Total Environ. 554–555, 337–448. doi: 10.1016/j.scitotenv.2016.02.150
Tiranti, D., Cavalli, M., Crema, S., and Deangeli, C. (2018). An integrated study to evaluate debris flow hazard in alpine environment. Front. Earth Sci. 6:60. doi: 10.3389/feart.2018.00060
Tiranti, D., and Deangeli, C. (2015). Modeling of debris flow depositional patterns according to the catchment and sediment source area characteristics. Front. Earth Sci. 3:8. doi: 10.3389/feart.2015.00008
Tognacca, C. (1999). Beitrag zur Untersuchung der Entstehungsmechanismen von Murgängen. Doctoral Thesis, ETH Zurich.
Tsubaki (1972). “Keikoku taiseki dosha no ryndo,” in XXVII Japanese National Congress on Civil Engineering.
Wilson, J., and Gallant, J. (2000). Terrain Analysis: Principles and Applications. Newyork, NY: JohnWiley and Sons Inc.
Nomenclature
The following symbols are used in this paper:
A = cell area;
AT = threshold area for channel network;
AB = basin area;
b0 = outlet width;
b1 = morphological exponent;
b0 = outlet width;
c = sediment volumetric concentration of the mixture;
cD = limit inferior sediment volumetric concentration for deposition;
cF = solid volumetric concentration of the debris flow front;
c* = solid volumetric concentration of dry bed;
C = conductance coefficient;
CN = curve number;
d = sediment diameter;
D = deposition rate;
E = erosion rate
fc = infiltration rate
g = acceleration due to gravity;
h = flow depth in a cell;
I = rainfall intensity;
Ia = initial abstraction;
K = Egashira empirical coefficient;
kS = Gauckler-Strickler roughness coefficient;
P = cumulative rainfall;
Pe = excess rainfall ;
PeSCS = excess rainfall computed throug the SCS-CN method;
Q = solid-liquid discharge;
Qp = peak solid-liquid discharge;
Q0 = runoff peak discharge
QS = solid discharge;
S = potential maximum retention
SLMEAN = mean slope;
SLMAX = maximum slope;
tIa = time at which Ia occurs;
U = slope velocity along a possible flow direction;
VLIM = limit superior velocity for deposition (VLIM−D) or erosion (VLIM−E);
Vmax = maximum velocity
z = bed level
zO = basin outlet altitude;
zM, mean basin altitude;
zMAX = maximum basin altitude;
α = angle controlling deposition and entrainment
Δt = time step;
Δx = grid size;
θ = angle respect to the horizontal of the line joining the centers of two neighboring cells of DEM;
θLIM = limit superior angle for deposition (θLIM−D) or erosion (θLIM−E);
Θ = angle respect to the horizontal of the line joining the centers of flow surface of two neighboring cells ;
AMC = Antecedent Moisture Content; CFL = Courant-Friedrichs-Levi; DEM = Digital Elevation Model; GIS = Geographical Information System; LiDAR = Light Detection and Ranging SCS = Soil Conservation Service;
Keywords: survey, multi-temporal topographical data, runoff, debris flow, initiation area, routing, damages
Citation: Gregoretti C, Degetto M, Bernard M and Boreggio M (2018) The Debris Flow Occurred at Ru Secco Creek, Venetian Dolomites, on 4 August 2015: Analysis of the Phenomenon, Its Characteristics and Reproduction by Models. Front. Earth Sci. 6:80. doi: 10.3389/feart.2018.00080
Received: 28 February 2018; Accepted: 28 May 2018;
Published: 13 November 2018.
Edited by:
Davide Tiranti, Agenzia Regionale per la Protezione Ambientale (ARPA), ItalyReviewed by:
Chiara Deangeli, Politecnico di Torino, ItalyFabio Matano, Consiglio Nazionale Delle Ricerche (CNR), Italy
Copyright © 2018 Gregoretti, Degetto, Bernard and Boreggio. This is an open-access article distributed under the terms of the Creative Commons Attribution License (CC BY). The use, distribution or reproduction in other forums is permitted, provided the original author(s) and the copyright owner(s) are credited and that the original publication in this journal is cited, in accordance with accepted academic practice. No use, distribution or reproduction is permitted which does not comply with these terms.
*Correspondence: Carlo Gregoretti, carlo.gregoretti@unipd.it