Remote evaluation of augmented reality interaction with personal health information
 Orit Shaer
 Jennifer Otiono2
  Ziyue Qian
- 1Department of Computer Science, Wellesley College, Wellesley, MA, United States
- 2Department of Information Science, Cornell University, Ithaca, NY, United States
- 3Department of Technology Management and Innovation, New York University, New York, NY, United States
This article discusses novel research methods used to examine how Augmented Reality (AR) can be utilized to present “omic” (i.e., genomes, microbiomes, pathogens, allergens) information to non-expert users. While existing research shows the potential of AR as a tool for personal health, methodological challenges pose a barrier to the ways in which AR research can be conducted. There is a growing need for new evaluation methods for AR systems, especially as remote testing becomes increasingly popular. In this article, we present two AR studies adapted for remote research environments in the context of personal health. The first study (n = 355) is a non-moderated remote study conducted using an AR web application to explore the effect of layering abstracted pathogens and mitigative behaviors on a user, on perceived risk perceptions, negative affect, and behavioral intentions. This study introduces methods that address participant precursor requirements, diversity of platforms for delivering the AR intervention, unsupervised setups, and verification of participation as instructed. The second study (n = 9) presents the design and moderated remote evaluation of a technology probe, a prototype of a novel AR tool that overlays simulated timely and actionable environmental omic data in participants' living environment, which helps users to contextualize and make sense of the data. Overall, the two studies contribute to the understanding of investigating AR as a tool for health behavior and interventions for remote, at-home, empirical studies.
1. Introduction
In this article, we surmise a near-future scenario where “omic” data (i.e., genomes, microbiomes, pathogens, and allergens) is ubiquitously available. Samples from people's bodies and surroundings, as well as from the plants and animals people interact with or consume are easily, rapidly, and inexpensively analyzed and visualized so that the presence of “omic” data in everyday environments is available to non-expert users. Currently, consumer-based DNA testing can analyze “omic” data from samples collected by users (Burns et al., 2016; Cha, 2022; HEL, 2022). Many initiatives have been taken to collect, sequence, and present microbiome information from the home environment (Bonanni et al., 2005; Barberán et al., 2015; WIL, 2020), to the city environment (PAT, 2015; MET, 2022), to the ecological environment (EAR, 2022). The presentation and interpretation of the data to the public may impact lifestyle decisions (e.g., change in diet, cleaning habits) and the well-being of users, as well as of their family members, cohabitants, or local community members. Home testing kits exist today with results delivered online to users within a few weeks after a sample is collected from their body, pet, or home surface and sent through the mail. There are many commercial kits available for detecting an array of at-home allergens and pathogens, including uBiome (bacteria on surfaces), Eurofins (fish), Neogen (gluten), DoggyBiome (pet gut health), and EDLab at pure air control services (dust mites). Furthermore, trends in the DNA sequencing market (Burns et al., 2016; BIO, 2022) suggest that rapid, real-time omic information for residential and mobile settings would become increasingly affordable. Already, the COVID-19 pandemic has accelerated the use of virtually guided, reliable, affordable at-home testing for health purposes where the results are delivered to users in minutes (CUE, 2022; EVE, 2022).
With the increasing availability of omic data for non-experts, there is a need for supporting the understanding of such data within the context of personal health and wellbeing (Shaer et al., 2017). Existing research shows the potential of AR as a tool for communicating personal health information that influences behavior and perceptions related to health. For example, previous research suggests that AR can lead to a user taking on the role of the character in a narrative (Javornik et al., 2017; Hoang et al., 2018), increase a sense of spatial presence (Jung et al., 2019), change one's perception of physical sensations (Yuan and Steed, 2010), and influence perceived threat susceptibility, severity, negative affect, and behavioral intentions (Jung et al., 2019; Seals et al., 2021). We discuss and build on the theoretical foundation for the potential of AR within the areas of personal health.
As AR applications grow in popularity and their use expands to areas such as personal health information, there is a pressing need to evaluate AR systems “in the wild” (Rogers and Marshall, 2017) often remotely (Otiono et al., 2021). Conducting remote AR studies has the potential to reduce bias, increase generalizability, lower barriers to participant recruitment, and facilitate robust studies and analysis methods that require large sample sizes (Pratap et al., 2020; Ullman et al., 2021). While prior research has found remote study findings to be similar to the in-lab studies (Tullis et al., 2002; Nussenbaum et al., 2020), other challenges regarding remote studies persist. A survey of XR researchers (Ratcliffe et al., 2021) revealed concerns regarding how to verify participant precursor requirements, populations of those who own XR equipment being different from the general population, limited available computational power, unsupervised setups, loss of non-verbal feedback, the difficulty of collecting honest qualitative feedback, potential cheating, and distracted participants. An expansion of tools and methodologies for remote AR research that address these issues are of great interest.
Building on the potential of AR to impact human behavior by visualizing invisible health information, as well as the need to explore remote research methodologies, this article presents two remote AR studies which evaluate the use of AR for health information. In these studies, we utilize AR to make the ‘invisible' visible to impact emotional, knowledge-based, and perceptual predictors of behavior change. Taken together, the two studies demonstrate new and different approaches for remote testing of AR tools within a user's home environment or personal space.
In Study 1, we describe a between-subjects non-moderated web-based experiment to assess how layering graphic pathogens on an individual impacts risk perceptions and behavioral intentions. The web application functioned similarly to common social media AR filter features used in Snapchat, Instagram, and TikTok (refer to Figure 1). The study utilized a mid-fidelity prototype, deployed online and tested by participants recruited from an online marketplace platform (prolific, n = 355). While quantitative findings from this study were presented in Seals et al. (2021), here, we focus on the experimental design, methods, and lessons learned.
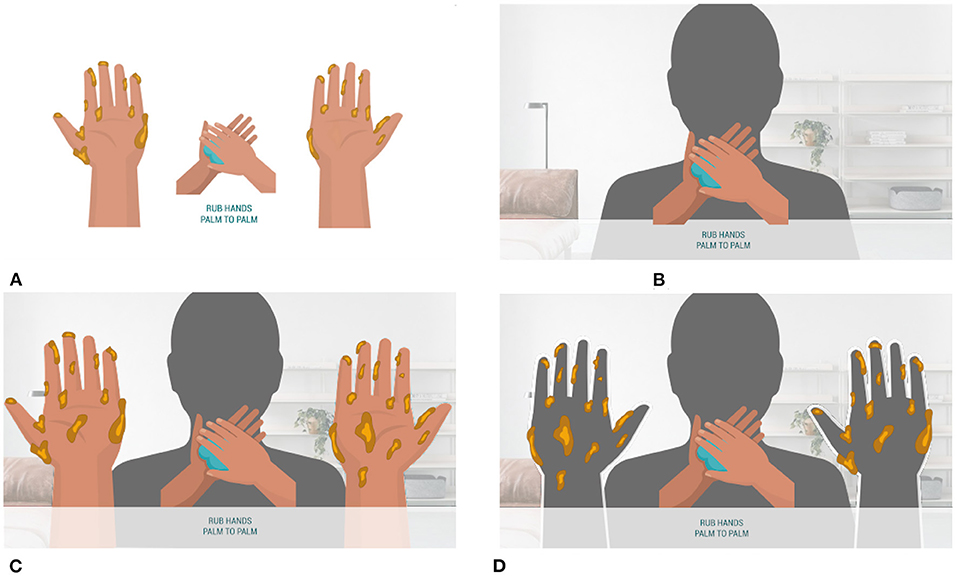
Figure 1. The goal of study 1 was to investigate the effects of self-focused AR on behavioral intention and perception. (A) The reinforcement condition displayed a handwashing animation in addition to animation with germs disappearing from a pair of illustrated hands as the handwashing animation progressed. (B) The self-focused AR condition displayed the handwashing animation layered on top of the viewer's reflection. (C) The avatar condition included an animation showing germs disappearing from a pair of illustrated hands layered on top, with the user's reflection in the background. (D) In the self-focus AR x reinforcement condition, as the handwashing animation progressed, participants saw germs disappear from the reflection of their own hands.
In Study 2, we present the design and remotely moderated evaluation of a technology probe for an AR application that overlays simulated timely and actionable nutritional and environmental omic data in the living environment, which aims to help users to contextualize and make sense of the data (refer to Figure 2). The study utilized a technology probe approach (Hutchinson et al., 2003) by deploying a low fidelity prototype in participants' home kitchens, which was evaluated over two repeated moderated sessions with a small sample size (n = 9) recruited from university students. The data collected and findings are qualitative and nuanced. Findings from this study have not been published elsewhere.
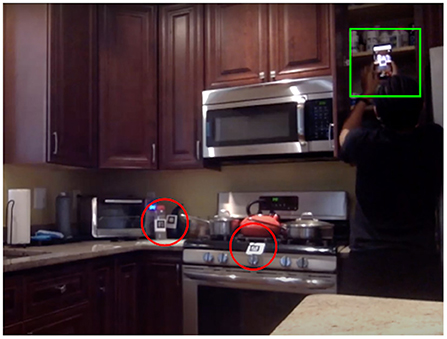
Figure 2. User study in a participant's own kitchen (markers circled in red, user scanning a marker squared in green).
We chose these two studies because they highlight two important aspects of how AR can be applied in public health: communication of scientific information to non-expert users and how visualizations overlayed the environment and on the self can impact personal health perceptions. These studies were conducted during the COVID-19 pandemic, a time when personal and public concerns for health have become more pronounced. These studies demonstrate the potential of AR as a medium that encourages non-experts to assess health risks using the affordances of immersive design that has been shown to impact health perceptions (Regenbrecht et al., 2011; Jung et al., 2019; Ku et al., 2021; Seals et al., 2021). While study 1 visualizes omic information to users on their personal bodies, study 2 overlays omic information to users on the personal environment of the kitchen. Together both studies extend the domains in which omic information visualization can be impactful. The results of these studies can inspire the designs and development of behavioral health design intervention strategies.
The contributions of this article are 2-fold: presenting design interventions for communicating personal health information for non-experts using AR, and developing and testing new methods for remote evaluation of AR technologies that go beyond the assessment of a system's usability to study how AR interventions could impact the perception and behaviors of users. Such in-depth evaluation methods are particularly important in the realm of health information since design decisions related to what and how information is displayed to users could influence their health beliefs and resulting action, or lack of action. By introducing a framework for considering design choices for remote AR studies, we share lessons from conducting remote evaluations and identify concerns that arise in such context regarding participants' technical preparation, privacy, and surveillance.
While our studies are conducted in the context of consumer health informatics AR applications, the findings may be of interest in other areas as we tackle issues of designing remote non-moderated and moderated studies, surveillance and privacy, and the implications of layering sensitive content within a user's view. The remainder of this article covers related work, followed by descriptions of two case studies, including methods, findings, and lessons learned from applying new remote evaluation techniques.
2. Background
This article investigates methods to study AR as a health communication tool. First, we discuss literature that relates to the influence of presence and embodiment on perception and affects, discussing the topics as a theoretical foundation for the potential of AR within areas of personal health. Second, we discuss literature presenting limitations of the generalizability of AR health research stemming from the limited methodologies available for AR research. We use existing literature to highlight opportunities and frame our development of novel AR research techniques.
2.1. Presence and embodiment impact on health behavior
Augmented reality has the potential to be a powerful health behavior tool. Prior literature suggests that health communication overlaid on an individual's space or body may impact emotional, knowledge-based, and perceptual predictors of behavior change (Slater, 2003; Kilteni et al., 2012; Breves, 2021). The layering of health information in this manner can initiate two major influential mechanisms of AR: presence and embodiment. Presence is defined as the subjective perception of being a part of an experience (Slater, 2003). A sense of embodiment is the extent to which properties of an artificial body are processed as if they were properties of a user's biological body (Kilteni et al., 2012). A relationship between feelings of spatial presence and changes in perceptions has been observed in empirical studies (Breves, 2021). Breves (2021) found high technological immersiveness and higher levels of spatial presence to result in participants believing that the displayed content was more credible and to be more supportive of the message.
Previous study has explored why presence and embodiment may impact a user's perceptions. Ma (2020) found that experiencing immersive virtual environments results in a higher level of spatial and social presence, enhancing users' transportation and identification. Transportation is the cognitive process where mental systems become focused on events occurring in the narrative (Green and Brock, 2000). Identification is an emotional and cognitive process where the user takes on the role of the character in a narrative (Moyer-Gusé, 2008). AR provides the opportunity for users to feel as if they are another character in a narrative. High levels of presence, as a result, may decrease one's ability to engage in critical thinking (Bracken, 2005; Ma, 2020), potentially impacting perception by biasing cognitive processing (Breves, 2021).
The effect of identification has also been observed in AR studies. Self-focused AR, where digital content is layered on the body vs. one's environment, is found to influence users to play out a role or alternative version of themselves (Jacobs et al., 2019). In an investigation of the extent to which an AR mirror can create an illusion of becoming another person, Javornik et al. (2017) found participants to easily and often immediately feel like characters displayed to them. The connection between AR content and users' perception has even been observed to impact how they experience their own physical body. Hoang et al. (2018) found that using the body as a canvas for internal functions (the display of one's heart rate and muscular and skeletal system) connected participants to what was projected on their body. This was experienced to the extent to which an elevated heart rate (visualized as a rapid heartbeat) caused participants to feel as if their heart rate actually increased. Similarly, a few studies have explored the impact of Virtual Reality (VR), Augmented Reality (AR), and Mixed Reality (MR) on the perception of physical sensations experiences, creating virtual versions of the rubber hand illusion. The rubber hand illusion takes place when a rubber hand replaces an individual's hand that has been moved out of view. Subjects often report that when the fake hand is stimulated (touched), it feels like it is happening to the subject's body (Botvinick and Cohen, 1998). IJsselsteijn et al. (2006) tested this illusion in both Virtual Reality (hand and stimulation were projected) and Mixed Reality (hand was projected and stimulation was real) finding that the use of a real rubber hand and stimulation was more effective in producing the illusion that the subject had been touched than the VR and MR conditions. No difference was found between VR and MR. However, in this experiment, the VR/MR hand was flat vs. 3D. Also testing the rubber hand illusion in VR, Yuan and Steed (2010) hypothesized that if the virtual display matched the participants' visual and proprioceptive experience, it would produce an illusion that the virtual arm is attached to their body. Their findings supported this theory as the virtual hand condition had a significant response to a threat presented to the hand in comparison to the control where the hand was replaced by an arrow. A comparison of the studies by IJsselsteijn et al. (2006) and Yuan and Steed (2010) highlights the impact of the specific VR/AR/MR experience design to influence the user's perception.
2.1.1. Affect, perception, and health behavior
Augmented reality layers digital content within the physical world, sometimes, to a degree, influencing changes in a user's perception and emotions. Changing one's affective experiences and perceptions to alter one's behavior could be an effective strategy for health communication efforts. In a study evaluating affective, cognitive, and overall evaluations of 20 health behaviors, Keer et al. (2010) found that the influence of affective evaluations was direct for each of the behaviors, whereas cognitive evaluations were partially direct and partially mediated by overall evaluation. The researchers suggested that affect evaluation should be included as a direct determinant of intention. This study shows the impact of affect on behavior change. While AR was shown to influence affect, in a study based on the Extended Parallel Process Model (EPPM), Rhodes (2017) found that messages of medium negative intensity (compared to high or low intensity) were more persuasive in increasing behavioral intentions to drive slower. In addition, compared to low and medium negative intensity conditions, those in the high negative intensity group produced less message-related thoughts and more emotional thoughts. Given the immersive nature of AR, it may be important to avoid designing an experience that increases negative emotions to a point that it acts as a force against behavior change mechanisms. More research is needed to identify what type of AR content heightens negative affect to adverse levels.
2.1.2. AR interventions for personal health
Several studies have been conducted to develop AR applications and assess their potential in addressing specific areas of personal health. Poh et al. (2011) developed a smart mirror that detects and displays a user's heart rate. Ku et al. (2021) found the AR game, Pokemon-Go, to promote mental and physical health as its game design and AR functionality encourage the formation and maintenance of social relationships and outdoor physical activity. Empirical studies have evaluated the impact of self-focused AR (layering health risks onto the body) on health risk perceptions, finding an increase in perceived threat susceptibility, severity, negative affect, and behavioral intentions when compared to control conditions (Jung et al., 2019; Seals et al., 2021).
The optical mirror box is a therapeutic device that reflects a user's healthy limb to visually replace a stump limb or one going through rehab to treat pain through visual perception. Regenbrecht et al. (2011) developed an augmented mirror box, using AR in the replacement of mirrors and enabling the augmentation of the background. Experimental results supported the altered perception of hand ownership. Other studies have explored AR for rehabilitation. Mousavi Hondori et al. (2013) presented a spatial AR system for rehabilitation in which patients practice hand gestures used in everyday activities while allowing for the assessment of parameters such as range, speed, and smoothness. A pilot study showed potential for future utilization and further development. Regenbrecht et al. (2011), developed an AR game to assist in treating unilateral motor deficits of the arm by visually enhancing the user's hand movements. An evaluation of the system with 45 non-clinical participants validated the system's usability.
Augmented reality has also been explored as a potential tool to support “mental practice”. Building off of studies in neuroscience suggesting that “imagining” a motor action involves the same brain areas as actual performance, Gaggioli et al. (2005) developed an AR system to help individuals who have trouble with mental simulation develop the practice. Lee and Lee (2018) proposed the use of AR within the field of personalized nanomedicine to address medication adherence, medication addiction, and surgical navigation. For example, in addressing addiction they suggest using AR for signal-reactivity therapy, to create a realistic environment that would trigger the signal(s) the individual is being trained to react differently to as part of their treatment. Riva et al. (2016) positioned AR as a tool to support personal change through experiential learning, as it can recreate scenarios where change is needed, and create an environment where one can practice making adjustments in their thinking until the behavior change becomes more natural.
The research we discussed above demonstrates AR's potential to change human behavior by visualizing the invisible, whether to visualize something naked to the human eye or to enable an individual to practice appropriate responses to simulated objects. The possible applications of AR for personal health and wellness are vast and are only in their early stages of exploration. Further research in this field could help with developing interventions for real-world use and informing theories in areas of cognitive science, psychology, communication, and human-computer interaction. An important outcome of personal health AR studies is an increased understanding of the role of external and self-focused presence, and embodiment in information processing. However, methodological challenges pose a barrier to the extent to which AR research can be conducted. We discuss these challenges and potential solutions in more depth in the following section.
2.2. Challenges and potential of remote XR research methodologies
Mathis et al. (2021) highlighted two major areas of XR (extended reality) research: (1) Pure XR Research and (2) XR as a Proxy for Real-world Research. Pure XR research investigates XR interactions, such as how one interacts with the AR device or the designed AR experiences. For example, how voice controls might impact an AR experience. XR as a Proxy for Real-world Research investigates real-world systems that are difficult to access, using XR. For example, Mäkelä et al. (2020) found virtual public displays in VR to result in similar user behaviors compared to real public displays. Both Pure XR Research and XR as a Proxy for Real-world Research are typically conducted in lab settings, and while remote XR research is less common, its utilization would benefit both areas of research.
Our focus is specifically on remote research with AR technologies. For Pure AR research, remote research methods could potentially increase the diversity of study participants, reduce biases, and address generalizability issues attributed to lab studies by formulating insights specific to real-world scenarios. This is also true for Proxy for Real-world Research if the end goal is to deploy the AR application for real-world use. Remote studies could lower barriers to participant recruitment (Reinecke and Gajos, 2015), allowing for more robust studies and analysis methods that require large sample sizes. Remote AR studies could be deployed through marketplace crowdsourcing platforms such as Prolific and MTurk for recruiting users that have access to the required technologies. Finally, remote AR studies allow research to occur where face-to-face studies are not feasible or even impossible. This was often the case for researchers this past year as the COVID-19 pandemic led universities to prohibit in-person research. Ratcliffe et al. (2021) found COVID-19 to have negative implications on VR/AR research as it resulted in research suspensions, recruitment difficulties, and challenges reducing the likelihood of viral transmission in in-person studies. During this time, there was an increase in discussions around remote evaluations of AR (Alexandrovsky et al., 2021; Ratcliffe et al., 2021), early research to develop new AR evaluation methodologies (Ghasemi and Jeong, 2021), and non-moderated online AR research (Seals et al., 2021; Zhao et al., 2021).
Transitioning lab-based studies to remote settings poses new challenges and opportunities. Given the less controlled environment of remote studies, the first concern to address is the quality of their results. Comparing results of three interface usability studies conducted both in the lab and online each, Komarov et al. (2013) found that unsupervised studies using Amazon MTurk did not produce different results than the supervised lab studies. Reinecke and Gajos (2015) tested the results of in-lab studies and remote, unsupervised, uncompensated studies. They found the findings of remote testing to be similar to the in-lab study when tested with participants in a similar age range as the original experiment. When including a wider sample, responses had a wider distribution and researchers suspected that some participants may have been distracted or selected random answers, which was confirmed by feedback collected from participants. More research is needed in the area of remote studies to further identify types of studies that may differ from in-lab comparisons, as well as to develop methods to counter the occurrences of distractions.
In a qualitative questionnaire, Ratcliffe et al. (2021) identified that while XR researchers recognized the potential benefits of remote studies in regards to larger sample size and less set-up time, concerns were raised regarding how to verify participant precursor requirements (i.e., visual acuity and stereo vision) and generalizability of studies if the participants who own XR equipment are different from the general population. In addition, concerns regarding remote studies included limited available technologies (computational power) and biometric measures (EEG, ECG), unsupervised setups, loss of non-verbal feedback, and general difficulty in collecting honest qualitative feedback. Potential issues regarding the experimental process included lack of guidance for the participants, potential cheating, distracted participants, lack of calibration abilities, and potential unknown/missed errors.
To date, remote XR studies are an emerging area of interest, and researchers have begun sharing experiences and lessons from remote XR studies. For example, Zhao et al. (2021) conducted an AR study using a mobile environment. Participants ran the experiment applications on their own devices in their local environments. Participants were instructed to send the experiment data to the researchers as email attachments. While this experimental set-up allowed the researchers to collect the data needed for their experiment, they noted that differences among the devices (such as screen size) may have affected the results. In addition, they noted that they had no control over the real-world environments of their participants, so differences such as whether the experiment was completed indoors or outdoors could have impacted the results. Ch et al. (2021) shared lessons from a longitudinal 9-week experiment where participants completed a VR session daily. They reported lessons on the feasibility of participant-compliant longitudinal experimental designs, with recommendations for best practices to accomplish low attrition rates and high fidelity data.
The following sections describe two novel methods we used in recent remote AR studies followed by a discussion of the lessons learned.
3. Methods
3.1. Study 1: An internet study for evaluating the impact of self-focused AR on perception, affect, and behavior intentions
3.1.1. Overview
Study 1 investigated the impact of self-focus—seeing oneself in the background, and reinforcement—visualizing the cause and effect of risk-mitigating behavior, layered onto one's reflection, on psychological predictors of behavior change during the COVID-19 pandemic. Based on objective self-awareness theory (Bandura, 2009) and social cognitive theory (Duval et al., 2012), we hypothesized that a self-focused AR design intervention could impact risk perceptions and emotions.
In this study, we conducted a web-based unmoderated between-subjects experiment (n = 355). We collected data during the COVID-19 pandemic on August 6–21, 2020, to explore the relationships between self-focused AR, health perceptions, and hand hygiene behavior intentions. We developed a mid-fidelity web-based prototype that utilized a participant's web-camera to deliver an experience like Snapchat and TikTok AR filters. Using the app, we tested various design features to (1) explore the impact of mirror self-focused attention and various reinforcement (reinforcement that occurs from observing others' behavior and the results) individually (Figures 1A,B), and (2) explore the impact of combining the two by visualizing the cause and effect of risk-mitigating behavior layered onto one's reflection (Figures 1C,D). The theoretical foundation and methods are described in detail in Seals et al. (2021).
3.1.2. Method
The study consisted of four phases:
1. Recruitment and setup.
PRO (2022), a crowdsourcing platform, was utilized to recruit, compensate, and direct participants to our web experiment application. Prolific members were first invited to a pre-screener that verified access to an acceptable browser and that camera permissions worked properly. Those who passed the screener were able to access the main study. Only those residing in the United States, who spoke fluent English, and were ≥18 years of age were provided access to the study.
2. Online experiment web application.
In the web application, all conditions displayed the same information about COVID-19 as described by the U.S. Centers for Disease Control and Prevention (CDC, 2020), followed by a hand hygiene animation detailing the steps of proper hand hygiene as described by the WHO (2021). The animation differs based on the participant's assigned condition as described in Figure 1, with it varying in the inclusion of self-focused AR and/or germs disappearing from the user's reflection or human representation. The web application was accessed via desktop (vs. participants using headsets) to enable users to use their hands and to improve the accessibility of the study to meet the sample size needed for the statistical analysis.
3. Post-study questionnaire.
After watching the animation, participants filled out a questionnaire (Table 1) measuring self-reported perceptions of COVID-19, fear, message minimization, behavioral intention, and collecting demographic data. Measures were adapted from Schwarzer (2008), focusing on health perceptions and behavior, and Li (2018), covering fear control mechanisms that negate health communication efforts. Items in this study were all measured on a 7-point Likert scale.
4. Verification and statistical analysis.
To ensure that participants' reflections were being displayed back to them, we informed participants that their screenshots would be captured during the session. The screenshots were vetted and only those who passed this verification were included in the final dataset. The same method was used to verify that those in conditions that required specific hand positions followed the instructions provided. We also included questionnaire items about the content to check if people paid attention during the animation. Out of the 502 individuals that participated in the study, 335 participants met the attention and screenshot checks and were included in the analysis.
Histogram and Shapiro-Wilk test showed that the data were not normally distributed [Shapiro-Wilk P values ranged from 6.35e-08 (efficacy) to 1.927e-25 (intention)], so hypothesis testing was conducted with nonparametric Wilcoxon-Mann-Whitney tests. If condition pairs had the same distribution shape, medians were compared. However, if the shapes were different, the mean ranks were compared. In addition, we tested mediation models for dependent variables and design conditions with significant findings with a bootstrapping method using PROCESS macro Models 4 and 6 (Hayes, 2018), 5,000 bootstrap samples, and percentile bootstrap confidence intervals (CIs). Significance was established at P < 0.05.
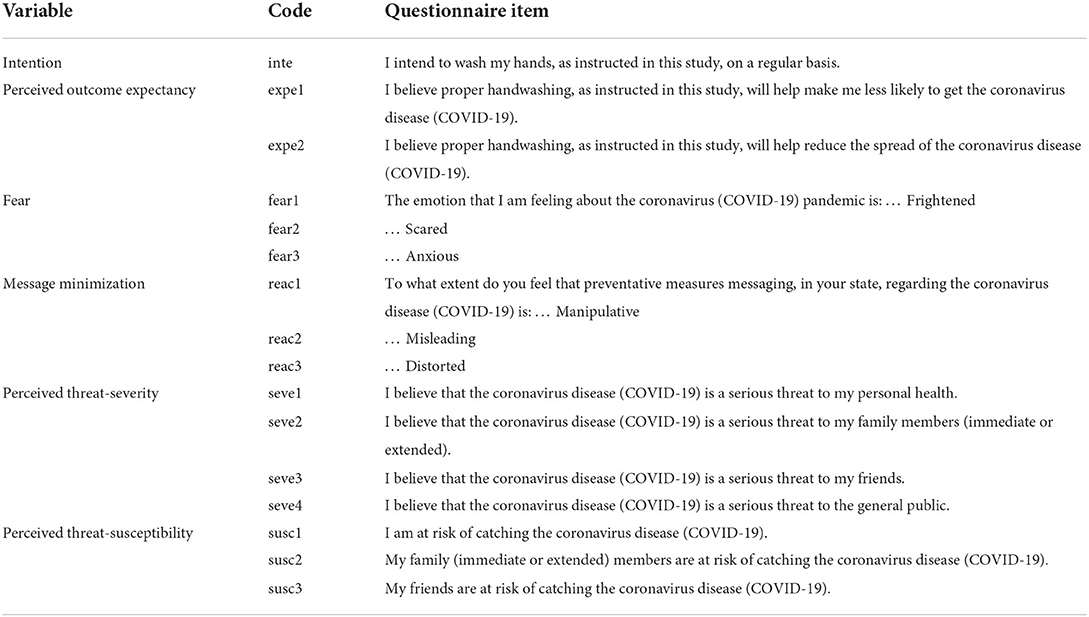
Table 1. Study 1 questionnaire items.
3.1.3. Results
Here, we present an overview of our findings. The results are described in detail in Seals et al. (2021). In summary, layering germs directly on a user and having the germs disappear in response to proper hand hygiene resulted in higher levels of behavioral intentions through increased perceived threat severity and susceptibility. Despite its impact on increased levels of fear, self-focus AR x reinforcement did not result in message minimization.
With significance established at P < 0.05, the behavioral intention was not significantly different between design conditions. However, when comparing the self-focused AR x reinforcement (condition d) to the control condition, we found significantly higher levels of perceived threat susceptibility (Mann-Whitney U = 1,897.0, P = 0.01) and severity (Mann-Whitney U = 1,983, P = 0.03). We found an effect of self-focused AR x reinforcement on intention when the model includes both perceived threat susceptibility and threat severity as serial mediators (b = 0.06, 95% CI = [0.02, 0.12], SE = 0.03). We found a significant indirect effect of self-focus AR x reinforcement on fear when both perceived threat susceptibility and threat severity were included as serial mediators (b = 0.15, 95% CI = [0.05, 0.28], SE = 0.06). An investigation into whether the condition also resulted in message minimization (beliefs that the information was misleading or distorted) due to its impact on fear (as warned by the Extended Parallel Process Model; Witte, 1992), revealed a negative effect of self-focus AR x reinforcement on message minimization with severity and susceptibility as the serial mediators (b = –0.07, 95% CI= [–0.16, –0.008], SE = 0.04).
3.2. Study 2: A moderated at-home study for evaluating an AR app for visualizing omic information in the living environment
3.2.1. Overview
In study 2, we conducted an exploratory moderated remote at-home study between August and December 2020 (n = 9). A total of 16 users began the study but only 9 completed the entirety of the study. The study observed participants using a technology probe for an AR app that overlays omic information, such as allergen detection and microbial composition of surfaces in users' kitchens. To create our technology probe, we designed and implemented an AR mobile application, which overlays faked omic information onto the real-world environment.
The purpose of this qualitative study is to understand the implications of displaying omic data in users' own home environments on users' awareness and curiosity of health habits and potential risks, as well as a potential driver for behavioral changes.
3.2.2. Technology probe
We designed a technology probe (Hutchinson et al., 2003), a mobile web app inspired by the vision of making pervasive yet invisible omic data visible within everyday living environments. We aimed to foster curiosity through inquiry by allowing users to explore their living space through physical and spatial interaction (e.g., opening doors, moving items). The application utilizes the AR annotation method, defined as “virtual information that describes in some way, and is registered to, an existing object” (Wither et al., 2009). For example, we used visual annotation to indicate the presence or absence of common allergens, as well as the identification of particular food ingredients (Figure 3). All the data presented to users was faked and based on data collected using different tests in our laboratory kitchenette.
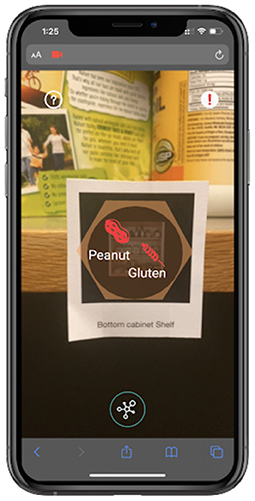
Figure 3. Close-up of a marker from the application that shows AR information (what the mobile app shows in Figure 4).
The application displayed three different types of omic data: identification, detection, and composition. Identification data is generated for samples collected from living organisms (e.g., pets, houseplants) as well as animal- or plant-based food items (e.g., fish or spices). Detection data is produced from samples of food or samples collected from surfaces, such as allergens, pathogens, and pests. Composition data is available for samples collected from surfaces, which can reveal information about the taxonomic composition of bacteria types in a given sample, such as environmental microbiome reports.
We built a web application using A-FRAME and AR.js, which allowed users to access the app through their smartphone web browser. AR.js's ability to detect pre-determined images to be used as markers (Figure 3) allowed users to easily set up their kitchen as a study environment using a set of 24 markers provided by the researchers. Users placed the markers on top of appropriate objects (e.g., cutting board, shelf, counter) in their kitchens (Figure 4).
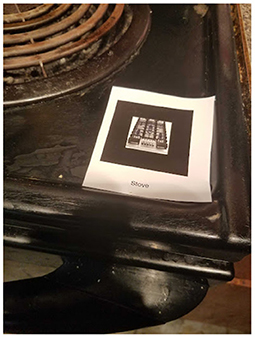
Figure 4. Close-up of a marker (circled in red on Figure 2).
3.2.3. Method
The study consisted of three phases:
1. Recruitment and setup
Participants were recruited through mass emails sent to the researchers' university, where they signed up through an online survey. Participants were screened based on their location (selected only participants who reside in the U.S. for mailing purposes) and their living environment (selected participants who have access to a home kitchen). Once participants receive the 24 markers mailed to them by researchers, they were expected to follow instructions for preparing their kitchen as a study space by placing stickers on designated objects and surfaces.
Prior to the first study session, we emailed participants a manual document to help them understand what to expect and how to prepare for the study. The manual included a link to a video tutorial that explained what omic data is and how to use the application, such as what the different colors and icons mean on the information page (Figure 5). The manual also included setup instructions for participants to place the sticker markers around their kitchen, as well as information about how to download Zoom and screen-recording applications that will be needed for the moderated study.
2. Online moderated study sessions
We conducted two separate moderated Zoom study sessions that were held 3–5 days apart with each participant. The first session lasted 18.75 min on average (SD = 8), during the session participants used the mobile AR app to explore omic data in their kitchen using 12 out of 24 image marker stickers. The second session lasted 19.1 min on average (SD = 7.2). In this session, participants used the app to explore their kitchen using all 24 markers. There was no time limit for the study; instead, the study stops once users have explored all data samples. The application presented updated data on the 12 samples that were also explored during the first session, in order to simulate time passing; for example, the freezer shelf indicates detection of mold during the first session, but the second session indicates no detection of mold to simulate adaptation of cleaning habits.
In both sessions, researchers instructed participants to explore their space using the AR app prototype using a “think-aloud” protocol in which participants express any thoughts, questions, or insights that come to mind (Figure 2).
Following each session, we conducted a debrief with participants asking about their experiences. After the first session, we asked users about their initial impressions of the prototype (Q1–Q4 in Table 2); after the second session, we focused on their experience during both sessions, as well as asked questions to assess their perceived understanding of the omic information they explored, and the perceived usefulness of the app for exploring omic information in their living environment (Q5–Q11 in Table 2).
3. Recordings Collection
Participants screen-recorded and audio-recorded the sessions from their own mobile phones so researchers can analyze what they were seeing and speaking during data analysis. We also recorded the session and the debrief via zoom. After the study was complete, participants emailed their recordings to researchers.
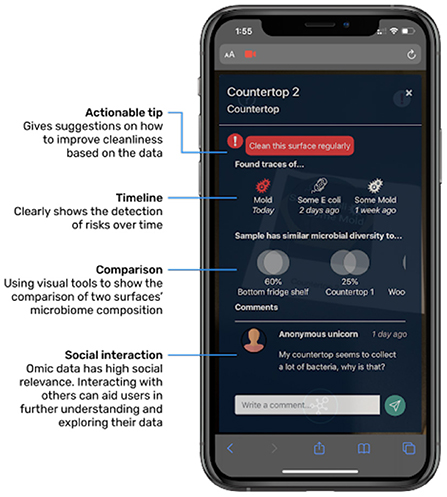
Figure 5. Information page that appears about the data sample once the user clicks on the AR info from Figure 3.
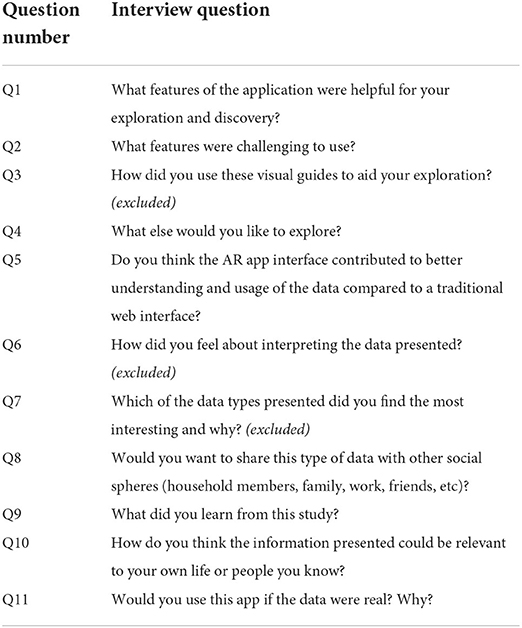
Table 2. Study 2 interview questions.
3.2.4. Participants
The entire study took about 2 h to complete in total, and participants were compensated with a $30 Amazon gift card. There was a total of 9 participants, 100% (9/9) of the users are women. Other information such as age, race, and ethnicity, and education level were not collected, which is a limitation regarding diversity and inclusion.
3.2.5. Data analysis
All participant interactions were screen-recorded on their mobile phone, video-recorded through the Zoom meeting, and audio-recorded using participants' phones.
We conducted a thematic analysis by Braun and Clarke (2012) to analyze the qualitative data. We used Google Docs and Spreadsheets to organize the data and assist with coding. Each participant's 11 post-task interview questions (Table 2) were recorded on Zoom and transcripts were corrected based on Zoom's automatic audio transcription. Two researchers read the transcripts separately identifying advanced categories based on frequency. Based on these themes, we created a codebook with operational definitions and examples for each tag. Out of the 11 interview questions, we used 8 questions to identify a total of 28 tags. Answers to Q3, Q6, and Q7 were excluded because they were not directly relevant to the research question. Inter-coder reliability was established based on 88% of the data with 84% agreement. Afterward, codes were collated into emerging themes.
3.2.6. Results
Our results from study 2 provide qualitative insights into how simulating omic data in users' living environments impact their awareness and curiosity of health habits and potential risks, as well as the potential for behavioral changes.
3.2.6.1. Awareness
In response to the interview question, “What did you learn as a result of this study?” (Q9), 6 users expressed increased awareness of their health habits. They were surprised to realize that there were unexpected places to clean and potential risks in their kitchen, which indicated that interacting with the simulated data in a situation caused them to reflect on their personal health behavior. One user reflected on their cooking habits: “I cook a lot and it's interesting to think of how much of a breeding ground one's kitchen space is. And how different spaces have different vulnerabilities based on how they're used and how heavily trafficked it is, or how much, how many items are shared within another space.” Another participant reflected on how they could overlook health issues in their living environment: “I personally never would have thought that E. coli would be in my house[…] it could definitely exist, but you don't think about it very often. If something is kinda dirty then you would just clean it, and you would look at the ingredients sometimes on packages and say 'oh ok this might have some peanut' but you often don't think too much about it.”
All users (9/9) reflected that the AR app contributed to a better understanding than if they were to view the information on a traditional web interface (Q5). Sixty-six percent (6/9) shared that the AR app was more helpful because it felt more personalized and intimate, where they can directly locate the omic information in their kitchen context. One user reflected: “Definitely [more helpful]. I think one [reason] was like the mobility and to be able to sort of see these items in their place. And to navigate your kitchen and click on things. The interactivity. So all of that is much better than just sort of looking at a relatively static web page. Or even if it was a more interactive web page, you know, it's still you at your desk as opposed to seeing an overlay on actual things in your kitchen.” This indicates that the intimacy of viewing information displayed in users' own kitchens contributes to users' increased awareness of their personal health behaviors.
3.2.6.2. Discovery and insight
In their home environment, participants were able to gain valuable insights into the domain of omic information. The application presented composition omic data by illustrating how similar two samples were in their microbial diversity, and 44% (4/9) of the users reflected that they learned more about microbial diversity or relationships between surfaces (Q9). One user who has not encountered microbial diversity data previously was able to learn how to understand and apply it to their understanding: “I think the Venn diagrams [composition data] were the most interesting because you have the connect[] between two places. And it kinda makes you think about how you move around in the kitchen, and what might be contaminating other things. And just how things are spreading unconsciously. Like you might just be using the countertop and you go to the cabinet, but it never occurs to you that things could be transmitted at that time.” From a simple representation of composition data through converging circles similar to a Venn diagram, the user gained insight into how microbial diversity can be useful in understanding invisible aspects of their health behaviors.
Another user developed their own method of exploring the information presented and arrived at new insights about omic data and their health habits. They discovered salmonella on a surface (detection omic data), and related this surface's microbial diversity (composition omic data) to the bottom fridge shelf to find out where the salmonella came from: “When I saw something similar to the bottom shelf, then I went to the bottom shelf. And I asked whether there is a particular contaminant that's causing this? So that was interesting. I think it also shows how easily things are cross-contaminated[…] at the sink I think when I saw salmonella there, or E. coli, I thought that you tend to clean or cut chicken in your sink because you assume that's where it's going to be contained.” This demonstrates that users were able to utilize the tool to connect different types of data and to gain further awareness of how the presence of certain omic data is impacted by their behavior.
3.2.6.3. Application to personal life
The at-home settings allowed participants to relate the simulated data to their personal life. When we asked the participants how they think it could be relevant to their own life (Q10), 100% (9/9) mentioned it could help them improve basic hygiene and 77% (7/9) shared it could help them avoid allergens. For example, one user said: “It says some mold was traced today. Not surprising because we never clean the freezer. No salmonella, well we didn't cook fish today, or eggs.” While we explained in the pre-study tutorial that all the data would be simulated, this user related this simulated data to their real-life behavior and speculated how and why particular omic data was presented. Another participant reflected on the microbial similarity and simulated cross-contamination between the wooden cutting board and plastic cutting board: “My impression is that the wood is porous and that a lot of juices can seep into it, and the plastic cutting board is easier to clean. and intuitively you store the cutting board in the same places, but maybe you should store them separately.” The simulated microbial similarity in the two cutting boards motivated the participant to reflect on their behaviors in real life.
In addition to relating omic data to real-life behaviors, the at-home setting also led users to speculate ways that they would use the technology probe in real life with others to solve collective problems. In response to Q11, 88% (8/9) of users said they would use this app if the data were real, and 100% (9/9) of users said they would share this information with others in the household. For example, one user commented on how it would directly benefit their family member: “[the] top cabinet shelf has some dust mites. My brother is actually allergic to dust, so that would be cool if he could just pinpoint where it's exactly from to avoid an allergic reaction.” The user's setting in their personal space led them to ideate realistic scenarios, demonstrating their engagement with omic data throughout the study. Another participant reflected that this tool can aid social interactions and public environments: “Like I have roommates and if just one person needed others to be careful about something, then it could quickly educate somebody who has never had to pay attention to any of this before. So I could also imagine it being used in a classroom or another shared space if someone had to be brought up to speed quickly to learn about how allergens can be spread into spaces.” The user began to ideate how this tool can benefit people in shared environments, demonstrating how the technology probe has potential in investigating collaborative interactions.
4. Discussion
We presented two studies that explore how AR design interventions can affect users' understanding of environmental omic data.
In study 1, we described an asynchronous between-subjects experiment. The results showed that the self-focused AR condition that layered behavioral reinforcement directly on one's skin had an impact on behavioral intentions only when mediated by risk perceptions. These results suggest that design strategies that layer a health threat directly on an individual's reflection may increase one's perceived threat susceptibility, threat severity, and indirectly behavioral intention.
In study 2, we described a synchronous moderated at-home study. We found that layering AR content over users' living environment would prompt users to relate the data to their own lives and reflect on their own health behaviors, thus strengthening the relevancy and their sense of risk. Even though users understood that all data was simulated, the realistic setting and interactions with information displayed in their personal home environment led users to relate the simulated study to their personal behaviors.
While the two studies contribute to the understanding of different ways in which AR interventions could facilitate users' exploration and understanding of omic data, which in turn could affect behavior change, this article also contributes to the design of remote AR studies. Following, we discuss considerations for the design of remote AR studies. Given that both of the remote studies presented here most likely took place in users' personal home environments, we stress considerations and precautions for surveillance and privacy.
Following this, we propose a framework to compare the two remote study methodologies, and more generally to consider the design choices of remote AR studies.
4.1. DiCRAs: A framework for considering design choices for remote AR studies
In this section, we discuss the choices we made in the design of study 1 and study 2. The two studies apply different methods that represent a range of design choices for how remote studies could be designed and evaluated. To consider these design decisions, we propose DiCRAs (Design Choices for Remote AR studies): A framework that charts the design space of remote AR studies. We visualize this framework using the matrix shown in Figure 6. The vertical boxes describe choices for remote study design, and the researchers can depict their choices and compare different study designs by charting them horizontally. For example, Figure 6 shows a blue path for representing the design choices of study 1, and a red path for representing the design choices of study 2. The DiCRAs framework also integrates ethical considerations to consider as part of the experimental design process.
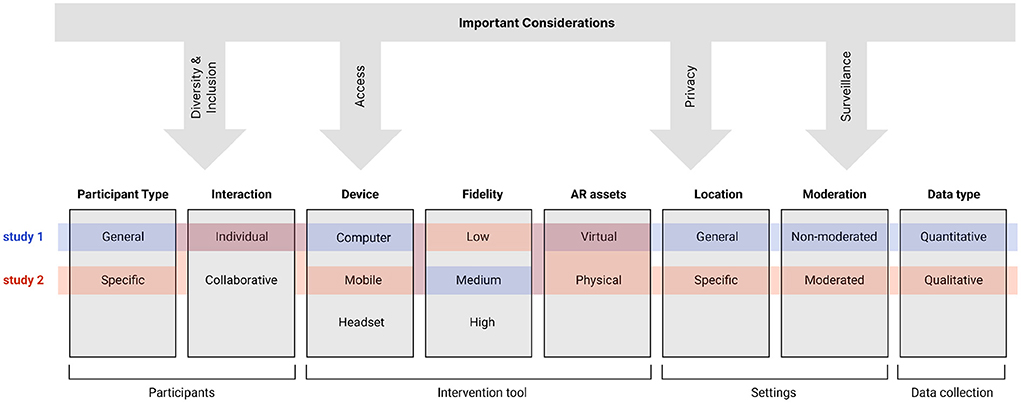
Figure 6. The DiCRAs Framework: Illustration of remote AR studies' design space configurations for the two presented studies. This illustration depicts the difference between the two studies across a number of attributes considered when characterizing remote AR interventions: Participant type, Interaction, Device, Fidelity, AR assets, Location, Moderation, and Data type. Such a framework allows researchers to consider where their work and impact are in the field of remote AR design and evaluation and consider what strategies might be best for their specific configuration.
The framework represents the following choices:
1. Participants and Interactions - what is the necessary sample size? Who should be included or not in the study population? Are there specific requirements for participants to qualify for the study? Does the study require collaboration among participants? Here it is important for researchers to consider tradeoffs regarding accessibility, diversity, and inclusion.
2. Device - how the AR intervention can be deployed to the user through mobile, computer, or headset interfaces. Here are technical, practical, as well as ethical issues to consider, since the type of device chosen might limit the participation of certain populations in the study.
3. Fidelity - the level of detail and functionality included in the prototype used in the study. Here are technical and timing considerations, as well as decisions regarding the data presented to users using the AR intervention (e.g., real-time data, pre-recorded data, simulated or fake data).
4. AR assets - how can the study be deployed? Does it require physical assets (e.g., markers) to be delivered to the participants? Again, considerations should integrate both technical and ethical issues regarding access and inclusion.
5. Settings - considers whether the study can be completed anywhere, or in a specific indoor or outdoor location. Here researchers should consider how to ensure that participants have access to the settings as well as how to verify that participants are indeed participating in the study from the designated settings. Researchers should also consider potential tradeoffs regarding participant privacy.
6. Moderation - considers whether a researcher needs to be present to moderate the study. Here considerations should include how to deliver instructions to users describing how to participate in the study, how to ensure that users follow the instructions, and how to resolve issues that might arise during the study. Researchers should also consider tradeoffs regarding participant privacy and the use of surveillance techniques.
7. Data type - what kind of data is captured in the study? Quantitative data or qualitative data. What instruments are more effective for capturing necessary data (e.g., survey, log, video). Here, researchers should consider how to collect the necessary data while also considering the sensitivity of the data and tradeoffs regarding participant privacy.
Following this, we use this framework to discuss lessons learned from the design and deployment of study 1 and study 2.
4.1.1. Participants
Both study 1 and study 2 did not require users to collaborate. In study 1, we aimed for a relatively large, n > 300 and diverse participant population. We chose to deploy the AR intervention using a home computer with a web camera and to recruit participants using an online marketplace (PRO, 2022). This online marketplace aims to provide researchers with a diverse sample and allow for some demographic control.
In study 2, we aimed for a small sample and high engagement with participants. We recruited participants from our university's population. Multiple factors influenced the diversity and inclusion criteria for our participant sample. Study 2 required an available kitchen, which is the criterion that could have excluded participants who do not have access to private kitchens, excluding those who might be living in dorms or co-ops, or even those who have larger families where the kitchen might be a place of high traffic. Another factor to consider is the intimacy of the settings; people may not be comfortable showing the inside of their home and cooking area for research purposes. Another factor to consider is gender. Most study 2 participants identified as female; it is unknown how this lack of gender diversity could have influenced the results of the study. Another factor to consider is how the mailing of physical materials limited participation. This has excluded people who live outside of the U.S. as well as those who had temporary and inconsistent home addresses during the duration of the study.
To increase access to participation in study 2, we decided to use a phone browser to deliver the AR intervention so it could be accessed from different phones and browsers. One tradeoff between remote evaluation and in-lab evaluation was the lack of standardization in the platforms used. Typically, this was not an issue but if a situation came up where a user suddenly lost access to their phone or a screen recording app, there was not much that could be done and a participant or part of the data could be easily lost. In-person, all participants would have used the same platforms and it would be the responsibility of the researcher (rather than the participant) to collect data, which leads to more consistency in data collection.
The implications for remote recruitment in the case of study 2 were that while remote studies hold promise for inclusion, our sample represents limited diversity across gender, socioeconomic backgrounds, and privacy needs. In the future, it could be interesting to see how people of other genders and other socioeconomic backgrounds engage with the tool and how it may or may not serve their needs.
4.1.2. Fidelity and assets
In study 1, the experimental application had a simple design allowing for the development of all of the necessary functionality required for running the study as described. Therefore, we utilized a high-fidelity robust prototype for the study which is consistent with the look and feel of our envisioned interventions. Because the prototype was complete, robust, and automated the data collection (screenshot and questionnaire responses), there was no need for a moderator to supervise the study.
In study 2, the experimental web application was more complex and less complete. We chose to implement only critical features, focusing on scanning markers and presenting related simulated omic information. To make the prototype accessible from different mobile devices, we implemented it using WebAR. However, the prototype was not sufficiently robust across all devices and platforms. A moderator's presence was needed to support troubleshooting and observe participants through a highly interactive process of exploration, which involved multiple markers placed in specific locations and simulated data.
One distinct challenge in study 2 was that it required extraneous components to deliver the virtual experience to the participant using AR stickers (markers). These stickers were crucial due to the limitations of WebAR tools to directly recognize objects to overlay their data. The remote nature of the study and the deployment of the study in users' kitchens meant that there would not be a standard set of objects that could be easily recognized by the app. To display omic information, participants were required to scan a code using the app; this requirement could impede a seamless experience if the article markers were lost or damaged in transit.
This reliance on sticker markers ensured that participants will have a consistent experience and will be able to access all simulated data samples. However, the additional step of sending users a kit of markers also brought many challenges. The elongated waiting time resulted in a low retention rate of users' participation in our study, in which 7 out of 16 people who signed up did not complete the study. For example, some participants reflected that they forgot that they signed up for the study when they received the package, and some users dropped out of the study claiming to have never received the stickers. These physical assets also required participants to set up the study environment by themselves through a tutorial, which required researchers to check prior to the study that the participants had set up the study space correctly.
Because we did not specify how the stickers should be placed relative to one another, the differences in users' ability and decisions to set up their kitchen may affect how they connected data and concluded results. Similarly, to the study described in Zhao et al. (2021), the lack of control over the real-world environment may have impacted the results. The online presence of a moderator during the study was, therefore, crucial not only to assist with troubleshooting but also to observe and contextualize the results.
4.1.3. Moderated vs. unmoderated study
Our two studies demonstrate the benefits, drawbacks, and considerations of conducting either moderated or unmoderated remote studies.
Study 1 was unmoderated. This allowed the study to be deployed online at a relatively low cost per user, benefiting from lowering barriers to participant recruitment (Reinecke and Gajos, 2015), and leading to larger sample sizes and more robust quantitative study results. Yet, unmoderated remote studies tend to present their own challenges, such as a lack of attentiveness during participation (Reinecke and Gajos, 2015). In study 1, we addressed this concern by automatically taking screenshots during the study to check that participants followed instructions as required. Reviewing the screenshots also led to the observance of behaviors that otherwise would have been missed. We noticed that often, participants practiced the motions along with the animation. While the study was not designed to thoroughly evaluate the impact of interventions on practicing and their impact on behavior, it provided us with context to explore in future experiments that would have otherwise been missed in an unmoderated study. It is important to note that including automated screenshots during the study is a form of surveillance. We informed the participants in the consent form that screenshots will be taken during the study. Later in this section, we further discuss considerations regarding surveillance and privacy.
In contrast, study 2 required researchers to set up study sessions over Zoom, moderate the study sessions, and follow up with participants about sending their phones' screens and audio recordings. The moderated study was appropriate considering the following factors: (1) high interactivity; (2) technology probe which was not robust enough to be used on various platforms without assistance; and (3) no automated data collection due to the qualitative nature of the study design, and the use of participants' own devices. While moderation was necessary to conduct the study, it may have impacted the results. Because researchers were constantly present, some participants asked the researchers detailed questions; the moderated think-aloud protocol caused participants who are more talkative to share more insights.
4.1.4. Quantitative vs. qualitative data analysis
The design of a study would first depend on the research questions and measures. This would then inform the type of data collection and analysis to be conducted. A non-moderated study may be more appropriate for quantitative data analysis methods, while moderated studies may be more beneficial for studies with nuanced qualitative data analysis.
Study 1's goal was to assess the impact of a design feature on predictors of health perceptions, using established quantitative questionnaires. In contrast, study 2 aimed to assess the impact of simulating a future tool in users' personal home environments. This goal could not be accomplished through established questionnaires or quantitative metrics. As a result, researcher-participant interaction was required, and the study was deployed using synchronous study sessions.
4.1.5. Instructions
In study 1's post-study questionnaire, a few participants communicated doubts that they followed the instructions correctly. While reviewing the screenshots, we noticed that many participants “practiced” washing their hands along with the animation displayed, although this was not part of the instructions.
In study 2, a video tutorial was provided prior to the study to show participants how to use the app. However, issues could still occur because the moderating researchers who observed the study using a computer and a Zoom app were unable to see in real-time how participants are interacting with the AR tool from their mobile screen. In one study, e.g., a participant misunderstood that they had to click on the AR object to see the data, so they were unable to interact with the majority of the app. Such challenges are consistent with findings from previous research studies that found difficulties in verifying accurate participation and potential unknown or missed errors (Steed et al., 2016; Ratcliffe et al., 2021).
In study 2, we attempted to resolve this problem by asking users to share their mobile screens through Zoom while using the AR app, so that researchers have control over recording their screens and observing their interactions; however, the Zoom share screen feature made the AR feature on our study's app cease to function. In the future, for remote settings, it would be advantageous to create apps that could integrate the AR function with the ability to share screens. To create a better telepresence experience, we decided that study 2 would consist of two sessions so users could acclimate to understanding the app's functionalities and study expectations. Based on this experience, we emphasize the importance of pilot studies for remote MR studies should utilize moderated pilot studies to assess whether and how participants interact with the application according to expectations.
4.2. Surveillance and privacy
In both study 1 and study 2, we considered the invasive nature of video surveillance in users' home environments in order to verify that participants followed instructions and interacted with the study materials as expected. When using video recording during user studies, it is important to exercise transparency about how the camera footage is being used. This is particularly critical in remote studies, which are held in environments, which are considered private, such as a participant's home.
In both studies, we informed the participants that they would be watched through the camera of their computer or their phone. However, other issues beyond informed consent must also be considered by researchers.
4.2.1. Addressing confidentiality
In study 1, screenshots were taken to validate that participants followed instructions. While the solution was effective in terms of validating our data. Collecting screenshots (which were inclusive of the participant's face) provided researchers with identifiable information that increased the risk of the study. Future study should look to develop novel methods that allow for real-time verification of participation without the collection of identifiable information. Examples may include the use of numerical metrics from eye-tracking or computer vision solutions to validate acceptable participation without collecting images.
In study 2, from early pilot testing, we learned that collecting information that was considered fairly innocuous and common within an in-lab setting had different implications via a zoom interview. In one such experience during pilot testing, we realized that we could not assume private interview settings similar to a lab study. For example, we asked a participant about their gender identity to which they quickly surveyed their environment and responded, “hey if my parents were here right now, I would be very mad that you asked that question.” The less controlled environment means that the user may be susceptible to sharing information that may be overheard by others in the surroundings. We, therefore, determined that demographic information is best collected using online forms to protect users' confidentiality.
4.2.2. Important considerations for privacy
Because in both, studies participants were in a home environment, there could be unexpected disturbances of other household members walking in the study environment that are captured in the video recording or unexpected notifications captured in their mobile screen recordings. To address this issue, in study 2 we remind users repeatedly that we will record the Zoom call and their mobile screens, so they have time to prepare (e.g., remind household members to stay quiet and turn their phones on Do Not Disturb mode).
Some participants expressed discomfort participating in a study where their intimate home setting was on display for researcher viewing and data collection. Most notably, participants would express their anxieties about the possible judgment of the cleanliness of their kitchen environment. It is possible that selection bias existed for people who are comfortable with sharing their living environment. Also, it is possible that because participants' private home environment was moderated by researchers on camera, participants would not choose to disclose their most honest opinions about information related to sensitive topics such as personal health. It is possible that participants may choose to present ideas or actions that are considered socially acceptable rather than authentic usage or thoughts about the technology probe. This could result in selection bias in the study's user demographics and results.
Finally, although participants in study 1 did not have an opportunity to express their concerns about the screenshots taken, it is possible that people that have had concerns decided not to participate in the study. This could result in selection bias implications for studies utilizing recordings or pictures of the participants, limiting the pool of participants to those comfortable with being on camera which could, in turn, have an impact on the result of the analysis.
5. Conclusion
The two studies presented in this article contribute to the development of new methodologies for remote AR studies. In addition, the studies present findings that demonstrate the potential of AR interventions within a personal health context. We consider the design choices of study 1 (remote unmoderated between-users experiment) and study 2 (remote moderated exploratory technology-probe study) through the lens of the DiCRAs framework for designing remote AR studies. Overall, this article contributes to understanding the expanding opportunities and challenges of remote studies' potential in affecting personal health behaviors. It is our hope that these studies and the proposed framework will encourage researchers to further explore different approaches in remote MR studies while considering ways to address privacy, selection bias, and data validity concerns allowing more users to participate and shape the future of XR interventions for personal health.
Data availability statement
The raw data supporting the conclusions of this article will be made available by the authors, without undue reservation.
Ethics statement
The studies involving human participants were reviewed and approved by Study 1: New York University IRB. Study 2: Brandeis Human Research Protection Program (HRPP). The patients/participants provided their written informed consent to participate in this study.
Author contributions
AS, ON, and OS contributed to the conception and design of Study 1. OS, JO, and ZQ contributed to the conception and the design of Study 2. All authors contributed to the manuscript writing and revision, read, and approved the submitted version.
Funding
This study was supported by National Science Foundation awards 1814628 and 1814932.
Acknowledgments
Thank you to the participants who participated in the two studies. We are grateful for support from Wellesley College Science Center Summer Research Program.
Conflict of interest
The authors declare that the research was conducted in the absence of any commercial or financial relationships that could be construed as a potential conflict of interest.
Publisher's note
All claims expressed in this article are solely those of the authors and do not necessarily represent those of their affiliated organizations, or those of the publisher, the editors and the reviewers. Any product that may be evaluated in this article, or claim that may be made by its manufacturer, is not guaranteed or endorsed by the publisher.
References
Alexandrovsky, D., Putze, S., Schwind, V., Mekler, E. D., Smeddinck, J. D., Kahl, D., et al. (2021). “Evaluating user experiences in mixed reality,” in Extended Abstracts of the 2021 CHI Conference on Human Factors in Computing Systems, 1–5.
Bandura, A. (2009). “Social cognitive theory of mass communication,” in Media Effects (Routledge), 110–140. doi: 10.1207/S1532785XMEP0303_03
Barberán, A., Dunn, R. R., Reich, B. J., Pacifici, K., Laber, E. B., Menninger, H. L., et al. (2015). “The ecology of microscopic life in household dust,” in Proceedings Biological Sciences, Vol. 282. doi: 10.1098/rspb.2015.1139
BIO (2022). Biomeme. Available online at: https://biomeme.com/ (accessed August 3, 2022).
Bonanni, L., Lee, C.-H., and Selker, T. (2005). “Counterintelligence: Augmented reality kitchen,” in Proceedings CHI, Vol. 2239 (Portland, OR: Citeseer), 45.
Botvinick, M., and Cohen, J. (1998). Rubber hands ‘feel' touch that eyes see. Nature 391, 756–756. doi: 10.1038/35784
Bracken, C. C. (2005). “Are we together? exploring the similarities between the concepts of transportation imagery model and presence and their possible impact on persuasion,” in Proceedings from the 5th International Association for Presence Research Meeting, 125–129.
Braun, V., and Clarke, V. (2012). “Thematic analysis,” in APA Handbook of Research Methods in Psychology, Vol. 2. Research Designs: Quantitative, Qualitative, Neuropsychological, and Biological, eds H. Cooper, P. M. Camic, D. L. Long, A. T. Panter, D. Rindskopf, and K. J. Sher (American Psychological Association), 57–71. doi: 10.1037/13620-004
Breves, P. (2021). Biased by being there: the persuasive impact of spatial presence on cognitive processing. Comput. Human Behav. 119, 106723. doi: 10.1016/j.chb.2021.106723
Burns, M., Walker, M., Wilkes, T., Hall, L., Gray, K., and Nixon, G. (2016). Development of a real-time pcr approach for the specific detection of andlt;iandgt;prunus mahalebandlt;/iandgt;. Food Nutr. Sci. 07, 703–710. doi: 10.4236/fns.2016.78071
CDC (2020). COVID-19 and Your Health. Centers for Disease Control and Prevention. Available online at: https://www.cdc.gov/coronavirus/2019-ncov/if-you-are-sick/index.html (accessed August 3, 2022).
Ch, N., Ansah, A. A., Katrahmani, A., Burmeister, J., Kun, A. L., Mills, C., et al. (2021). “Conducting a remote virtual reality experiment during COVID-19,” in The First XR Remote Research Workshop.
Cha (2022). Chaibio: Open QPCR Machine. Available online at: https://www.chaibio.com/openqpcr (accessed August 3, 2022).
CUE (2022). Cue's COVID-19 Diagnostic Test. Available online at: https://www.cuehealth.com/products/how-cue-detects-covid-19/ (accessed August 3, 2022).
Duval, T. S., Silvia, P. J., and Lalwani, N. (2012). Self-Awareness and Causal Attribution: A Dual Systems Theory. Springer Science & Business Media.
EAR (2022). Earth Microbiome Project. Available online at: https://earthmicrobiome.org/ (accessed August 3, 2022).
EVE (2022). Everlywell: At-Home COVID-19 (Coronavirus) Test. Available online at: https://www.everlywell.com/products/covid-19-test/ (accessed August 3, 2022).
Gaggioli, A., Morganti, F., Meneghini, A., Alcaniz, M., Lozano, J., Montesa, J., et al. (2005). The virtual reality mirror: mental practice with augmented reality for post-stroke rehabilitation. Ann. Rev. Cybertherapy Telemed. 4, 199–207. doi: 10.1037/e705572011-034
Ghasemi, Y., and Jeong, H. (2021). Model-based task analysis and large-scale video-based remote evaluation methods for extended reality research. arXiv preprint arXiv:2103.07757. doi: 10.48550/arXiv.2103.07757
Green, M., and Brock, T. (2000). The role of transportation in the persuasiveness of public narrative. J. Pers. Soc. Psychol. 79, 701–721. doi: 10.1037/0022-3514.79.5.701
Hayes, A. F. (2018). “Introduction to mediation, moderation, and conditional process analysis: a regression-based approach,” in Methodology in the Social Sciences, 2nd Edn (New York, NY: Guilford Press).
HEL (2022). Helix-Population Genomics. Available online at: https://www.helix.com/ (accessed August 3, 2022).
Hoang, T. N., Ferdous, H. S., Vetere, F., and Reinoso, M. (2018). “Body as a canvas: an exploration on the role of the body as display of digital information,” in Proceedings of the 2018 Designing Interactive Systems Conference (Hong Kong), 253–263.
Hutchinson, H., Bederson, B., Druin, A., Plaisant, C., Mackay, W., Evans, H., et al. (2003). “Technology probes: Inspiring design for and with families,” in Conference on Human Factors in Computing Systems-Proceedings (Ft. Lauderdale, FL: Association for Computing Machinery), 17–24. doi: 10.1145/642611.642616
IJsselsteijn, W. A., de Kort, Y. A. W., and Haans, A. (2006). Is this my hand i see before me? the rubber hand illusion in reality, virtual reality, and mixed reality. Presence 15, 455–464. doi: 10.1162/pres.15.4.455
Jacobs, R., Schnädelbac, H., Jäger, N., Leal, S., Shackford, R., Benford, S., et al. (2019). “The performative mirror space,” in Proceedings of the 2019 CHI Conference on Human Factors in Computing Systems (Glasgow: Association for Computing Machinery), 1–14. doi: 10.1145/3290605.3300630
Javornik, A., Rogers, Y., Gander, D., and Moutinho, A. (2017). “Magicface: Stepping into character through an augmented reality mirror,” in Proceedings of the 2017 CHI Conference on Human Factors in Computing Systems (Denver, CO: Association for Computing Machinery), 4838–4849. doi: 10.1145/3025453.3025722
Jung, S., Lee, J., Biocca, F., and Kim, J. W. (2019). Augmented reality in the health domain: projecting spatial augmented reality visualizations on a perceiver's body for health communication effects. Cyberpsychol. Behav. Soc. Network. 22, 142–150. doi: 10.1089/cyber.2018.0028
Keer, M., van den Putte, B., and Neijens, P. (2010). The role of affect and cognition in health decision making. Br. J. Soc. Psychol. 49(Pt 1), 143–153. doi: 10.1348/014466609X425337
Kilteni, K., Groten, R., and Slater, M. (2012). the sense of embodiment in virtual reality. Presence 21, 373–387. doi: 10.1162/PRES_a_00124
Komarov, S., Reinecke, K., and Gajos, K. Z. (2013). “Crowdsourcing performance evaluations of user interfaces,” in Proceedings of the SIGCHI Conference on Human Factors in Computing Systems, CHI '13 (New York, NY: Association for Computing Machinery), 207–216.
Ku, G. C.-M., Shang, I.-W., and Li, M.-F. (2021). How do location-based augmented reality games improve physical and mental health? evaluating the meanings and values of pokémon go users' experiences through the means-end chain theory. Healthcare 9, 794. doi: 10.3390/healthcare9070794
Lee, Y., and Lee, C. H. (2018). Augmented reality for personalized nanomedicines. Biotechnol. Adv. 36, 335–343. doi: 10.1016/j.biotechadv.2017.12.008
Li, X. (2018). Media exposure, perceived efficacy, and protective behaviors in a public health emergency. Int. J. Commun. 12, 20. doi: 10.1080/17544750.2019.1608277
Ma, Z. (2020). Effects of immersive stories on prosocial attitudes and willingness to help: testing psychological mechanisms. Media Psychol. 23, 865–890. doi: 10.1080/15213269.2019.1651655
Mäkelä, V., Radiah, R., Alsherif, S., Khamis, M., Xiao, C., Borchert, L., et al. (2020). “Virtual field studies: conducting studies on public displays in virtual reality,” in Proceedings of the 2020 CHI Conference on Human Factors in Computing Systems (Honolulu, HI: Association for Computing Machinery), 1–15. doi: 10.1145/3313831.3376796
Mathis, F., Zhang, X., O'Hagan, J., Medeiros, D., Saeghe, P., McGill, M., et al. (2021). Remote xr studies: the golden future of hci research?
MET (2022). Metasub. Available online at: http://metasub.org/ (accessed August 3, 2022).
Mousavi Hondori, H., Khademi, M., Dodakian, L., Cramer, S. C., and Lopes, C. V. (2013). A spatial augmented reality rehab system for post-stroke hand rehabilitation. Stud. Health Technol. Inform. 184, 279–285.
Moyer-Gusé, E. (2008). Toward a theory of entertainment persuasion: explaining the persuasive effects of entertainment-education messages. Commun. Theory 18, 407–425. doi: 10.1111/j.1468-2885.2008.00328.x
Nussenbaum, K., Scheuplein, M., Phaneuf, C. V., Evans, M. D., and Hartley, C. A. (2020). Moving developmental research online: comparing in-lab and web-based studies of model-based reinforcement learning. Collabra Psychol. 6, 17213. doi: 10.1525/collabra.17213
Otiono, J., Qian, Z., Shaer, O., Seals, A., and Nov, O. (2021). “Lessons from a remote at-home evaluation of an augmented reality application,” in Evaluating User Experiences in Mixed Reality.
PAT (2015). Pathomap-Mapping New York's Microscopic Residents. Available online at: http://www.pathomap.org (accessed August 3, 2022).
Poh, M.-Z., McDuff, D., and Picard, R. (2011). “A medical mirror for non-contact health monitoring,” in ACM SIGGRAPH 2011 Emerging Technologies (Vancouver, BC: Association for Computing Machinery). doi: 10.1145/2048259.2048261
Pratap, A., Neto, E. C., Snyder, P., Stepnowsky, C., Elhadad, N., Grant, D., et al. (2020). Indicators of retention in remote digital health studies: a cross-study evaluation of 100,000 participants. NPJ Digit. Med. 3, 1–10. doi: 10.1038/s41746-020-0224-8
PRO (2022). Prolific. Available online at: https://app.prolific.co/ (accessed August 3, 2022).
Ratcliffe, J., Soave, F., Bryan-Kinns, N., Tokarchuk, L., and Farkhatdinov, I. (2021). “Extended reality (xr) remote research: a survey of drawbacks and opportunities,” in Proceedings of the 2021 CHI Conference on Human Factors in Computing Systems.
Regenbrecht, H., McGregor, G., Ott, C., Hoermann, S., Schubert, T., Hale, L., et al. (2011). “Out of reach?–a novel ar interface approach for motor rehabilitation,” in 2011 10th IEEE International Symposium on Mixed and Augmented Reality (Basel: IEEE), 219–228.
Reinecke, K., and Gajos, K. Z. (2015). “Labinthewild: conducting large-scale online experiments with uncompensated samples,” I|n Proceedings of the 18th ACM Conference on Computer Supported Cooperative Work and Social Computing (Vancouver, BC: Association for Computing Machinery), 1364–1378. doi: 10.1145/2675133.2675246
Rhodes, N. (2017). Fear-appeal messages: message processing and affective attitudes. Commun. Res. 44, 952–975. doi: 10.1177/0093650214565916
Riva, G., Baños, R. M., Botella, C., Mantovani, F., and Gaggioli, A. (2016). Transforming experience: the potential of augmented reality and virtual reality for enhancing personal and clinical change. Front. Psychiatry. 7, 164. doi: 10.3389/fpsyt.2016.00164
Rogers, Y., and Marshall, P. (2017). Research in the wild. Synth. Lectures Hum. Centered Inform. 10, i-97. doi: 10.1007/978-3-031-02220-3
Schwarzer, R. (2008). Modeling health behavior change: how to predict and modify the adoption and maintenance of health behaviors. Appl. Psychol. 57, 1–29. doi: 10.1111/j.1464-0597.2007.00325.x
Seals, A., Olaosebikan, M., Otiono, J., Shaer, O., Nov, O., et al. (2021). Effects of self-focused augmented reality on health perceptions during the covid-19 pandemic: a web-based between-subject experiment. J. Med. Internet Res. 23, e26963. doi: 10.2196/26963
Shaer, O., Nov, O., Westendorf, L., and Ball, M. (2017). Communicating personal genomic information to non-experts: a new frontier for human-computer interaction. Foundat. Trends Human Comput. Interact. 11, 1–62. doi: 10.1561/9781680832556
Steed, A., Frlston, S., López, M. M., Drummond, J., Pan, Y., and Swapp, D. (2016). An “in the wild” experiment on presence and embodiment using consumer virtual reality equipment. IEEE Trans. Vis. Comput. Graph. 22, 1406–1414. doi: 10.1109/TVCG.2016.2518135
Tullis, T., Fleischman, S., McNulty, M., Cianchette, C., and Bergel, M. (2002). “An empirical comparison of lab and remote usability testing of web sites,” in Usability Professionals Association Conference.
Ullman, D., Phillips, E., Aladia, S., Haas, P., Fowler, H. S., Iqbal, I. S., et al. (2021). “Evaluating psychosocial support provided by an augmented reality device for children with type 1 diabetes,” in Proceedings of the International Symposium on Human Factors and Ergonomics in Health Care, Vol. 10 (Los Angeles, CA: SAGE Publications Sage CA), 126–130.
WHO (2021). Who's Infection Prevention and Control Department. World Health Organization. Available online at: https://www.who.int/teams/integrated-health-services/infection-prevention-control (accessed August 3, 2022).
WIL (2020). Wild Life of Our Homes. Public Science Lab. Available online at: http://robdunnlab.com/projects/wild-life-of-our-homes/ (accessed August 3, 2022).
Wither, J., DiVerdi, S., and Höllerer, T. (2009). Annotation in outdoor augmented reality. Comput. Graphics 33, 679–689. doi: 10.1016/j.cag.2009.06.001
Witte, K. (1992). Putting the fear back into fear appeals: The extended parallel process model. Commun. Monogr. 59, 329–349. doi: 10.1080/03637759209376276
Yuan, Y., and Steed, A. (2010). “Is the rubber hand illusion induced by immersive virtual reality?” in 2010 IEEE Virtual Reality Conference (VR) (Boston, MA: IEEE), 95–102.
Keywords: augmented reality, Mixed Reality, remote MR research, human-computer interactions, health behavior
Citation: Shaer O, Otiono J, Qian Z, Seals A and Nov O (2022) Remote evaluation of augmented reality interaction with personal health information. Front. Comput. Sci. 4:934694. doi: 10.3389/fcomp.2022.934694
Received: 02 May 2022; Accepted: 08 July 2022;
Published: 15 August 2022.
Edited by:
Laurissa Tokarchuk, Queen Mary University of London, United KingdomReviewed by:
Stephanos Mavromoustakos, Indiana Institute of Technology, United StatesJunhuai Li, Xi'an University of Technology, China
Copyright © 2022 Shaer, Otiono, Qian, Seals and Nov. This is an open-access article distributed under the terms of the Creative Commons Attribution License (CC BY). The use, distribution or reproduction in other forums is permitted, provided the original author(s) and the copyright owner(s) are credited and that the original publication in this journal is cited, in accordance with accepted academic practice. No use, distribution or reproduction is permitted which does not comply with these terms.
*Correspondence: Orit Shaer, oshaer@wellesley.edu