Achieving Net Zero Emissions Requires the Knowledge and Skills of the Oil and Gas Industry
 Astley Hastings
 Pete Smith
- Institute of Biological and Environmental Science, University of Aberdeen, Aberdeen, United Kingdom
The challenge facing society in the 21st century is to improve the quality of life for all citizens in an egalitarian way, providing sufficient food, shelter, energy, and other resources for a healthy meaningful life, while at the same time decarbonizing anthropogenic activity to provide a safe global climate, limiting temperature rise to well-below 2°C with the aim of limiting the temperature increase to no more than 1.5°C. To do this, the world must achieve net zero greenhouse gas (GHG) emissions by 2050. Currently spreading wealth and health across the globe is dependent on growing the GDP of all countries, driven by the use of energy, which until recently has mostly been derived from fossil fuel. Recently, some countries have decoupled their GDP growth and greenhouse gas emissions through a rapid increase in low carbon energy generation. Considering the current level of energy consumption and projected implementation rates of low carbon energy production, a considerable quantity of fossil fuels is projected to be used to fill the gap, and to avoid emissions of GHG and close the gap between the 1.5°C carbon budget and projected emissions, carbon capture and storage (CCS) on an industrial scale will be required. In addition, the IPCC estimate that large-scale GHG removal from the atmosphere is required to limit warming to below 2°C using technologies such as Bioenergy CCS and direct carbon capture with CCS to achieve climate safety. In this paper, we estimate the amount of carbon dioxide that will have to be captured and stored, the storage volume, technology, and infrastructure required to achieve the energy consumption projections with net zero GHG emissions by 2050. We conclude that the oil and gas production industry alone has the geological and engineering expertise and global reach to find the geological storage structures and build the facilities, pipelines, and wells required. Here, we consider why and how oil and gas companies will need to morph from hydrocarbon production enterprises into net zero emission energy and carbon dioxide storage enterprises, decommission facilities only after CCS, and thus be economically sustainable businesses in the long term, by diversifying in and developing this new industry.
Introduction
A Net Zero World
The United Nations Framework Convention on Climate Change (UNFCCC) Paris meeting in 2015 resulted in the Paris Agreement where 195 signatory nations agreed to undertake ambitious efforts to combat climate change in order to limit global warming to below 2°C with further ambitions to reduce this limit to well-below 2°C above preindustrial averages (UNFCCC, 2016). As global temperature is proportional to atmospheric greenhouse gas (GHG) concentration (CO2, CH4, N2O, fluorocarbons, etc.) and their half-life in the atmosphere varies from decades to centuries, the world has a limited GHG budget to emit into the atmosphere before the 2°C limit is breached. The IPCC “Global Warming of 1.5°C” report indicated that cumulative net anthropogenic GHG emissions postindustrialization should not exceed an ~3 trillion tons CO2 equivalent (Tt CO2 eq.) carbon budget (CB) to avoid breaching the 1.5°C warming threshold (Rogelj et al., 2018). This CB uses the global warming potential (GWP*) from Allen M. et al. (2018). At the end of 2017, only ~800 Gt CO2 eq. emissions remained to reach the CB. As currently in 2019 annual anthropogenic GHG emissions are ~40 Gt CO2 eq./year, the world can only emit at that rate for a further 25 years before the CB is exhausted and emissions should be zero. However, in spite of global ambitions to the contrary, emissions are currently projected to increase each year making a likely overshoot on the CB. However, the recent downturn in economic activity and life-style changes due to the coronavirus disease 2019 (Covid-19) have resulted in a short-term reduction in emissions in 2020 (Le Quéré et al., 2020), some of which may become locked in by the “Green Recovery” policies and investment but will have a minimal impact on the CB.
It is impossible to achieve zero anthropogenic emissions as parts of food production, manufacturing, and transport cannot be emissions free. However, as the atmosphere can be treated as a reservoir of GHG, if these residual emissions can be balanced by GHG removal (GGR), then we can achieve net zero emissions (net zero). In addition, in the medium term, if net zero cannot be achieved by the end of the CB, then further GHG can be removed from the atmosphere to reduce atmospheric GHG concentrations. The leading technologies for GGR are either land based through photosynthesis and storage of carbon in the soil and vegetation or through physical removal and storage in a geological repository. Although changing land management to store soil carbon and afforestation to store vegetation carbon is effective, it has a limited capacity due to land availability and also reaches saturation, but it is reversible. This leaves a direct air capture (DAC) through physical and chemical devices which exists as prototype technology but require ~2,000 kWh or electrical and thermal energy per ton of CO2 captured (Buettler et al., 2019) and bioenergy carbon capture and storage (BECCS). BECCS is a combination of existing technologies and essentially captures carbon from the atmosphere by photosynthesis, burns the biomass for energy, and captures the resulting CO2 (Albanito et al., 2019). Both DAC and BECCS require CO2 capture, transport, and storage in a geological repository [carbon capture and storage (CCS)]. In addition, decarbonization of the residual use of fossil fuels, be they oil, gas, or coal based, for electricity, heat, motive power, metal refining, or cement production requires that for net zero, the CO2 emitted must be eliminated or captured and stored if their use is to be continued in a net zero economy (de Coninck and Revi, 2018).
Current GHG Emissions Trajectory
The Intergovernmental Panel on Climate Change Fifth Assessment Report (AR5) shows that GHG emission growth has accelerated over the past decade despite policies to limit emissions (Edenhofer et al., 2014; IPCC, 2014). Most growth in emissions is driven by CO2 from fossil fuel use in the energy and industry sectors. About half of cumulative anthropogenic CO2 emissions between 1750 and 2010 occurred in the last 40 years (Edenhofer et al., 2014). Emissions continue to rise with increasing economic growth and population in non-OECD countries. This increase in emissions was paused during the 2008 banking crisis but subsequently continued to increase until the recent reduction caused by the Covid-19 pandemic, though this reduction is likely to be short lived (Forster et al., 2020; Le Quéré et al., 2020). In the IPCC special report SR1.5, several emission scenarios are tested to limit warming ~1.5°C; all show that net zero emissions must be achieved by 2050, and if a slower trajectory in reductions is followed, then the amount of negative emissions that are required to balance the cumulative emissions increases (Rogelj et al., 2018).
The current annual anthropogenic GHG emissions are ~40 Gt CO2, and the consequences of continuing this rate of emissions is a global temperature increase exceeding the 2°C limit agreed to under the United Nations Framework Convention on Climate Change. This will significantly increase the risks to a range of natural and human systems over this century and beyond (IPCC, 2014). Urgent action is required to reduce emissions to avoid dangerous climate change (Edenhofer et al., 2014; Rogelj et al., 2018). The analysis shows that there is still time to act, but the window of opportunity is rapidly closing and that the longer we wait, the more costly and risky the solutions will be (Edenhofer et al., 2014). The carbon budget of ~1,000 Gt CO2 remaining emissions should not be exceeded if more than a 2°C warming is to be avoided. With only ~20 years or slightly longer if the Covid-19 effect persists, to emit GHG gas at the current rate, this carbon budget should be used to create the infrastructure for a global low carbon energy production system to sustain a future low carbon economy, and it should not be squandered on supporting business as usual.
Future Projections of Fossil Fuel Use
The current consumption of primary energy is predicted to continue to rise [IEA (International Energy Agency), 2019; BP, 2020], and by 2040, the entire global carbon budget of carbon dioxide emissions of ~1,000 Gt CO2 eq. (Miller and Sorrell, 2014) allowable to give a 50:50 chance of meeting the 2°C target of global temperature increase will be used, and we will still have high emissions. The IEA's most optimistic sustainable development scenario predicts that net zero is reached by 2070, which misses the 2°C target [IEA (International Energy Agency), 2020b]. Even though the rate of increase slowed in 2019, without negative CO2 emissions (Fuss et al., 2014), by 2040, emissions of GHG must be reduced to zero. However, based on the IEA-stated policies scenario [IEA (International Energy Agency), 2020a] which includes new measures and policies that promote energy efficiency and low carbon technologies, the IEA projects total energy demand will grow by 10% between 2019 and 2030, in spite of dropping 10% in 2020 due to Covid. In this scenario, coal demand is projected to drop from 2019−5,500 million tons coal (Mtce) to 4,800 Mtce by 2040, oil consumption is projected to increase from 2019 levels by 9 million barrels per day (Mb/day) to 104 Mb/day, gas consumption will rise by 30% to 5.4 trillion cubic meters (Tcm) [liquefied natural gas alone increases from 300 to 540 billion cubic meters (bcm)]. The BP Energy Outlook 2020 makes similar forecasts. Both the IEA and BP scenarios based upon current policies or governments and investment plans of brother oil and other energy companies and utilities show that at best if policies and investment plans do not change, GHG emissions will at best remain at the current levels. Clearly, the IPCC objective of reducing GHG emissions to zero is at odds with the current IPCC, IEA, and BP projections for fossil energy use, as by 2040 emissions should have reduced to zero, instead the IEA projects fossil fuel emissions to be 36.7 Gt CO2/year and BP between 18 and 45, unless all the projected CO2 emissions are geologically stored.
It is estimated that by 2040, only 15% of passenger cars will be electric (BP, 2020), for road transport overall, biofuels will make up 8% of road transport demand, the rest being supplied mainly by fossil fuels (BP, 2020). There will be a growing percentage of electrified trains and urban transport, but air and sea transport will remain fueled by fossil energy sources, and their emissions will not easily be captured, representing 21.6% of total emissions. Based on the IEA scenario, world electricity demand is projected to rise by 80% from current consumption by 2040 to 39,000 TWh, and the share in renewables will increase from 21% in 2012 to 33% by 2040 [IEA (International Energy Agency), 2018]. Installed capacity for renewables is projected to increase by 4,000 GW by 2040. This means that by 2040, total electricity generation will be 12,937 TWh from renewables of which 12% is bioenergy, 50% is hydro, 24% is wind, 2% geothermal, 8% solar PV, 2% concentrated solar, and a small amount of marine energy. Nuclear is projected to rise slightly from 11 today to 12% by 2040. This is lower than its peak in 1996 of 18% of total electricity generation. Due to the overall increase in electricity demand, the nuclear electricity generating capacity is predicted in this scenario to increase from 392 GW today to 624 GW by 2040. However, as most currently operating nuclear power stations will need to be decommissioned by this time, the entire 2040 capacity will be new. This leaves, by 2040, 55% of electricity generated from fossil fuel, which will result in ~14.4 Gt of annual carbon dioxide emissions, out of the total emissions of ~37 Gt CO2e in the evolving transition scenario (BP, 2020). This is greater than the 13 Gt CO2e emitted in 2010 by electricity generation.
The Potential Carbon Capture and Storage and GGR Market
In summary, total energy demand will grow by 37% by 2040, and taking into account energy efficiency improvements and projected growth in non-fossil energy use due to the change in mix of fossil and other fuels in the IEA current policy scenario, this will cause a 20% increase in GHG emissions. If such improvements were not accounted for, oil consumption would be 23 Mb/d higher (+22%), gas consumption 940 bcm (+17%), and coal consumption 920 Mtce higher (+15%). GHG emissions are thus projected to rise by 20% by 2040, and if they were to continue at that rate beyond 2040, the world would be on-track for a 3.5+°C rise in temperature. If this scenario of fossil fuel use is realistic, then the carbon from its use should no longer be emitted to the atmosphere if the global temperature rise is to be limited to 2°C. CCS involves three phases: capture of the CO2, its transport, and its geological storage. CCS from stationary use of energy is the most practical, and so the 55% of fossil fuel–generated electricity and industrial processes like metal refining and cement production should be the first targets. The total amount of CO2 to store each year in the IEA current policy scenario from stationary use by 2040 is 24 Gt CO2e, of which electricity generation accounts for 15.4 Gt CO2e. However, the total emissions from anthropogenic activity including food production and the “difficult to eliminate” mobile emissions are 37 GT CO2e/year, which for net zero must be eliminated or negated by negative emission using DAC, BECCS afforestation of other land-related GGR. This forms the upper limit for the CCS market, as shown in Figure 1.
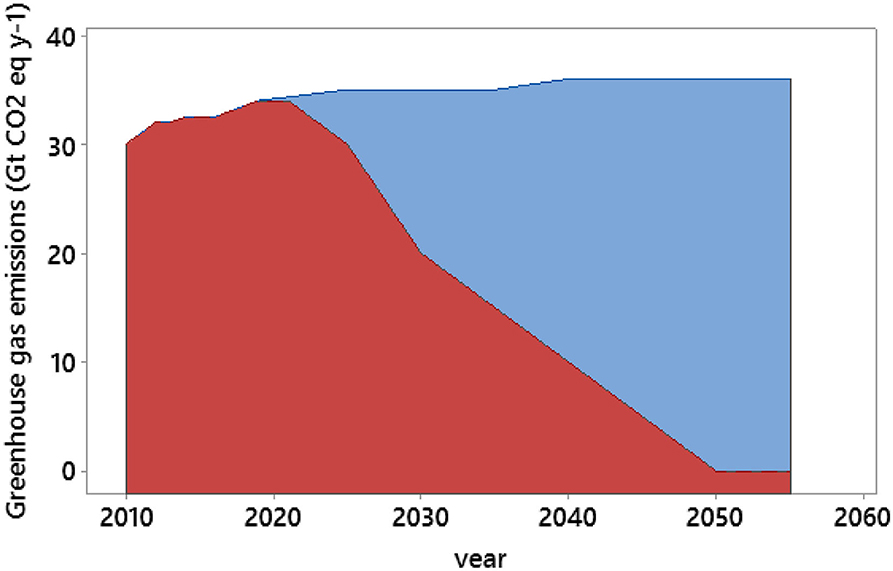
Figure 1. This is a graph of projected emissions to 2055. The area under the red curve is the IPCC SR1.5 low-energy demand–projected net annual emission pathway to keep global warming below 1.5°C, reaching net zero by 2050. The area in blue is the difference between the projected emissions from the IEA for currently stated policy scenario and the desired net zero pathway. This is the potential CCS requirement to achieve net zero by 2050.
Snøhvit in the Norwegian sector of the North Sea is a good example of a typical CCS storage system. It uses an amine separation system in an onshore LNG plant, a 153-km pipeline to transport the CO2 offshore, a single horizontal well that injects around 0.7 Mt of CO2/year into a saline aquifer, with a total capacity of 23 Mt (Equinor, 2020). Holloway (2009) estimates that the UK continental shelf has a storage capacity for 25 Gt CO2, enough for 100 years of emissions from UK power stations at current levels, which were 184 Mt/CO2 in 2015. However, this would require 260 installations similar to Snøhvit. This is comparable with the number of oil and gas production facilities in the UK continental Shelf. Scaling this globally to capture all fossil emissions from electricity generation worldwide by 2040 would need to store 15.4 Gt CO2/year by 2040 due to the projected electricity generation mix and would thus need 20,500 of such installations [IEA (International Energy Agency), 2013] estimates GHG emissions of 13.36 Gt CO2/year in 2012 from electricity production for comparison]. If installations for GGR to balance emissions from transport, farming, and industrial processes are considered in the IEA scenario of 37 GT CO2e/year emissions, then the requirement is for 50,000 Snøhvit installations, unless emissions can be otherwise reduced.
The Technology Readiness Level (ESA, 2008) of Carbon Capture and Storage
If fossil fuel use projections follow the IEA-defined policy scenario, decarbonizing the 55% of electricity generation by 2040 will require a CCS industry capable of storing 15.4 Gt CO2/year. To put this into perspective, current oil and natural gas production quantities are 4.2 and 3.1 Gt oil equivalents/year, respectively. CO2 when liquid has a density of 770 kg/m3 and a density of 1.977 kg/m3 at 1 atmosphere and 0°C. The liquid density is similar to oil, and gas is denser than methane at 0.716 kg/m3 under the same conditions. When CO2 is injected into a geological formation, it can be stored in different forms, and this depends on the pressure and temperature of the geological formation relative to the pressure–temperature phase diagram of carbon dioxide (Figure 2). At formation temperatures, which are usually above 36°C, CO2 is either a vapor below 90 bar or a supercritical fluid above, thus the CO2, being less dense, will rise to the top of the reservoir. However, CO2 is also soluble in water at the rate of 1.45 g/L at 25°C and 100 kPa, and since water saturated with CO2 is denser, it will sink to the bottom of the reservoir.
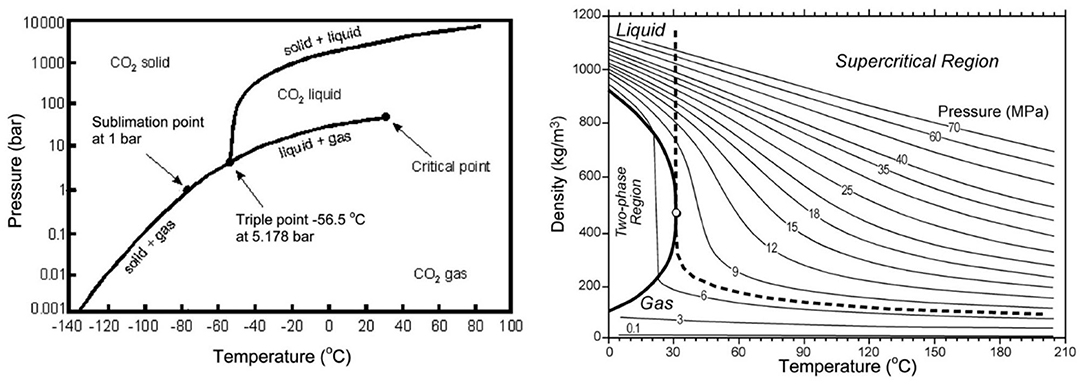
Figure 2. Phase diagram of carbon dioxide (source: http://elements.geoscienceworld.org/content/3/3/179/F2.expansion.html).
The concept of storing the CO2 gas in a geological formation relies on finding a porous rock into which the CO2 can be injected with a seal mechanism that ensures the CO2 is trapped. The type of seal depends on the mechanism to trap the gas in the rock formation. If it is stored as a gas, or critical fluid, then the seal must be at the top of the reservoir; however, if it is stored in solution, the seal must be at the bottom of the reservoir. In practice, the storage mechanism is a combination of both. Injecting CO2 into a geological formation will increase the pressure, and the volume that can be injected is limited as by the geomechanical properties of the reservoir system, to avoid increasing the pressure to the point that it fractures the rock that created the seal. Typically, volumes >2% of the reservoir volume cannot be injected, unless some fluid is taken out of the rock (produced) to reduce the pressure, and in this case, the produced fluids have to be disposed of without harming the environment. This means that depleted oil and gas reservoirs can be used for storing CO2 as they can be pressured to their original preproduction pressure. CO2 can also be used to enhance oil recovery (EOR), both as a miscible agent, where the injected CO2 is a supercritical fluid and dissolves in the oil causing it to swell and reduce it viscosity—thus increasing reservoir pressure and improving its mobility, or it can be used as an immiscible injection medium (as a gas/vapor) to facilitate repressuring the reservoir and gravity drainage. This is a mature technology for the oil and gas industry and CO2 EOR is in widespread use in the USA. Pure CO2 sequestration is less common and currently confined to demonstration projects, but the technology of locating the rock formation and drilling wells, construction of facilities, and operation of the injection wells is similar to that used in the finding and production of oil and gas. There are currently 18 CCS projects in the world and four in operation: in Salah in Algeria, operated by Sonatrach-BP-Equinor, and Snøhvit and Sleipner in the Norwegian sector of the North Sea operated by Equinor (2020). The first large-scale CCS for the power sector commenced operation in October 2014 at the Boundary Dam coal-fired power station in Saskatchewan, Canada, selling the CO2 for EOR. There are other projects in the planning or construction phase indicating a technology readiness level (TRL) level of 8 or 9.
The separation of CO2 from other gases by the amine process is a mature technology that is used in many natural gas-processing plants and refineries and can be adapted to capture CO2 precombustion to produce hydrogen for the actual combustion, or postcombustion from the exhaust gasses (Rochelle, 2009; Fuss et al., 2014), a TRL of 9. Anhydrous CO2 in the gas phase or as a supercritical fluid is not corrosive at surface temperatures and can be transported using steel metallurgy but requires special elastomers for seals. However, CO2 is corrosive when there is water present, forming carbonic acid, and pipe valves and pressure vessels require stainless steel metallurgy. The TRL level of this technology is 8–9.
There are other technologies, such as calcium looping, being developed, but these are not yet operational (Choi et al., 2009; Astolfi et al., 2019). There are other CO2 disposal options, involving carbonation (rather than storage in depleted oil and gas reservoirs and saline aquifers) where leakage would not be a problem. These are now operational at pilot scale (Matter and Kelemen, 2009; Buettler et al., 2019). Another approach is carbon capture and use (CCU). There are several approach being researched such as a process to capture CO2 in brine rich in Mg and Ca ion to form carbonates which can be used to make cement or as a chemical feedstock (Imbabi, private communication). This process in being developed by the University of Aberdeen with funding from Qatar and requires large amount of Ca- and Mg-rich brine to combine with gaseous CO2. This is synergetic with the oil gas industry (OGI) as it produces large quantities of brine which for terrestrial locations creates a disposal problem, which will also be the case where CCS used saline aquifer carbonation for storage. Other CCU strategies such as using the CO2 to produce fuel are being pursued; however, this is an energy-intensive process. The TRL of these technologies is below 7.
Role of the OGI and a Potential Business Model
Having established the global need for large-scale CCS to either decarbonize future fossil fuel use or provide sufficient negative emissions to achieve net zero and identified that in general all of the technologies are mostly at a TRL of TRL 8 or 9, the question is how can this embryo industry be ramped up in a timely fashion at scale and what policy levers are required to achieve this. In this section, we consider the role of the oil companies and potential business model.
The Role of the Oil Companies
The technology and skills required for CCS (except DAC and bioenergy) are virtually identical to those employed in the exploration, production, and processing of hydrocarbons. The OGI employs earth scientists and reservoir engineers to build geological models to identify potential reservoirs and to model them statically and dynamically using well-data, cores, petrophysical logs, and test data. Drilling engineers drill the wells, production engineers design the well-completions, facility engineers design processing equipment, platforms, and pipelines, and civil engineers design transport facilities and roads, etc. In addition, license holders require legal and financial experts to negotiate contracts with land owners and governments. License holders share the expertise with Integrated Service Companies who provide most of the routine operational work.
Current experience of CCS in the Salah, Snøhvit, and Sleipner CCS projects (Equinor, 2020), and on producing, transporting, and injection CO2 in EOR projects, demonstrates that there is little difference in the reservoir characterization, wells drilled, facilities design, or operations required to safely inject CO2 into the ground. This is the case even if saline aquifers or deep rock mineralization is used for storage. The cost structure of CCS operations is going to be similar to gas injection facilities and wells that are used for secondary or tertiary oil and gas recovery techniques in the OGI [IEA (International Energy Agency), 2013; Irlam, 2017].
The main difference between producing oil and gas and storing CO2 is the direction of flow and that the reservoir pressure is higher at the end of the project rather than depleted. It requires the same skills, technology, and safety ethos. The storage reservoirs have to be found, wells drilled, and facilities and pipelines built. Once the CO2 has been injected into the reservoir, monitoring to check for leaks is required, and any remediation work undertaken. As the reservoir pressure is higher at the end of storage than the beginning, continuous monitoring of the reservoir integrity is required as unlike a depleted oil and gas reservoir, the pressure in the storage structure may not be balanced by the natural hydrostatic head in the rock formations above. The scale of the work to be undertaken will be of a similar magnitude to the current OGI work undertaken to find and produce oil and gas at the current rates (Pershad et al., 2012; Spence et al., 2014). The question remains: who will form this CCS industry? The OGI is an obvious starting point, but to ramp up an industry of such a magnitude would mean doubling the size of the OGI resources of personnel and investment from the level today. This would require a large investment in training of geoscientists and engineers for the industry which today, due to the “great crew change” (see below) and the cyclic nature of employment in the industry, struggles to find enough suitable qualified personnel. It would also require a huge investment in Geology and Geophysics surveys and infrastructure building. In the current economic climate, the big question is who pays for the investment needed to kick start this industry and how can it be made fairly as part of a wider transition to sustainable living in a post-Covid-19 context (Lippponen et al., 2017; Allen et al., 2020).
The Cyclical Nature of the OGI
In the past 50 years, the OGI has been very cyclical due to rapid changes in the oil price. These changes are driven by supply and demand and perturbed by interruption in supply due to wars, civil unrest, changes in demand due to boom and bust cycles in the world economy, and political intervention to modify supply and thereby prices and disrupting technologies such as horizontal wells and fracking. Most oil and gas demand is satisfied by the long term or future contracts, the price of which changes slowly, and historically many gas contract prices are closely pegged to the oil price. However, the remainder is traded on the spot market, which defines the price of Brent and West Texas Intermediate crude oil, the Henry hub spot gas price in the USA, and the spot price of liquefied natural gas (LNG). These spot prices are volatile and very sensitive to the supply-demand balance. Even in an ideal world without any perturbation from policy or conflict, high growth in the world economy leads to an increase in consumption of energy, which tightens the margin between supply and demand, and oil and gas prices increase. As the prices go up, small- and intermediate-sized independent oil companies start to increase exploration and development (E&P) activity, followed by the majors, which increases the supply of oil and gas. However, as the high oil prices in turn lead to a slowdown in the world economy, the demand slackens, the spot price of oil and gas drops, and E&P activity slows. The OGI cycle, which tends to last around 5–7 years, repeats itself and tends to be out of phase with the boom and bust cycles of the world economy.
National oil companies, especially those in OPEC, and the majors with large portfolios of producing fields and exploration licenses, tend to modify their activity selectively in response to low oil prices and focus on lower-risk and lower-cost interventions, and low-risk exploration prospects to reduce overall costs and take a long-term view of the cycles. However, small- and medium-sized independents, who rely on cash flow to fund E&P activity, cut spending fast. The US Baker-Hughes rig count reflects this fluctuation in activity and has ranged between 287 and 4,500 active drilling rigs from 1975 to present (Baker-Hughes, 2020). Such drastic changes in E&P activity result in service and drilling companies releasing many skilled people, and they also stop hiring and reduce their training programs. This in turn, affects the prospects for graduate earth scientists and engineers, and University course intake on such courses is also cyclical. Many of the people released in a downturn do not return to the OGI as they find other jobs in the world economy, which is out of phase and hiring when E&P activity is low. This has led to a bimodal distribution in the age of skilled E&P workers and led to “the great crew change around 2000.”
As generally the world economy is out of phase with the oil industry and consumes more energy when hydrocarbon prices are low (and OGI activity low), it also emits more CO2. As an example, the Covid-19 pandemic has currently curtailed global economic activity and oil prices have fallen as a result and rig activity is the lowest since 1972 (Baker-Hughes, 2020). This means that oil and gas supply will lag demand if and when the economy recovers and emissions will pick up (Le Quéré et al., 2020). If there was a parallel CCS activity, which was part of the OGI, then the reduced resources required in the E&P part of the business could be reassigned to the CCS one and somewhat reduce the see-saw in activities.
Potential Business Model
As oil and gas companies are to be involved in the creation of the CCS industry, the potential business model should be designed with due regard to the upstream oil and gas industry. The cost of producing oil and gas can be divided into operating costs (OPEX) and amortized capital costs (CAPEX). The CAPEX includes the cost of buying the license to explore and produce hydrocarbons, exploration costs, reservoir characterization costs, and the cost of building the infrastructure including drilling the wells, acquiring well and geological data, and constructing pipelines, platforms, and pads and processing equipment. CAPEX is amortized over a fixed period that not only depends on the license agreements and tax regime of the country but is also related to the size of the field and can be from 3 to 30 years. In addition, under some license agreements, provision has to be made for decommissioning of facilities, either in the form of a levy, an escrowed provision, or taxation. OPEX relate to the ongoing operation of the producing facilities and includes repair and maintenance, energy, personnel, well-health checks and well work-over, oil and gas transportation, marketing costs, and water disposal costs. The sum of the OPEX and amortized CAPEX divided by the production volume gives the lifting costs per barrel of oil (bbl). Typically, in the UK continental Shelf (UKCS), it ranges from $23 to $84/bbl (HM Revenue Customs, 2018). Profit before tax is the difference between the sales price and lifting costs. In the UKCS, the current tax rate is between 30 and 40% of the profit (HM Revenue Customs, 2018), depending on the license agreement. With the recent volatility in oil prices from $140/bbl in 2009 to $14/bbl in 2020, it is easy to understand changes in E&P activity in the UKCS, where many projects are producing oil at a loss at low prices for a period of time that could destroy the profitability of the overall project over its lifetime. This leads to caution in investing in new projects, raising the bar to exclude riskier high potential lifting cost projects. This is, in turn, can reduce the total oil and gas that will be produced in an area or country.
CCS OPEX and CAPEX include many of the components pertaining to E&P activity. Well-site and offshore oil and gas processing is replaced by injection compressors, injector well-completion tends to be simpler than producing wells, the metallurgy of the infrastructure is required to be CO2 corrosion resistant, and there would have to be some monitoring of posterity for the safety of the storage facilities/reservoir, which is somewhat similar to the needs of nuclear waste disposal sites. The cost metric would be storage cost in $ t/CO2. The total cost of CCS would be the gas separation cost at the point of emissions plus the transportation and storage cost plus a mark-up for profit. Cost will be sensitive to distance between capture plant and geological storage and the depth of the geological formation. The section of the transport pipeline system on land will be more costly per kilometer due to the complex planning systems (CCS Cost Reduction Task Force, 2015).
The UK government's study of levelized electricity costs (UK Government - BEIS, 2016, 2020) per MWh for new generating capacity commissioned in 2030 would be as follows: First of a Kind (FOAK) combined cycle gas turbine generation with CCS (CCGT-CCS) ~$120/MWh, reducing to $108 for an Nth of a Kind (NOAK) by 2040. This is competitive with the current UK strike price of new nuclear ($124/MWh for Hinkley Point) and offshore wind (which ranges from $75 to $232.5/MWh) (UK Government – BEIS, 2019). Currently, a UK coal-fired power station emits between 750 and 900 kg CO2/MWh. This makes the cost of transporting and storing CO2 around $79.5/MW CO2. The CCGT emits about half the CO2 per kilowatt-hour and hence the cost is ~40/t CO2. In comparison, BP estimated that in Salah CCS land site, the separation, transportation, and storage cost was $10/t CO2 in 2000; however, the ongoing monitoring costs were not included. US DOE (Department of Energy), (2015) estimates a FOAK cost of adding CCS to a super-critical thermal power unit to be $124–133/MWh and an NOAK for $108/MWh. This gives a cost of avoided CO2 of $74–83/t CO2 for FOAK and $55 for an NOAK. They further gave estimates of the cost of avoided CO2 for other industries for different counties depending on the access to geological storage. For countries with access to land storage, like the USA, this cost per ton of CO2-avoided emission is as follows: iron and steel, $77; cement, $124; fertilizer, $26; and biomass to ethanol, $22.
Most of these costs for avoided emissions are < $80/ton of CO2, with cement being the most expensive. This is equivalent to the current carbon tax paid in the Norwegian Sector of the N sea, which includes the EU ETS. These carbon values have been used in Integrated Assessment Models (IAMs) to evaluate the Socio Economic Pathways (SSPs) to achieve Representative atmospheric GHG Concentration pathways (RCP) to limit global temperature rise to 2°C (RCP 2.6) and 1.5°C (RCP 1.8). All the models show that large quantities of CCS are required to reduce ongoing emissions and both afforestation and BECCS are required to remove 10 Gt of CO2/year to achieve net zero by 2050. This highlights the urgent need to start the CCS industry and get on top of the technology, in order to ramp up to the scale required by 2050. $80/t means that in 2050, the new global CCS industry will have an annual turnover of $3 trillion, using the IEA emission figures of 37 GT CO2e/year. The question is how does society pay for the storage.
Behavioral, Economic, and Policy Changes to Kick Start CCS
A wide array of behavioral and policy changes are required to drive the technological measures needed to limit the increase in global mean temperature to 2°C or the Paris aspiration of 1.5°C above preindustrial levels. The recent IPCC report on Global Warming of 1.5°C demonstrated the large increase in risk to the earth's ecosystem services for an increase in warming from 1.5 to 2°C which may have a larger cost than the $3 trillion annual CCS cost (Allen M. R. et al., 2018; Rogelj et al., 2018), so CCS needs to be kick started quickly to fully decarbonize energy use and provide infrastructure for GGR BECCS and DAC storage as well.
Energy Use Systems and Economic Changes to Achieve Net Zero
Existing and affordable technologies such as nuclear, geothermal, wind, solar, bioenergy, and tidal electricity generation and heat provision are available to substantially reduce greenhouse gas emissions (Edenhofer et al., 2014). Their large-scale adoption will require a large investment in new infrastructure. Many studies, such as IEA [BP, 2020; IEA (International Energy Agency), 2020a] predict the continuing need to use fossil fuels to meet the growing demand for energy in order to achieve the socioeconomic objectives and sustainability goals in the global economy. If fossil fuels continue to be used, then combustion products cannot be released to the atmosphere. If they are, then in order to limit warming to 2°C, McGlade and Ekins (2015) suggest that 82% of coal reserves, 49% of gas, and 33% of oil will have to be left unburnt in the ground. Pragmatically, the only way that the world energy needs, predicted by the IEA-defined policy scenario, can be satisfied up to and beyond 2050 and at the same time reduce GHG emissions, is to capture and store carbon dioxide resulting from the fossil fuel burn in geological repositories (CCS).
It is clear that fossil fuel use for energy generation without CCS needs to be phased out [Edenhofer et al., 2014; Allen M. et al., 2018; IEA (International Energy Agency), 2020a] Combined energy-economic-climate modeling suggests that to achieve climate mitigation goals, annual investment flows for extraction of fossil fuels and fossil fuel power plants without CCS would need to decline, with increased investment flows into energy efficiency, power plants with CCS, and other modes of energy generation including renewables and nuclear (Edenhofer et al., 2014). This presents the oil and gas industry with some significant challenges, but CCS provides a significant opportunity, as many of the skills required for oil and gas extraction for energy are those required to locate suitable geological locations for CO2 storage and to move the CO2 from the point of generation to the long-term geological storage. In addition, the use of CO2 for tertiary recovery is an established technology used in producing oil, and this provides symbiosis between the CCS and the fossil fuel production industries.
The same teams drilling wells for fossil fuel extraction in 2019 may be drilling wells for CCS in 2030. This may also smooth out the OGI boom and bust cycles. Furthermore, hydrocarbons are valuable commodities that provide a range of products other than energy and will be extracted for these purposes even if the hydrocarbons are not burned for energy generation; however, there must be an incentive to start the transition.
Public Perception and Cost to Society
Currently, the public's perception of climate change is that “something needs to done” and the high media profile of a Swedish teenager Greta Thunberg and the galvanism of organizations like Extinction Rebellion and Greenpeace have created a sense of urgency about “doing something.” However, the world economic system is wedded to continuous growth which is driven by consumers in all parts of the world wanting a leveling up of their economic situation and having food security, housing, health provision, and other aspects of higher standards of living. The concept of polluter pays is lost in the fear of having to actually change consumption habits or having higher prices for energy use. In addition, the millennium goals aim for an equitable standard of living for all humans and human nature interprets this as leveling up. Politicians are wary of changing policies about houses, energy use, and transportation that curtail growth for fear of reducing disposable income and not being re-elected. As a result, it is easy for NGOs and political parties to blame large corporations who produce the energy, materials, manufactured product, and food and demand they decarbonize so people can continue with their consumerism. The fossil fuel industry is demonized because it provides the fossil fuel for the economy to run when in fact, the oil and gas industry holds all the skills, expertise, capital, and assets that have the ability to decarbonize energy use. If “big bad oil” steps up to the plate to kick start the CCS industry, it will transform its image into the “savior of the climate” and avoid having its shares divested by well-meaning organizations.
Government Policies
At the government level, energy security and climate change mitigation targets are often poorly aligned and policy is contradictory. At the industry level, there is limited engagement from the oil and gas industry with the climate change dialog, but where such engagement has occurred, the outcomes have been extremely useful. More dialog between large energy corporations and those interested in limiting climate change (including governments, environmental NGOs, academia, and wider society) can only help to build trust between the various stakeholder groups and to find a common ground for shared action. Taking the UK as an example, over the last decade, there have been several research and engineering projects that have been funded by the UK government and the EU to develop CCS technology up to funding front-end engineering designs (FEED). However, these stopped short of providing funding for building pilot commercial CCS–equipped power stations. In addition, using several fiscal levers has been introduced to decarbonize electricity generation. The first is essentially a tax on carbon emissions which adds cost to fossil fuel generation to augment. The second type is to encourage investment in low carbon generation. These are renewable obligation certificates (RoCs) up to 2005 for large-scale power stations and latterly Feed in Tariffs (FITs) for small-scale heat and electricity generation. More recently, the Contracts for Difference (CfD) to subsidize low carbon electricity/heat production has been introduced. The added cost or these schemes are actually passed on to the energy consumer though their consumption billing. In this scheme, power generators have to bid at CfD auctions which are the lowest price to be paid. In 2020, CCGT-CCS was added to the eligible low carbon technologies. These policy levers have resulted in lowering the carbon intensity of UK electricity from ~850 CO2e/kW in 1990 to an average of 241 in 2019 but had not yet encouraged commercial CCS to start.
Actionable Recommendations
Several actions are recommended to spur the development of a CCS industry. These include push and pull incentives by governments, oil and gas industry transition to zero carbon, and changes to regulations relating to the abandonment of oil and gas wells and the decommissioning of offshore platforms and pipelines.
Push and Pull Incentives by Governments
Currently (2020), the following six countries have set legally binding net zero GHG emission targets: the UK, Sweden, Norway, France, Denmark, and New Zealand and are setting carbon budgets (CBs) for future decades to ensure the transition to net zero. These CBs should be made legally binding. The UK for example has met all carbon budgets to date, set by the Committee for Climate Change (CCC), a UK government advisory body. Meeting these targets reduced total GHG emissions by 43% from 1990, mainly from energy provision, changing from coal- to gas-fired CCGT, and increasing the proportion of renewable energy to ~30%. CCGT now generates ~40% and as it provides most of the dispatchable power to cover for the intermittency of renewables, it will still be required in the future to 2040, unless sufficient large-scale electricity storage is developed to meet this demand. Thus, it requires decarbonization with CCS. In addition, CCS is required to decarbonize metal, chemical, and cement industrial processes as well as for GGR using BECCS and DACS. It is imperative that there is government financial support for, or investment in, the FOAK CCS plant in the UK for both power and industry. The first contracts for CfD for the early CCGT-CCS systems could also be a mechanism to support early CCS introduction. In addition, a licensing scheme, similar to that for O&G exploration should be put in place for CO2 storage, and a mechanism for the long-term (centuries) responsibility for the storage should be put in place to transfer the liability to the government at some point in time.
In addition, a mechanism is required to promote carbon trading to replace the EU ETS scheme. The scheme in Norway uses EU ETS and has an additional carbon tax on top that brings the total CO2 cost to ~$80 a ton which is close to the estimated CCS carbon cost for Snøhvit (Energy Facts Norway, 2020). So, in order to create a supply chain for CCS and incentivize, its use such as carbon price in the UK would provide a carrot for the oil and gas industry to get involved in the business and also a stick to encourage industrial and power-generating companies to store their emissions. This means that the carbon tax and CCS cost need to be aligned; this would create a mechanism for the CCS industry to be economically viable. In addition, an evolutionary carbon balance approach was proposed by Zakkour et al. (2020), whereby fossil fuel resource holders manage outflows and inflows of carbon in the geosphere and create and maintain the market for geological CO2 storage.
If the principle of “polluter (consumer or end user) pays” is applied, then carbon cost or the cost of carbon storage is added to the service, energy, or commodity being purchased. This inevitably will result in an addition to the cost of living and be inflationary. To avoid inequities, the government should facilitate investment in energy efficiency across all sectors. The housing sector should have improved new building insulation standards and also regulations to improve the energy efficiency of existing commercial and domestic housing and building stock. New housing developments should be organized around self-contained communities that include schools, health facilities, shops, and work places that can be accessed by active transport such as walking and cycling. The need for commuting should be reduced by improving Internet connectivity with fiber networks to enable home or local hub working locally. Investment in electrifying public transport should be prioritized over cars as electrifying all modes of transport with the current mix of bus, train, and car will considerably increase the need for low carbon electricity. Thus, with less electricity required per capita, the cost of living increase can be constrained.
Industry Transition to Net Zero
In those countries that have net zero emission targets, the upstream oil and gas industries will have to make a transition to low carbon energy and are currently committed to eliminating operating GHG emissions. In general, these companies see the responsibility for eliminating GHG emissions from their product use as being further down the supply chain.
A report by SNC-Lavalin's Atkins Business called Engineering Net Zero (Atkins, 2020) quantified the challenge of moving to net zero while maintaining economic and social progress in the next 30 years. It identified that to decarbonize building, heating and transport of all kinds would require a massive investment on both electricity and hydrogen (H2) production. Renewable electricity from tidal, wind, and solar would increase, but as it is intermittent, it requires dispatchable power source such as CCGT-CCS, or large-scale storage, which can be quickly switched on, with nuclear providing a base load and black start capability. H2 would be used for decarbonizing transport using fuel cell technology for HGVs, buses, trains, and possibly aircraft that cannot be easily electrified. These issues are emphasized in the Committee on Climate Change (2019). H2 will also be required for industrial process and building heat using the gas grid. H2 can be made through electrolysis of excess renewable electricity, but the majority will be made by steam-reforming methane and using CCS. This provides a great boost in procurement of capital goods for all sectors of industry and energy transition for traditional O&G companies.
From this, it can be seen that most end uses for fossil fuels will require CCS so if companies that produce the oil, gas, and even coal also store the resulting carbon from their use, they will become carbon-neutral companies. An alternative for this is a viable carbon trading system that ensures net zero to the atmosphere. All the skills and technology for well-drilling and engineering, reservoir management, structure pipelines, and processing currently resides in the oil and gas industry so this transition could be seamless. O&G companies will morph into O&G and CCS companies.
In the UK, there are green shoots for the CCS and BECCS industry with a group of industrial companies in the planning stages of a CO2 collection system in the Humber and Tyne valley regions. There is also a BECCS pilot plant, funded by the UK government and DRAX company, that is proving that CO2 can be captured from the exhaust gasses of a large biomass burning power station. In NE Scotland, there is a pilot steam methane-reforming plant being built, funded by the UK government and EU, and located in the St. Fergus gas terminal. This is managed by the Pale Blue Dot Company with Shell providing the CO2 transport and storage in their depleted Goldeneye gas field, which had been decommissioned. For other European countries, Equinor, Shell, and Total have formed an alliance to plan for an EU wide CO2 collection scheme to dispose of CO2 in the Norwegian sector of the N Sea building on their Sleipner experience. In the US and Canada the infrastructure exists for CO2 transportation for large scale tertiary recovery schemes and in reality it just takes investment or tax breaks [e.g., Section 45Q tax credits for CCS (Congressional Research Services, 2020)] to expand this to CCS. From this, it can be seen that the sleeping giant of the oil and gas industry is awakening to the net zero era.
Implications for Decommissioning
Oil and gas facilities and reservoirs are currently being decommissioned without regard for the carbon cost of doing so, both in terms of the potential reuse of the assets and actual deconstruction costs. In addition, wells are being plugged and abandoned with the well-sealing system being designed for the current status, reservoir fluids in place and the reservoir pressure, which is usually depleted. No regard is made of the potential reuse of the structures and reservoirs for CO2 storage, which will usually mean repressuring the reservoir to its initial preproduction pressure. If the well-plugging does not consider potential re-pressurizing with CO2 then that reservoir will not be able to be used for CCS. The structure will have the weakness of the abandoned wells, not designed for CO2 containment, which will be very difficult to remediate after the well-head is cut below the mudline. Due to the large future requirement for CCS, all well-abandonments should be designed with this in mind and government regulation relating to this needs to change.
Using Carbon Dioxide as a Feedstock for Manufacturing Low Carbon Products
The future potential to use the separated or stored carbon dioxide as a feedstock for low carbon products is an area attracting research. We have previously mentioned the combination of CO2 with magnesium-rich brine to produce a cement that can be used to manufacture lightweight building material, thus storing the carbon. There are other mineralization pathways that can be used. Crop growing productivity can be enhanced by growing crops in an atmosphere with elevated CO2 level as is currently done in many greenhouses; this is known as CO2 fertilization. Finally, there is research into the production of synthetic and fuels and plastics from CO2 plus energy from renewables. Stored CO2 has the potential to have an intrinsic value.
Conclusions
It is clear that CCS is technically feasible and that in order to achieve both net zero and the requirements for more energy production, this industry must be up and running at a large scale by 2050. At present, electricity generation using CCGT-CCS is estimated to be of comparable cost with nuclear and renewables so its use will not adversely impact millennium goals. Only the petroleum industry has the skills to start up and maintain this huge CCS industry. If it grasps this opportunity, its image will be transformed from climate pariah to global savior. The wheel of change appears to be starting to turn.
Author Contributions
AH conceived the project and provided insight into the oil and CCS industry. PS provided insight into the IPCC and 1.5 degree research. AH and PS provided insight into BECCS, wrote, and edited the paper. Both authors contributed to the article and approved the submitted version.
Funding
The research and development work reported here was supported by the UK's Natural Environment Research Council (NERC) through the ADVENT project (NE/M019691/1) and FAB-GGR project to assess the feasibility of BECCS and afforestation (NE/P019951).
Conflict of Interest
The authors declare that the research was conducted in the absence of any commercial or financial relationships that could be construed as a potential conflict of interest.
References
Albanito, F., Hastings, A., Fitton, N., Richards, M., Martin, M., Mac Dowell, N., et al. (2019). Mitigation potential and environmental impact of centralized versus distributed BECCS with domestic biomass production in Great Britain. GCB Bioenergy 11, 1234–1252. doi: 10.1111/gcbb.12630
Allen, J., Donovan, C., Elkins, P., Gambhir, A., Hepburn, C., Reay, D., et al. (2020). A Net-Zero Emissions Economic Recovery From COVID-19. Oxford Smith School of Enterprise and the Environment. Working Paper No. 20-01ISSN 2732-4214. Oxford. Available online at: https://academic.oup.com/oxrep/article/36/Supplement_1/S359/5832003
Allen, M., Dube, O. P., and Solecki, W.. (2018). IPCC Special Report: Global Warming of 1.5°C. (Cambridge; New York, NY: Cambridge University Press).
Allen, M. R., Shine, K. P., Fuglestvedt, J. S., Millar, R. J., Cain, M., Frame, D. J., et al. (2018). A solution to the misrepresentations of CO2-equivalent emissions of short-lived climate pollutants under ambitious mitigation. NPJ Clim. Atmosph. Sci. 1:19. doi: 10.1038/s41612-018-0026-8
Astolfi, M., De Lena, E., and Romano, M. C. (2019). Improved flexibility and economics of Calcium Looping power plants by thermochemical energy storage. Int. J. Greenhouse Gas Control 83, 140–155. doi: 10.1016/j.ijggc.2019.01.023
Atkins (2020). Engineering Net Zero. SNC-Lavalin. Available online at: http://explore.atkinsglobal.com/engineeringnetzero/ (accessed August 1, 2020).
Baker-Hughes (2020). Rig Count Overview and Summary. Available online at: https://rigcount.bakerhughes.com/rig-count-overview (accessed October 2019).
BP (2020). Statistical Review of World Energy 2020. 69th Edn. Available online at: https://www.bp.com/content/dam/bp/business-sites/en/global/corporate/pdfs/energy-economics/statistical-review/bp-stats-review-2020-full-report.pdf (accessed August 2020).
Buettler, C., Charles, L., and Wurzbacher, J. (2019). The role of direct aircapture in Mitigation of Anthropogenic greenhouse gas emissions. Front. Clim. 21:10. doi: 10.3389/fclim.2019.00010
CCS Cost Reduction Task Force (2015). The Potential for Reducing the Costs of CCS in the UK. Available online at: https://www.gov.uk/government/groups/ccs-cost-reduction-task-force. (accessed August 16, 2020).
Choi, S, Drese, J. H., and Jones, C. W. (2009). Adsorbent materials for carbon dioxide capture from large anthropogenic point sources. ChemSusChem 2, 796–854. doi: 10.1002/cssc.200900036
Committee on Climate Change (2019). Net Zero Technical Report. Committee on Climate Change. Available online at: https://www.theccc.org.uk/publication/net-zero-technical-report/ (accessed October 2019).
Congressional Research Services (2020). The Tax Credit for Carbon Sequestration. Available online at: https://fas.org/sgp/crs/misc/IF11455.pdf (accessed September 1, 2020).
de Coninck, H., and Revi, A. (2018). “Strengthening and implementing the global response supplementary material,” in: Global Warming of 1.5 °C. An IPCC Special Report on the Impacts of Global Warming of 1.5°C Above Pre-industrial Levels and Related Global Greenhouse Gas Emission Pathways, in the Context of Strengthening the Global Response to the Threat of Climate Change, Sustainable Development, and Efforts to Eradicate Poverty, eds V. Masson-Delmotte, P. Zhai, H. O. Pörtner, D. Roberts, J. Skea, P. R. Shukla. (Geneva: World Meteorological Organization).
Edenhofer, O., Pichs-Madruga, R., Sokona, Y., Farahani, E., Kadner, S., Seyboth, K., . (eds.). (2014). “Climate change 2014: mitigation of climate change,” in Contribution of Working Group III to the Fifth Assessment Report of the Intergovernmental Panel on Climate Change. (Cambridge; New York, NY: Cambridge University Press).
Energy Facts Norway, (2020). Taxes and Emissions Trading. Available online at: https://energifaktanorge.no/en/et-baerekraftig-og-sikkert-energisystem/avgifter-og-kvoteplikt/ (acessed October 2020).
Equinor (2020). Our CCS Projects. Available online at: https://www.equinor.com/en/what-we-do/new-energy-solutions.html (accessed August 8, 2020).
ESA (2008). Technology Readiness Levels for Space Applications. ESA, TEC-SHS/5551/MG/ap. Available online at: https://artes.esa.int/sites/default/files/TRL_Handbook.pdf (accessed August 29, 2020).
Forster, P. M., Forster, H. I., Evans, M. J., Gidden, M. J., Jones, C. D., Keller, C. A., et al. (2020). Current and future global climate impacts resulting from COVID-19. Nat. Clim. Change 10, 913–919. doi: 10.1038/s41558-020-0883-0
Fuss, S., Canadell, J. G., Peters, G. P., Tavoni, M., Andrew, R. M., Ciais, P., et al. (2014). Betting on negative emissions. Nat. Clim. Change 4, 850–853. doi: 10.1038/nclimate2392
HM Revenue and Customs (2018). Statistics for Oil and Gas Production. Available online at: https://www.gov.uk/government/collections/petroleum-revenue-tax-prt-and-government-revenues-from-uk-oil-and-gas-production. (accessed April 16, 2020).
Holloway, S. (2009). Storage capacity and containment issues for carbon dioxide capture and geological storage on the UK continental shelf. J. Power Energy 223, 239–248. doi: 10.1243/09576509JPE650
IEA (International Energy Agency) (2013). Technology Roadmap Carbon Capture and Storage. Available online at: http://www.iea.org. (accessed 8 April 2020).
IEA (International Energy Agency) (2018). World Energy Outlook 2018. (Paris: IEA). Available online at: https://www.iea.org/reports/world-energy-outlook-2018 (accessed August 8, 2020).
IEA (International Energy Agency) (2019). World Energy Outlook 2019. (Paris: IEA). Available online at: https://www.iea.org/reports/world-energy-outlook-2019 (accessed August 8, 2020).
IEA (International Energy Agency) (2020a). World Energy Outlook 2020. (Paris: IEA). Available online at: https://www.iea.org/reports/world-energy-outlook-2020 (Accessed October 25, 2020).
IEA (International Energy Agency). (2020b). Energy Technology Perspective. (Paris: IEA). Available online at: https://www.iea.org/reports/energy-technology-perspectives-2020 (accessed October 25, 2020).
IPCC (2014). “Climate change 2014: impacts, adaptation, and vulnerability. Part A: global and sectoral aspects,” in Contribution of Working Group II to the Fifth Assessment Report of the Intergovernmental Panel on Climate Change, eds C. B. Field, V.R. Barros, D. J. Dokken, K. J. Mach, M. D. Mastrandrea, T. E. Bilir, M. Chatterjee, K. L. Ebi, Y. O. Estrada, R. C. Genova, B. Girma, E. S. Kissel, A. N. Levy, S. MacCracken, P. R. Mastrandrea, and L. L. White (Cambridge; New York, NY: Cambridge University Press), 1132.
Irlam, L. (2017). Storage Costs of Carbon Capture and Storage: 2017 Update. (Global CCS Institute). Available online at: http://hub.globalccsinstitute.com/sites/default/files/publications/201688/global-ccs-cost-updatev4.pdf (accessed August 13, 2020).
Le Quéré, C., Jackson, R. B., Jones, M. W., Smith, A. J. P., Abernethy, S., Andrew, R. M., et al. (2020). Tempory reduction in daily global CO2 emissions during COVID-19 forced confinement. Nat. Clim. Change 10, 647–653. doi.org/10.1038/s41558-020-0797-x doi: 10.1038/s41558-020-0797-x
Lippponen, J., McCulloch, S., Keeling, Stanley, T., Berghout, N., and Berly, T. (2017). The politics of large scale CCS deployment. Energy Proc. 114, 7581–7595. doi: 10.1016/j.egypro.2017.03.1890
Matter, J., and Kelemen, P. B. (2009). Permanent storage of carbon dioxide in geological reservoirs by mineral carbonation. Nat. Geosci. 2, 837–841. doi: 10.1038/ngeo683
McGlade, C., and Ekins, P. (2015). The geographical distribution of fossil fuels unused when limiting global warming to 2°C. Nature 517, 187–190. doi: 10.1038/nature14016
Miller, R. G., and Sorrell, S. R. (2014). The future of oil supply. Phil. Trans. R. Soc. A 372:2006. doi: 10.1098/rsta.2013.0179
Pershad, H., Durusut, E., Crerar, A., Black, D., Mackay, E., and Olden, P. (2012). Economic impacts of CO2 enhanced oil recovery for Scotland - Final report. Scottish Enterprise Glasgow. Available online at: https://researchportal.hw.ac.uk/en/publications/economic-impacts-of-co2-enhanced-oil-recovery-for-scotland-final- (accessed October 2020).
Rochelle, G. T. (2009). Amine scrubbing for CO2 capture. Science 325, 1652–1654. doi: 10.1126/science.1176731
Rogelj, J., Shindell, D., Jiang, K., Fifita, S., Forster, P., Ginzburg, V., et al. (2018). “Mitigation pathways compatible with 1.5°C in the context of sustainable development,” in: Global Warming of 1.5°C. An IPCC Special Report on the Impacts of Global Warming of 1.5°C Above Pre-industrial Levels and Related Global Greenhouse Gas Emission Pathways, in the Context of Strengthening the Global Response to the Threat of Climate Change, Sustainable Development, and Efforts to Eradicate Poverty, eds V. Masson-Delmotte, P. Zhai, H. O. Pörtner, D. Roberts, J. Skea, P. R. Shukla. (Geneva: World Meteorological Organization).
Spence, B., Horan, D., and Tucker, O. (2014). The peterhead-goldeneye gas post-combustion CCS project. Energy Procedia 63, 6258–6266. doi: 10.1016/j.egypro.2014.11.657
UK Government - BEIS (2016). Electricity Generating Prices. Available online at: https://assets.publishing.service.gov.uk/government/uploads/system/uploads/attachment_data/file/566567/BEIS_Electricity_Generation_Cost_Report.pdf (accessed August 16, 2020).
UK Government – BEIS (2019). Contracts for Difference Second Round Allocation Results. Available online at: https://assets.publishing.service.gov.uk/government/uploads/system/uploads/attachment_data/file/643560/CFD_allocation_round_2_outcome_FINA (accessed January 16, 2020).
UK Government - BEIS (2020). Electricity Generation Costs. Available online at: https://www.gov.uk/government/publications/beis-electricity-generation-costs-2020 (accessed August 29, 2020).
UNFCCC (2016). Paris Agreement. (United Nations Treaty Collection). Available online at: https://unfccc.int/process-and-meetings/the-paris-agreement/the-paris-agreement (accessed September 2019).
US DOE (Department of Energy) (2015). Available online at: http://energy.gov/fe/articles/does-carbon-utilization-and-storage-atlas-estimates-least-2400 (accessed January 3, 2020).
Keywords: CCS, carbon capture and storage, oil and gas industry (O&G), skills, market size and growth, negative emissions, grenhouse gas removal
Citation: Hastings A and Smith P (2020) Achieving Net Zero Emissions Requires the Knowledge and Skills of the Oil and Gas Industry. Front. Clim. 2:601778. doi: 10.3389/fclim.2020.601778
Received: 01 September 2020; Accepted: 13 November 2020;
Published: 18 December 2020.
Edited by:
Volker Sick, University of Michigan, United StatesReviewed by:
Phillip Williamson, University of East Anglia, United KingdomStefano Stendardo, Italian National Agency for New Technologies, Energy and Sustainable Economic Development (ENEA), Italy
Copyright © 2020 Hastings and Smith. This is an open-access article distributed under the terms of the Creative Commons Attribution License (CC BY). The use, distribution or reproduction in other forums is permitted, provided the original author(s) and the copyright owner(s) are credited and that the original publication in this journal is cited, in accordance with accepted academic practice. No use, distribution or reproduction is permitted which does not comply with these terms.
*Correspondence: Astley Hastings, astley.hastings@abdn.ac.uk