A Novel Approach for Visualizing Mixing Phenomena of Reactive Liquid-Liquid Flows in Milli- and Micro-Channels
 Torben Frey1
  Felix Kexel1
  Kayla Reata Dittmer1
  Sven Bohne2 Marko Hoffmann1* Hoc Khiem Trieu2
  Michael Schlüter1
- 1Institute of Multiphase Flows, Hamburg University of Technology, Hamburg, Germany
- 2Institute of Microsystems Technology, Hamburg University of Technology, Hamburg, Germany
Modular milli- and micro-structured systems represent a promising approach to exploit the potential of micro-process technology, including precise reaction control and scale-up. A major drawback of micro-structured devices is fouling and mixing mechanisms need to be investigated phenomenologically to better understand the processes that lead to fouling. Previous work was conducted to resolve 3D concentration fields by means of Laser-Induced Fluorescence (LIF) using a Confocal Laser Scanning Microscope (CLSM) (Frey et al., J Flow Chem, 2021, 11, 599–609). While the CLSM-LIF method yields detailed insight into concentration fields down to a few micrometers, it is limited to stationary flow structures only. Aubin et al. (Chemical Engineering Science, 2010, 65, 2065–2093) give a comprehensive review of methods to analyze mixing behavior. Most recent optical measurement methods rely on the detection of a single compound in mixtures. In case of reactive mixing, Tthe state of the art procedures to locally visualize micro mixing relies on tracking a reaction product which forms on molecular scale. In literature, only small micro-structures are manufactured from transparent materials, however larger milli-structures often lack optical accesses with sufficient quality. Selective laser-induced etching (SLE) is a new technique which enables the fabrication of larger milli-structures in transparent materials that are relevant for industry-scale applications. This work develops a method based on a concept of Kexel et al. (Chemie Ingenieur Technik, 2021, 93, 830–837) visualizing the selectivity of a competitive-consecutive gas-liquid reaction in a Taylor bubble flow. The main goal of this work is the analysis of the absorbance spectra of bromothymol blue (BTB) at different pH values in a miscible liquid-liquid system in a fused silica split-and-recombine mixer. The milli-structure of the mixer is manufactured by means of SLE. Backlight at different wavelengths is pulsed matching the recording frequency. In contrast to conventional UV/Vis setups, the absorbance is recorded locally within the mixer. The proposed method yields the 2D concentration distribution of multiple species with high spatial resolution. The spatially resolved reactant and product distribution unveils micro mixing and can yield important information about local root causes of fouling.
Introduction
The joint research project KoPPonA 2.0 by the ENPRO (Energy Efficiency and Process Intensification for the Chemical Industry) initiative develops continuous processes with demands especially towards fouling. The capability of micro mixers to reduce fouling was shown by Bayer et al. (2000) for a radical polymerization process. While the industrial application of micro- and milli-mixers is already manifested, the underlying mixing phenomena are still not understood. This field of research is growing rapidly due to new manufacturing procedures, high computational resources and new analysis systems.
This work proposes a new analysis method which is capable of tracking multiple species reaction systems in continuous milli-mixers. The novel imaging UV/Vis spectroscopy requires an optical access and therefore, a transparent mixer. Selective laser-induced etching (SLE) conducted at the Institute of Microsystems Technology enables the fabrication of relatively large milli-structures in transparent materials. For this purpose, an off-the-shelf split-and-recombine mixer designed by Ehrfeld Mikrotechnik GmbH is manufactured from fused silica glass. The mixer is shown in Figures 3B, D. The novel method helps to understand the complex interaction of residence time, micro mixing and chemical reaction as well as fast design and optimization studies of milli- and micro-systems with high importance for research and industry.
Optical Measurement Techniques
Optical measurement techniques are among the most used analysis methods for fluid systems. Previous work was conducted to resolve 3D concentration fields by means of Laser-Induced Fluorescence (LIF) using a Confocal Laser Scanning Microscope (CLSM) (Frey et al., 2021). While the CLSM-LIF method yields detailed insight into concentration fields down to a few micrometers, it is limited to stationary flow structures only. Aubin et al. (2010) give a comprehensive review of methods to analyze mixing behavior. Aubin et al. (2010) give an extensive overview on the conventional methods in micro systems. Yue et al. (2012) consolidate optical and other spectroscopic methods for micro-TAS (Total Analysis Systems). The review discusses non-invasive online methods for concentration and reaction monitoring. Some of the common methods are introduced briefly in the following. Rapid technological advances in the past decades have both enabled computational investigations and design studies of micro mixers. The fabrication technology for micro channels with optical access is available and well established in the field. Aided by CFD and dye shadowgraphs, the 2D (depth averaged) concentration distribution within micro mixers can be determined (Parsa and Hormozi, 2014; Bazaz et al., 2018; Chen et al., 2018; Mariotti et al., 2018; Mariotti et al., 2019; Huang et al., 2021). Confocal laser-induced fluorescence (LIF) allows even deeper insights into stationary flow systems, yielding 3D concentration fields of micro channels with high spatial resolution (Hoffmann et al., 2006; Tsai and Wu, 2011; Hermann et al., 2018; Frey et al., 2021). The previously mentioned methods rely on non-reactive characterization methods and therefore have (depending on data resolution) limited relevance concerning the quality of micro mixing, i.e., the mixing at molecular level.
For this purpose, chemical reactions can be used to obtain mixing information on smaller scales for their occurrence on molecular level. The simplest method is a single reaction system, where the product can be measured by, e.g., UV/Vis spectrometry (Kockmann et al., 2006; Schurr et al., 2016; Romano et al., 2021) or by calorimetry (Reichmann et al., 2019). By changing the reaction timescale through the concentration of the limiting species, the micro mixing timescale can be estimated (Entesari et al., 2010; Mariotti et al., 2021). A more complex reaction system, such as the Villermaux-Dushman reaction (Gobert et al., 2017; Reckamp et al., 2017) can be used to quantify the segregation of the fluids within the mixer. Two parallel reactions compete for a limiting species at different rates, and the product of the slow reaction is favored when micro mixing is slow. The concentration of one of the products is measured by, e.g., UV/Vis or NIR spectroscopy. Kexel et al. (2021) extends the principle of competing reactions with measuring the concentration of two products simultaneously with imaging UV/Vis spectroscopy. This allows high spatial and temporal resolution of the selectivity in complex reaction systems.
Fluid Mechanics in a Split-and-Recombine Mixer
Split-and recombine mixers, also known as cascade mixers, are a type of serial lamination mixers. The mixer used in this work is a milli-structured split-and-recombine channel with characteristic length d in the order of a millimeter. The mixing principle creates laminae by splitting, rearranging and recombining the fluid flow. The numbers of laminae created (2x+1) depends on the number of split-and-recombine operations x. Typically, the fluid flow is stationary and laminar for Re < 300. By creating a large number of laminae, the diffusion area as well as the required diffusion length is largely reduced and micro mixing is enhanced. At low Reynolds numbers (i.e., Re < 100).
which relates the specific convection of momentum to the diffusion of momentum (i.e., viscosity ν of the reagents) with characteristic velocity u and characteristic diameter d, creating thin laminae is the dominating mechanism in a Stokes-like regime. At higher Reynolds numbers secondary flows (sf) come into effect, such as stationary Dean vortices. The Reynold number marking the transition from Stokes-like flow to secondary flows is called Resf in this work. Rajabi et al. (2012) report this transition to be in the range of Resf > 13 to Resf > 31 for a split-and-recombine mixer with sharp 90-degree turns, in a flat C-split-and-recombine geometry Chen et al. (2018) show a similar figure with Resf > 20. A deep insight into the mixing mechanism is given by Hermann et al. (2018) using CLSM-LIF on a helical split-and-recombine structure similar to the one used in this work. Here, the transition to the secondary flow regime could be improved from Resf > 120 to Resf > 50 by optimization of the split-and-recombine geometry. The helicity of the channel can be regarded through the Dean number
with the helix pitch p and the helix radius r. In the split-and-recombine mixer used in this work, De = 1.48Re. At De < 50, no secondary Dean flows are expected. The mass transport property of a system is described by the Schmidt number
which is usually much larger than one in liquid flows, meaning that many fast reactions are limited by the small diffusion coefficient D. To determine whether the reaction is mass transfer limited, the second Damkoehler number
can be utilized. The DaII compares the reaction rate constant k to the diffusion rate over characteristic length L.
Materials and Methods
This work combines the selective laser-induced etching (SLE) technology to manufacture milli-structures from fused silica glass with the spatially resolved imaging UV/Vis spectroscopy to allow detailed insights into micro mixing of reactive systems.
UV/Vis Spectroscopy
Conventional UV/Vis spectroscopy measures the attenuation of light through a chemical species. A optical fiber probe emits light of different wavelengths, ranging from ultra violet (UV) to visible (Vis) light. The attenuation at the measuring point is recorded, yielding the absorption spectrum of the sample in that point. Light of different wavelengths can be attenuated differently by species and depends on, e.g., temperature or pH, as shown for bromothymol blue (BTB) in Figure 1A. The absorbance
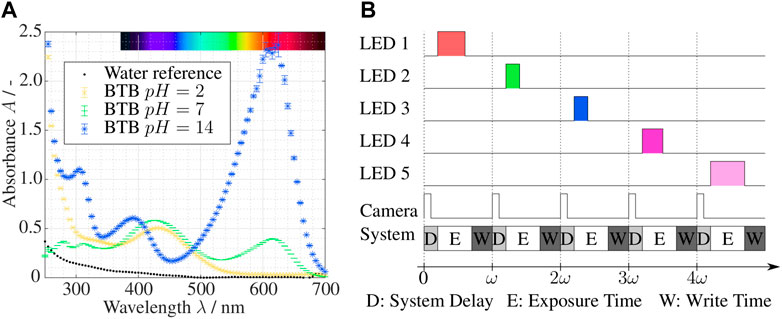
FIGURE 1. (A) UV/Vis spectrum of bromothymol blue at different pH (T =22°C [BTB]=0.001%), recorded on a Cary Eclipse Fluorescence Spectrometer by Agilent; (B) Temporal sequence of LED power supply, camera trigger signal and recording routine with frequency ω.
is the sum of each attenuating species’ extinction coefficient ɛ, concentration c and absorption length l of the species i at a wavelength λ. As the extinction coefficient is a physical property, conventional UV/Vis spectroscopy allows concentration measurements in the measuring window of the probe. The conventional UV/Vis spectroscopy is suitable for homogeneous samples and is often used inline as part of the control system of continuous processes.
This work uses the novel method of imaging UV/Vis spectroscopy described by Kexel et al. (2021). Imaging UV/Vis spectroscopy utilizes the correlation Beer-Lambert law from Eq. 5 to create a spatially resolved distribution of species’ concentration or pH. Instead of creating a large spectrum as shown in Figure 1A, the domain is illuminated with only a discrete number of LEDs with a defined dominant wavelength. These LEDs illuminate the domain of interest sequentially, and an image is taken at each instance in time matching the LED frequencies. This procedure is visualized in Figure 1B, where the recording frequency of the camera is ω which lies in the range of milliseconds. The duration of the LED illumination can be varied within the range of the camera exposure time in order not to overexpose, and the camera delay and write time need to be considered. As result, a series of absorbances A (λj) for the wavelengths j are obtained for each pixel of the recorded image. Since ω is very small, the assumption of simultaneous recording holds not only for steady flows, but also for some transient flows. From Eq. 5, the concentration or the optical depth of multiple species (depending on the number of LEDs) can be calculated as a depth averaged variable for each pixel of the recorded image. This concept allows new insights into micro- and milli-systems compared to conventional optical measurement options. It is important to note the limitation to 2D depth-averaged information. It is currently not possible to extract 3D information with a single camera setup.
Selective Laser-Induced Etching
Selective laser-induced etching (SLE) is a two-step fabrication process to produce 3D structures in transparent materials, also known as in-volume selective laser induced etching (ISLE) or femtosecond laser induced chemical etching (FLICE). Fused silica is chosen due to the good optical quality of the optical access and the well know fabrication parameters. The advantage of SLE over conventional etching processes lies in the capability to fabricate larger structures in the order millimeters instead of micrometers.
The fabrication process is shown in Figures 2A–C. In a first step, the transparent fused silica glass is modified internally by ultrashort pulsed laser radiation (i.e., fs or ps) to increase the chemical etchability locally. The high resolution of up to 1 μm is achieved through the multi-photo process and microscope objectives. The focus is scanned inside (in volume and surface) the glass to modify a 3D connected volume with contact to the surface of the workpiece. In a second step, the modified material is selectively removed by wet chemical etching resulting in the development of the 3D product. The selectivity, the etching rate ratio of the modified material vs non-modified material in fused silica glass, can be up to 1,400 under optimal process conditions (Gottmann et al., 2017).
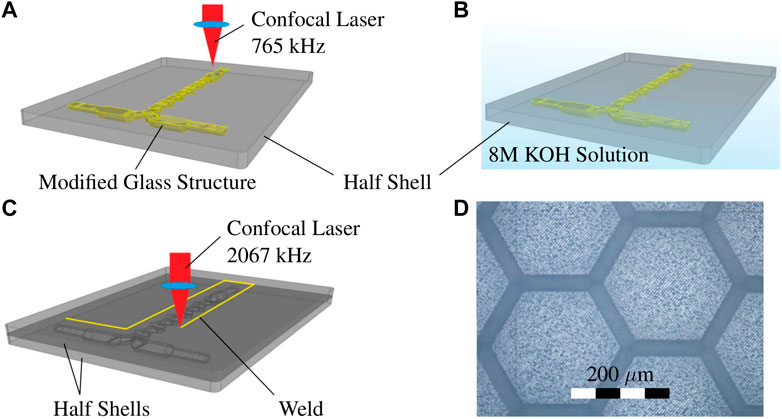
FIGURE 2. SLE fabrication: (A) Laser-modification of one half shell (fused silica glass), laser specifications: 1,030 nm, 765 kHz, 2 ps with 20 × 0.4 NA objective; (B) wet chemical etching of half shell in a 8M KOH ultra sound bath, 24 h at 82°C; (C) laser welding of the two half shells, laser specifications: 1,030 nm, 2067 kHz, 0.4 ps and 20 × 0.4 NA objective; (D) microscopic image of surface roughness of etched fused silica glass.
In this experiment a Lightfab 3D Printer manufacturing version is used for the fabrication. A 1030 nm fs laser with a repetition rate of 765 kHz and a pulse duration of 2 ps is used, both parameters are adjustable. The writing velocity is very fast with 200 mm/s, due to the high dynamic 3D micro scanner, to minimize the writing time and increase selectivity. The laser is focused from the top of the sample using a 20 × 0.4 NA objective. The pulse laser energy is 650 nJ at the bottom surface and is decreasing linearly to the top surface with 300 nJ. Reused fused silica optical photo lithography masks of 2.3 mm thickness are used (Virgin polished grade, Toppan Photomask Inc, United States) as the basic material. The 3D design of the split-and-recombine mixer is divided into an upper and a lower half shell and were laser-written separately (see Figure 2A). Due to the large channels and in sum a quite big free volume to write and etch, a separated fabrication of the two half shell is less challenging than the fabrication of the whole mixer during a single laser writing and etching step.
For etching, 8M KOH solution is used which provides good selectivity and fast etching. A temperature of 82°C results in faster etching rate, which is around 300 μm/h at surface and slows for smaller structure due to diffusion and transport limitations. In order to accelerate the transport of the reaction products and to stabilize the etching speed during the long etching time, an ultrasound is coupled in for 24 h (see Figure 2B). The interaction of all parameters is crucial for optimal results. Of course, this means that the laser paths for generating the 3D structure must also be optimized. Due to the subtractive nature of the SLE process a 3D CAD volume model of the areas which should be removed is necessary. These volume is replaced by the outer contours during the path data generation and, if necessary, also by partial or full hatching of the enclosed volume. This process of translating the 3D volume model into laser path data is called slicing (contour) and hatching. The distance between the individual slicing and hatching tracks must match the laser parameters. Otherwise, the written glass material is under-exposed and slow to etch or overexposed, which causes cracks and fissures. The slicing distance used is 5 μm and the hatching distance 12 μm of the complete written volume. Even with optimized laser paths and highest writing velocity of 200 mm/s the overall writing time of a half shell is approximately 4 h due to the large internal structure of the milli-mixer.
After successful fabrication of the two half shells the union of both parts was accomplished by laser welding with the same machine using different laser parameters. The pulse laser energy is 1,380 nJ, repetition rate of 2067 kHz, pulse duration of 0.4 ps, writing velocity 15 mm/s and a continuous writing mode instead of using the galvo scanner (Gottmann et al., 2019). The laser welding is schematically shown in Figure 2C. The surface roughness was determined for similar process parameters on flat etched fused silica surface. The root mean square (EN ISO 4287:1998) of the surface midplane was measured at Rq = 0.90 μm (see Figure 2D). It is assumed that the split-and-recombine mixer has similar surface parameters.
Experimental Setup
For the reactive test system a simple single phase neutralization reaction is used. A 1 M HCl solution (ChemSolute, 35–38% p. a., CAS: 7647-01-0) and a 1 M NaOH solution (Merck Millipore, 1 M, CAS: 1310-73-2) are prepared in aqueous solution. The indicator bromothymol blue (Merck Millipore; CAS: 76-59-5) in 70% ethanol (ChemSolute, purity: 99%, CAS: 64-17-5) is added to both solutions prior to the experimental runs. The schematic setup is shown in Figure 3A. The base and acidic solutions are conveyed through pressurized vessels (B-01, B-02) from Thielmann UCON GmbH, the volume flow rates are controlled by two coriolis type flow controllers (FIC-01, FIC-02) by Bronkhorst Deutschland Nord GmbH. The split-and-recombine mixer (Kaskadenmischer 15 from Ehrfeld Mikrotechnik GmbH) is fabricated from fused silica glass via SLE (see section 2.2). The split-and-recombine mixer is shown in Figures 3B, D. The outlet flow is collected in a waste tank (B-03).
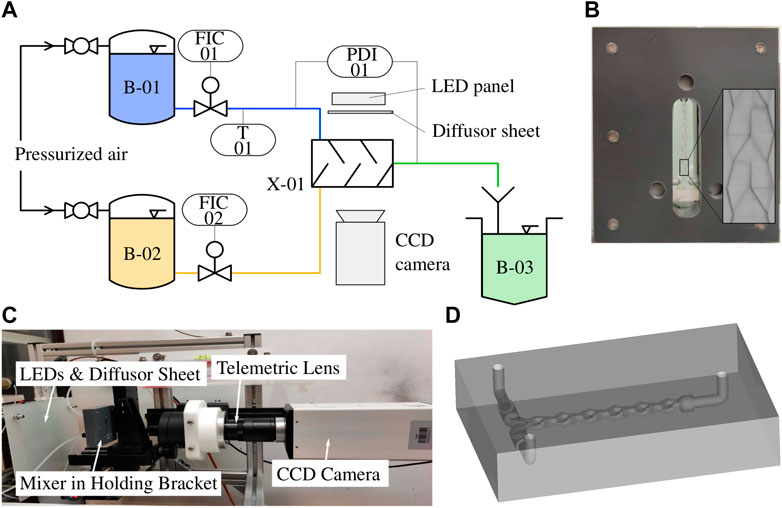
FIGURE 3. (A) Schematic setup of the imaging UV/Vis spectroscopy with flow controllers (FIC-01, FIC-02) and split-and-recombine mixer (X-01); (B) split-and-recombine mixer (X-01) fabricated via SLE (fused silica glass) in holding bracket; (C) setup with diffusor sheet, mixer in bracket and CCD-camera (Sensicam qe by PCO Imaging) with the telemetric lens (Correctal T60/1.02D by Sill Optics); (D) 3D-model of the split-and-recombine mixer (X-01).
The LED panel is custom made by JLCPCB GmbH. The different LED types used in this work (see Table 1) are mounted on a LED panel via surface mount technology (SMT) to achieve a high packing rate of the LEDs. An Arduino micro controller is used to synchronize the LED panel and the CCD camera according to Figure 1B. A Sensicam qe by PCO Imaging AG is used with the telemetric lens Correctal T60/0.12D by Sill Optics GmbH to only capture parallel light Figure 3C. To account for the sensitivity offset of the CCD chip at the different wavelengths, the LEDs power-on time is adjusted within the exposure time to obtain equal intensities. The field of view extends over three split-and-recombine structures of the mixer. The process and equipment parameters are summarized in Table 2.
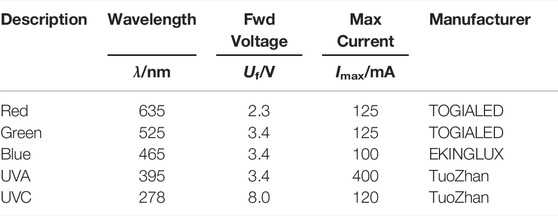
TABLE 1. Light emmitting diodes (LEDs) used in the imaging UV/Vis spectrometry setup.

TABLE 2. Operating conditions and system specifications.
Results and Discussion
To quantify the spatially resolved mixing quality and reaction yield achieved with the split-and-recombine mixer, Reynolds numbers in the range from 5 to 55 are investigated. The NaOH-HCl system contains 0.001 g/g BTB and the volume flow is adjusted at the sub-stoichiometric inlet (in the range of
Calibration
The initial light intensity I0(λ) is recorded with DI-water in the domain. In order to determine the extinction coefficitent ɛi (λj) for each species, the domain is filled with only one species at a time to record the absorbance. As a consequence, Eq. 5 reduces to
The BTB concentration is constant throughout the domain and the attenuation coefficient μi (λj) = ɛi (λj)ci is obtained for each pixel of the domain, for each species i and for each wavelength j. With calibrating the absorption length in each pixel, the imaging UV/Vis spectroscopy method reveals the species’ normalized absorption length
which is assumed to be equal to the species volume fraction in that pixel. The calibration procedure is rather complex compared to other optical analysis methods and needs to be performed for each field of view of the camera.
Visualizing Reactive Mixing
The set of equations Ai (λj) from (5) can be rewritten as
and is solved for the optical depth of each species i with μi (λj) = ɛi (λj)ci. The system has one unique solution, if the number of recorded absorbances is equal to the number of attenuating species (i.e., i = j) and the species have distinguishable absorbance spectra (i.e., the system is linearly independent).
Figure 4 shows an exemplary raw image (i.e., intensity I1) at the wavelength λ = 525 nm and the resulting normalized absorption lengths of the reactants NaOH and HCl, and the neutral solution as the product. The absorption lengths li are determined from a total of four raw images (I1 (λi)) at the wavelangths 395, 465, 525, and 635 nm as well as the calibration images I0 (λi) in a water/ethanol filled channel. The extinction coefficients and the normalized absorption lengths are derived following Eqs 6, 7 from images taken with NaOH, HCl and water (pH = 7) filled channels, respectively. For the investigated range (5 < Re < 55), the fluid dynamics can be described as laminar and steady. The Stokes-like lamination regime is expected for this Reynolds number range, as the transition to the secondary flow regime Resf occurs just at the upper part of the range. The field of view of the telemetric lens extends over four complete split-and-recombine structures and will theoretically form 24+1 = 32 laminae.
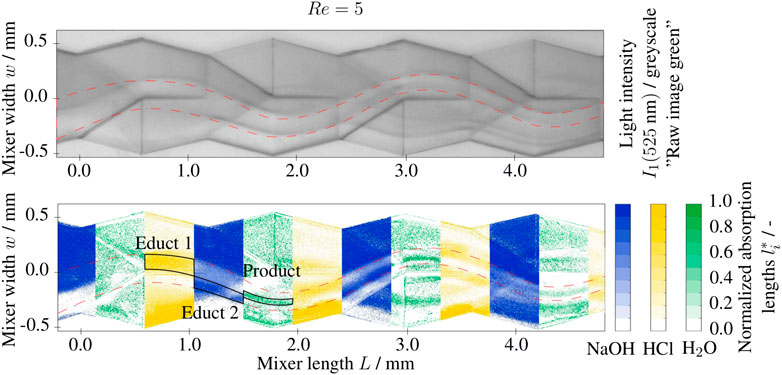
FIGURE 4. Greyscale image recorded at λ =525 nm and segmented normalized absorption lengths l* of base (NaOH), acidic (HCl) and neutral (H2O) solutions at Re =5 in the split-and-recombine mixer inlet section, 1 M NaOH and 1 M HCl solutions at the inlet with 0.001 g/g BTB.
The normalized absorption lengths (i.e., the volume fractions)
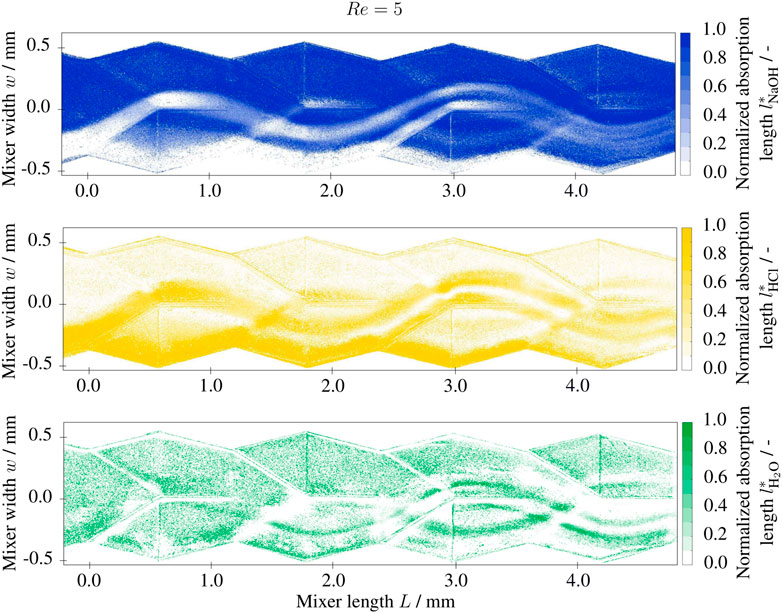
FIGURE 5. Normalized absorption length l* of base (NaOH), acidic (HCl) and neutral (H2O) solutions at Re =5 in the split-and-recombine mixer inlet section, 1 M NaOH and 1 M HCl solutions at the inlet with 0.001 g/g BTB.
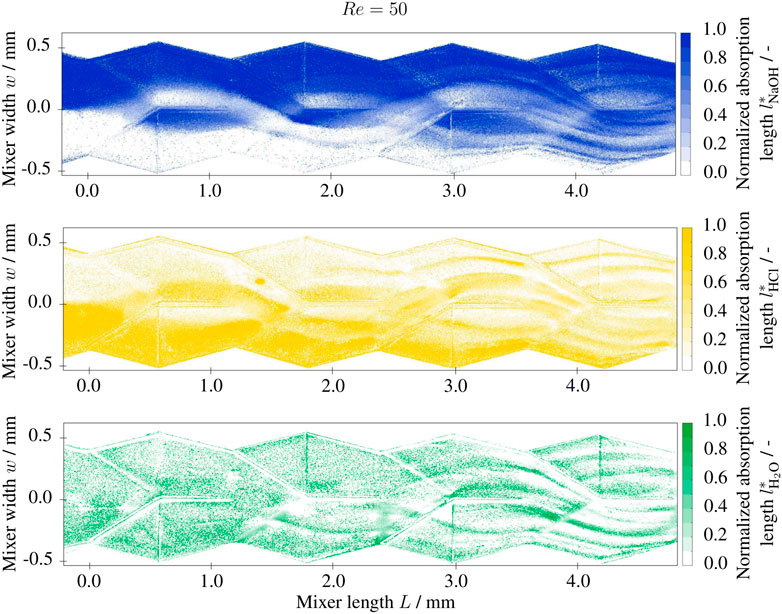
FIGURE 6. Normalized absorption length l* of base (NaOH), acidic (HCl) and neutral (H2O) solutions at Re =50 in the split-and-recombine mixer inlet section, 1 M NaOH and 1 M HCl solutions at the inlet with 0.001 g/g BTB.
The normalized absorption length of the neutral solution
with the diffusion coefficient D and the mean residence time τ = L/u. The diffusion length in the field of view lies between ld = 60 μm (Re = 50) and ld = 200 μm (Re = 5). Consequently, as long as the fluid dynamics follow the Stokes-like flow pattern, low Reynolds numbers will lead to a larger conversion due to the larger residence time. The expected behavior can be observed in Figure 7. The normalized absorption length of the product is exemplarily shown for Re = 5, Re = 25 and Re = 50 within the field of view. The post-processed data shows noise especially in the first half of the field of view. However, in the second half (L > 2.5 mm) the previously described trend can be observed nicely. At the contact areas of the reactants, the normalized absorption lengths of the neutral solution
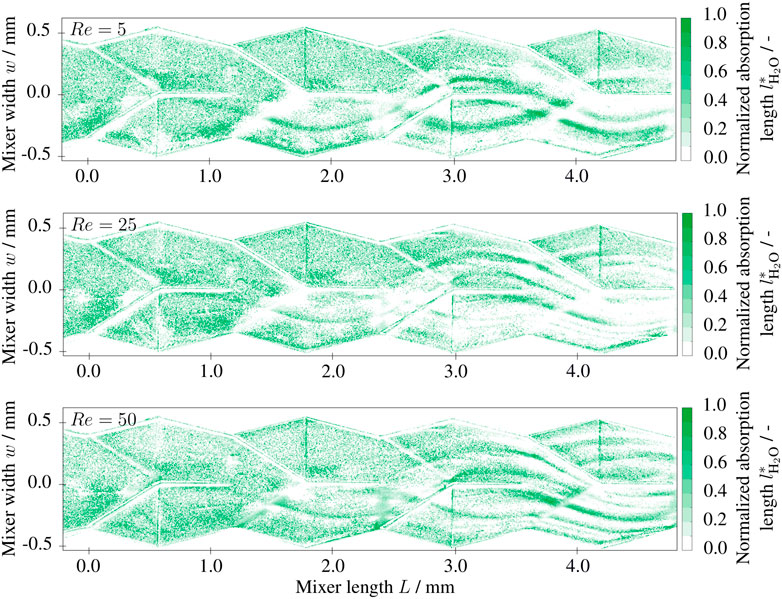
FIGURE 7. Two-dimensional depth fractions
The imaging UV/Vis spectroscopy confirms previous investigations on the fluid dynamics of a simple reactive system in a split-and-recombine mixer at low Reynolds numbers. The investigated mixer imposes a Stokes-like flow pattern at Reynolds numbers lower than Re < 55. The results show the capability of the imaging UV/Vis spectroscopy to visualize the concentration fields of reactive multi-component systems. Furthermore, the results form a good basis for measurements with more complex reaction systems especially in transient regimes, where the CLSM-LIF method reaches its limits.
Error Discussion
In stationary conditions, the standard deviation of images recorded with the same wavelength is smaller than σ < 0.004 for every pixel with a sample size of 30 images. The statistical error from the recording system is therefore negligibly small. The images are recorded with a resolution of 320 × 1376 pixels. The systematic error is more difficult to quantify. Many effects contribute to the systematic error, e.g., reflection or refraction of light through the mixer caused by non-orthogonal placement of the mixer relative to the camera setup, inconsistent illumination by the LED panel, LED intensity, BTB concentration or delays of the micro-controller. A first estimation for the error can be derived from the sum of the normalized absorption lengths
where

FIGURE 8. (A) Mean error
Conclusion
The imaging UV/Vis spectroscopy applied in this work reveals the Stokes regime in a helical split-and-recombine mixer. The mixer was fabricated via SLE, allowing large milli-structures with dimensions up to 50 mm. By visualizing the spatially resolved two-dimensional concentration field of the multi-component system, it is shown that increasing the Reynolds number in the Stokes regime and thus reducing the residence time also reduces the product yield of the continuous reactive milli-system. This method has high potential to support design studies of industry relevant milli-structures, CFD models with high Sc and DaII restrictions, and resolve mixing in multi-component systems on a molecular scale in fundamental research. The method can be used in the future to validate direct CFD models with high DaII restrictions and micro mixing models in stiff reactive systems, such as the lamellar model proposed by Fonte et al. (2020), which significantly reduce computational cost. The authors suggest CFD studies to compare state-of-the-art models with the novel analysis method. The method of imaging UV/Vis spectroscopy needs to be improved in accuracy and sensitivity. The findings of this work can be transferred to other reaction systems which are relevant to the KoPPonA 2.0 research project. With the locally resolved reaction process in the milli-mixer, micro mixing can be analyzed and the geometry can be optimized. The SLE fabrication enables design studies of different complex geometries with good optical access. More complex reaction systems, i.e., competitive and consecutive reaction schemes, are to be investigated in order to correlate product selectivity to the mixing performance. This is an important step towards making continuous flow equipment robust to fouling and consequently reducing waste, cleaning time and resources, and energy consumption.
In future research work, the cascade mixer is further to be characterized at larger Reynolds numbers. At high recording frequencies, the imaging UV/Vis spectroscopy also is capable of resolving unsteady problems and turbulent mixing. More complex competitive reaction systems are to be investigated, such as the Villermaux-Dushman reaction (Reckamp et al., 2017), the methylene blue-ascorbic acid system (Mariotti et al., 2020). Both systems can be investigated with conventional UV/Vis and the kinetics are well known from literature. With the imaging UV/Vis spectroscopy, the selectivity of these reaction systems can be locally and temporally resolved, which is not feasible with other conventional absorption imaging.
Data Availability Statement
The original contributions presented in the study are included in the article/Supplementary Material, further inquiries can be directed to the corresponding author.
Author Contributions
TF: Experiments, Concept, Software, Visualization, Writing & Editing. FK: Methodology, Validation, Editing. KRD: Experiments, Editing. SB: Manufacturing, Writing & Editing. MH: Funding Acquisition, Resources, Supervision, Project Administration, Editing. HKT: Manufacturing, Resources, Editing. MS: Funding Acquisition, Resources, Supervision, Editing.
Funding
This work has partially been funded by the joint research program KoPPonA 2.0 as part of the ENPRO initiative (Grant number 03EN2004H). The project is supported by the Federal Ministry for Economic Affairs and Climate Action on the basis of a decision by the German Bundestag.
Conflict of Interest
The authors declare that the research was conducted in the absence of any commercial or financial relationships that could be construed as a potential conflict of interest.
Publisher’s Note
All claims expressed in this article are solely those of the authors and do not necessarily represent those of their affiliated organizations, or those of the publisher, the editors and the reviewers. Any product that may be evaluated in this article, or claim that may be made by its manufacturer, is not guaranteed or endorsed by the publisher.
Acknowledgments
The authors would like to express their thanks to the continued support and collaboration of the project partners at the Laboratory of Fluid Separations at the Ruhr-University Bochum and the project partners at Ehrfeld Mikrotechnik GmbH. The authors gratefully acknowledge the financial support provided by the German Federal Ministry for Economic Affairs and Climate Action (BMWK) for the joint research program KoPPonA 2.0.
Supplementary Material
The Supplementary Material for this article can be found online at: https://www.frontiersin.org/articles/10.3389/fceng.2022.874019/full#supplementary-material
References
Aubin, J., Ferrando, M., and Jiricny, V. (2010). Current Methods for Characterising Mixing and Flow in Microchannels. Chem. Eng. Sci. 65, 2065–2093. doi:10.1016/j.ces.2009.12.001
Bayer, T., Pysall, D., and Wachsen, O. (2000). “Micro Mixing Effects in Continuous Radical Polymerization,” in Microreaction Technology: Industrial Prospects. Editor W. Ehrfeld (Berlin, Heidelberg: Springer Berlin Heidelberg), 165–170. doi:10.1007/978-3-642-59738-1_15
Bazaz, S. R., Mehrizi, A. A., Ghorbani, S., Vasilescu, S., Asadnia, M., and Warkiani, M. E. (2018). A Hybrid Micromixer with Planar Mixing Units. RSC Adv. 8, 33103–33120. doi:10.1039/C8RA05763J
Chen, K., Lu, H., Sun, M., Zhu, L., and Cui, Y. (2018). Mixing Enhancement of a Novel C-SAR Microfluidic Mixer. Chem. Eng. Res. Des. 132, 338–345. doi:10.1016/j.cherd.2018.01.032
Entesari, N., Rodermund, K. D., Heyden, S., Schulte, K., and Grünewald, M. (2010). Bestimmung der Mikromischzeiten in mikrostrukturierten Apparaten. Chem. Ing. Tech. 82, 1341. doi:10.1002/cite.201050535
Fonte, C. P., Fletcher, D. F., Guichardon, P., and Aubin, J. (2020). Simulation of Micromixing in a T-Mixer under Laminar Flow Conditions. Chem. Eng. Sci. 222, 115706. doi:10.1016/j.ces.2020.115706
Frey, T., Schlütemann, R., Schwarz, S., Biessey, P., Hoffmann, M., Grünewald, M., et al. (2021). CFD Analysis of Asymmetric Mixing at Different Inlet Configurations of a Split-And-Recombine Micro Mixer. J. Flow. Chem. 11, 599–609. doi:10.1007/s41981-021-00178-x
Gobert, S. R. L., Kuhn, S., Braeken, L., and Thomassen, L. C. J. (2017). Characterization of Milli- and Microflow Reactors: Mixing Efficiency and Residence Time Distribution. Org. Process Res. Dev. 21, 531–542. doi:10.1021/acs.oprd.6b00359
Gottmann, J., Hermans, M., and Ortmann, J. (2019). “Subtractive 3D Printing Glass by SLE: Applications and Combination with Ultrafast Laser Glass Welding (Conference Presentation),” in Frontiers in Ultrafast Optics: Biomedical, Scientific, and Industrial Applications XIX. Editors P. R. Herman, M. Meunier, and R. Osellame (SPIE), 12. doi:10.1117/12.2510054
Gottmann, J., Hermans, M., Repiev, N., and Ortmann, J. (2017). Selective Laser-Induced Etching of 3D Precision Quartz Glass Components for Microfluidic Applications—Up-Scaling of Complexity and Speed. Micromachines 8, 110. doi:10.3390/mi8040110
Hermann, P., Timmermann, J., Hoffmann, M., Schlüter, M., Hofmann, C., Löb, P., et al. (2018). Optimization of a Split and Recombine Micromixer by Improved Exploitation of Secondary Flows. Chem. Eng. J. 334, 1996–2003. doi:10.1016/j.cej.2017.11.131
Hoffmann, M., Schlüter, M., and Räbiger, N. (2006). Experimental Investigation of Liquid-Liquid Mixing in T-Shaped Micro-Mixers Using μ-LIF and μ-PIV. Chem. Eng. Sci. 61, 2968–2976. doi:10.1016/j.ces.2005.11.029
Huang, L.-R., Fan, L.-L., Liu, Q., Zhao, Z., Zhe, J., and Zhao, L. (2021). Enhancement of Passive Mixing via Arc Microchannel with Sharp Corner Structure. J. Micromech. Microeng. 31, 055009. doi:10.1088/1361-6439/abf334
Kexel, F., von Kameke, A., Tenhaus, J., Hoffmann, M., and Schlüter, M. (2021). Taylor Bubble Study of the Influence of Fluid Dynamics on Yield and Selectivity in Fast Gas‐Liquid Reactions. Chem. Ing. Tech. 93, 830–837. doi:10.1002/cite.202000241
Kockmann, N., Kiefer, T., Engler, M., and Woias, P. (2006). Convective Mixing and Chemical Reactions in Microchannels with High Flow Rates. Sensors Actuators B Chem. 117, 495–508. doi:10.1016/j.snb.2006.01.004
Mariotti, A., Antognoli, M., Galletti, C., Mauri, R., Salvetti, M. V., and Brunazzi, E. (2020). The Role of Flow Features and Chemical Kinetics on the Reaction Yield in a T-Shaped Micro-Reactor. Chem. Eng. J. 396, 125223. doi:10.1016/j.cej.2020.125223
Mariotti, A., Antognoli, M., Galletti, C., Mauri, R., Salvetti, M. V., and Brunazzi, E. (2021). A Study on the Effect of Flow Unsteadiness on the Yield of a Chemical Reaction in a T Micro-reactor. Micromachines 12, 242. doi:10.3390/mi12030242
Mariotti, A., Galletti, C., Mauri, R., Salvetti, M. V., and Brunazzi, E. (2018). Steady and Unsteady Regimes in a T-Shaped Micro-Mixer: Synergic Experimental and Numerical Investigation. Chem. Eng. J. 341, 414–431. doi:10.1016/j.cej.2018.01.108
Mariotti, A., Galletti, C., Salvetti, M. V., and Brunazzi, E. (2019). Unsteady Flow Regimes in a T-Shaped Micromixer: Mixing and Characteristic Frequencies. Ind. Eng. Chem. Res. 58, 13340–13356. doi:10.1021/acs.iecr.9b01259
Parsa, M. K., and Hormozi, F. (2014). Experimental and CFD Modeling of Fluid Mixing in Sinusoidal Microchannels with Different Phase Shift Between Side Walls. J. Micromech. Microeng. 24, 065018. doi:10.1088/0960-1317/24/6/065018
Rajabi, N., Hoffmann, M., Bahnemann, J., Zeng, A.-P., Schlüter, M., and Müller, J. (2012). A Chaotic Advection Enhanced Microfluidic Split-And-Recombine Mixer for the Preparation of Chemical and Biological Probes. J. Chem. Eng. Jpn. 45, 703–707. doi:10.1252/jcej.12we071
Reckamp, J. M., Bindels, A., Duffield, S., Liu, Y. C., Bradford, E., Ricci, E., et al. (2017). Mixing Performance Evaluation for Commercially Available Micromixers Using Villermaux-Dushman Reaction Scheme with the Interaction by Exchange with the Mean Model. Org. Process Res. Dev. 21, 816–820. doi:10.1021/acs.oprd.6b00332
Reichmann, F., Vennemann, K., Frede, T. A., and Kockmann, N. (2019). Mixing Time Scale Determination in Microchannels Using Reaction Calorimetry. Chem. Ing. Tech. 91, 622–631. doi:10.1002/cite.201800169
Romano, S., Battaglia, G., Bonafede, S., Marchisio, D., Ciofalo, M., Tamburini, A., et al. (2021). Experimental Assessment of the Mixing Quality in a Circular Cross-Sectional T-Shaped Mixer for the Precipitation of Sparingly Soluble Ccompounds. Chem. Eng. Trans. 86, 1165–1170. doi:10.3303/CET2186195
Schurr, D., Strassl, F., Liebhäuser, P., Rinke, G., Dittmeyer, R., and Herres-Pawlis, S. (2016). Decay Kinetics of Sensitive Bioinorganic Species in a SuperFocus Mixer at Ambient Conditions. React. Chem. Eng. 1, 485–493. doi:10.1039/c6re00119j
Tsai, R.-T., and Wu, C.-Y. (2011). An Efficient Micromixer Based on Multidirectional Vortices Due to Baffles and Channel Curvature. Biomicrofluidics 5, 014103. doi:10.1063/1.3552992
Keywords: micro mixing, selective laser-induced etching (SLE), imaging UV/Vis spectroscopy, reactive mixing, process intensification
Citation: Frey T, Kexel F, Dittmer KR, Bohne S, Hoffmann M, Trieu HK and Schlüter M (2022) A Novel Approach for Visualizing Mixing Phenomena of Reactive Liquid-Liquid Flows in Milli- and Micro-Channels. Front. Chem. Eng. 4:874019. doi: 10.3389/fceng.2022.874019
Received: 11 February 2022; Accepted: 13 May 2022;
Published: 06 June 2022.
Edited by:
Joelle Aubin, Université de Toulouse, FranceReviewed by:
Claudio Fonte, The University of Manchester, United KingdomZhengbiao Peng, The University of Newcastle, Australia
Copyright © 2022 Frey, Kexel, Dittmer, Bohne, Hoffmann, Trieu and Schlüter. This is an open-access article distributed under the terms of the Creative Commons Attribution License (CC BY). The use, distribution or reproduction in other forums is permitted, provided the original author(s) and the copyright owner(s) are credited and that the original publication in this journal is cited, in accordance with accepted academic practice. No use, distribution or reproduction is permitted which does not comply with these terms.
*Correspondence: Marko Hoffmann, marko.hoffmann@tuhh.de