Multi-Detailed 3D Architectural Framework for Sound Perception Research in Virtual Reality
 Josep Llorca-Bofí
 Michael Vorländer
- Institute for Hearing Technology and Acoustics, RWTH Aachen University, Aachen, Germany
The presentation of architectural design in simulation environments demands strong 3D modeling abilities. Architects usually demonstrate presentation skills that mostly address researchers in the building simulation field. However, there is still a gap between the architect’s deliverable and the contextual scenario for overarching research purposes, mainly caused by the lack of knowledge in the areas where research disciplines overlap. This dilemma is particularly present in the practice of 3D modeling for sound perception research in virtual reality since the building modelers must also gather diverse pieces of knowledge into a contained scenario: ranging from sound sources, sound propagation models to physically based material models. Grounded on this need, this article presents a comprehensive framework, defined by the visual and acoustic cues—geometries, materials, sources, receivers, and postprocessing—on one side and three levels of detail on the other. In this way, very specific research application needs can be covered, as well as a modular concept for future modeling demands. The interconnection between every model element is particularly designed, enabling the assembly among different modalities at different levels of detail. Finally, it provides targeted modeling strategies for architects, depicted in one indoor and one outdoor demonstration for auditory-visual research.
Introduction
The practice of 3D modeling for research purposes in the field of virtual acoustics presents a typical dilemma as the tasks demand certain abilities from varied artistic fields (Calderon et al., 2006; Boeykens and Liège, 2011) and also require knowledge on the scientific field under research. In other words, it is common to find researchers conducting tests in the field of virtual acoustics who do not have skills in 3D modeling research scenarios. By contrast, there is also a large community of professional 3D drawers—including architects, graphic designers, and gaming developers—who find it difficult to deliver 3D data that fulfills the demands of researchers. This usually leads to two types of solutions: researchers forgo the possibilities of 3D modeling by constructing a simplified model, with all the time and effort constraints included; or, when they do collaborate, only 20% of researchers undertake close collaboration with 3D modeling experts to obtain the expected environment, with implications for the time and effort a project requires (Thery et al., 2019).
Virtual acoustic environments have demonstrated versatility in various research areas, as they allow easy manipulations of experimental test conditions or simulated acoustic scenes. Although the evolution of auditory and cognitive models is constantly pursued (Søndergaard and Majdak 2013; Relaño-Iborra et al., 2019), listening experiments are still considered to be the gold standard (Brinkmann et al., 2019, Pausch and Fels 2019), usually necessitating a defined 3D environment. For easy manipulation of experimental conditions, it is desirable that acoustic conditions, types, positions, and the orientations of the involved sound sources, as well as the order of examined conditions, can be changed without physical modifications of the laboratory.
In the following, the person concerned with the task is called a “modeler.” During the 3D preparation workflow of the research demands, modelers can easily lose track of what is necessary. In particular, the application of virtual acoustic environments (VAEs) with full control over virtual sound sources, playing back definable source signals, such as speech, music, technical, or synthesized signals, requires specific implementations in the 3D scenario (Vorländer 2020). The validity and reproducibility of this approach are further increased by the integration of source directivity (Monson et al., 2012; Shabtai et al., 2017), generic or individual human binaural data (Xie 2013; Thiemann and van de Par 2019), simulation of room acoustics (Vorländer 1989; Naylor 1993; Dalenbäck 1996), Doppler shifts in case of moving sources or receivers (Strauss, 1998; Wefers and Vorländer 2018), and diffraction filtering for urban environments (Svensson et al., 1999; Tsingos et al., 2001). These requirements fall within the competence of the acoustic specialist, who implements the corresponding filters on the 3D model but there are also prerequisites for the acoustic 3D model, such as the acoustic characterization of surfaces based on absorption and scattering properties (Vorländer 2020), the sizing of the objects in accordance with the target wavelengths (Pelzer and Vorländer 2010), and the extension of the numerical acoustics mesh arranged for the calculation of wave effects (Marburg 2002). Despite these are crucial decisions when modeling a scenario, not much research has yet been done on the automatic simplification of CAD models from details toward a specific acoustically relevant resolution (Vorländer 2020).
Despite the gap between what modelers know and what researchers demand, the modelers are also equipped with modeling strategies that mostly address researchers in architectural design and analysis: 3D modeling tasks are present in almost all fields of architectural practice and research. This is the reason why every architecture student, professional architect, interior designer, or building engineer can be considered as a potential “modeler.” The use of 2D and 3D computer-aided design (CAD) tools is mandatory in order to communicate among professionals, and it was progressively introduced in the architecture student’s curriculum (Clayton et al., 2002). On the research side, the simulation of different aspects of buildings is the common way to examine in detail the behavior of different architectural designs. Structural design based on a 3D wire-frame model, for example, provides optimized and fast tools for dimensioning the building structure (Hasan et al., 2019). Other fields, such as network approaches, use architectural simulation at the city scale in correlation with social events, such as busking (Clua et al., 2020). In the small and building scale, some finite element methods allow the calculation of a building structure, considering the interaction of the different parts as a unique mesh (Roca et al., 2010; Castellazzi et al., 2017). Modeling tasks are also useful in the simulation of hygrothermal interactions with the building envelope (Künzel et al., 2005) or in the generation of solar envelopes to improve the building comfort (de Luca et al., 2021), as well as in other diverse fields of building research. Additionally, the modeling software normally used by “modelers” is coveted for simulation demands. As examples, they are usually trained to define 3D geometries in software like AutoCAD1, Rhinoceros3D,2 Blender,3 3ds Max,4 Maya,5 or SketchUp6. Other software like Unity7 and UnrealEngine8 are also used as engines for virtual reality, offering powerful platforms for real-time architectural visualization. Last, the modeling paradigm has evolved in a way that the integration of geometrical data with additional information makes the task of the “modeler” desirable for building research. Thus, the common modeling technique that originated with CAD as a system was to automate the task of drafting 2D geometry. The emergence of 3D CAD initially focused almost entirely on creating geometry in support of visualization. More recently, object-oriented CAD systems replaced 2D symbols with building elements (objects) capable of representing the behavior of common building elements. These building elements can be displayed in multiple views, as well as having nongraphic attributes assigned to them, such as acoustic material properties, structural properties, assigned assembly rules, or parametric dimensions. Capturing these relationships and behaviors is just not possible in the previous CAD paradigm. Building information modeling (BIM) provides a single logical, consistent source for all information associated with the building. The knowledge of the aforementioned modeling techniques is what makes the “modeler” a valid actor to contribute to the acoustics research workflow.
In the field of architectural acoustics, practitioners and consultants use different commercial software with 2D and 3D layouts for room acoustics simulation: CATT-Acoustic,9 Ease10, and Odeon,11 or Max12. All of these examples require a geometrical definition of the studied spaces as a list of points defining faces and faces defining volumes. The modeling strategies highly depend on each software, which needs professional expertise. Additionally, other noncommercial simulation software such as Pachyderm13 (van der Harten 2013), RAVEN,14 Razr,15 or rtSOFE,16 developed for research purposes have a specific geometric definition for rooms. This range of software possibilities, including the respective modeling strategies they require, makes the approach difficult for the “modeler” and enlarges the gap between them and the researcher, as stated before. As observed in some examples, CATT-Acoustic demands a list of points in Cartesian coordinates, which can be extracted from a DXF format or usually defined in a .txt file. On the other hand, Raven also runs as a plugin in Sketchup and Rhinoceros3D, taking the geometry from there. Finally, EASE can import model information using the AutoCAD DXF file format after simplification of complex components. The three different software tools presented three modeling procedures that have to be carefully taken into account before the simulation work is done. For this reason, there is a need to gather necessary modeling knowledge that will be useful for potential “modelers.”
As a starting point for similar future optimizations of the modeling workflows, this contribution presents a multi-detailed 3D architectural framework, divided into modules and ready to be used in virtual acoustic research applications, which include audio and/or visual modalities. It defines three levels of detail, which cover three different levels in the architectural approach: a low level of detail, as far-away scales such as urban, neighborhood, or landscape; a high level of detail, for close scales such as indoor or furniture-focused environments or; and a medium level of detail, for intermediate scales. Those three levels are defined for each of the acoustical and visual cues: geometry, materials, sources, and receivers. This framework provides the chance to combine different levels and different cues for a desired researcher-defined scenario. First, the general requirements regarding hardware and software requirements are described. Based on these requirements, design aspects and implementation the implementation of these designs are presented in detail. Finally, the article presents two demonstrations of an outdoor and an indoor environment, respectively.
Materials and Equipment
General Considerations
The sciences of architectural visual and acoustic simulation share some strategies when representing reality, but they also differ in several principles (Monedero 2015a; Monedero 2015b). The distinction emerges from the different physical behavior of light and sound phenomena and how they interact with the built environment. From the architectural point of view, it is useful to understand which are those physical phenomena in the real world and how the models simulate them. This requires a fundamental knowledge of concepts such as the generation, propagation, interaction, and perception of sound and light. After the description of those phenomena by experimental observation—what commonly generated numerical descriptions of reality over decades in research—the task of deriving analytical models might be useful for the prediction of new situations. This is where virtual reality may become a laboratory for research in architecture: by understanding the behavior of the human perception in the built environment, one can predict the perceived cues in a new architectural design before building it.
This is not always the common path for architects. Although it seems obvious that fundamental analyses of real scenarios are essential before trying to simulate them by virtual means, experience tells that this is not so. Evidence shows also that most of the 3D modelers with an architectural background, use simulation techniques before understanding their theoretical basis, relying on the techniques as feedback tools for different design options (Bouchlaghem et al., 2005; Attia et al., 2009; Thery et al., 2019). In addition, prerequisites in the fields of visual simulation are different to acoustic simulations. For this reason, the proposed framework allows for a comprehensive approach to both the visual and the acoustic models, applying the prerequisites in a language as close as possible to the architectural modeling tradition.
The prerequisites for simulated visual environments have been established in the field of computer graphics. They follow four broad subfields: geometry, or ways to represent and process surfaces; animation, ways to represent and manipulate motion; rendering, algorithms to reproduce light transport; and an imaging or processing acquisition, ways to reproduce the visual characteristics of objects (Foley et al., 1997). First, the geometry representation models imply the mathematical definition of space. This urges the modeler to define the environment objects through CAD platforms, which are commonly used by architects and modelers. Second, the animation representation methods range from camera movement until the creation of avatars. Since architecture elements are normally represented as static objects, the knowledge of camera properties and viewer movement are of the most relevance here. Where a deeper understanding is needed, it is rendering the properties of scenes. This requires the use of lighting units, lighting distribution, and types of artificial lighting characteristics, as well as a material definition of surfaces, scattering, and shading properties from the modeler side. Finally, the human interaction systems mainly cover the imaging prerequisites. They range from monitor screens; projections; 360 enveloping scenarios, such as “CAVE’s”; or head-mounted displays (such as VR headsets); and other manual controllers, such as joysticks or controllers, which need a specific hardware setup knowledge.
The prerequisites for simulated auditory environments are defined in the field of virtual acoustics and, under the term “Auralization.” They include three main components: a sound generation model, a sound transmission model, a signal processing, and sound reproduction (Vorländer 2020). The sound generation model implies the characterization of sound sources, in terms of spatial directivities and temporal domain. This urges the modeler to locate the sources in a plausible way as well as design the coherent degrees of freedom for their movements. The sound propagation model takes care of the propagation, reflection, scattering, and diffraction phenomena inside of rooms or through the environment, as well as the effects of possible structural transmission effects in building structures. This second block requires the ability to detect which are the relevant polygons that will affect those phenomena, such as large polygonal surfaces close to the listener or diffraction edges from two adjacent polygons. Finally, the audio signal processing and sound reproduction can be performed via loudspeakers or headphones with a big range of binaural techniques. This demands detailed attention in the implementation of the 3D model in the laboratory.
Up to this point, significant differences can be noted between approaches to acoustic and visual simulations. The main difference shows up when confronting four to three main prerequisites. This makes the comprehensive understanding complex. Whereas visual simulation tradition considers “geometry” and “rendering” as two separate fields for the simulation workflows, the acoustic simulation framework devotes a sole model for propagation calculation—including geometry and material definition (Schröder, 2011). Since the architectural modeling is often object based—meaning that each object is defined by a separate 3D object (e.g., a pillar is geometrically defined by a prism and materially defined by a texture)—the separation between geometry and material definitions seems more adequate for an architectural framework. This distinction is included in the present work.
For the construction of the scenarios, the software platforms are applied as follows. SketchUp17 is used for the geometrical definition of scenario in both acoustic and visual terms. SketchUp is also used for the acoustic material characterization of the scene, whereas 3D Studio Max provides a suitable environment to define the mapping for the visual material characterization. Unreal Engine 4 is used for the visual animation, rendering, and imaging processes. RAVEN, working as a plugin with SketchUp or Matlab,18 is used for the definition of sound sources and sound receivers as well as for performing the sound propagation simulation. The complete setup can be designed to run in Windows with Unreal Engine 4 or higher, SketchUp, and Matlab installed. The system requirements depend on each software. Having set these components, the proposed framework is ready to be defined.
Design Preparation and Guidelines
The use of the framework for upcoming 3D models requires some design preparations. The distinction between the visual model and the acoustical model starts already in the preparatory considerations.
Regarding the visual model, at least the following requirements must be addressed:
• Extension of the model, in accordance with the test necessities.
• Extension of the test area for subjects, which determines the modeling extension of the visual model and whether far objects need to be modeled or just included in a spherical image around the viewer.
• Level of detail from the near objects until the distant ones, which determines the modeling load and strategy.
• Modeling technique, derived from the previous points, such as object-based or using photogrammetric techniques.
• Quality of photographic data, especially for texture and material definitions.
• Visual rendering strategies and craftsmanship, which can be learned and gained after experience.
Regarding the acoustic model, at least the following aspects must be covered:
• Extension of the model, considering the simulation of free-field sound propagation as well as reflection, scattering, and diffraction.
• Extension of the test, paying special attention to the subjects’ closest area, where the finer definition of the acoustic meshes (polygons) will play an important role.
• Face (polygon) count control, assuring an efficient calculation.
• Level of detail of the meshes, balancing plausibility and computing effort.
• Quality of anechoic data.
• Quality of directivity properties of sound sources and receivers.
• Acoustic rendering strategies and craftsmanship, which can be achieved after having gained experience.
Finally, the coincidence check between both models must be assured.
The Framework
The framework is presented as a double-entry table. On the vertical axis, the types of cues are divided into two main groups: “visual” and “acoustic.” Those are also divided into “geometry,” “materials,” “sources,” and “receivers.” On the horizontal axis, the cues are divided into three levels of detail: “low,” “medium,” and “high.” Table 1 shows an overview of the framework. In the following, every module is explained.
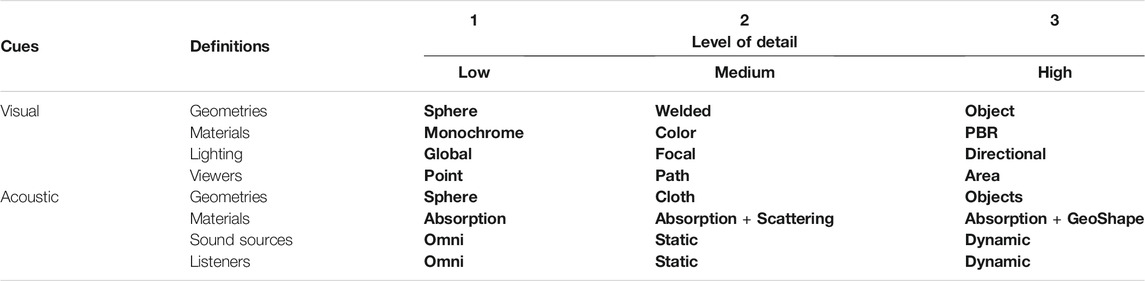
TABLE 1. Multi-detailed 3D architectural framework.
Visual Definitions
Geometries
The simplest geometric definition of the visual environment is a Sphere mesh. Spheres are centered at a fixed position which coincides with fixed viewer and listener positions. The sphere can be defined in CAD software as a polygonal mesh, with normals facing the center of the sphere. Spheres are mapped with a spherical wrap. The mapping of the sphere can be matched with a 360° texture or an HDRI sky.
The medium definition is a Welded mesh. Those are complex meshes, which can be defined as simplicial complexes that might be produced via 3D photogrammetric techniques or with laser scan (Remondino 2011; Douglass et al., 2015). The mapping of such meshes follows the true orthophoto method (DTM or DSM), which is usually included at the end of the modeling chain in common software like Photoscan.
The highest level of detail is defined by Object meshes. They define individual spatial objects (such as doors, floors, walls, etc.) as individual 3D objects, mainly defined by elementary polyhedron such as cubes, prisms, cylinders, or pyramids (Arens et al., 2005). They are generally mapped with a cubic mapping, with dimensions of 2m × 2m × 2m, centered on the origin. If any of those meshes require specific mapping, the corresponding mapping is included.
Materials
The lowest material definitions of the visual environment are Monochrome materials. These provide a homogenous rendering output. These materials are instances of a single color material. All possible complex material definitions are substituted by this material. The base color is predefined as white (RGB: 255,255,255).
The medium definitions are Color materials. These provide an abstract rendering output. They define every material by a different color via a “base color” map definition. The base color is predefined, but it can be redefined by the user in the Material Editor.
The highest definitions are PBR materials. These provide a realistic rendering output. They are defined by several parameters used by the physically based rendering (PBR) techniques, including “Base color,” “Metallicity,” “Reflection,” “Roughness,” and “Normal” (Greenberg 1999). Those parameters are defined whether by constant values or by maps. The maps are predefined, but they can be redefined by the user in the Material Editor. The orientation and size of the texture are defined by the cubic mapping of the meshes. The quality of the graphical data is crucial for the final visual output. Important texture requisites are seamless textures, color-balanced, and high-resolution photographs. The material definitions are rendered in Figure 1.
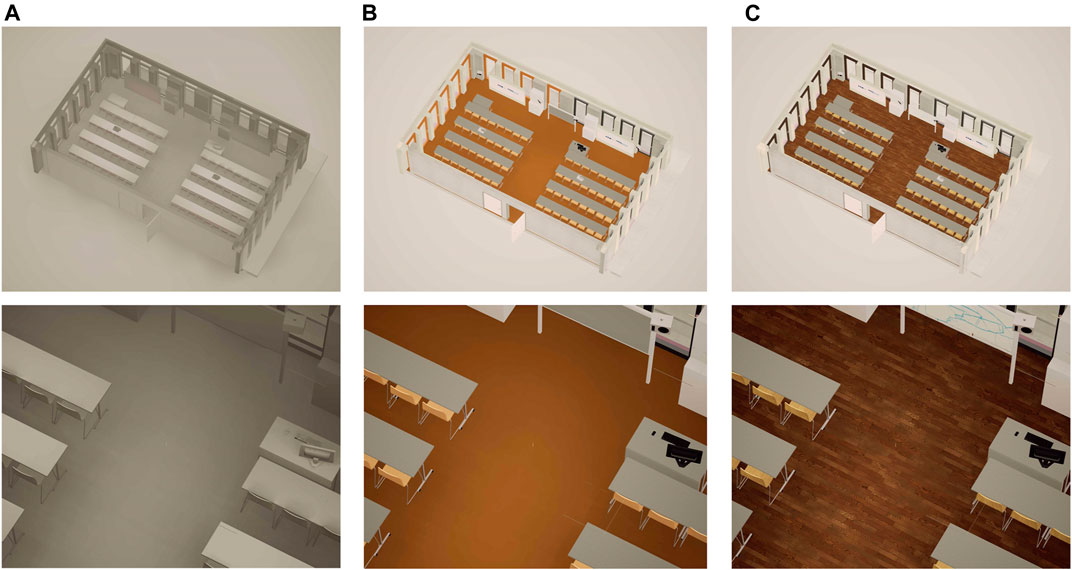
FIGURE 1. Levels of detail for the material definitions of the visual cues: (A) monochrome materials, white; (B) color materials; (C) pbr materials.
Lighting
The lowest light source level of detail in the visual environment is defined by Global lights. This renders a diffuse global illumination triggered in all directions by a white environment casting shadows on all the objects.
The medium level is defined by Focal lights. They render artificial illumination defining the source in one point (or collection of points), with a specific directivity in the 3D environment. They do not illuminate the whole scenario but by optimizing the illumination on several areas and saving lighting resources. Those lights are composed of point lights, spot lights, or rectangular lights, with defined values such as intensity, attenuation radius, or light color.
The highest level is defined by Directional lights. They render illumination defining the source in one direction. All the lighting rays are parallel to that direction. The most used application of those lights is the “sun light.” Attached to the sun, there might be a “sky light,” rendering diffuse light, colored after the sun’s position, a “sky sphere” displaying a sky representation that includes sky color and clouds, and an “atmospheric fog rendering” adding humidity effects. The ligthing definitions are rendered in Figure 2.
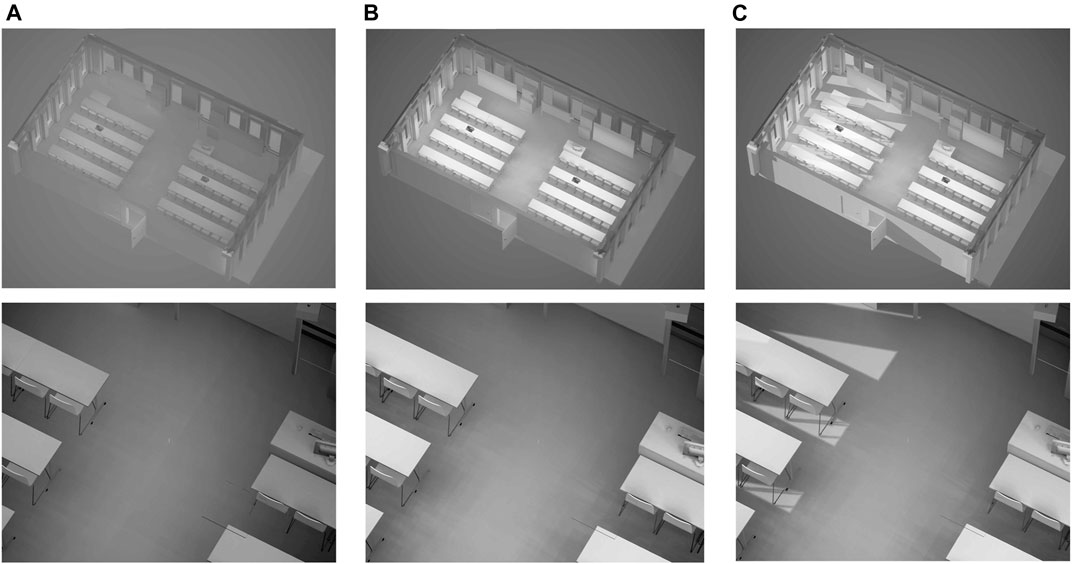
FIGURE 2. Levels of detail for the lighting definitions of the visual cues: (A) global lighting; (B) focal lighting, as two rectangular lights on the table regions, together with global lighting; (C) directional lighting as sunlight, together with focal and global lighting.
Viewers
The lowest viewer level of detail in the visual environment is defined by Point positions. They locate the viewer in a fixed position where rotation of the head is allowed.
The medium level is defined by a Path. The viewer is allowed to walk through a specified line, including head rotation.
The highest level is defined by an Area. The viewer is allowed to walk freely inside a specified area, including head rotation.
Acoustic Definitions
Geometries
The lowest geometric level of detail of the acoustic cues is defined by Effects. They perform artificial reverberation effects for defined volumes in the model. They cannot even be considered as geometric definitions, since those effects rely on synthetic reverberation tails, calculated after several parameters such as “absorption” or “size of room.” Advanced methods such as RAZR also include other perceptual features such as clarity and localization and adapt the characteristics of an equivalent rectangular space to achieve the intended perceptual result.
The medium level is defined by Cloth meshes. Those meshes are triangulated networks made of vertices and edges. The mesh is a continuous object, presenting no empty triangles, with a maximum of 400 triangles, fixed for computation fluency. For specific testing regions, specific welded meshes are optimized. The optimized meshes contain finer resolution areas (close to the testing areas) and coarser definition of the net for the rest of the model. The edges disposition responds to the diffraction effects, whereas the triangle disposition supports the reflection effects. This geometric definition is especially effective for outdoor scenarios since the combination of diffraction and reflection of sound is required. Noise mapping for environmental simulation and prediction in cities, dwelling, or rural areas normally requires this kind of input meshes. Examples of commercial software in this field are Soundplan,19 CadnaA,20, and Mithra21. In the abovementioned software, topography can be easily defined by importing CAD or GIS (Geographical Information System) formats. Other open-source tools for real-time outdoor sound simulation, such as virtual acoustics (VA),22 the same input information was used.
The highest level is defined by Object meshes. Those objects are independent geometries characterized by acoustic material properties. The sizing of the objects corresponds with the target wavelengths. The extension of the scenario is arranged for reflection, scattering, and diffraction calculations. There is a material assignment for each object. This geometric definition is especially effective for indoor scenarios. This type of geometric definition is normally used in software such as RAVEN, ODEON, EASE, or CATT-Acoustic. The geometric definitions are rendered in Figure 3.
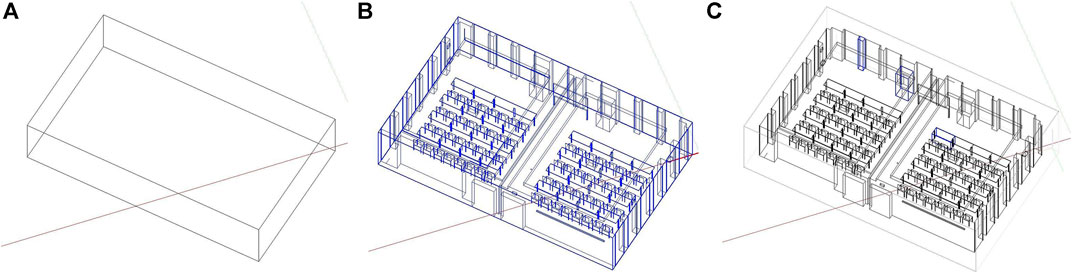
FIGURE 3. Levels of detail for the geometric definitions of the acoustic cues: (A) effects, from a given volume; (B) cloth mesh as one single net; (C) object meshes, as independent geometries.
Materials
The lowest material level of detail of the acoustic cues is defined by Absorption properties. They contain only absorption coefficients but not scattering information of the materials.
The medium level is defined by Absorption + Scattering materials. They contain absorption and scattering coefficients in different frequency bands.
The highest level is defined by Absorption + GeometricShape. This material definition is only used for numerical model calculation. No simulation with geometrical acoustics is possible with this definition as it would violate the condition of short wavelengths compared with geometric details.
Sources
The lowest level of detail for the sources in the acoustic scenario is defined by Omni sound sources. They are defined as points in the three-dimensional space. The sources are characterized as omnidirectional sources with a uniform spatial radiation pattern, meaning that they radiate the sound in constant intensity toward all spatial directions.
The medium level is defined by Static sound sources. They are defined as fixed points in the three-dimensional space. To simulate the spatial properties of the source signals, the directivity of the source must be known. The directivity function reveals the frequency-dependent amplitude for every spatial direction.
The highest level is defined by Dynamic sound sources. They are defined as points in the three-dimensional space, receiving certain degrees of freedom such as moving along a path or free movement. Those sound sources are also provided with directivity functions, in the most complex case, also including signal-dependent directivities.
Listeners
The lowest level of detail for the listeners in the acoustic scenario is defined by Omni receivers. They are defined as points in the three-dimensional space. The receivers are characterized as omnidirectional receivers, with a constant frequency response for all directions of the space. These receiver points may be used as measurement locations in the room, for further comparison of room acoustic parameters.
The medium level is defined by Static receivers. They are defined as points in three-dimensional space. To simulate binaural responses, human listeners are characterized by a frontal direction with a general or individual head-related transfer function (HRTF). This function characterizes how an ear receives a sound from a point in space, affected by the size and shape of the head, ears, ear canal, and other aspects (Blauert 1997).
The highest level is defined by Dynamic receivers. They are defined as a point in the three-dimensional space able to move within a specified trajectory, or within a restricted area. Those receivers are also characterized by a frontal direction connected to an individual or standardized head-related transfer function on each point of the trajectory.
Anticipated Results and Applications
The main goal of the presented framework is to provide modules to be combined in a final 3D scenario. Since the final scenario is intended to be used in perception research in the form of audio–visual tests, two extreme applications are explained here. However, the combinations between the modules can provide suitable scenarios for other cases. The three study cases are just examples and not definitive final setups. Table 2 depicts the applications presented and their module combinations.
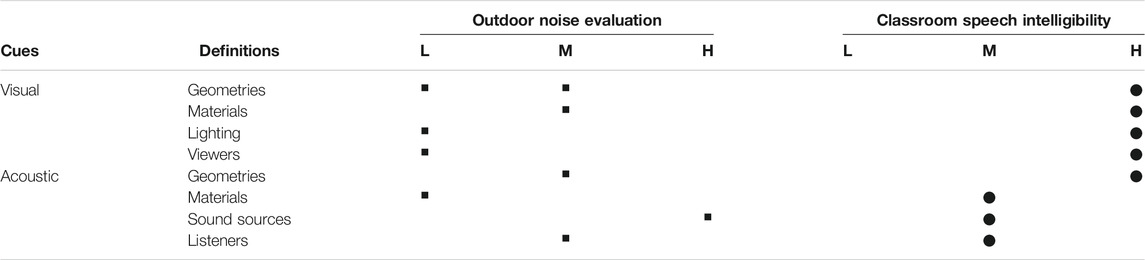
TABLE 2. Suggested module combinations for demonstrators (A) outdoor noise evaluation and (B) classroom speech intelligibility.
Demonstrator A: Outdoor Noise Evaluation
Tests done in the area of psychoacoustics in noise evaluation are relevant for noise impact in residential or educational areas (Janssens et al., 2008; Soeta and Kagawa 2020). As a prerequisite, the test designer will decide which are the visible and audible areas in the test in order to define the extension of the visual and acoustic models. Since the evaluation of the noise is done in this case after the study of several cognitive or emotional aspects, such as preference, attention to response, or digit span tests (Keller and Sekuler 2015; Shu and Ma 2019) the listener-viewer will be seated in a fixed position, with the rotation and slight head movement as the only degrees of freedom. The 3D data is availabe at the open access database (IHTApark, 2021). The suggested module combination is as follows:
• Visual geometry definition: a welded mesh for the close field and a sphere mesh for the far field (fig X). The welded mesh is generated by photogrammetry, after 462 photographs on site, after mesh generation by triangulation. The photogrammetric generation has been conducted with the educational version of the software Photoscan.23 The sphere covering the far field is centered on the receiver position with a radius of 2,000 m. The visual definitions are rendered in Figure 4.
• Visual material definition: the welded mesh is mapped with the graphical information of the photographs. The process is generated also with Photoscan, following the true orthophoto algorithms (Remondino 2011). The Sphere is mapped with an HDRI sky using the cubemap texture from the same photographs set.
• Visual lighting definition: global lighting from the material definition.
• Visual viewers definition: dynamic viewers within a 2 m × 2 m area, with head movement allowed.
• Acoustic geometry definition: a cloth mesh made of 493 triangles (See Figure 5). The sizing of the triangles grows according to the distance to the receiver, which is located at the center of the mesh. The smallest triangle, which is close to the receiver presents an area of 10.5 m2 and contains a circle of 3.3 m diameter. Therefore, this triangle acts as a rigid wall for frequencies around 100 Hz. This is the lower frequency limit of the model, which is valid for perceptual applications, regarding the human auditory range. Every half-edge of the mesh is connected with his opposite half-edge, assuring that the mesh contains no wholes. The mesh extension responds to three criteria (See Figure 6):
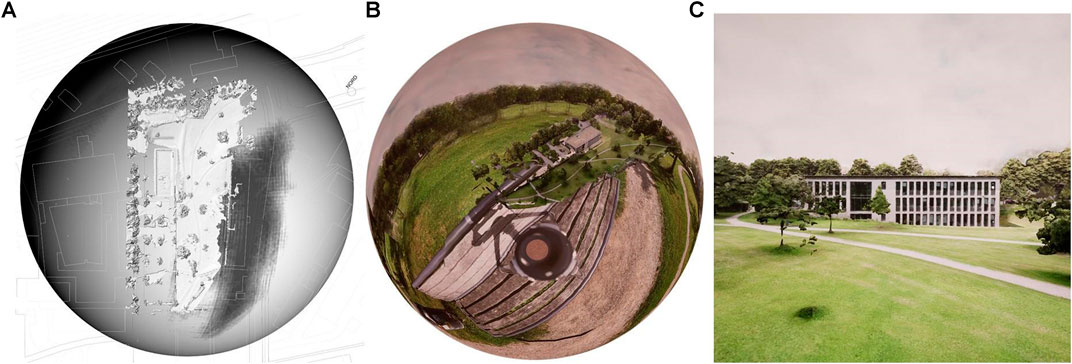
FIGURE 4. Visual definitions for (A) geometry, (B) materials, and (C) final view from the receiver position of Demonstrator A.
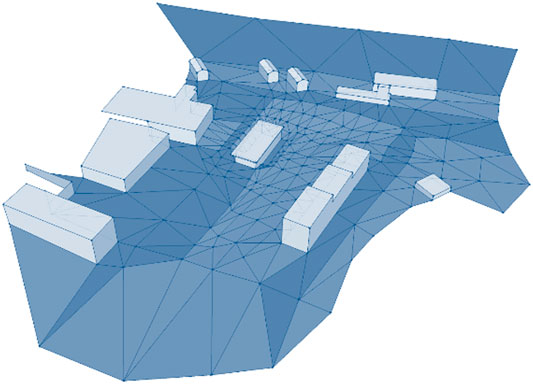
FIGURE 5. Model for the acoustic definitions. The three blue tonalities refer to the acoustic materials assigned to the mesh: (A) hard-buildings, reflective, and diffuse; (B) soft-grass and moderately absorptive; (C) hard-asphalt and reflective.
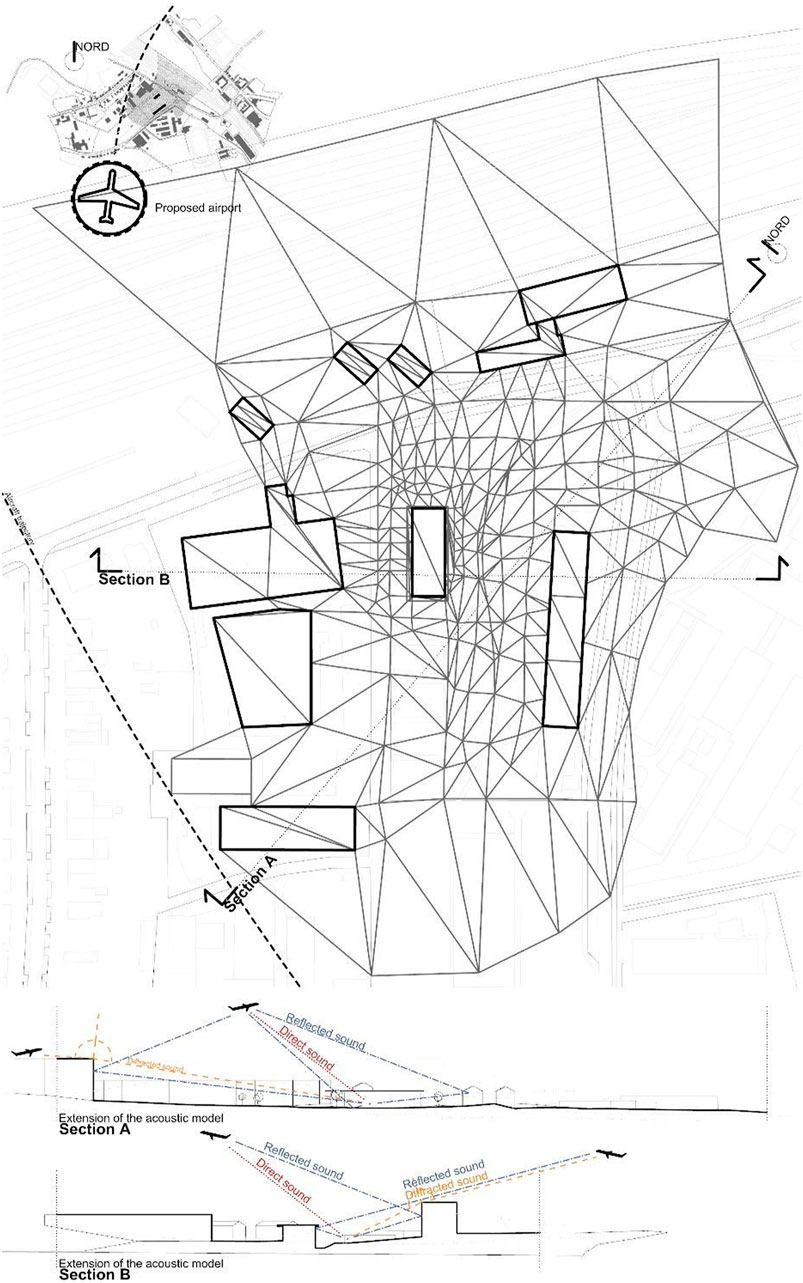
FIGURE 6. Geometric definition for the acoustic model of Demonstrator A: (A) a local view with an aircraft noise source starting from a suggested airport location; (B) mesh definition; (C) two sections of the mesh with modeling criterion based on sound propagation paths.
○ Direct sound: the model extension covers the “visible” sound source positions (in red), like cars on the “visible” roads. The “nonvisible“ roads are neglected.
○ Reflected sound: the model contains the geometry in charge of sound bouncing from the floor, neighbor façades, and ceilings (in blue). Every reflection will almost duplicate the received energy, particularly reflected sound from hard surfaces like façades.
○ Diffracted sound: the model contains the edges that enable calculation of the diffracted sound paths (in orange), coming from “nonvisible” sound sources. Those edges are considered both on building corners or terrains.
• Acoustic material definition: consisting of absorption coefficients is included. Three different acoustic materials are defined, corresponding to hard-buildings, hard-floor, and soft-floor (see Figure 4.1).
• Sound source definitions: as dynamic—aircraft and cars.
• Listener definitions: as static position from which the listener evaluates the scene. That position allows free head rotation.
An example for auralization in an application of soundscape research (ISO 12913) is given by the Institute for Hearing Technology and Acoustics (IHTA-Institute for Hearing Technology and Acoustics, RWTH Aachen University, 2021). Here, the reference scene is captured with photogrammetry technique, as a baseline for the visual rendering. The auditory reference event is recorded with an Ambisonics microphone. In postprocessing, additional sound sources and additional buildings such as dwellings or detached houses can be added to the virtual scene. One application can be found in the work by Lihoreau and colleagues (Lihoreau et al., 2006) which is focused on outdoor sound propagation modeling models under different atmospheric conditions; or (Dreier and Voränder, 2021), on aircraft noise application of simulations.
Demonstrator B: Indoor Classroom Speech Intelligibility
In this type of environment, the close environment and the details around the listener and viewer play an important role. Due to the high level of detail demanded in the visual cues, all definitions are set to the highest requirements. Typical perception experiments include cognitive tests of work, learning performance, or selective attention (Reynolds, 1992). This unique setup requires powerful hardware. Whereas in the previous application, not many GPU and CPU resources were demanded for the visual model, in this one, the smooth performance of the scenario will require a well-equipped machine. As a rule of thumb, experience shows that current gaming PCs are well equipped for such tasks. Regarding the acoustic cues, moving properties of the subject may be restricted to an area and sound sources may be fixed in position too. The suggested module combination is as follows:
• Visual material definition: PBR materials, including
○ Albedo, defined by an orthophotography of a real-world material,
○ Metallicity, defined as an integer between 1 and 0, meaning 1 as metal and 0 as nonmetal,
○ Roughness, defined by gray-scale photography or as an integer between 1 and 0, meaning 1 as a diffuse and 0 as a specular surface;
○ ambient occlusion, defined with Normal maps,
○ All textures are freely available at https://www.textures.com/. The mapping UVs of the geometry is generally set as a prismatic projection for all objects. Special objects, such as the chairs, the computer screen, and the keyboard are custom mapped with the “UV unwrapping” technique, in 3Ds Max software, educational version.
• Visual lighting definition: focal, directional, and global lighting are included. Two rectangular lights (4m × 4m each) are located at each side of the classroom. A directional light in the direction of the Sun generates natural light and direct rays coming from the left windows of the room. A sky light generates diffuse illumination for the whole scene. The sky light takes the light colors according to the day time.
• Viewers definition: dynamic, they can freely move around the model. No collision is included at the moment. The camera contains postprocessing filtering of Image Tint, Vignetting, and Exposure control set to constant.
• Acoustic geometry definition: independent modeled objects. Those are prisms and rectangles. The smallest polygon area is 1 m2, corresponding to the chairs sit (See Figure 7).
• Acoustic material definition: both absorption and scattering definitions are included. There are four materials defined: floor-wood, windows-glass, wall-concrete, and ceiling-concrete.
• Sound sources definition: set to static. Sound sources are 4 loudspeakers and a talker at the frontal desk.
• Listeners definition: set to dynamic. The listener can freely move around the classroom and sit down on a chair.
• Visual geometry definition: independent modeled objects. Those are prisms, rectangles, and special geometries for specific objects, such as the chairs. Objects are differentiated among them in the modeling hierarchy. The criterion of differentiation is the material definition, meaning that one object corresponds to one material.
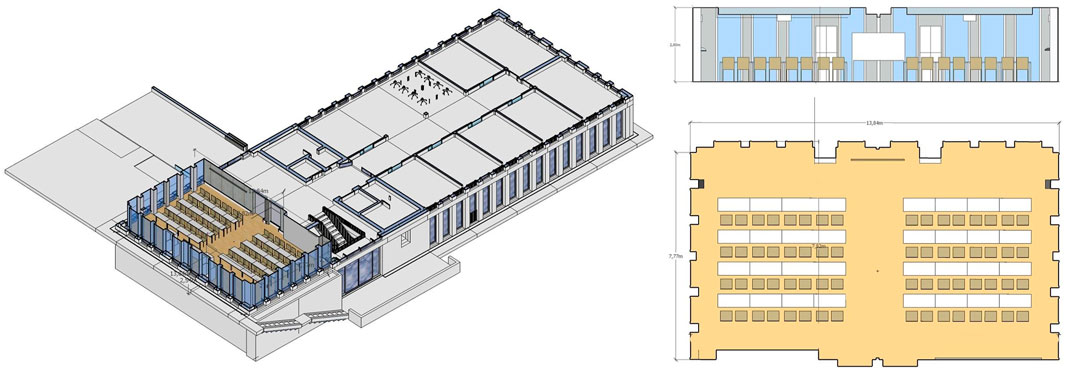
FIGURE 7. Different views of the acoustic model of the classroom for Demonstrator B. The classroom belongs to a bigger building, which is not taken into account for this study.
A complete view of the framework is presented in Figure 8. The 3D data is availabe at the open access database (IHTAclassroom, 2021).
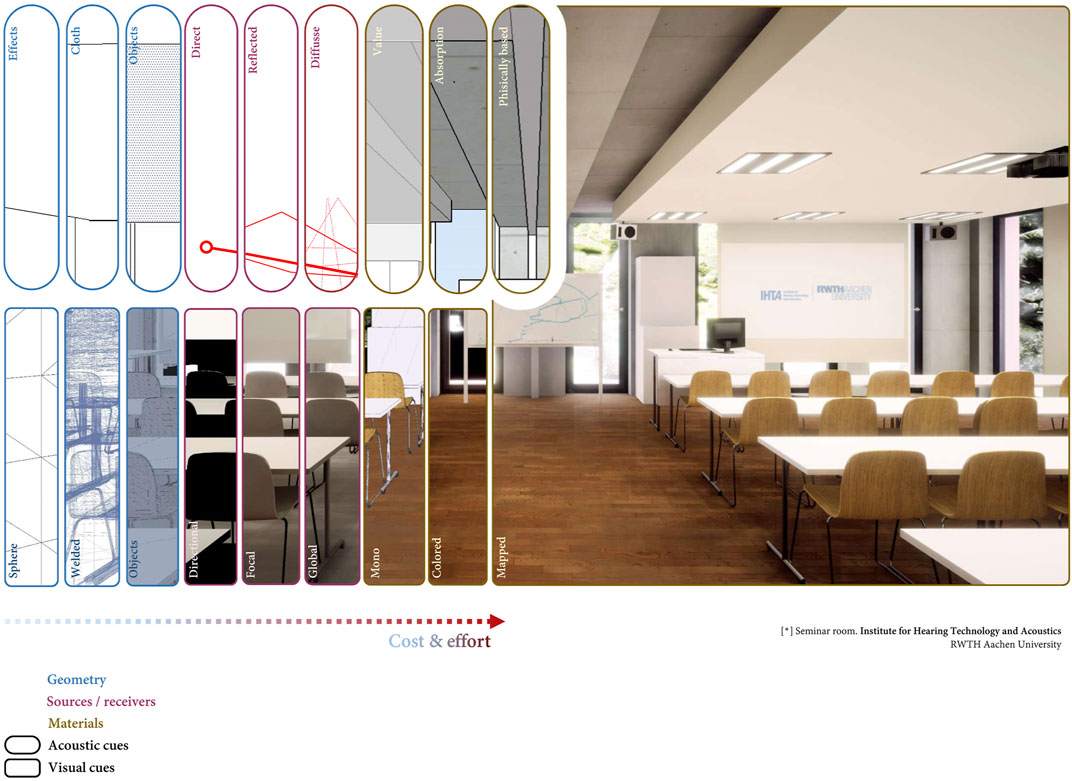
FIGURE 8. The complete framework modules displayed for the demonstrator “indoor classroom speech intelligibility” as used in a usual modeling workflow. Geometry, sources, and receivers, and material definitions are represented for each acoustic and visual cue. The order of them follows the common modeling and simulation workflow: geometry, basic lighting, material definitions, and final rendering, as well the cost and effort implied in the process. The same logic applies for outdoor scenarios.
Discussion
The elaboration of audio-visual 3D models for sound perception research requires manual work. The wide range of modeling techniques, modalities, and software revisited here demonstrate this fact. However, a methodical way of connecting them is possible. The presented framework divides the environment chunks according to what has been done in previous research and provides a way to combine them. Despite this, the definition of the modules seems evident after all, and the combination among them is a useful help to the potential “modelers.”
It is noteworthy that there is modeling freedom in each module. This enables the model to be personalized, within certain restrictions. In other words, this gives the assurance that no matter the fine details, the module is kept assembled with the rest of the framework. Therefore, the replicability of this method is assured in the assembly and module definitions, rather than the finer details, according to the purpose of the present work.
An unexpected consideration emerged related to the match between acoustic and visual simulations. It appeared when analyzing the postprocessing techniques normally used in the photography and the film industry, as part of which the treatment of light through cameras is filtered with numerous methods (like lens correction, tinting, or spectral correction of color). These processes can be compared to the techniques used by an audio engineer at the mixing console. The final decision is not to include them in the framework since they fall within the artistic work with multiple variations escaping from the controlled values for laboratory conditions.
When it comes to the result of the auditory-visual representation, one might ask whether or not this representation is correct in the sense of ecological validity. If the scenario exists already, a reference measurement or recording can be done for comparison. This was studied in a comprehensive manner by Brinkmann and colleagues (Brinkmann 2017; Brinkmann et al., 2019). The results point out that the representation is almost authentic with best-matched input data, in terms of a nondistinguishable auditory perception of realism. The auditory impressions in comparison of real and virtual spaces are, hence, similar and characteristic for the spaces, although not identical in an A-B comparison. Nobody, however, could identify which one was the auralization and which one the recording.
In the case of pure prediction, this picture changes. Blind input data quality and modeling quality determine the uncertainties of the auditory impression at the end. It was shown by Vorländer (2013) that research efforts must be intensified in the field of robust characterization of acoustic material properties.
The software tools used in this work are examples without any restriction to be replaced by other tools. Nevertheless, all typical steps and important considerations in the workflow were explained by this set of typical software tools. The main conclusion of this work is that modeling techniques in the visual representation of architecture and acoustics follow different approaches and different strategies when implementing models in various levels of detail. Their comprehensive and combined development in creative processes is not harmonized yet. The categorization schemes as listed in Table 2 may achieve transparency in terms of the definitions and interpretations of both visual and auditory aspects, and possibly in the future, the development of a cross-modality approaches to modeling in architectural acoustics.
Data Availability Statement
The datasets generated for this study can be found in the Open Science repository ZENODO under the following permanent links: Demonstrator A database. IHTApark: https://zenodo.org/record/4629760. Auralization of demonstrator A: ‘Auralization of virtual aircrafts in real scenes’ https://www.akustik.rwth-aachen.de/go/id/dzhe/lidx/1. Demonstrator B database. IHTAclassroom: https://zenodo.org/record/4629716. Auralization of demonstrator B: https://www.youtube.com/watch?v=I-pYDMtxFtM.
Author Contributions
Both authors contributed to the conception of the manuscript. The first author wrote the manuscript and generated the study cases. The second author edited the text. Both authors contributed to the article and approved the submitted version.
Funding
The first author is grateful for the financial support of the PAAD project (https://www.akustik.rwth-aachen.de/cms/Technische-Akustik/Forschung/∼kbfdp/Research-in-architectural-design/lidx/1/) under a Junior Principal Investigator Fellowship at RWTH Aachen University.
Conflict of Interest
The authors declare that the research was conducted in the absence of any commercial or financial relationships that could be construed as a potential conflict of interest.
Acknowledgments
The authors thank Lukas Aspöck for modeling the information of Demonstrator B.
Footnotes
1https://www.autodesk.com/products/autocad/overview
4https://www.autodesk.es/products/3ds-max/overview
5https://www.autodesk.com/products/maya/overview
8https://www.unrealengine.com/
13https://www.food4rhino.com/app/pachyderm-acoustical-simulation
14https://www.akustik.rwth-aachen.de/
15http://medi.uni-oldenburg.de/razr/
16https://www.ei.tum.de/aip/startseite/
18https://de.mathworks.com/products/matlab.html
19https://www.soundplan.eu/de/
20https://www.datakustik.com/products/cadnaa/cadnaa/
21https://www.geomod.fr/fr/geomatique-modelisation-3d/mithrasound/
22http://www.virtualacoustics.org/
References
Arens, C., Stoter, J., and van Oosterom, P. (2005). Modelling 3D Spatial Objects in a Geo-DBMS Using a 3D Primitive. Comput. Geosciences 31 (2), 165–177. doi:10.1016/j.cageo.2004.05.013
Attia, S., Beltrán, L., De Herde, A., and Hensen, J. (2009). Architect Friendly: a Comparison of Ten Different Building Performance Simulation Tools. Proceedings of the 11th International Builidng Performance Simulation Association Conference and Exhibition. 204-211. URL: http://hdl.handle.net/2268/167578.
Blauert, J. (1997). The Psychophysics of Human Sound Localization. Harvard MA: The MIT Press.Spatial Hearing.
Boeykens, S., and Liège, France. (2011). Using 3D Design Software, BIM and Game Engines for Architectural Historical Reconstruction. Proceedings of the 14th international conference on Computer Aided Architectural Design Futures, 493-509. Liège: Les Éditions de l’Université de Liège. ISBN: 978-2-8745-6142-9.
Bouchlaghem, D., Shang, H., Whyte, J., and Ganah, A. (2005). Visualisation in Architecture, Engineering and Construction (AEC). Automation in Construction 14 (3), 287–295. doi:10.1016/j.autcon.2004.08.012
Brinkmann, F., Aspöck, L., Ackermann, D., Lepa, S., Vorländer, M., and Weinzierl, S. (2019). A Round Robin on Room Acoustical Simulation and Auralization. The J. Acoust. Soc. America 145, 2746–2760. doi:10.1121/1.5096178
Brinkmann, F. (2017). Binaural Processing for the Evaluation of Acoustical Environments. Berlin, Germany: Technische Universität Berlin. [PhD thesis] Available at: https://depositonce.tu-berlin.de/handle/11303/9454.
Calderon, C., Nyman, K., and Worley, N. (2006). The Architectural Cinematographer: Creating Architectural Experiences in 3D Real-Time Environments. Int. J. Architectural Comput. 4 (4), 71–90. doi:10.1260/147807706779398953
Castellazzi, G., D’Altri, A. M., de Miranda, S., and Ubertini, F. (2017). An Innovative Numerical Modeling Strategy for the Structural Analysis of Historical Monumental Buildings. Eng. Structures 132 (1), 229–248. doi:10.1016/j.engstruct.2016.11.032
Clayton, M. J., Warden, R. B., and Parker, T. W. (2002). Virtual Construction of Architecture Using 3D CAD and Simulation. Automation in Construction 11 (2), 227–235. doi:10.1016/S0926-5805(00)00100-X
Clua, Á., Llorca-Bofí, J., and Psarra, S. (2020). Urban Opportunities and Conflicts Around Street Musicians: the Relationship between the Configuration of Public Space and Outdoor Acoustics in Ciutat Vella, Barcelona. J. Urban Des. 25 (5), 561–589. doi:10.1080/13574809.2019.1699398
Dalenbäck, B. I. L. (1996). Room Acoustic Prediction Based on a Unified Treatment of Diffuse and Specular Reflection. J. Acoust. Soc. America 100, 899–909. doi:10.1121/1.416249
de Luca, F., Dogan, T., and Sepúlveda, A. (2021). Reverse Solar Envelope Method. A New Building Form-Finding Method that Can Take Regulatory Frameworks into Account. Automation in Construction 123, 103518. doi:10.1016/j.autcon.2020.103518
Douglass, M., Lin, S., and Chodoronek, M. (2015). The Application of 3D Photogrammetry for In-Field Documentation of Archaeological Features. Adv. Archaeol. Pract. 3 (2), 136–152. doi:10.7183/2326-3768.3.2.136
Dreier, C., and Vorländer, M. (2021). Aircraft noise - Auralization-based assessment of weather dependent effects on loudness and sharpness. J. Acoustic. Soc. Am. (in press).
Foley, J. D., van Dam, A., Feiner, S. K., and Hughes, J. K. (1997). Computer Graphics: Principles and Practice. Boston: Addison-Wesley.
Greenberg, D. P. (1999). A Framework for Realistic Image Synthesis. Commun. ACM 42 (8), 44–53. doi:10.1145/2F310930.31097010.1145/310930.310970
Hasan, A. M. M., Torky, A. A., and Rashed, Y. F. (2019). Geometrically Accurate Structural Analysis Models in BIM-Centered Software. Automation in Construction 104, 299–321. doi:10.1016/j.autcon.2019.04.022
IHTA-Institute for Hearing Technology and Acoustics, RWTH Aachen University (2021). Auralization of Virtual Aircrafts in Virtual Scenes. Available at: https://www.akustik.rwth-aachen.de/go/id/dzhe/lidx/1 (Accessed April 22, 2021).
IHTAclassroom (2021). Multi-detailed 3D Architectural Model for Sound Perception Research in Virtual Reality. Available at: https://zenodo.org/record/4629716 (Accessed April 22, 2021).
IHTApark (2021). Multi-detailed 3D Architectural Model for Sound Perception Research in Virtual Reality. Available at: https://zenodo.org/record/4629760 (Accessed April 22, 2021).
Janssens, K., Vecchio, A., and Van der Auweraer, H. (2008). Synthesis and Sound Quality Evaluation of Exterior and interior Aircraft Noise. Aerospace Sci. Technol. 12 (1), 114–124. doi:10.1016/j.ast.2007.10.002
Keller, S., and Sekuler, R. (2015). Memory and Learning with Rapid Audiovisual Sequences. J. Vis. 15, 15. doi:10.1167/2F15.15.710.1167/15.15.7
Künzel, H. M., Holm, A., Zirkelbach, D., and Karagiozis, A. N. (2005). Simulation of Indoor Temperature and Humidity Conditions Including Hygrothermal Interactions with the Building Envelope. Solar Energy 78 (4), 554–561. doi:10.1016/j.solener.2004.03.002
Lihoreau, B., Gauvreau, B., and Bérengier, M. (2006). Outdoor sounds propagation modeling in realistic environments: application of coupled parabolic and atmospheric models. J. Acoustic. Soc. Am. 120, 110. doi:10.1121/1.2204455
Marburg, S. (2002). Six Boundary Elements Per Wavelength: Is that Enough? J. Comp. Acous. 10, 25–51. doi:10.1142/S0218396X02001401
Monedero, J. (2015a). Simulación visual de la iluminación: teoría, técnicas, análisis de casos. Barcelona: Iniciativa Digital PolitècnicaURL: http://hdl.handle.net/2117/80463.
Monedero, J. (2015b). Simulación visual de materiales: teoría, técnicas, análisis de casos. Barcelona: Iniciativa Digital PolitècnicaURL: http://hdl.handle.net/2117/82368.
Monson, B. B., Hunter, E. J., and Story, B. H. (2012). Horizontal Directivity of Low- and High-Frequency Energy in Speech and Singing. J. Acoust. Soc. America 132, 433–441. doi:10.1121/1.4725963
Naylor, G. M. (1993). ODEON-another Hybrid Room Acoustical Model. Appl. Acoust. 38, 131–143. doi:10.1016/0003-682X(93)90047-A
Pelzer, S., and Vorländer, M. (2010). Frequency- and Time-dependent Geometry for Real-Time Auralizations. Proc. 20th International Congress on Acoustics. Sydney, Australia. Url: https://www.researchgate.net/publication/266335423_Frequency-and_Time-dependent_Geometry_for_Real-time_Auralizations.
Relaño-Iborra, H., Zaar, J., and Dau, T. (2019). A Speech-Based Computational Auditory Signal Processing and Perception Model. J. Acoust. Soc. America 146 (5), 3306–3317. doi:10.1121/1.5129114
Remondino, F. (2011). Heritage Recording and 3D Modeling with Photogrammetry and 3D Scanning. Remote Sensing 3 (6), 1104–1138. doi:10.3390/rs3061104
Reynolds, R. E. (1992). Selective Attention and Prose Learning: Theoretical and Empirical Research. Educ. Psychol. Rev. 4, 345–391. doi:10.1007/BF01332144
Roca, P., Cervera, M., Gariup, G., and Pela’, L. (2010). Structural Analysis of Masonry Historical Constructions. Classical and Advanced Approaches. Arch. Computat Methods Eng. 17, 299–325. doi:10.1007/s11831-010-9046-1
Schröder, D. (2011). Physically Based Real-Time Auralization of Interactive Virtual EnvironmentsPhD Dissertation. Germany: RWTH Aachen UniversityAvailable at: http://publications.rwth-aachen.de/record/50580/files/3875.pdf.
Shabtai, N. R., Behler, G., Vorländer, M., and Weinzierl, S. (2017). Generation and Analysis of an Acoustic Radiation Pattern Database for Forty-One Musical Instruments. J. Acoust. Soc. Am. 141, 1246–1256. doi:10.1121/1.4976071
Shu, S., and Ma, H. (2019). Restorative Effects of Classroom Soundscapes on Children's Cognitive Performance. Ijerph 16 (2), 293. doi:10.3390/2Fijerph1602029310.3390/ijerph16020293
Soeta, Y., and Kagawa, H. (2020). Three Dimensional Psychological Evaluation of Aircraft Noise and Prediction by Physical Parameters. Building Environ. 167, 106445. doi:10.1016/j.buildenv.2019.106445
Søndergaard, P., and Majdak, P. (2013). “The Auditory Modelling Toolbox,” in The Technology of Binaural Listening. Editor J. Blauert (Heidelberg: Springer Berlin), 33–56.
Strauss, H. (1998). Implementing Doppler Shifts for Virtual Auditory Environments. 104th Conv Audio Enginr Soc, Amsterdam. preprint 4687. Available at: http://www.aes.org/e-lib/browse.cfm?elib=8493.
Svensson, U. P., Fred, R. I., and Vanderkooy, J. (1999). An Analytic Secondary Source Model of Edge Diffraction Impulse Responses. J. Acoust. Soc. America 106, 2331–2344. doi:10.1121/1.428071
Thery, D., Boccara, V., and Katz, B. F. G. (2019). Auralization Uses in Acoustical Design: a Survey Study of Acoustical Consultants. J. Acoust. Soc. America 145, 3446–3456. doi:10.1121/1.5110711
Thiemann, J., and van de Par, S. (2019). A Multiple Model High-Resolution Head-Related Impulse Response Database for Aided and Unaided Ears. EURASIP J. Adv. Signal. Process. 2019. doi:10.1186/s13634-019-0604-x
Tsingos, N., Funkhouser, T., Ngan, A., and Carlbom, I. (2001). Modeling Acoustics in Virtual Environments Using the Uniform Theory of Diffraction. In: SIGGRPAH ’01: Proceedings of the 28th annual conference on Computer graphics and interactive techniques. 545–552. doi:10.1145/383259.383323
van der Harten, A. (2013). Pachyderm Acoustical Simulation: towards Open-Source Sound Analysis. Archit Des. 83, 138–139. doi:10.1002/ad.1570
Vorländer, M. (2013). Computer Simulations in Room Acoustics: Concepts and Uncertainties. J. Acoust. Soc. America 133 (3), 1203–1213. doi:10.1121/1.4788978
Vorländer, M. (1989). Simulation of the Transient and Steady‐state Sound Propagation in Rooms Using a New Combined ray‐tracing/image‐source Algorithm. J. Acoust. Soc. America 86, 172–178. doi:10.1121/1.398336
Wefers, F., and Vorländer, M. (2018). Flexible Data Structures for Dynamic Virtual Auditory Scenes. Virtual Reality 22, 281–295. doi:10.1007/s10055-018-0332-9
Keywords: virtual reality, auralization, visualization, architectural representation, soundscapes, CAD
Citation: Llorca-Bofí J and Vorländer M (2021) Multi-Detailed 3D Architectural Framework for Sound Perception Research in Virtual Reality. Front. Built Environ. 7:687237. doi: 10.3389/fbuil.2021.687237
Received: 29 March 2021; Accepted: 10 May 2021;
Published: 04 June 2021.
Edited by:
Arianna Astolfi, Politecnico di Torino, ItalyReviewed by:
Francesco Aletta, University College London, United KingdomJooyoung Hong, Chungnam National University, South Korea
Copyright © 2021 Llorca-Bofí and Vorländer. This is an open-access article distributed under the terms of the Creative Commons Attribution License (CC BY). The use, distribution or reproduction in other forums is permitted, provided the original author(s) and the copyright owner(s) are credited and that the original publication in this journal is cited, in accordance with accepted academic practice. No use, distribution or reproduction is permitted which does not comply with these terms.
*Correspondence: Josep Llorca-Bofí, josep.llorca@akustik.rwth-aachen.de