Calcium Carbonate Addition Improves L-Methionine Biosynthesis by Metabolically Engineered Escherichia coli W3110-BL
 Hai-Yan Zhou1,2,3
  Wang-Jie Wu1,2,3
  Yue-Ying Xu1,2,3
  Bin Zhou1,2,3
  Kun Niu1,2,3
  Zhi-Qiang Liu1,2,3*
  Yu-Guo Zheng1,2,3
- 1Key Laboratory of Bioorganic Synthesis of Zhejiang Province, College of Biotechnology and Bioengineering, Zhejiang University of Technology, Hangzhou, China
- 2Engineering Research Center of Bioconversion and Biopurification, Ministry of Education, Zhejiang University of Technology, Hangzhou, China
- 3The National and Local Joint Engineering Research Center for Biomanufacturing of Chiral Chemicals, Zhejiang University of Technology, Hangzhou, China
L-Methionine (L-Met) is a sulfur-containing amino acid, which is one of the eight essential amino acids to human body. In this work, the fermentative production of L-Met with genetically engineered Escherichia coli W3110-BL in a 5-L fermentor was enhanced through supplement of Ca2+ into the fermentation medium. With the addition of 30 g/L calcium carbonate (CaCO3), the titer of L-Met and yield against glucose reached 1.48 g/L and 0.09 mol/mol glucose, 57.45% higher than those of the control, respectively. The flux balance analysis (FBA) revealed that addition of CaCO3 strengthened the tricarboxylic acid cycle and increased the intracellular ATP concentration by 39.28%. The re-distribution of carbon, ATP, and cofactors flux may collaborate to improve L-Met biosynthesis with E. coli W3110-BL. The regulation of citrate synthase and oxidative phosphorylation pathway was proposed to be important for overproduction of L-Met. These foundations provide helpful reference in the following metabolic modification or fermentation control for further improvement of L-Met biosynthesis.
Introduction
Methionine (Met) is one of the eight essential amino acids of humans. It is extensively applied in the fields of pharmaceutics, food, and feed. Met can be also used as an important participant in the synthesis of S-adenosyl methionine (SAM), a common methyl-group donor involved in the biosynthesis of nucleic acids, phospholipids, proteins, epinephrine, melatonin, creatine, and other molecules. Along with L-lysine, Met is a dominant amino acid used in animal feed (Noftsger et al., 2005). In recent years, the global Met market for animal feed has been substantially increased with the rapid growing consumption of meat and milk products.
Currently, microbial fermentation with auxotrophic mutants or genetically engineered strains for production of Met has attracted more attentions than chemical synthesis, which exhibits disadvantages of environmental unfriendliness, strict reaction conditions and impure product with racemic mixtures. The pathway for L-methionine (L-Met) synthesis is well studied in many microorganisms (Krömer et al., 2006). It is a multibranched and multilevel regulated biosynthetic pathway (Huang et al., 2018). L-Met biosynthesis derived from glucose with the canonical metabolic route requires 18 mol ATP, and L-Met is thereby known as the most expensive amino acid in terms of consumed mol of ATP per molecule produced (Kaleta et al., 2013). Large amount of strategies have been developed to improve L-Met fermentative production, as for instance, traditional breeding (Kase and Nakayama, 1975; Kumar et al., 2003), genetical modification (Usuda and Kurahashi, 2005; Park et al., 2007; Huang et al., 2017, 2018), and fermentation optimization (Anakwenze et al., 2014; Zhou et al., 2019). However, the industrial preparation of L-Met by fermentation approach is till restricted since the metabolic flux is dispersed and its regulation is complicated. It is therefore of particular importance to identify the potential factors affecting the L-Met over-production.
In our previous study, based on the comprehensive analysis of feedback inhibition, synthetic bottleneck, and cell growth repression in L-Met biosynthesis, a recombinant L-Met-producing strain Escherichia coli IJAHFEBL/pA∗H (shortly named as E. coli W3110-BL) was constructed via deletion of metI for partial inactivation of the L-Met import system MetD, metJ for elimination of negative transcription regulation by L-Met, and lysA for blocking the biosynthesis of the by-product L-lysine (Huang et al., 2017); additionally, the expression of metH encoding B12-dependenthomocysteine-N5-methyltetrahydrofolate transmethylase (MetH), metF encoding 5, 10-methylenetetrahydrofolate reductase (MetF), cysE encoding serine acetyltransferase (CysE), and metBL enconding cystathionine gamma-synthase (MetB)/bifunctional aspartate kinase/homoserine dehydrogenase II (MetL) were enhanced by replacing their native promoters on the chromosome by a strong promoter trc, respectively (Huang et al., 2017, 2018). The homoserine O-succinyltransferase with reduced feedback sensitivity to SAM and L-Met, as well as the L-Met efflux transporter were overexpressed by constructing a recombinant expression plasmid pA∗H, of which the genes metAfbr and yjeH were inserted into the plasmid pTrc99A, respectively (Huang et al., 2018). As a result, the L-Met production was significantly enhanced compared with the original strain E. coli W3110.
In order to further enhance the L-Met fermentation titer of this recombinant strain, the fermentation conditions need to be additionally optimized by process engineering. As is well-known, inorganic salts (minerals) are essential elements in the nutrition and are required for almost all living things. Inorganic salts starvation or limitation in microbial cells will lead to critical stress response (Wiesenberger et al., 2007). It has been demonstrated that supplement of optimal mineral salts (for example K2HPO4, MgSO4⋅7H2O, NaCl, CaCO3, FeSO4⋅7H2O, MnCl2⋅7H2O, and ZnSO4) in the fermentation medium exhibited positive effects on various fermentation product, such as vitamins (Oraei et al., 2018), amino acids (Zhou et al., 2019), antibacterial metabolite (Jacob et al., 2017), and polypeptide or enzyme (Zhou et al., 2014; Cheng et al., 2019). The bivalent metals including Zn2+, Mg2+, and Ba2+ at trace concentration (mg/L) were reported to play an important role to stimulate L-Met production with Bacillus thuringiensis EC1. After optimization of their concentrations, an improved L-Met yield of 3.18 g/L was achieved (Anakwenze et al., 2014). The effect of another bivalent metal calcium ion (Ca2+) on cell growth, morphology, and accumulation of target metabolites has also been reported by numerous researchers (Robson et al., 1991; Pera and Callieri, 1997, 1999; Xin and Wang, 2007; Huang et al., 2011). Huang et al. (2011) studied the effect of Ca2+ on the fermentation of polyglutamic acid. Addition of calcium chloride resulted in a 15.2% increase in final yield of polyglutamic acid, while the activities of enzymes involved in the metabolism of α-ketoglutaric acid were also improved (Huang et al., 2011). Ca2+ in the fermentation broth could also serve as an essential catalytic cofactors to activate the specific enzymes involved in certain metabolic pathways, resulting in re-redirection of the intracellular carbon and energy flux (Liu et al., 2007; Egnatchik et al., 2014).
Flux balance analysis (FBA), as one of the metabolic flux analysis (MFA) approaches, is to analyze the distribution of metabolic flux based on the quantitative equilibrium model of the metabolic network (also be called stoichiometric MFA) (Varma and Palsson, 1994; Papp and Simeonidis, 2007). The input data were mainly derived from the measurement of extracellular flux. The FBA has advantages over the traditional MFA of carbon labeling experiment (CLE) using the isotope labeling such as 13C (Ando and Garcia Martin, 2018), owing to the design flexibility and easiness of operation and analysis. As a popular tool for analyzing the metabolic flux, FBA methodology has been rapidly developed and the application has risen over the past more than 30 years, particularly with the purpose of calculation of the maximum theoretical output of metabolism (Krömer et al., 2006; Klamt et al., 2018; Rawls et al., 2019), description of the metabolic flux distribution of the complete central metabolism in industrial strains Corynebacterium glutamicum (Vallino and Stephanopoulos, 1993) and E. coli (Varma and Palsson, 1994), and estimation of the effects of genetic modification or environmental alteration on intracellular material or energy flux (Li et al., 2017; Zhao et al., 2017; Armingol et al., 2018; Hon et al., 2019; Martinez-Monge et al., 2019).
In this work, calcium was found to be capable of promoting L-Met biosynthesis in the genetically engineered E. coli W3110-BL. In order to deeply understand the role of calcium in L-Met metabolic pathway, the quantitative analysis of metabolic flux in the presence of calcium was conducted using FBA. The results were of much importance in developing molecular and engineering strategies for further modifying the L-Met biosynthetic pathway.
Materials and Methods
Bacterial Strain and Plasmid
The genetically engineered E. coli W3110-BL previously constructed in our laboratory (Huang et al., 2017, 2018) was used as a L-Met producing strain in this study.
Media and Cultivation Conditions
The seed medium was Luria-Bertani (LB) medium (tryptone 10 g/L, yeast extract 5 g/L, and NaCl 10 g/L) supplemented with 100 μg/mL Amp. The fermentation medium contained 20 g/L glucose, 5 g/L (NH4)2SO4, 1.5 g/L yeast extract, 2 g/L KH2PO4, 10 g/L Na2S2O3, 1 mg/L Vb12, 1 mL/L salt solution (MgSO4⋅7H2O 0.5 g/L, MnSO4⋅8H2O 5 mg/L, FeSO4⋅7H2O 5 mg/L, ZnSO4 5 mg/L), 50 mg/L L-lysine, 100 μg/mL Amp, and 0.1 mmol/L isopropyl β-d-1-thiogalactopyranoside (IPTG). Different amounts of calcium carbonate (CaCO3) were supplemented when required.
In batch cultivation for L-Met production, 150 mL of the seed broth after cultivation in LB medium containing 100 μg/L ampicillin for 12 h at 37°C, 180 rpm was inoculated into a 5-L jar fermenter (Winpact Parallel Fermentation System FS-05, Major Science, Taiwan R.O.C) with a working volume of 3 L fermentation medium. The fermentation was initially performed at 37°C with agitation of 300 rpm and aeration of 1.5 vvm. 100 mg/mL Amp was supplemented to maintain plasmid retention as needed. When the optical density of the fermentation broth measured at 600 nm (OD600) reached 1.8-2.0, IPTG was added at the final concentration of 0.1 mmol/L and the inducible expression was conducted at 28°C. During the entire fermentation process, the dissolved oxygen (DO) level was maintained above 20% by controlling the agitation rate at 300–500 rpm (Supplementary Figure S1).
Construction of Metabolic Network of the Engineered E. coli W3110-BL
As a workhorse microorganism in biomanufacturing, E. coli has been extensively used for the biotechnological production of amino acids. Herein, the strain E. coli W3110-BL developed in our previous work by means of genetic manipulations was used for L-Met production.
The metabolic network of the E. coli W3110-BL with glucose as sole carbon source was constructed based on the KEGG metabolic pathway database and the other publications (Koffas et al., 1999; Hong and Lee, 2001), which consisted of 42 reactions and 36 metabolic intermediates (Tables 1, 2; the abbreviation of each metabolite was shown in Supplementary Table S2). As shown in Figure 1, with glucose as carbon source, the carbon flux passed through a series of metabolic pathway or biochemical reactions, mainly including Embden-Meyerhof-Parnas pathway (EMP pathway), pentose phosphate pathway (PP pathway), tricarboxylic acid cycle (TCA cycle), transport reactions, oxidative phosphorylation, biomass formation, and L-Met biosynthesis. For the ease of calculation and analysis, part of the metabolic pathways were simplified according to the reported approaches (He et al., 2014): (1) the amino acid degradation reaction, the nucleotide salvage pathway, and other carbon source utilization pathways were omitted; (2) The routes of other amino acids metabolism were not included, except for the essential biosynthesis pathway of the amino acids detectable in the fermentation broth; (3) The cell composition (biomass) was simplified to consist of proteins, DNA, RNA, fatty acids, and cell walls; and the synthesis of fatty acids and cell walls was expressed as the precursors synthesis in the metabolic network; (4) Since the branch pathway for L-lysine formation had been knocked out during the construction process of the engineered strain (Huang et al., 2017), the synthetic route of L-lysine was not considered in this study.
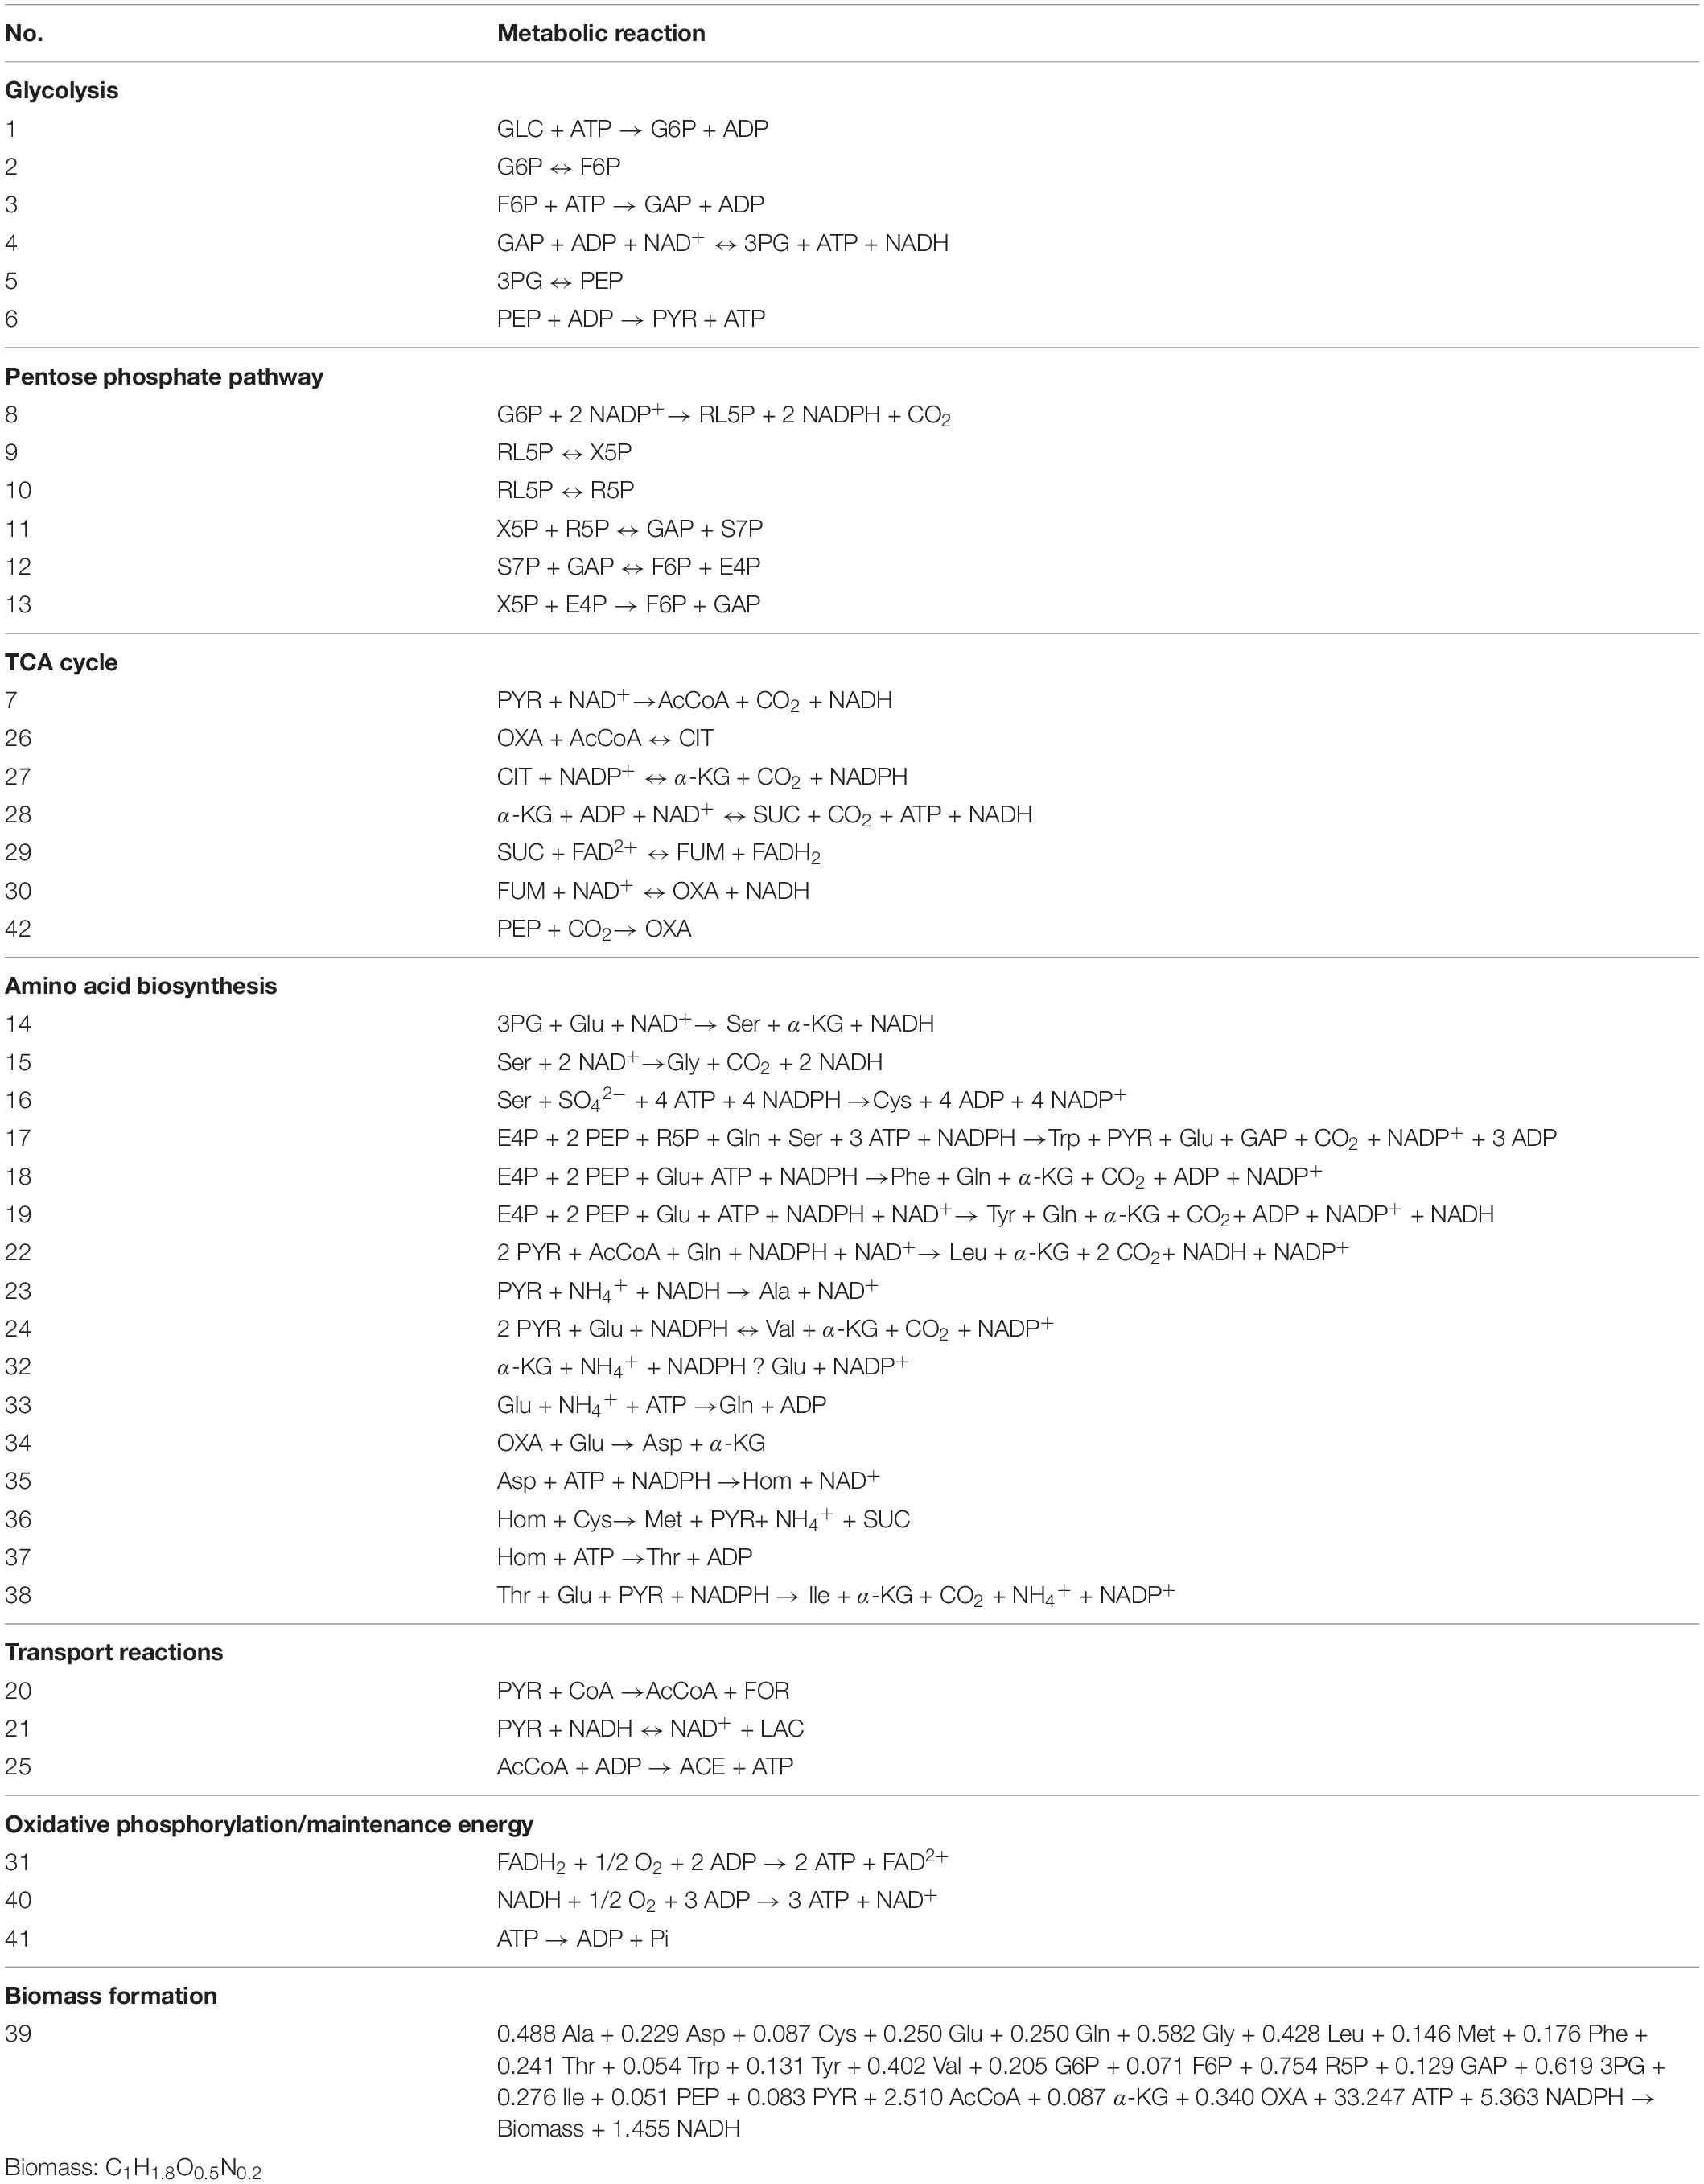
Table 1. The metabolic reaction of the engineered E. coli W3110-BL.
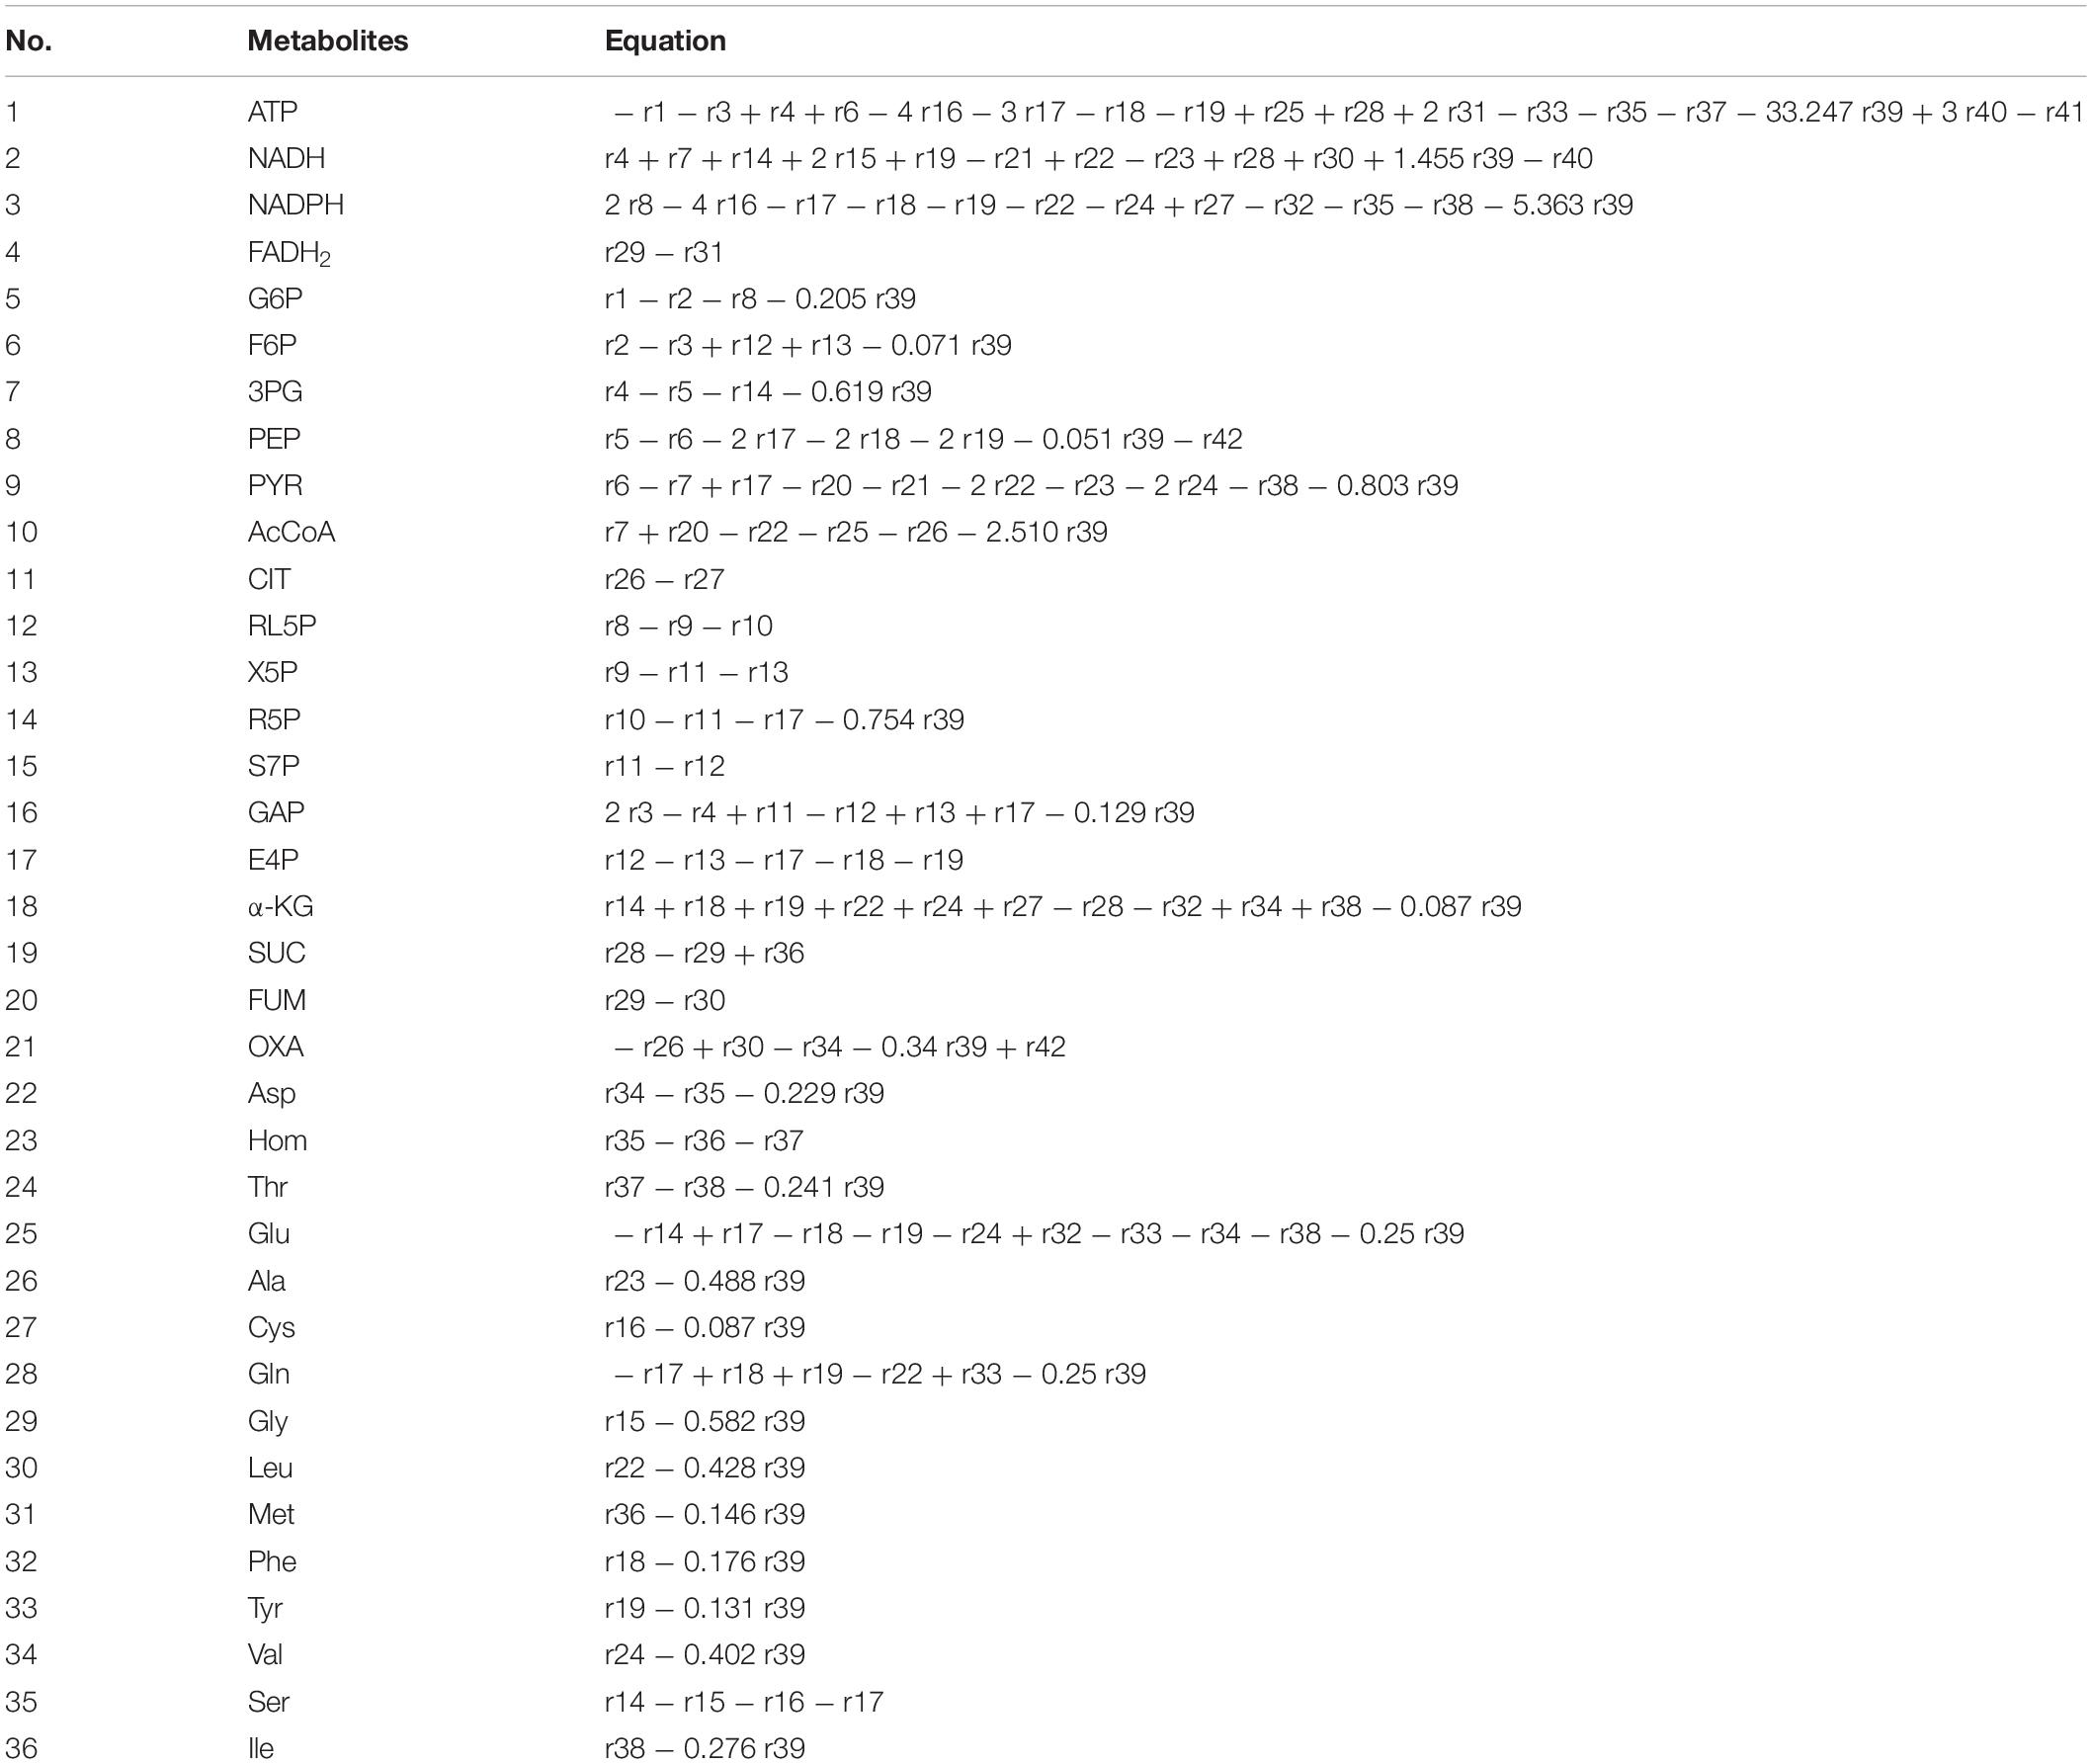
Table 2. The metabolites of E. coli W3110-BL and the reaction equations.
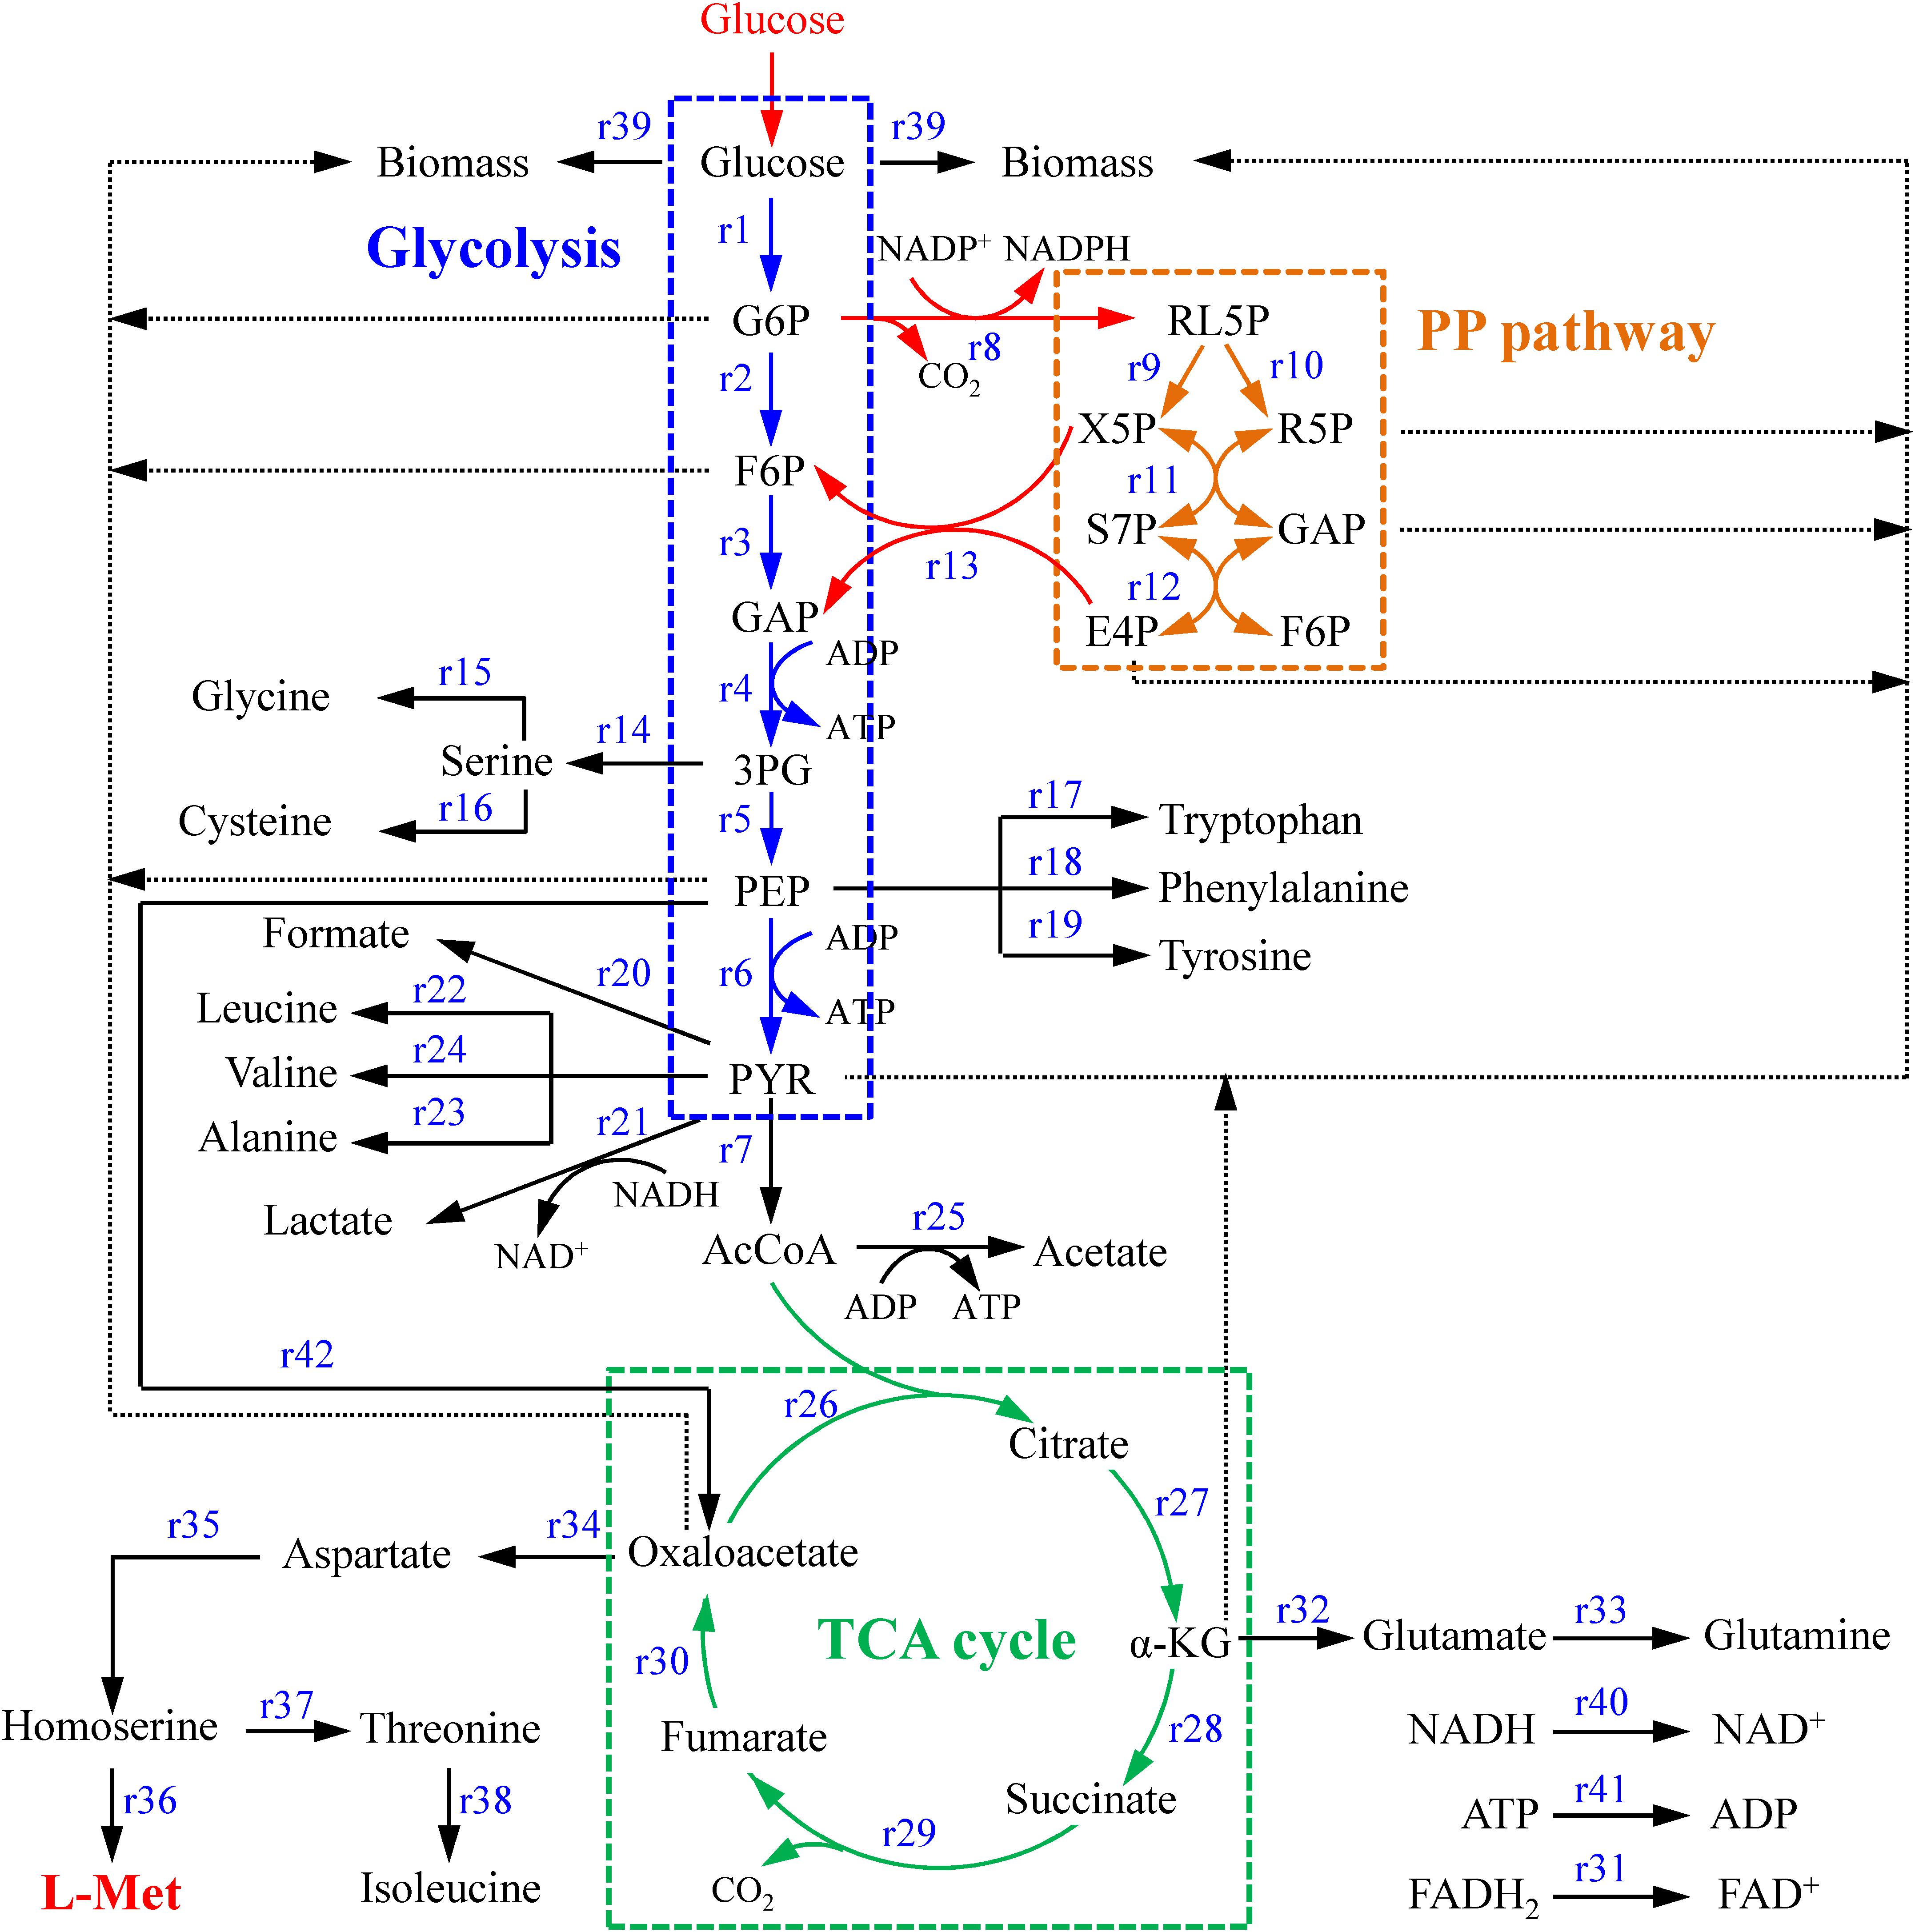
Figure 1. The central metabolism network of E. coli W3110-BL. Abbreviations: G6P, glucose-6-phosphate; F6P, 6-phosphate fructose; GAP, glyceraldehyde 3-phosphate; 3PG, 3-phosphoglycerate; PEP, phosphoenolpyruvate; PYK, pyruvate; AcCoA, acetyl coenzyme A; α-KG, α-ketoglutarate; RL5P, ribulose-5-phosphate; X5P, xylulose-5-phosphate; R5P, ribose-5-phosphate; E4P, erythrose-4-phosphate; S7P, sedoheptulose-7-phosphate.
Theory of FBA
Metabolic networks are non-linear complex networks regulated by kinetic mechanisms, usually involving hundreds of metabolites and thousands of reactions. Constructing genome-scale metabolic models manually is time-consuming and labor-intensive. Therefore, it is necessary to build mathematical models of these metabolic networks to describe, understand, and eventually predict the system metabolic behavior (Tran et al., 2008). Generally, the metabolic network is constructed by aggregating the reported data in various literature and databases. After construction of the metabolic network, the flux distribution of the metabolic network is to be determined.
In order to elucidate the reasons for the improvement of L-Met production by addition of CaCO3, a metrological model FBA, based on mass conservation and pseudo-steady-state (PSS) of metabolic intermediates (Stephanopoulos and Sinskey, 1993), was adopted to estimate the effects of CaCO3 on metabolic flux distribution of the E. coli W3110-BL. First, assuming that the net change in the concentration of either reactants or products in the metabolic network was 0, and the reaction was in a state of equilibrium. There were n constraints on reaction rates change derived from n intermediates. Then assuming the total number of rates needed to be determined is J, so the degree of freedom was F = J – n.
The flux distribution of the complete metabolic network can be determined by measuring the extracellular metabolites only if their number is more than the degree F. For each metabolite, the mass balance can be expressed as:
where, Sij in the metrology matrix represents the number of moles of metabolite i that produced or consumed in reaction j. Vj is the jth flux in the system; Xi stood for the concentration of metabolite.
When the metabolic network is at steady state, according to the principle of mass balance, the total inputting flux of each metabolite in the network toward its metabolic pool is equal to the output, so the formula could be reduced to a set of homogeneous linear equation, described in matrix notation as:
Where, S was an m × n metrology matrix. m was the number of metabolites and n the number of reactions in the system. v was an m-dimensional metabolic reaction rate vector.
In this study, the constructed model included 42 metabolic reactions and 36 metabolites (Figure 1). The freedom degree of the matrix was six. The specific cell growth rate (r39), specific glucose consumption rate (r1), as well as the specific accumulation rates of formic acid (r20), lactic acid (r21), acetic acid (r25), succinic acid (r28), and L-Met (r36), were determined based on the extracellular measurement. The positive definite matrix was calculated by Matlab 2016a software (Morales et al., 2016). All fluxes were converted to percentages based on a glucose uptake rate of 100 mmol/g cell/h.
Analytical Methods
The extracellular concentrations of pyruvic acid, formic acid, lactic acid, acetic acid, α-ketoglutarate, and succinic acid were determined by high-performance liquid chromatography (HPLC) (Waters, Milford, MA, United States) equipped with a RID detector (Waters 2410, Waters, Milford, MA, United States). For metabolites separation, an Aminex HPX-87H column (BioRad, München, Germany) was used, working at 35°C and a flow rate of 0.6 mL/min with 5 mmol/L sulfuric acid as mobile phase. Biomass, residual glucose, and L-Met was measured as described previously (Zhou et al., 2019). The specific oxygen uptake rate was measured by the dynamic method (Santos et al., 2006). The specific carbon dioxide production rate was determined by a titrimetric method (Converti et al., 2003).
For preparation of cell-free extracts, the E. coli cell pellets were collected, washed and suspended in 100 mM potassium phosphate buffer (pH 7.0). The pellets were disrupted by sonication (work time 5 s, interval 10 s, total time 2 min) in an ice bath using an ultrasonic processor VCX 130PB (Sonic & Materials Inc., Newtown, United States). Cellular debris was removed by centrifugation at 12,000 g and 4°C for 5 min. The crude extracts were used for assays of enzyme activity and intracellular calcium irons level. Protein concentration was determined by the Bradford method (Bradford, 1976) using bovine serum albumin as the standard.
A Citrate Synthase Activity Assay Kit (Nanjing Jiancheng Bioengineering Institute, Nanjing, China) was used for Citrate synthase (CS) activity detection. According to the instruction of Kit, CS activity was assayed spectrophotometrically at 412 nm using 5,5′-dithiobis (2-nitrobenzoic acid) (DTNB) colorimetric assay method (Srere, 1969; Quandt et al., 2015).
The calcium concentration was assayed using a Calcium Assay Kit (Nanjing Jiancheng Bioengineering Institute, Nanjing, China) with methylthymol blue (MTB) as a color agent (Themelis et al., 1999). The absorbance of the colored Ca-MTB complex produced was monitored at 610 nm by a Microplate Spectrophotometer SpectraMax M2 (Molecular Devices, CA, United States).
The transcriptional responses of the genes associated with the TCA cycle to CaCO3 addition were detected by the qRT-PCR. Samples were taken at the logarithmic growth phase (15 h) during the fermentation process with or without addition of CaCO3 and treated by flash-freezing in liquid nitrogen. The total RNA was extracted using RNAiso Plus reagent (Takara, Kyoto, Japan) according to the manufacturer’s instructions. The RNA quality was determined using 1% agarose gel electrophoresis and the quantity was measured with a NanoDrop 2000c UV–vis Spectrophotometer (Thermo Scientific, Madison, United States). Each RNA sample was reverse-transcribed to cDNA by the PrimeScriptTM RT reagent Kit (Takara, Kyoto, Japan) according to the manufacturer’s manual. The qRT-PCR was carried out on a LightCycler 480 System (Roche, Basel, Switzerland) using TB Green real-time PCR mix (Takara, Kyoto, Japan) with the specific primers (Supplementary Table S1). The house-keeping gene 16S rRNA was used as an internal control. The PCR amplification was performed in 10 μL reaction mixtures, which consisted of 5 μL 2 × SYBR Premix Ex Taq, 0.5 μL diluted cDNA, 0.2 μL forward and reverse primer, and 4.1 μL RNase free water. All the PCR reactions were carried out using the following protocol: 95°C for 30 s; 40 cycles of 94°C for 3 s and 60°C for 30 s. The qRT-PCR for each sample was performed in triplicate and the results were analyzed with the 2–ΔΔCt method (Livak and Schmittgen, 2001).
Statistical Analysis
All experiments were carried out in triplicate and the average values were reported. The values of average and standard deviation (SD) were calculated in Microsoft Excel. The statistical differences were determined according to student’s t-test. P values of <0.05 were considered statistically significant.
Results and Discussion
CaCO3 Addition Improves L-Met Biosynthesis in the Engineered E. coli W3110-BL
For L-Met biosynthesis, the engineered E. coli W3110-BL was grown in batch cultures performed in 5-L fermentor, during which the pH of the fermentation medium was maintained at 6.8 ± 0.2 either with 30% NH3⋅H2O or with CaCO3 in different concentrations (10, 20, 30, and 40 g/L). As shown in Figure 2, when the pH was adjusted with 30% NH3⋅H2O, only 0.94 g/L L-Met was accumulated; while with CaCO3 as pH regulator, L-Met accumulation was enhanced compared with that of the control (with 30% NH3⋅H2O). Furthermore, L-Met titer was increased as the CaCO3 amount raised from 0 to 30 g/L, with the maximum value of 1.48 g/L at 30 g/L CaCO3 (57.45% higher than that of the control). The yield of L-Met against glucose was 0.089 mol/mol, considerably increased compared with that of the control (0.057 mol/mol). However, with CaCO3 further increased to 40 g/L, decreased L-Met production was observed. Therefore, from the view of fermentation optimization, 30 g/L CaCO3 was determined to be most conducive to L-Met biosynthesis.
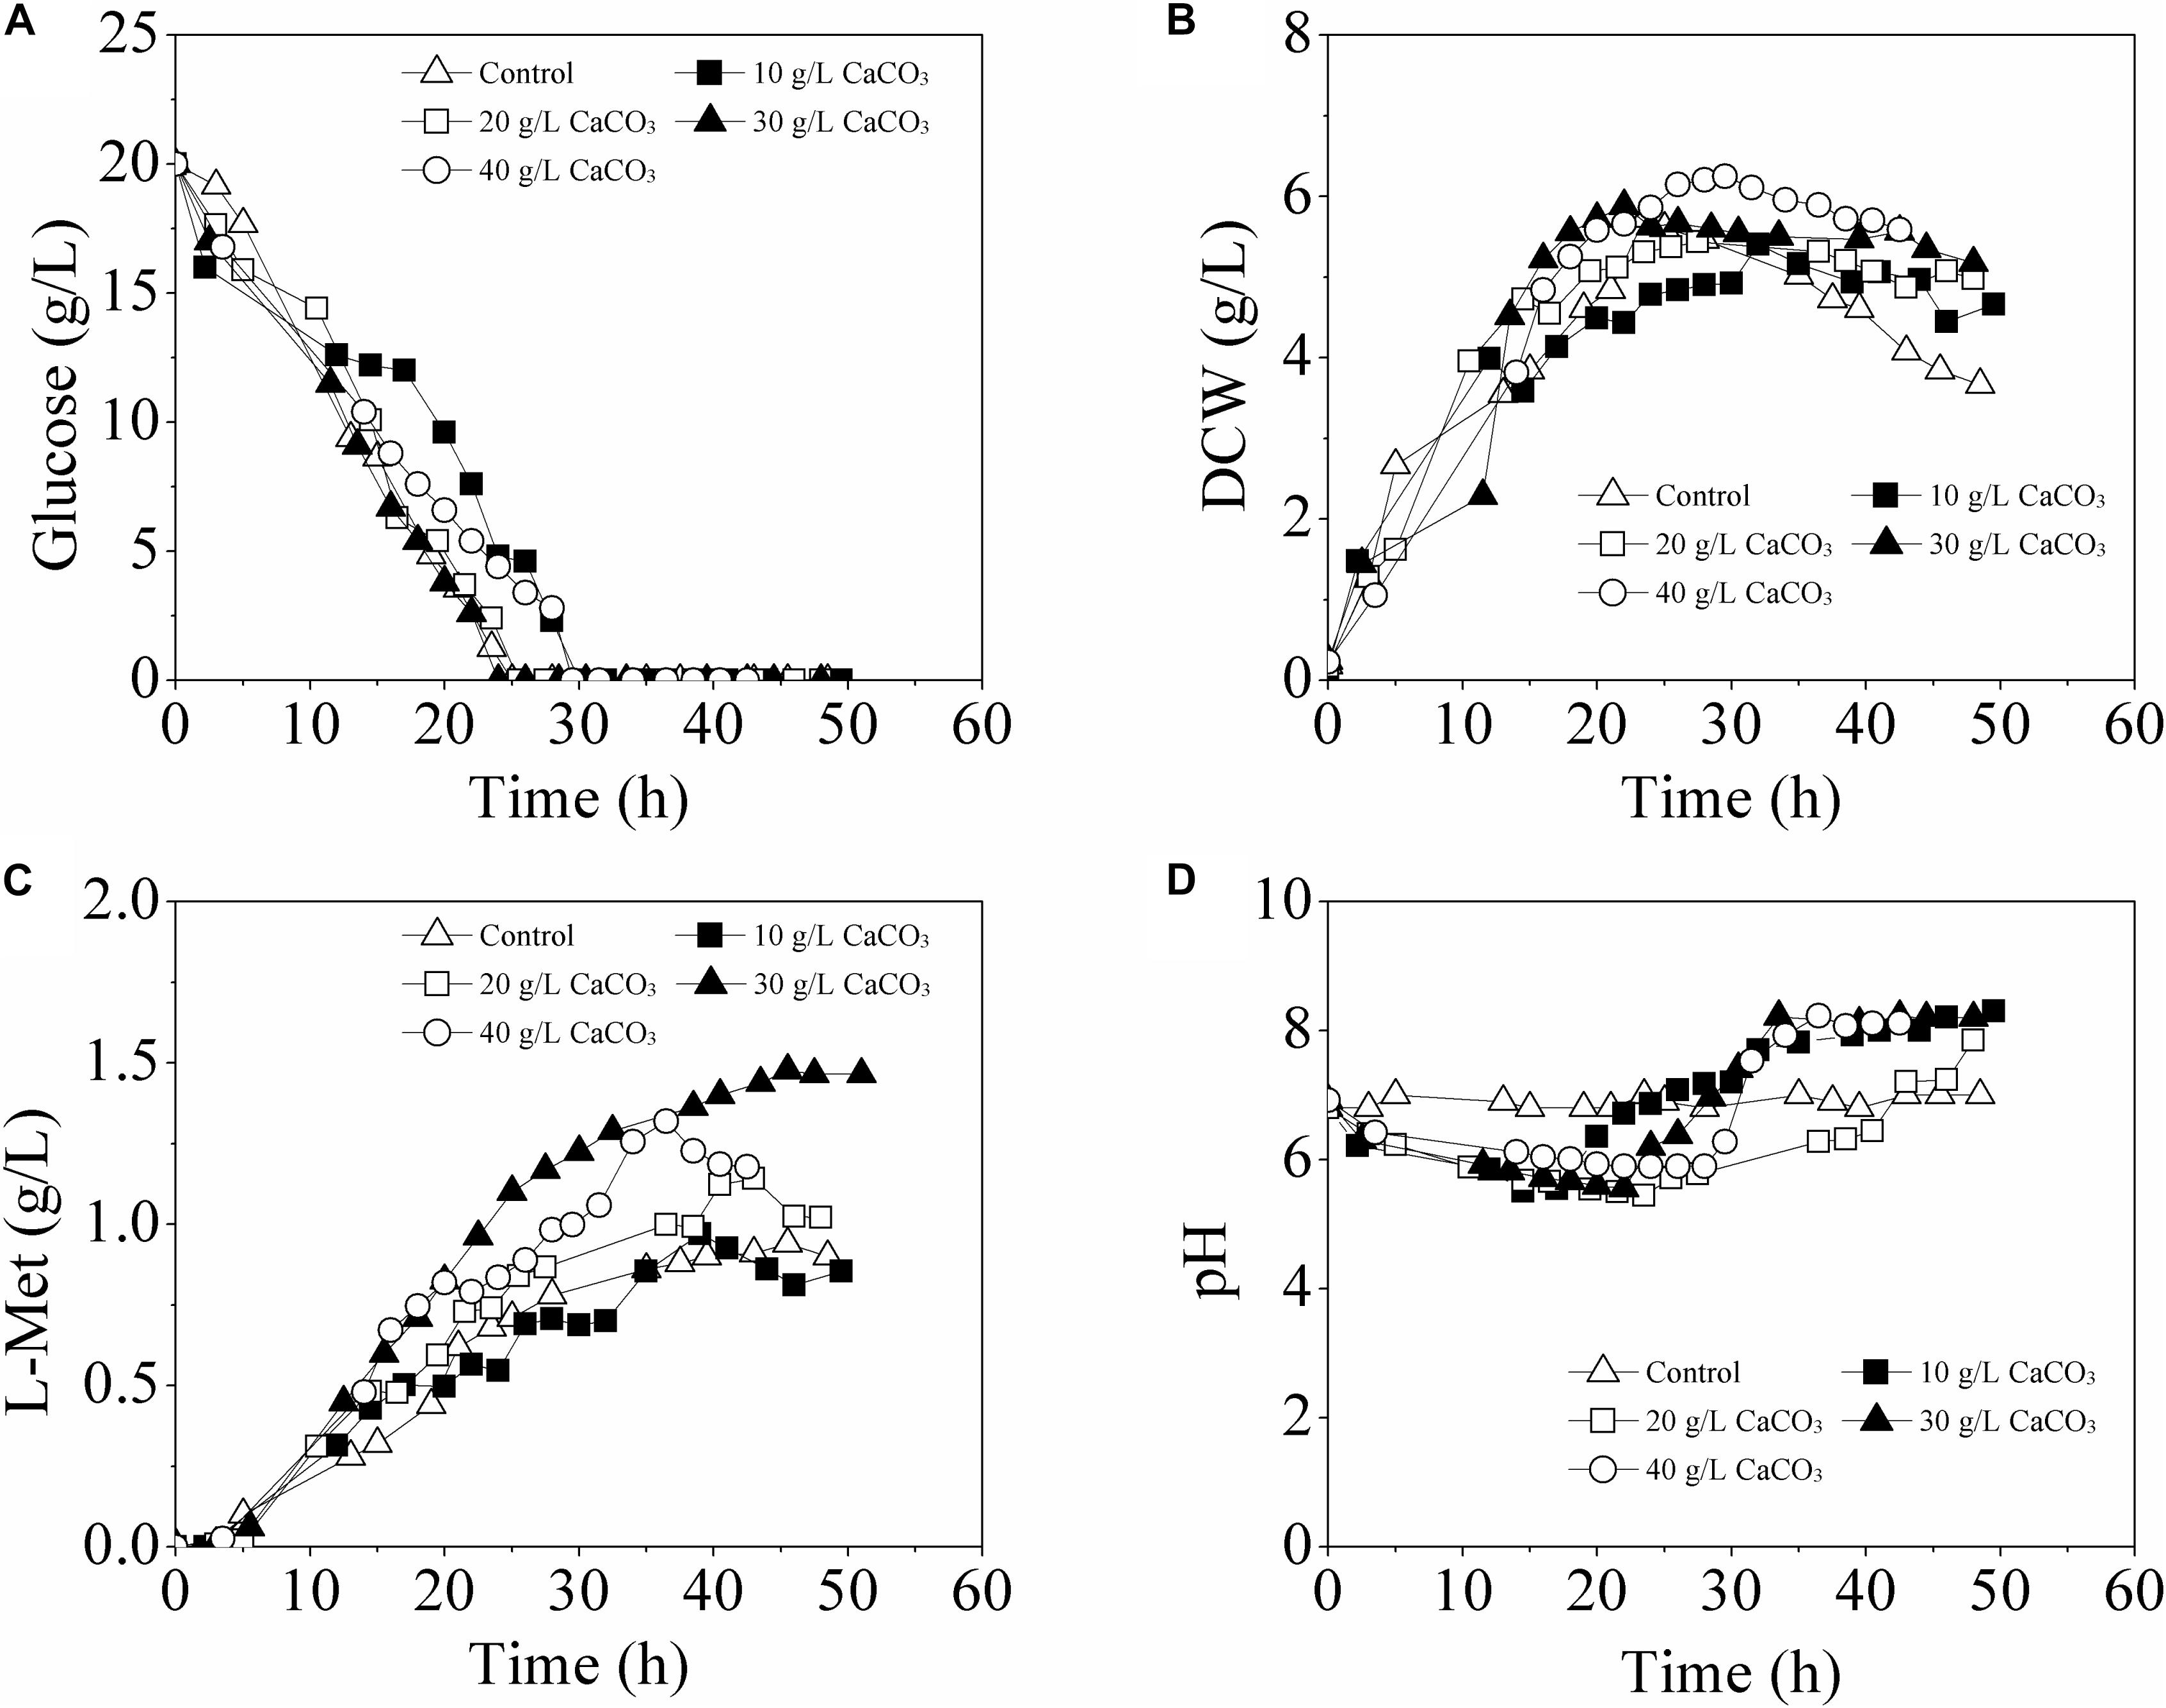
Figure 2. Time course of fermentative production of L-Met with E. coli W3110-BL in 5-L fermentor supplemented with different amounts of CaCO3. (A) glucose consumption; (B) cell growth; (C) L-Met biosynthesis; (D) pH variation. All measurements were performed in triplicate. For clarity, the error bars were not displayed.
It should be noted that, when using CaCO3 as pH regulator, the pH of the fermentation medium was not constant. As was seen from Figure 2D, in batch cultivation with different amounts of CaCO3 addition, the pH was approximately at 6.8 (set value) in the initial stage and slowly varied (first decreased and then increased) between 5.5 and 8.2 with different patterns till the end of the fermentation.
To clarify whether pH or the presence of calcium really affected the L-Met production, other two different modes of batch fermentation were also tried. In Mode I, the pH was maintained at 6.8 ± 0.2 by automatic addition of 30% NH3⋅H2O as well as supplement of 30 g/L CaCO3; in Mode II, CaCl2 (33.3 g/L) was used to displace CaCO3. Herein, the mode with pH controlled at 6.8 ± 0.2 by automatic addition of 30% NH3⋅H2O was named as Control-I, and the one only with 30 g/L CaCO3 as pH regulator was named as Control-II. Except for the pH in Control-II that was varied between 5.5 and 8.2 over time (Figure 2D), the pH values in Control-I, Mode I, and Mode II were all well controlled at about 6.8 (data not shown).
As shown in Figure 3, with different modes of pH control, the profiles of glucose consumption and cell growth exhibited no crucial distinction among all the batch runs. Interestingly, when the pH was maintained at 6.8 ± 0.2 by 30% NH3⋅H2O, either with addition of CaCO3 (Mode I) or CaCl2 (Mode II), the L-Met accumulation was also greatly improved, 59.57 and 58.51% higher than that of the Control-I, respectively.
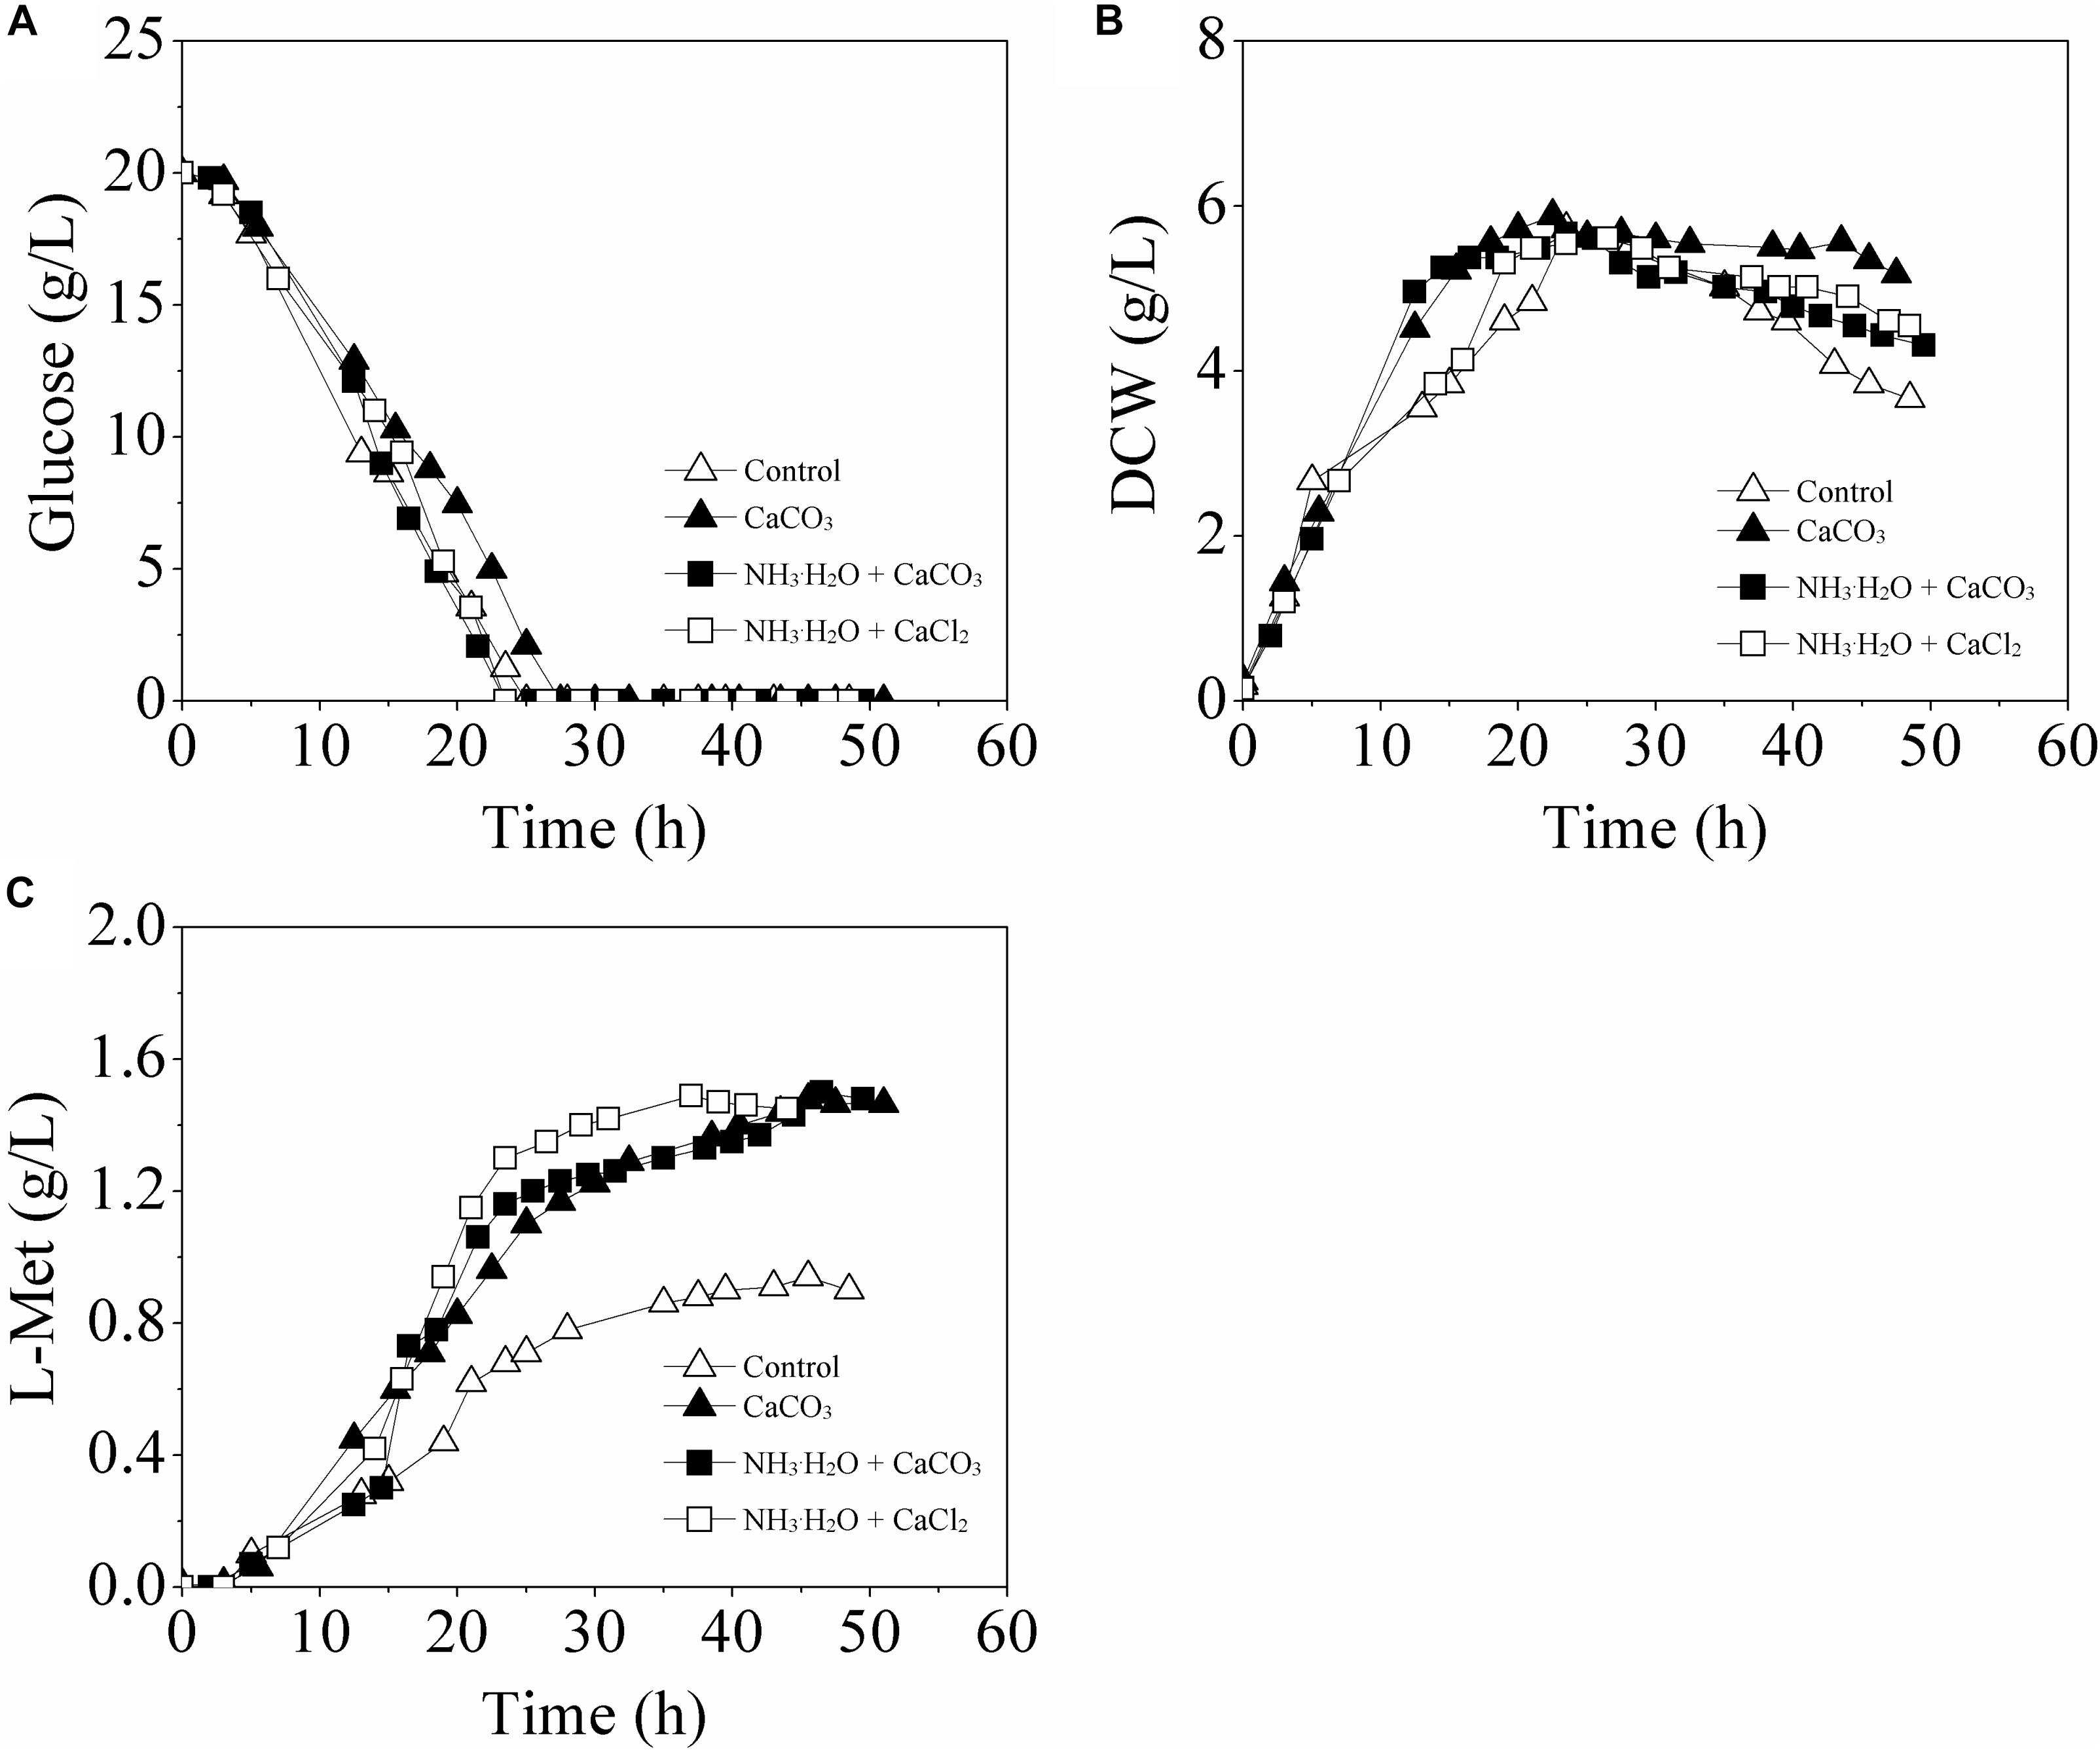
Figure 3. Time course of L-Met fermentation by the genetically engineered E. coli W3110-BL in batch cultures with different pH control modes. (A) glucose consumption; (B) cell growth; (C) L-Met biosynthesis. All measurements were performed in triplicate. For clarity, the error bars were not displayed.
The fermentation patterns in Control-II and Mode I which both contained 30 g/L CaCO3 were compared and analyzed further. Interestingly, although the extracellular pH values of E. coli cells in these two cases were different, there was no significant difference with respect to L-Met biosynthesis. This indicated that calcium ions rather than environmental pH were most responsible for the enhancement of L-Met accumulation.
As shown in Figure 4, the intracellular calcium concentrations in Control-II and Mode II were in the same order of magnitude, although the solubility of CaCO3 is much lower than that of CaCl2 in aqueous solution. And it was considerably higher in each mode (1–10 mmol/L) in comparison with that in Control-I (0.5–8.0 μmol/L), implying that the consumption of calcium ions (intracellular free Ca2+ concentration) was highly correlated with the accumulation of L-Met.
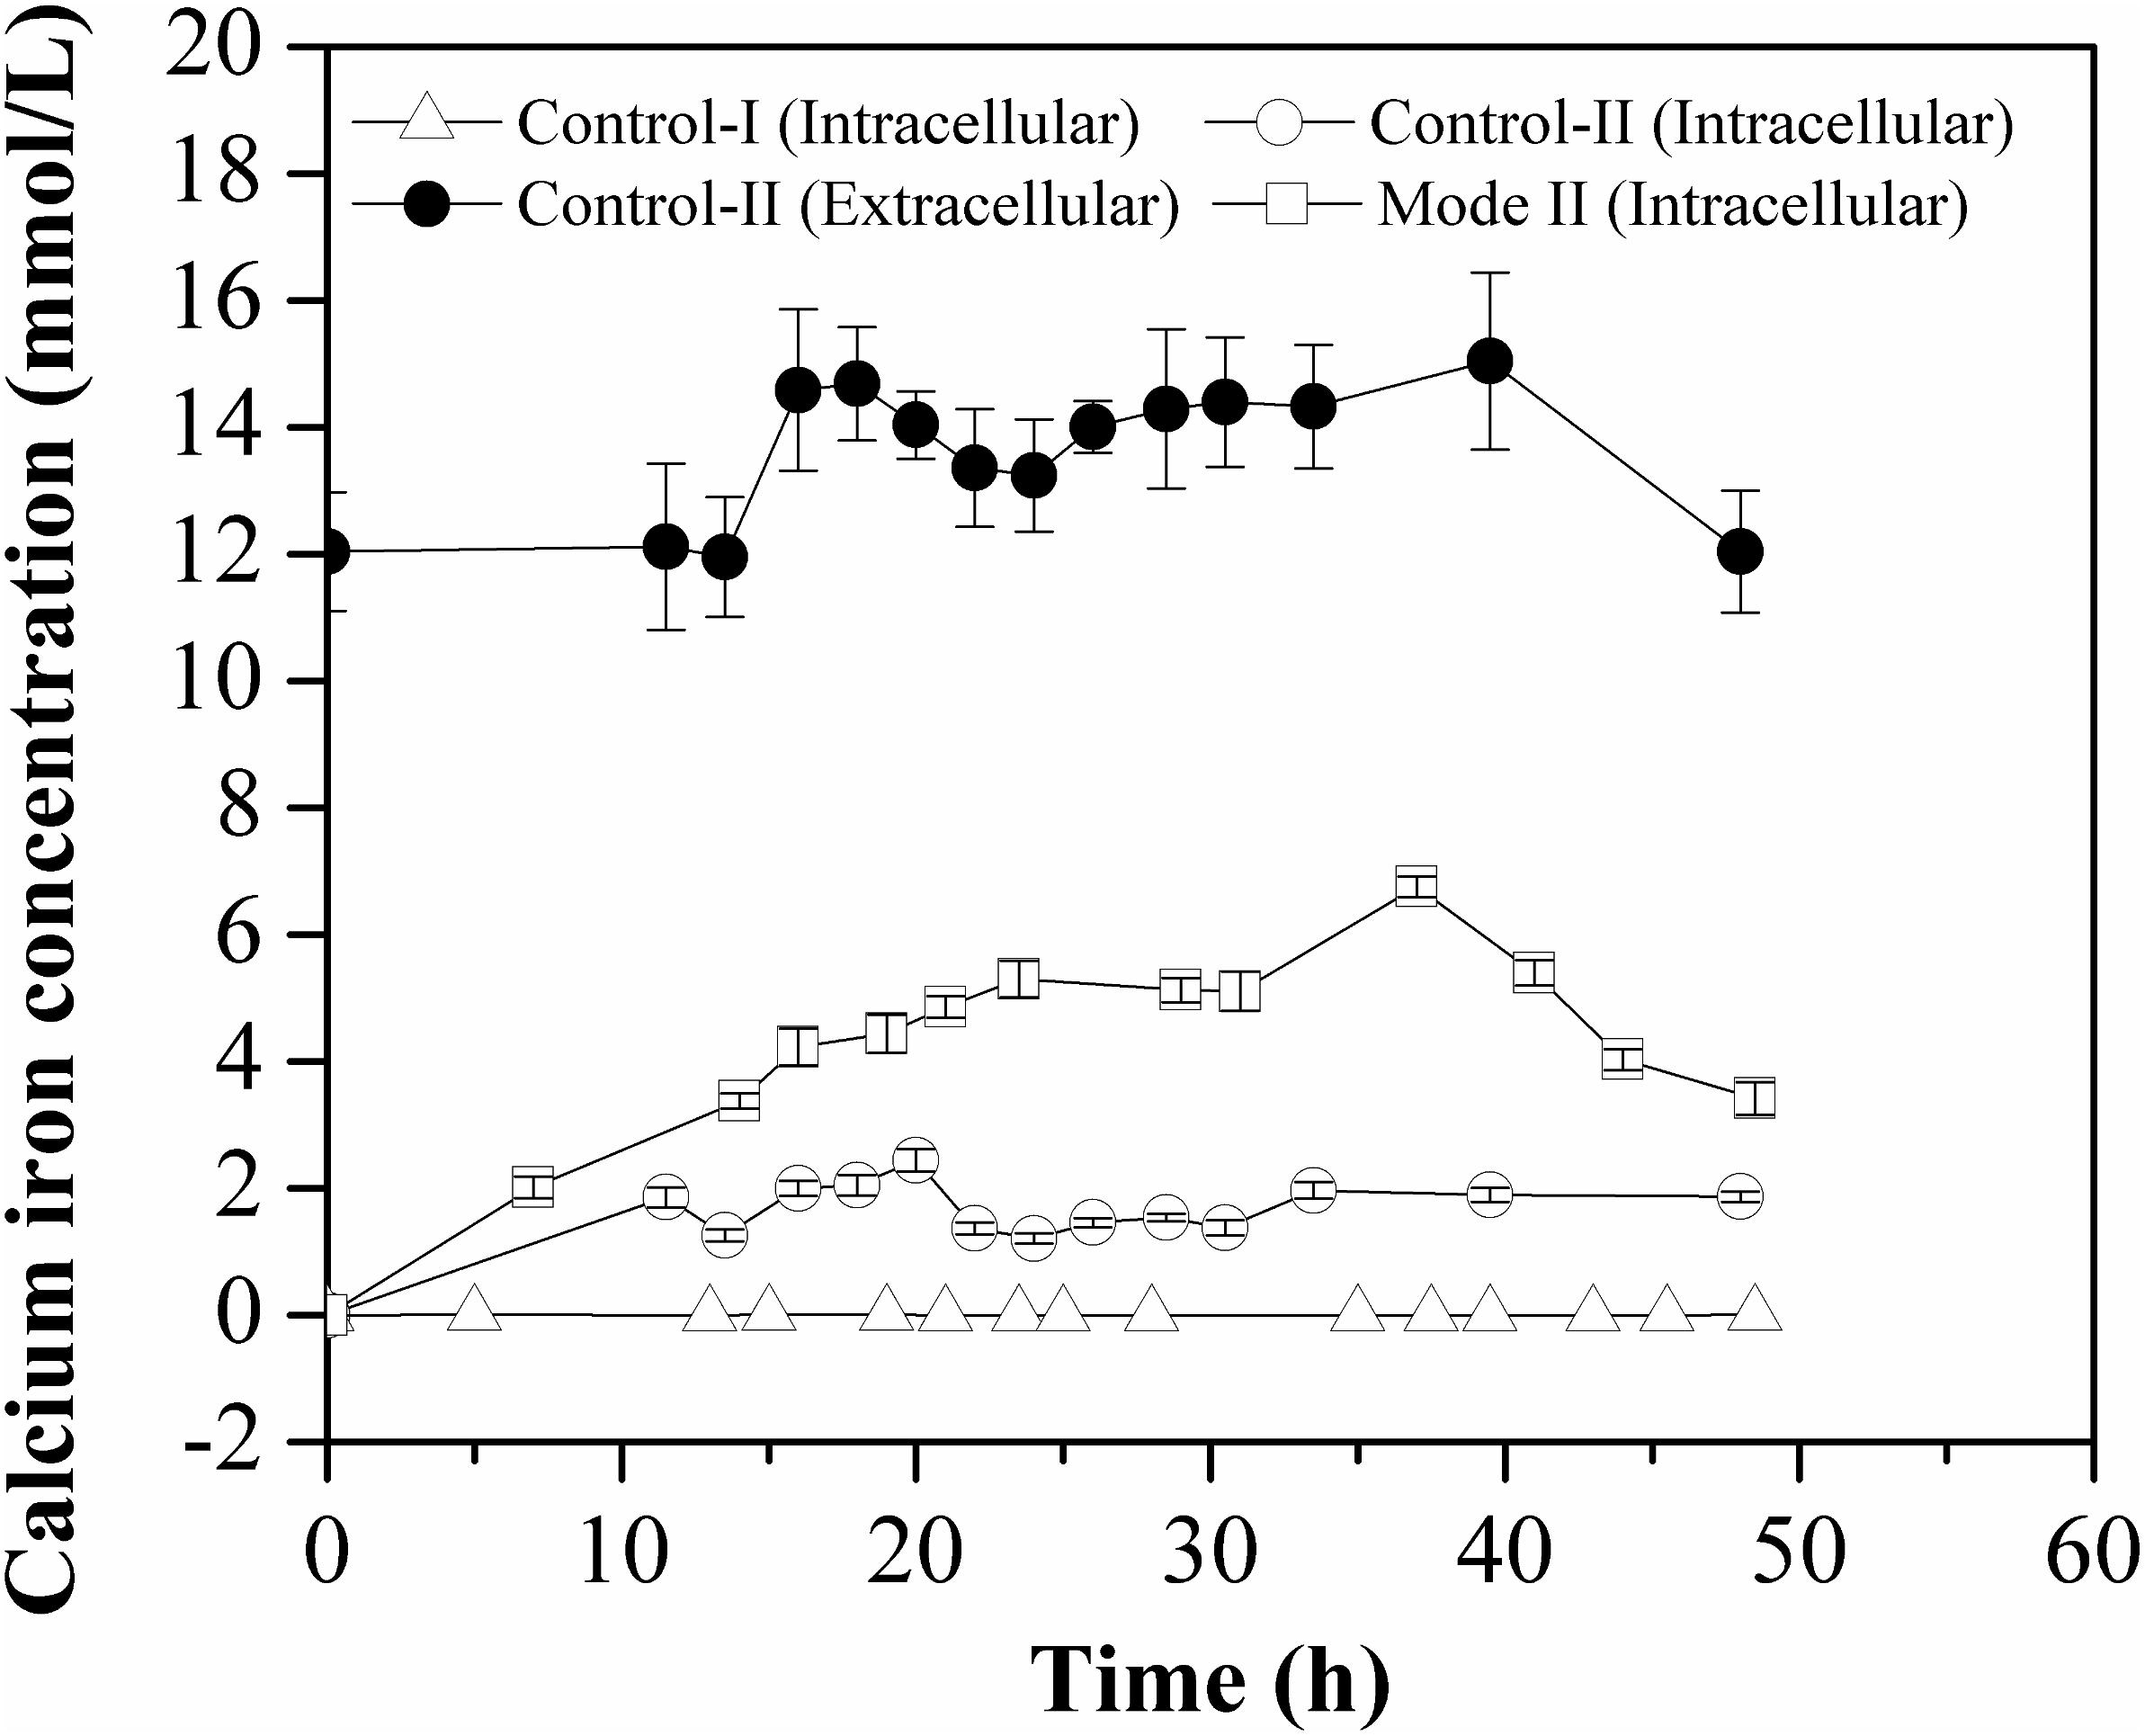
Figure 4. Free Ca2+ concentration inside the cells grown in different batch cultures. The intracellular Ca2+ concentration was measured in crude cell extracts and all measurements were performed in triplicate.
By-Products Formation in the Batch Fermentation With CaCO3 Addition
The formed by-products were detected and the results were illustrated in Figure 5. With the existence of CaCO3, the maximum concentrations of main organic acids including α-ketoglutarate, succinic acid, lactic acid, formic acid, and acetic acid were increased to different degrees. As for α-ketoglutarate and succinic acid, the highest accumulation in the case of CaCO3 addition was increased by 50 and 20.3%, respectively, compared with that of the control. It was speculated that the presence of CaCO3 probably increased the carbon flux of the TCA cycle. After the glucose was exhausted, the accumulations of α-ketoglutarate and succinic acid were both decreased, likely due to their conversion to other metabolic products. By contrast, the biosynthesis of formic acid, lactic acid, and acetic acid was not immediately influenced by glucose limitation in the presence of CaCO3. All the main organic acids formed in the fermentation process might be re-utilized for maintenance of cell growth or L-Met biosynthesis in the late fermentation phase.
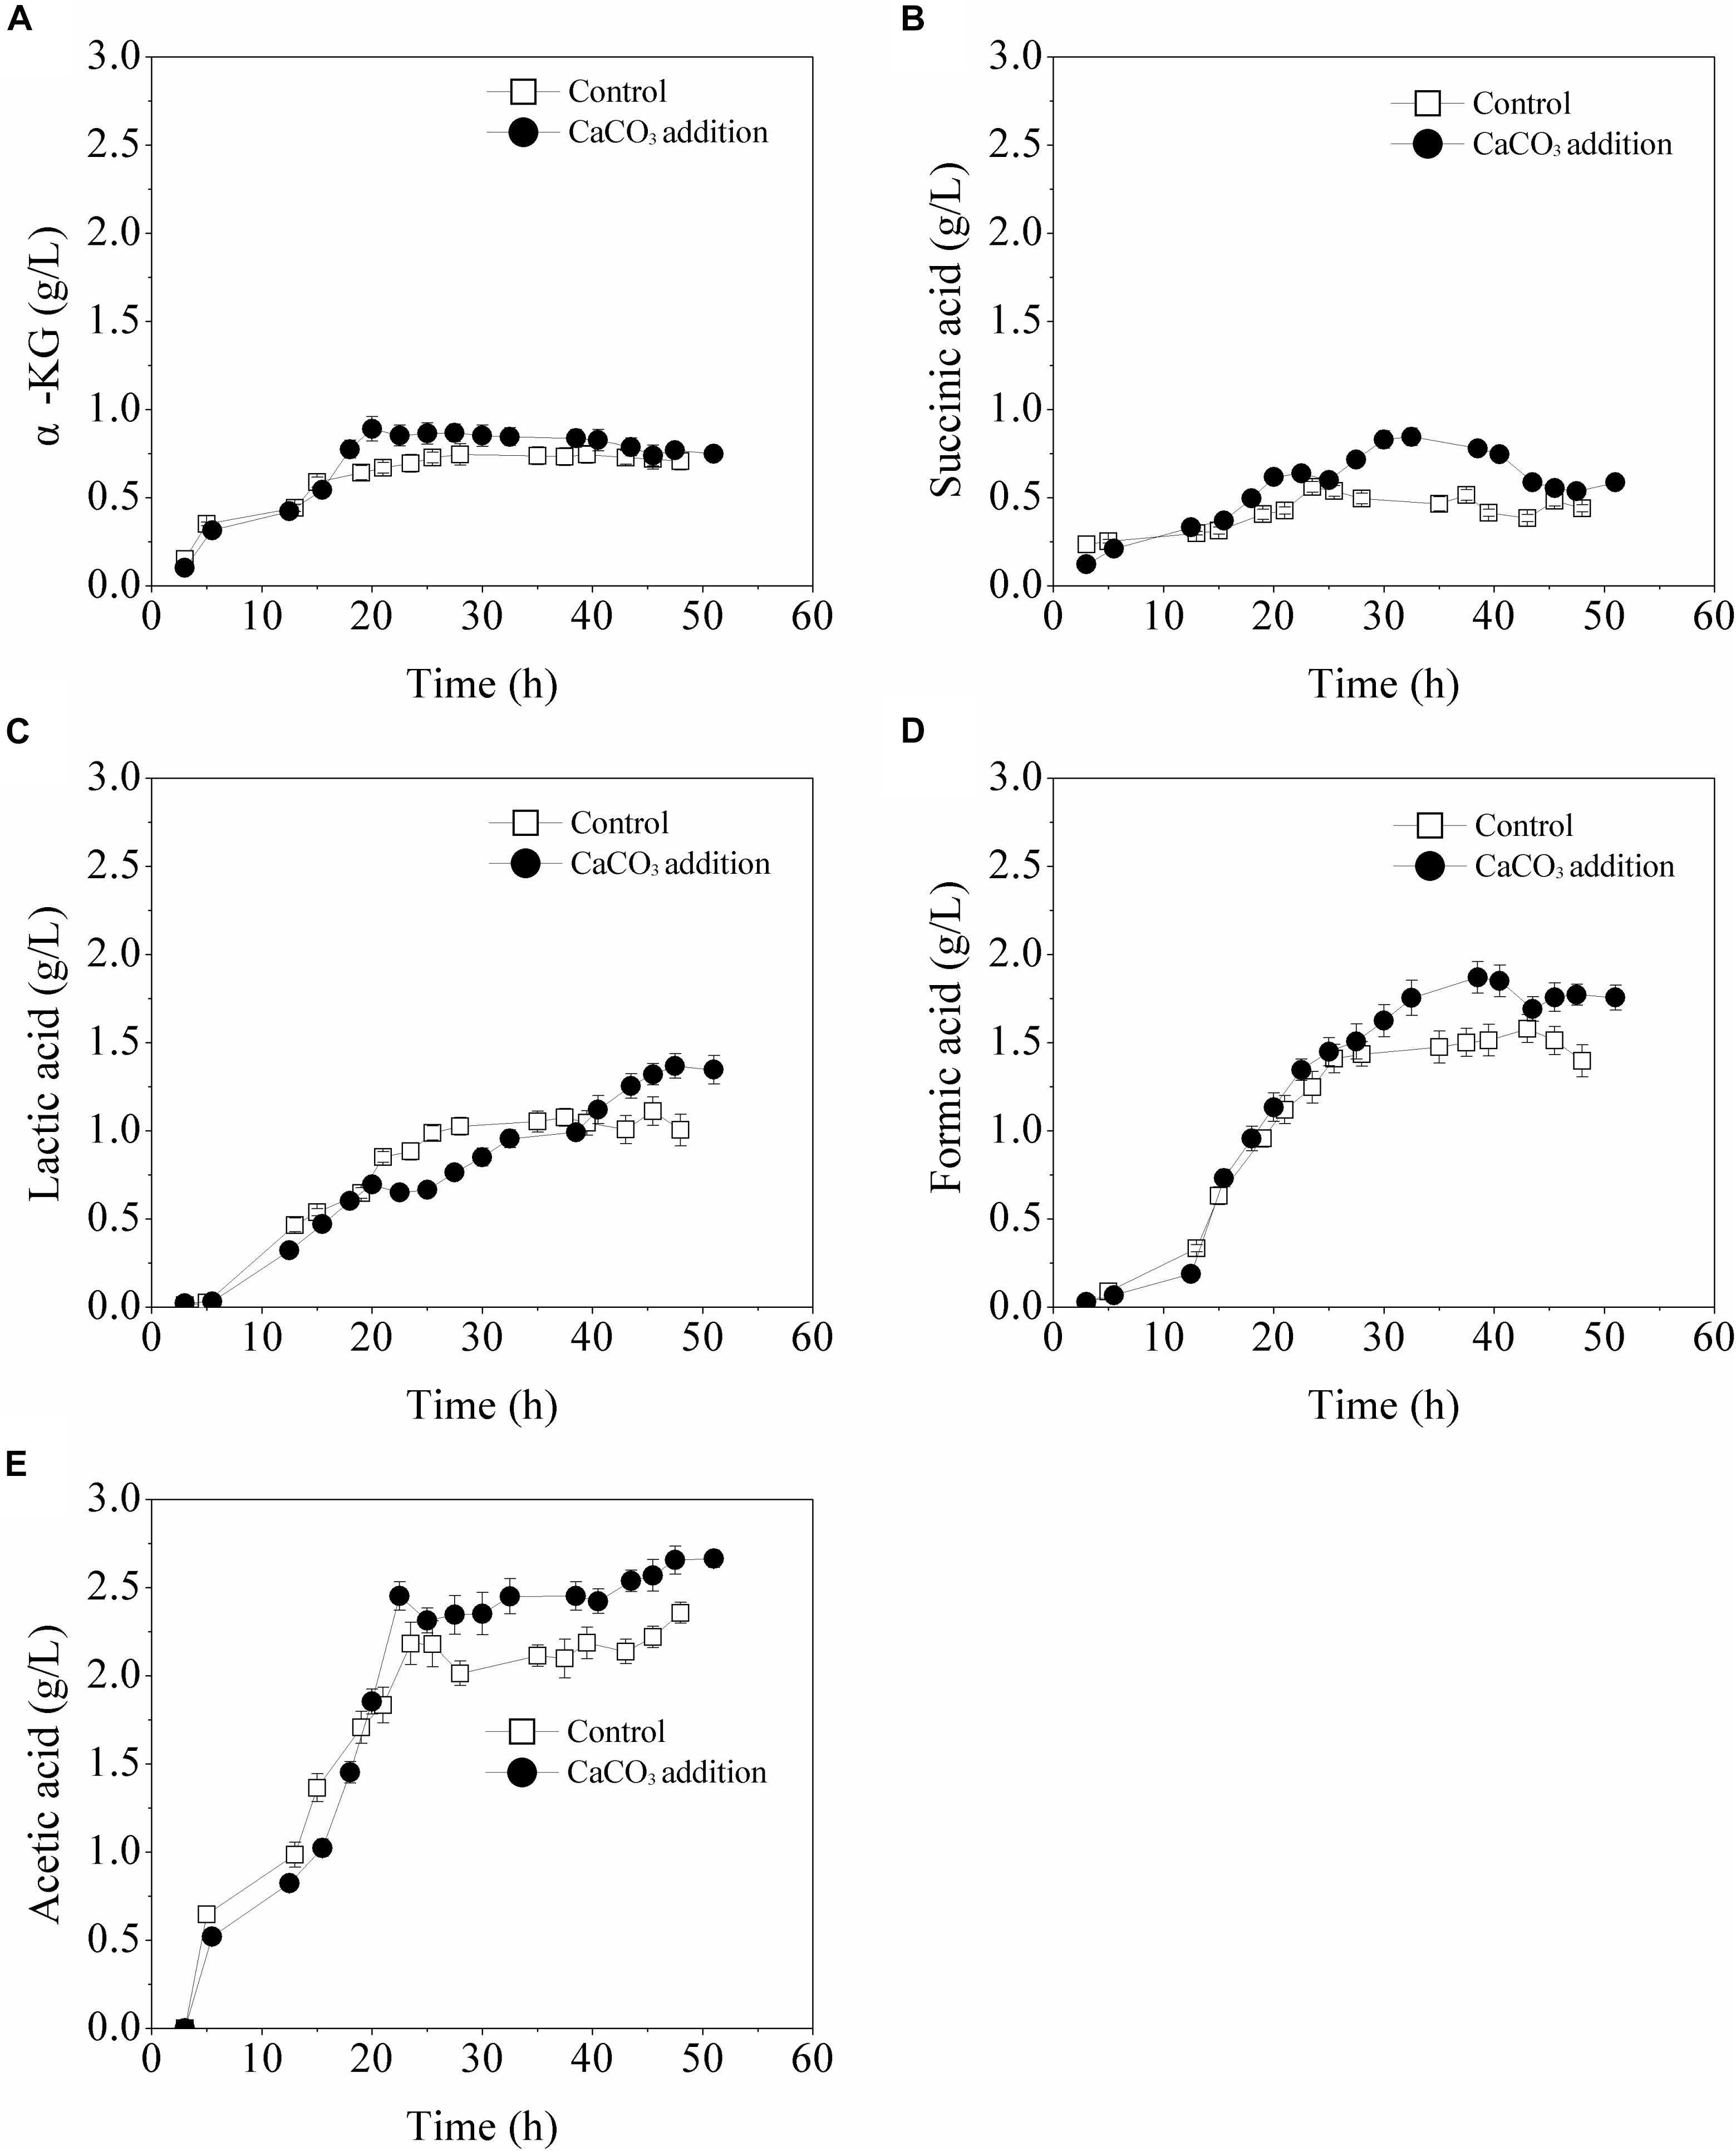
Figure 5. Biosynthesis of organic acids in batch cultures in 5-L fermentor without or with CaCO3 (30 g/L) addition. SD is shown for triplicate measurements of each organic acid. (A) α-KG, (B) succinic acid, (C) lactic acid, (D) formic acid, and (E) acetic acid.
The Effect of CaCO3 Addition on Carbon Metabolic Flux Distribution
In order to reveal the specific role of CaCO3 addition on the L-Met biosynthesis pathway in E. coli W3110-BL, the intracellular metabolic flux distribution was estimated using the FBA method. 12 reaction rates including the specific consumption rate of glucose (r1)/oxygen and the specific formation rate of formic acid (r20), lactic acid (r21), acetic acid (r25), α-ketoglutarate, succinic acid (r28), L-Met (r36), biomass (r39), carbon dioxide, pyruvic acid, and other amino acids (L-isoleucine, L-leucine, L-threonine, L-homoserine, and L-tyrosine) were calculated and summarized in Table 3. The other amino acids were expressed as a homogenized chemical with a formula of C5H11NO2.6.
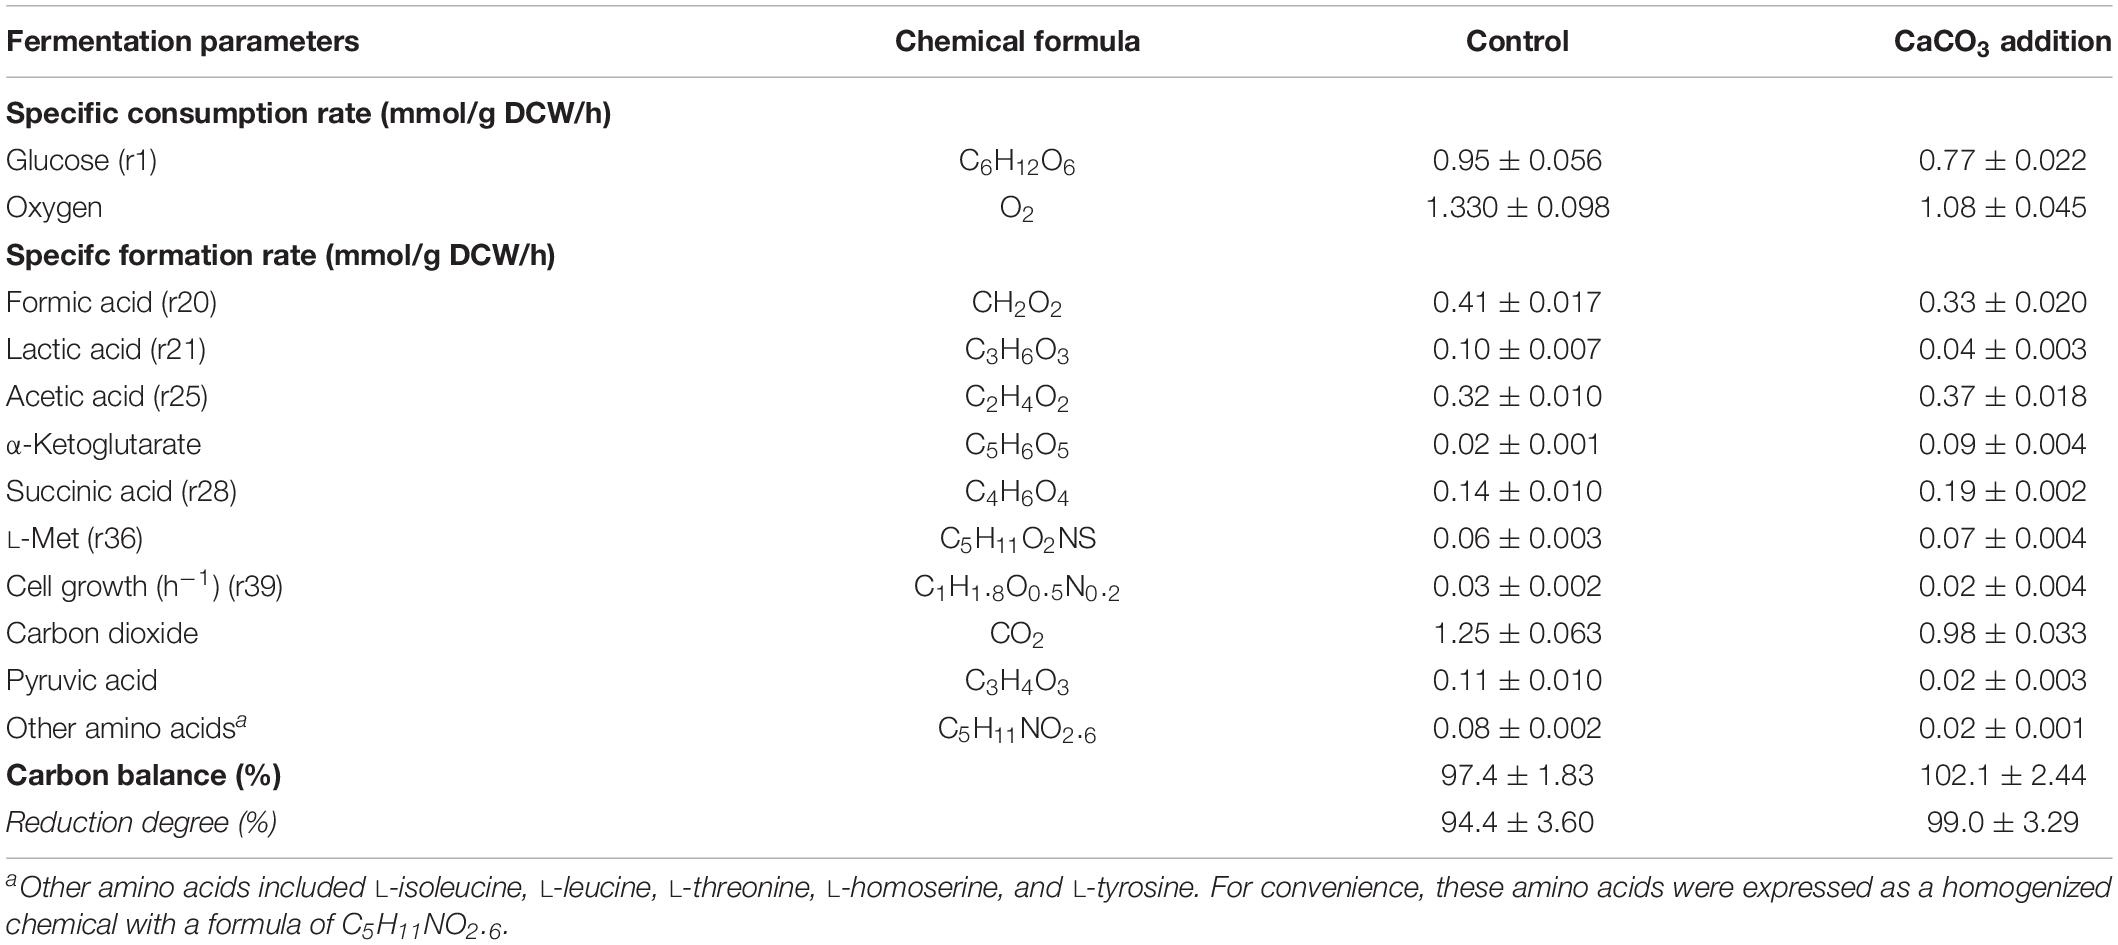
Table 3. Rate parameters of metabolic reaction in E. coli W3110-BL.
Carbon recoveries as biomass and various metabolites were 97.4–102.1% of the theoretical maximum, suggesting that the major metabolites were properly identified and quantified. The reduction degree calculated based on the equation ε = 4 C + H − 2 O − 3 N (Oh et al., 2008) were well balanced. Among these reaction rates, r1, r20, r21, r25, r28, r36, and r39 were used to determine the volumetric formation rates of intracellular metabolites.
The metabolic model included the main biochemical pathways in carbon central metabolism: glycolysis, PP pathway, TCA cycle, amino acid synthesis, transport reactions, oxidative phosphorylation, and biomass formation. The average intracellular metabolic flux distribution in the late logarithmic growth phase (19 h) was calculated and shown in Figure 6. This model developed herein was simple but biologically meaningful in description of the central metabolism and L-Met biosynthesis, thus the quality of the outcome computed from the model was valid in estimating the effect of CaCO3 addition on E. coli intracellular flux distributions in batch cultures.
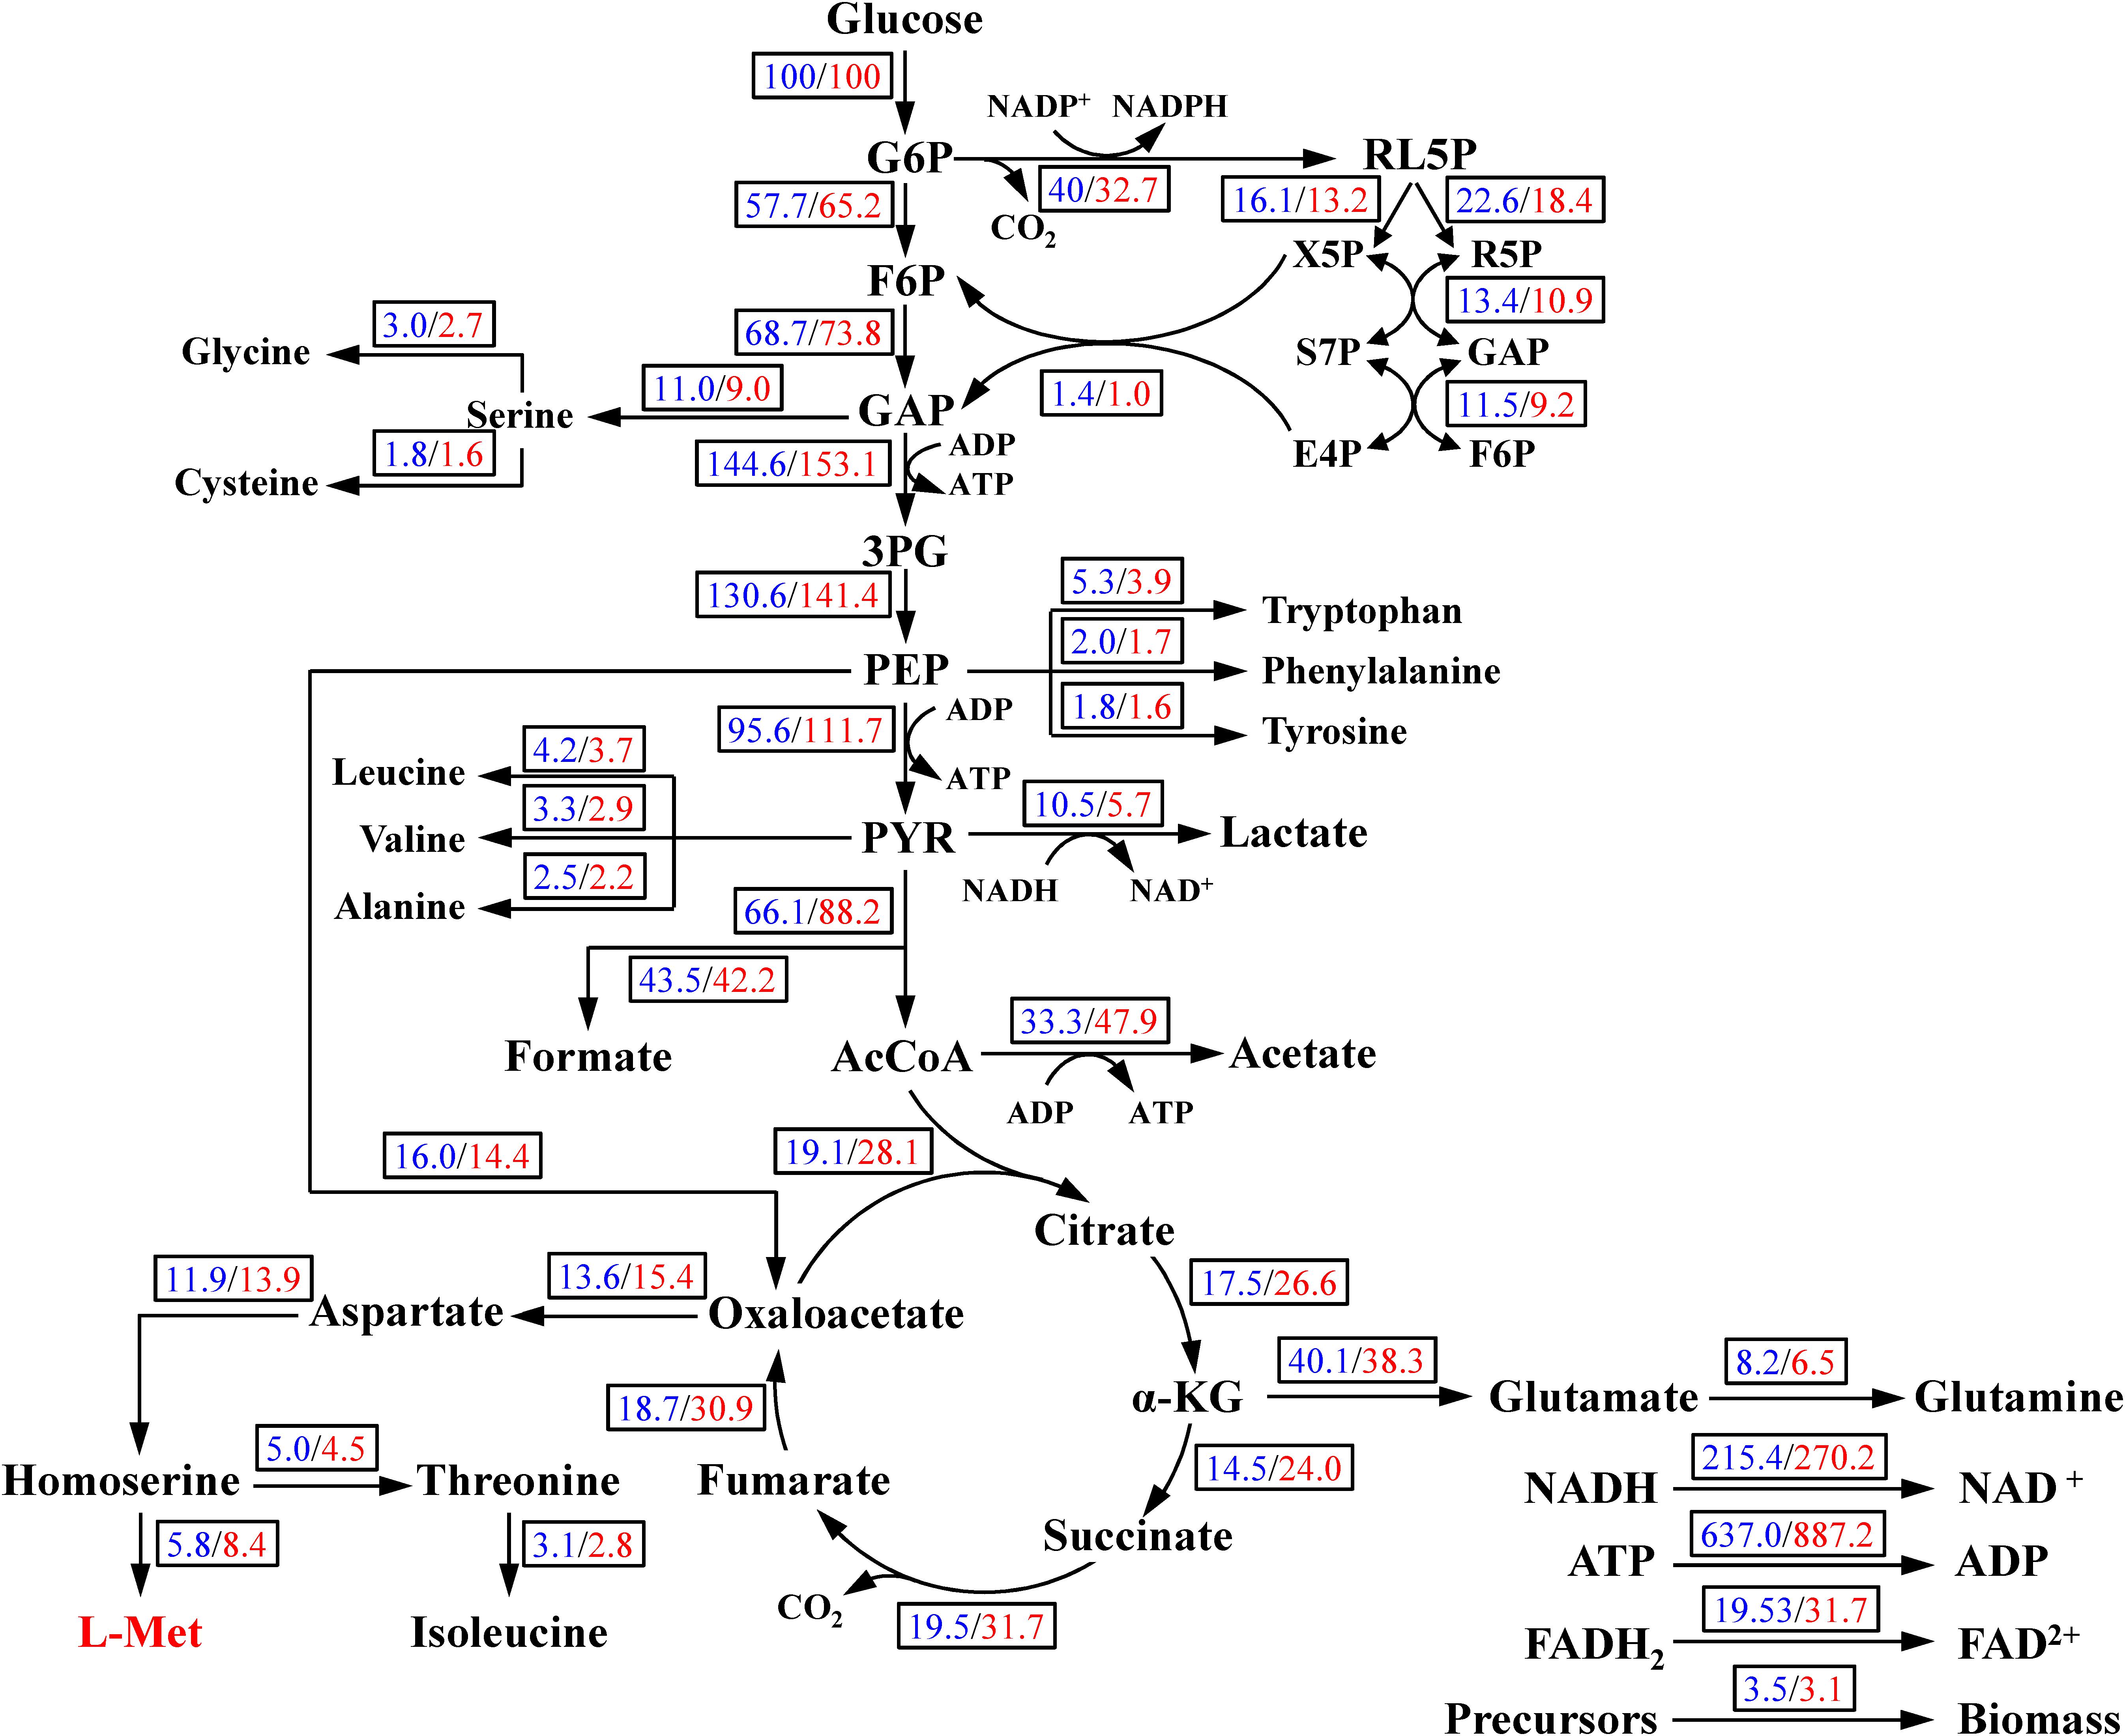
Figure 6. Metabolic flux distributions in the central metabolic pathways at 19 h in the case of control/CaCO3 addition. Fluxes shown are normalized to glucose uptake rate of 100 for each condition. All data were in mmol/g DCW/h except biomass g/g DCW/h.
As shown in Figure 6, carbon flux in the central metabolism was redistributed in response to CaCO3 addition. The carbon flux into L-Met biosynthesis was increased by 44.83% in the case of CaCO3 addition, whereas the carbon flux into the TCA cycle was also increased considerably. Under the aerobic condition, the glycolysis and TCA cycle were correlated by the conversion of PEP to oxaloacetate catalyzed by phosphoenolpyruvate carboxylase as well as the formation of citrate from oxaloacetate and acetyl-CoA catalyzed by the citrate synthase. It could be seen from Figure 6 that the carbon flux into oxaloacetate from PEP was slightly varied, while the flux for citrate biosynthesis from oxaloacetate and acetyl-CoA was increased by 46.67%. Therefore, the increase of carbon flux in the TCA pathway was probably achieved by directing the metabolites flux into citrate biosynthesis from the pool of PEP, pyruvate, and the acetyl-CoA.
With CaCO3 addition, the relative changes in transcription levels of 15 genes involved in TCA cycle were determined by qRT-PCR. As shown in Figure 7, the transcriptional level of 7 genes including gltA encoding CS, acnA encoding aconitase (ACO) isoenzyme, icdA encoding isocitrate dehydrogenase (ICDH), sucC encoding succinyl-CoA synthetase (SCS) isoenzyme, sdhC/sdhD encoding succinate dehydrogenase (SDH) isoenzymes, and fumB encoding fumarase (FH) isoenzyme were higher than those of the control (without CaCO3 addition), indicating an up-regulated expression of these genes. By contrast, the expressions of 6 genes including acnB encoding ACO isoenzyme, sucB encoding α-ketoglutarate dehydrogenase (KGDH) isoenzyme, sdhA/sdhB encoding SDH isoenzymes, fumA encoding FH isoenzyme, and mdh encoding malate dehydrogenase (MDH) were down-regulated. While, there were no significant changes in the relative transcriptional quantitation of sucA encoding KGDH isoenzyme and sucD encoding SCS isoenzyme. Although the transcriptional responses of these 15 genes to CaCO3 supplement were different, it could be certain that, the expression of CS, ICDH, and SCS were enhanced due to the presence of CaCO3.
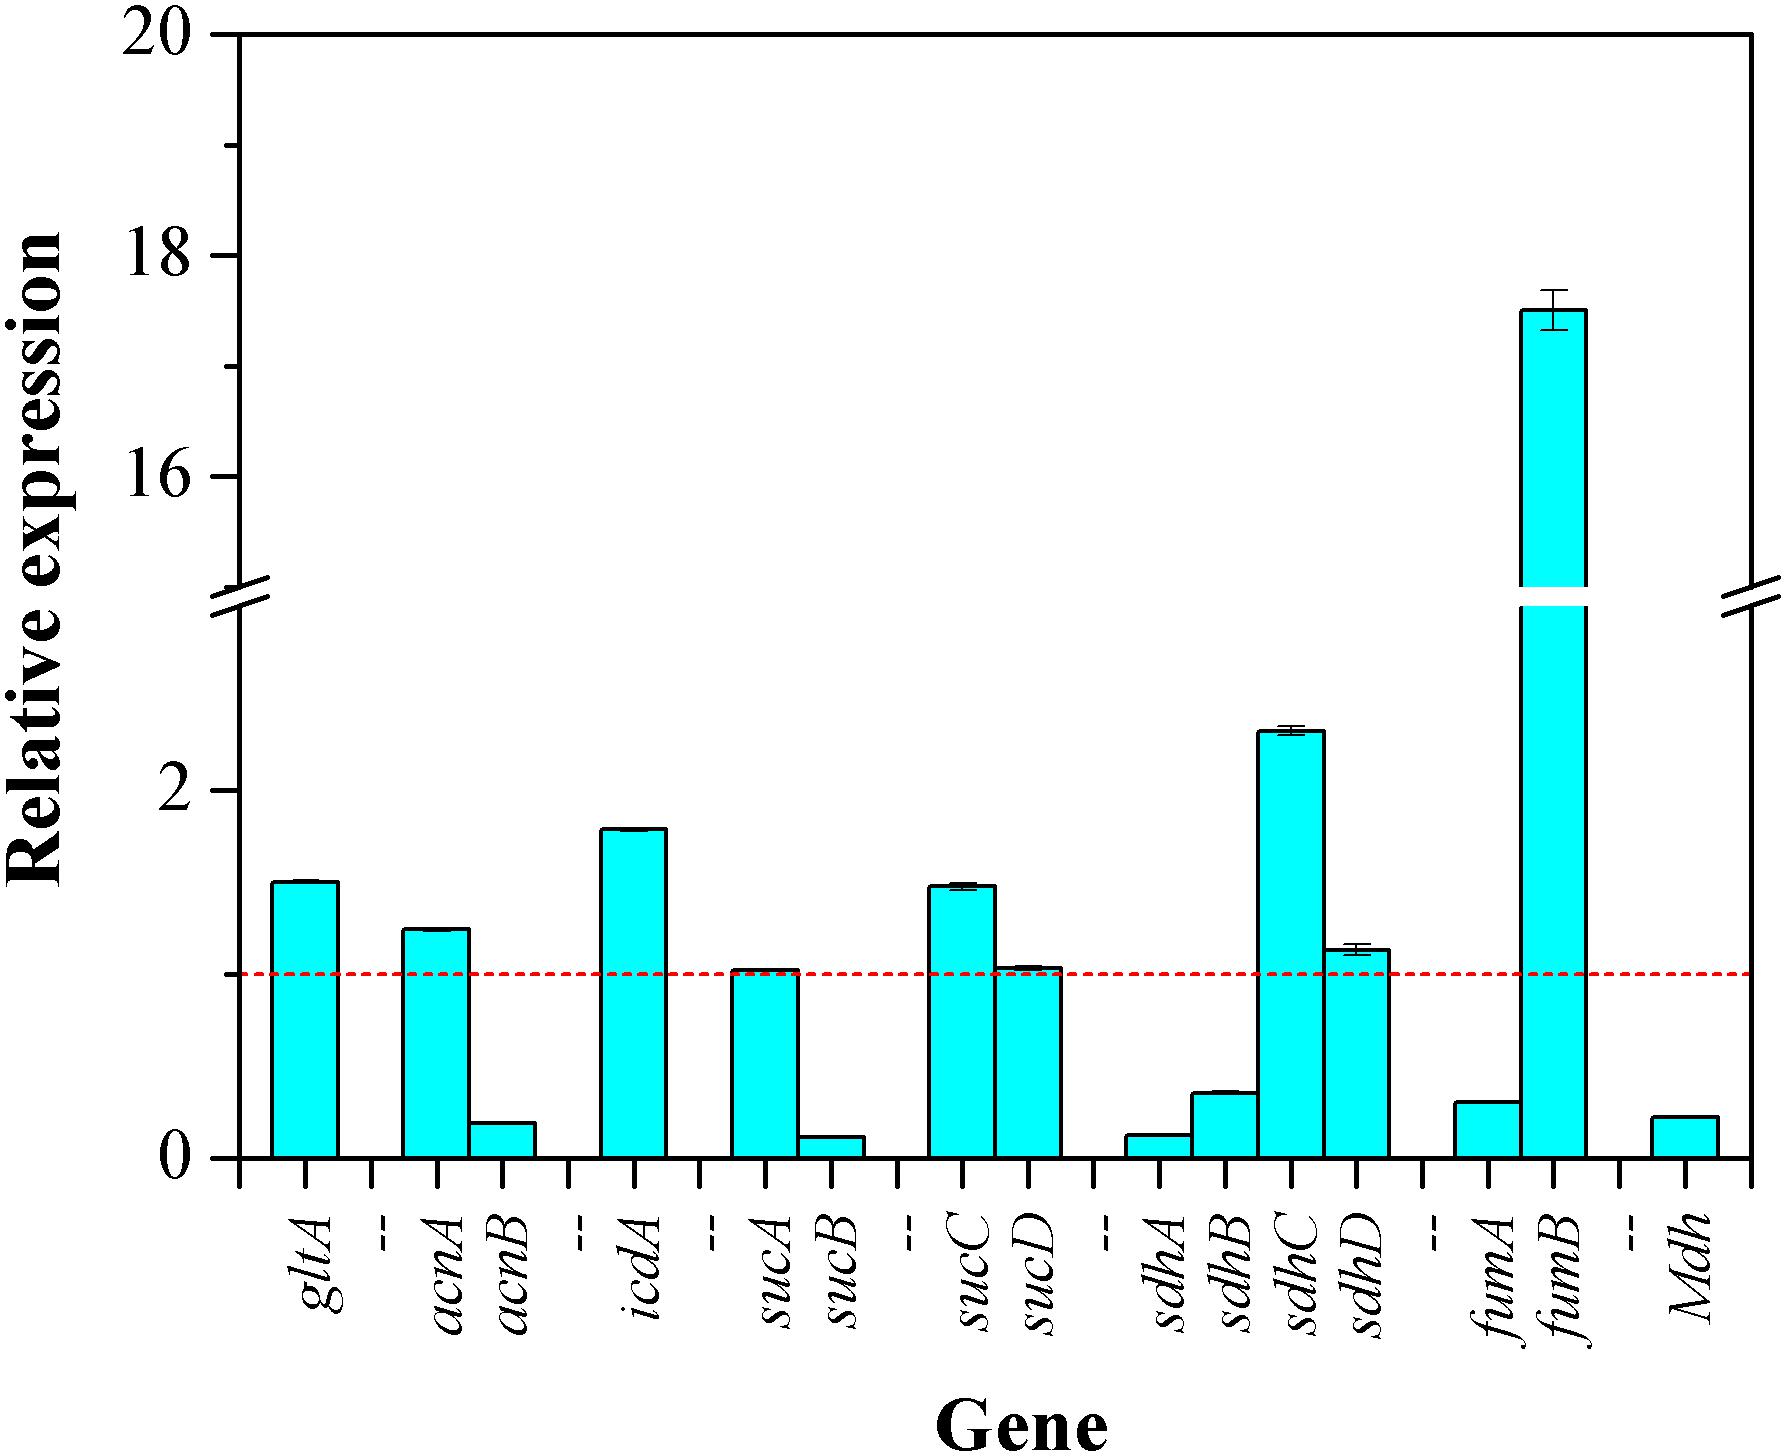
Figure 7. The transcriptional responses of the genes involved in TCA cycle to CaCO3 addition. The dashed line represented the relative fold change of gene expression of in the control (the value is 1.0).
To evaluate the effect of Ca2+ on intracellular CS activity during L-Met biosynthesis, CS specific activity was monitored in cell-free crude extract by means of DTNB colorimetric assay method. As illustrated in Figure 8, the activation of CS by Ca2+ before 15 h was not observed. However, the specific activity of CS was much higher than that of the control after 15 h, especially during 22–48 h. The increase in CS activity was allowed for perturbation of the acetyl-CoA branch point with enhanced TCA influx in the presence of CaCO3.
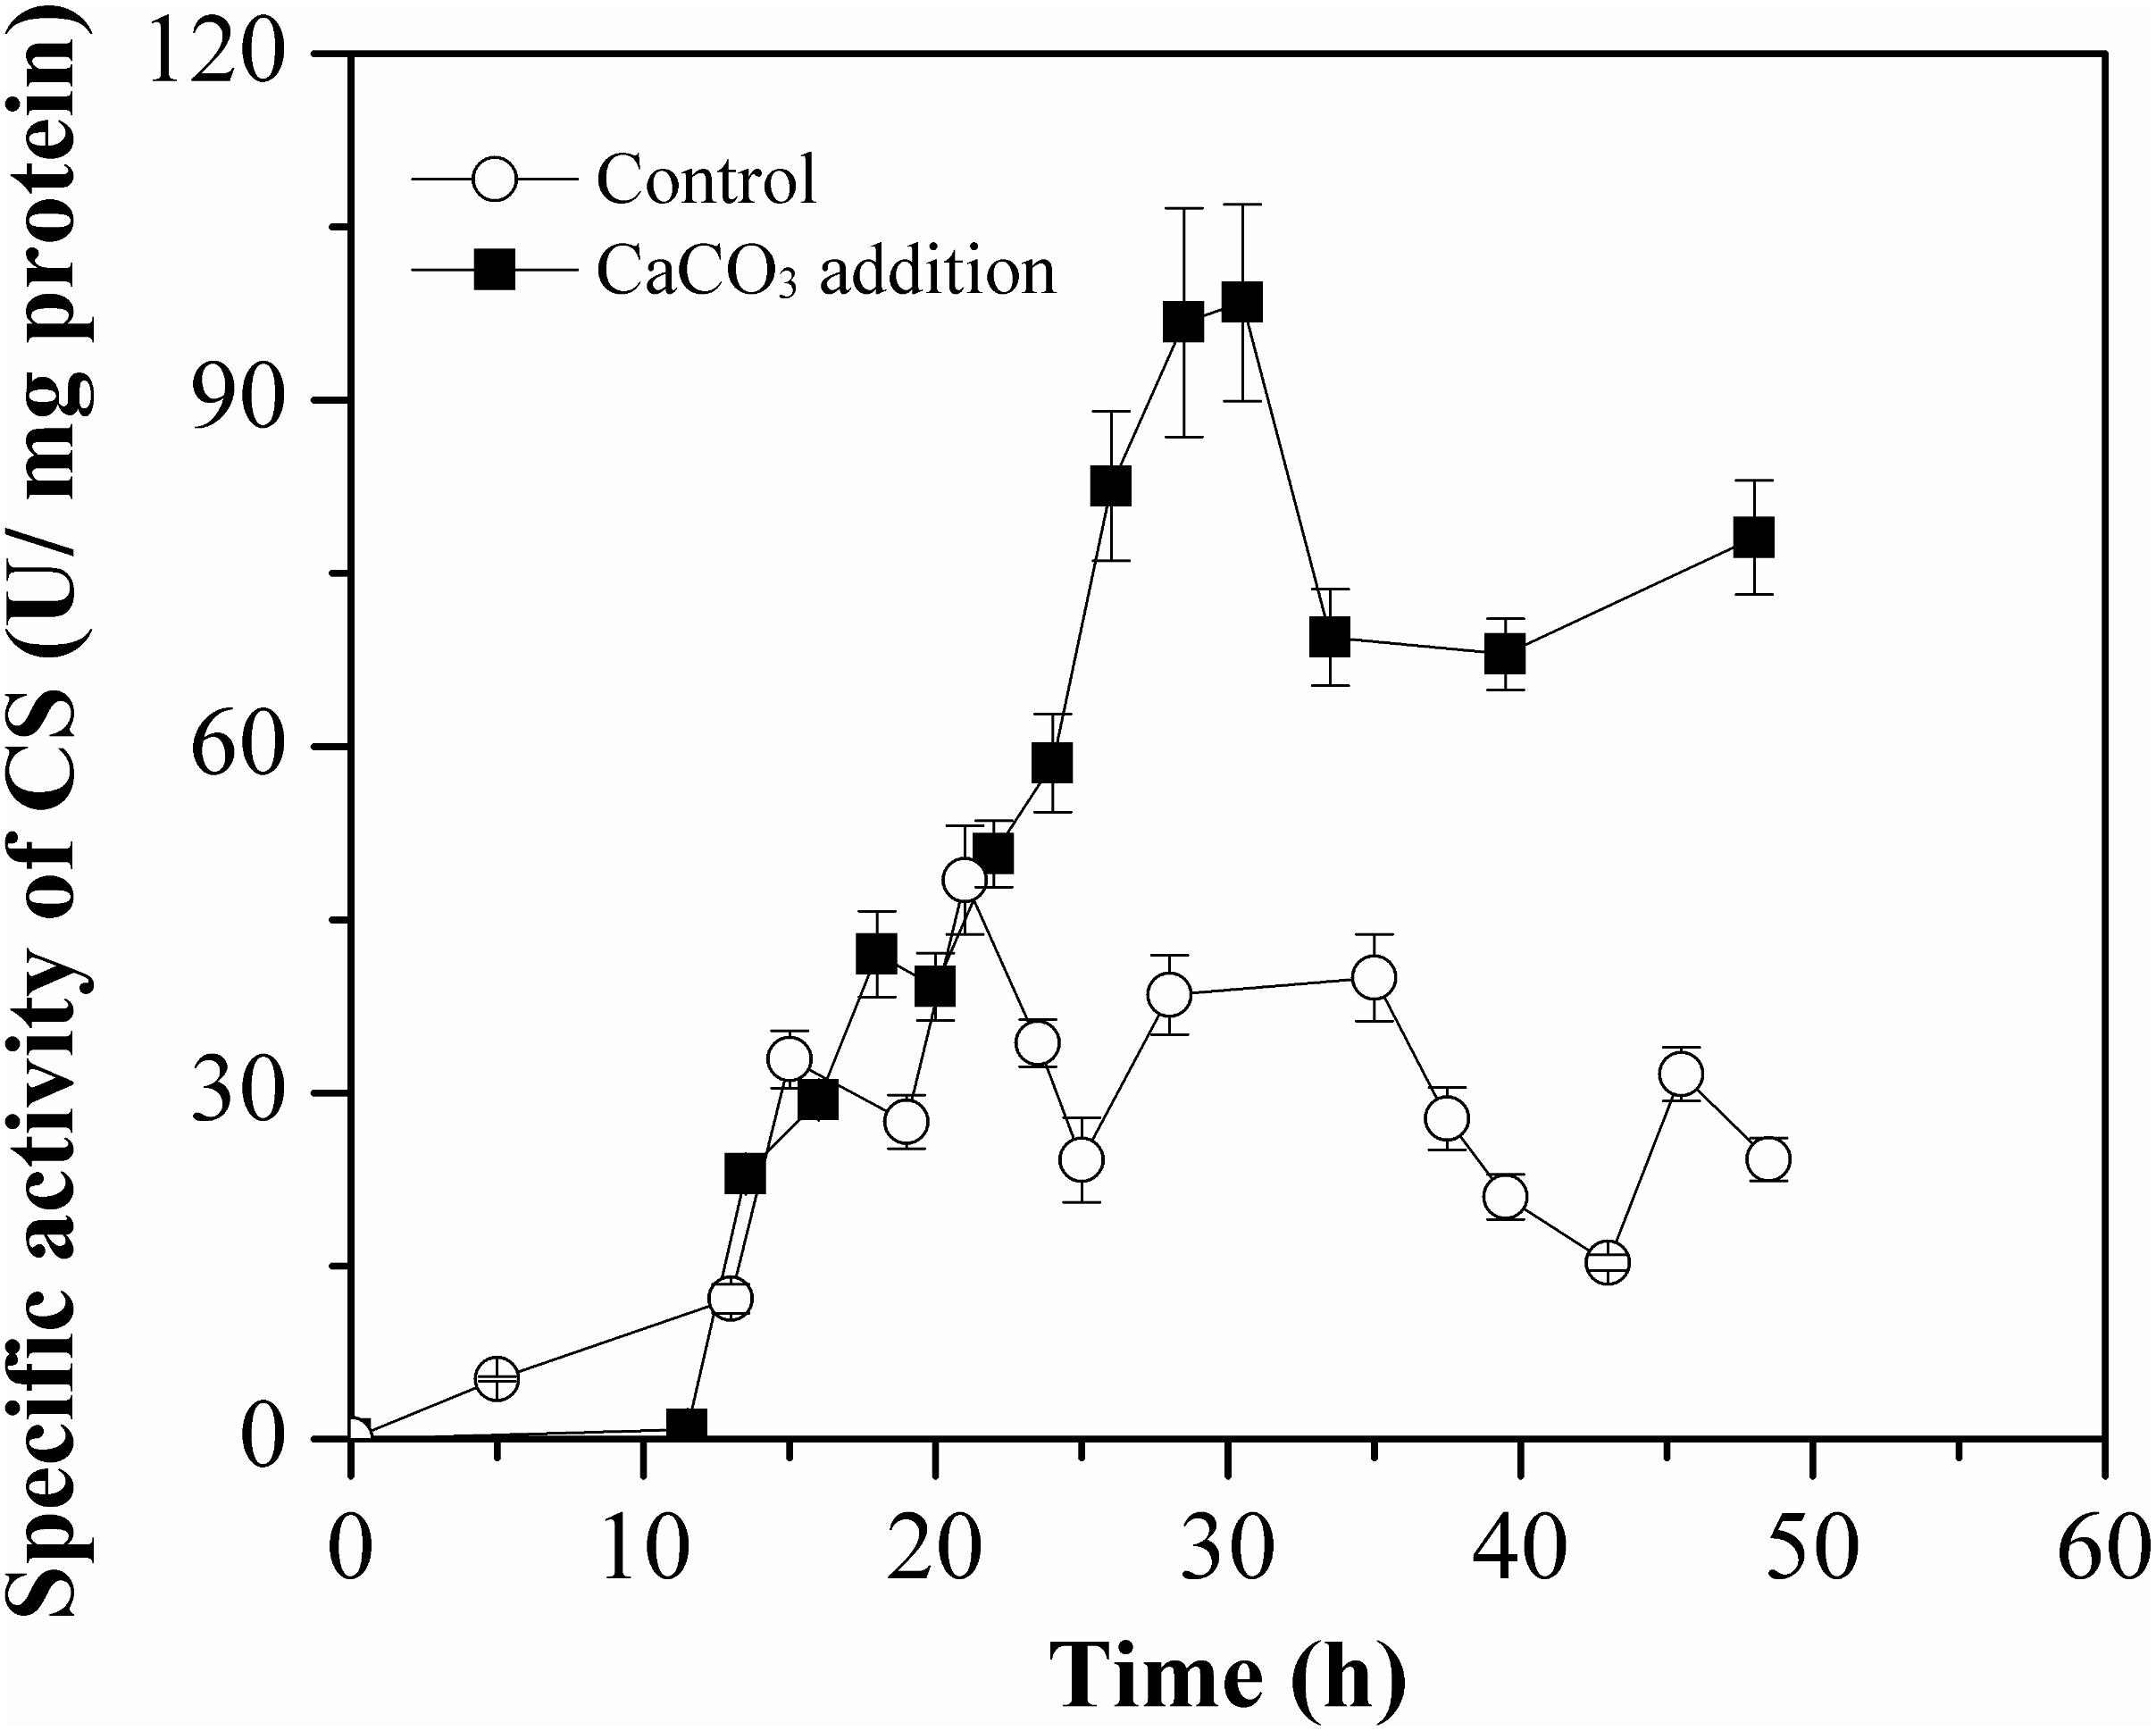
Figure 8. Specific activities of citrate synthase (CS) of E. coli W3110-BL during growth in the batch cultivation with or without CaCO3 addition. The CS activity was measured in crude cell extracts and all measurements were performed in triplicate.
The results indicated that, CaCO3 addition could direct more carbon to participate in L-Met biosynthesis, through fluctuation of the carbon balance in some essential metabolic pathways, particularly in the TCA cycle. CS, responsible for the entry reaction of a two-carbon unit into the TCA cycle, was thus considered to be a promising metabolic control node for L-Met overproduction.
The Effect of CaCO3 Addition on ATP and Cofactor Metabolism
The formation and consumption of ATP, NADH, NADPH, and FADH2 in the related biochemical pathways was estimated and presented in Figure 9. ATP was mainly produced through glycolysis, TCA cycle, transport reactions pathways, and oxidative phosphorylation; and it was consumed by amino acid synthesis and biomass formation. The ATP formation in the presence of CaCO3 was obviously improved compared with the condition of CaCO3 absence. ATP was generated at a relative high level, particularly in the oxidative phosphorylation pathway. Therefore, CaCO3 addition could provide more energy for L-Met biosynthesis.
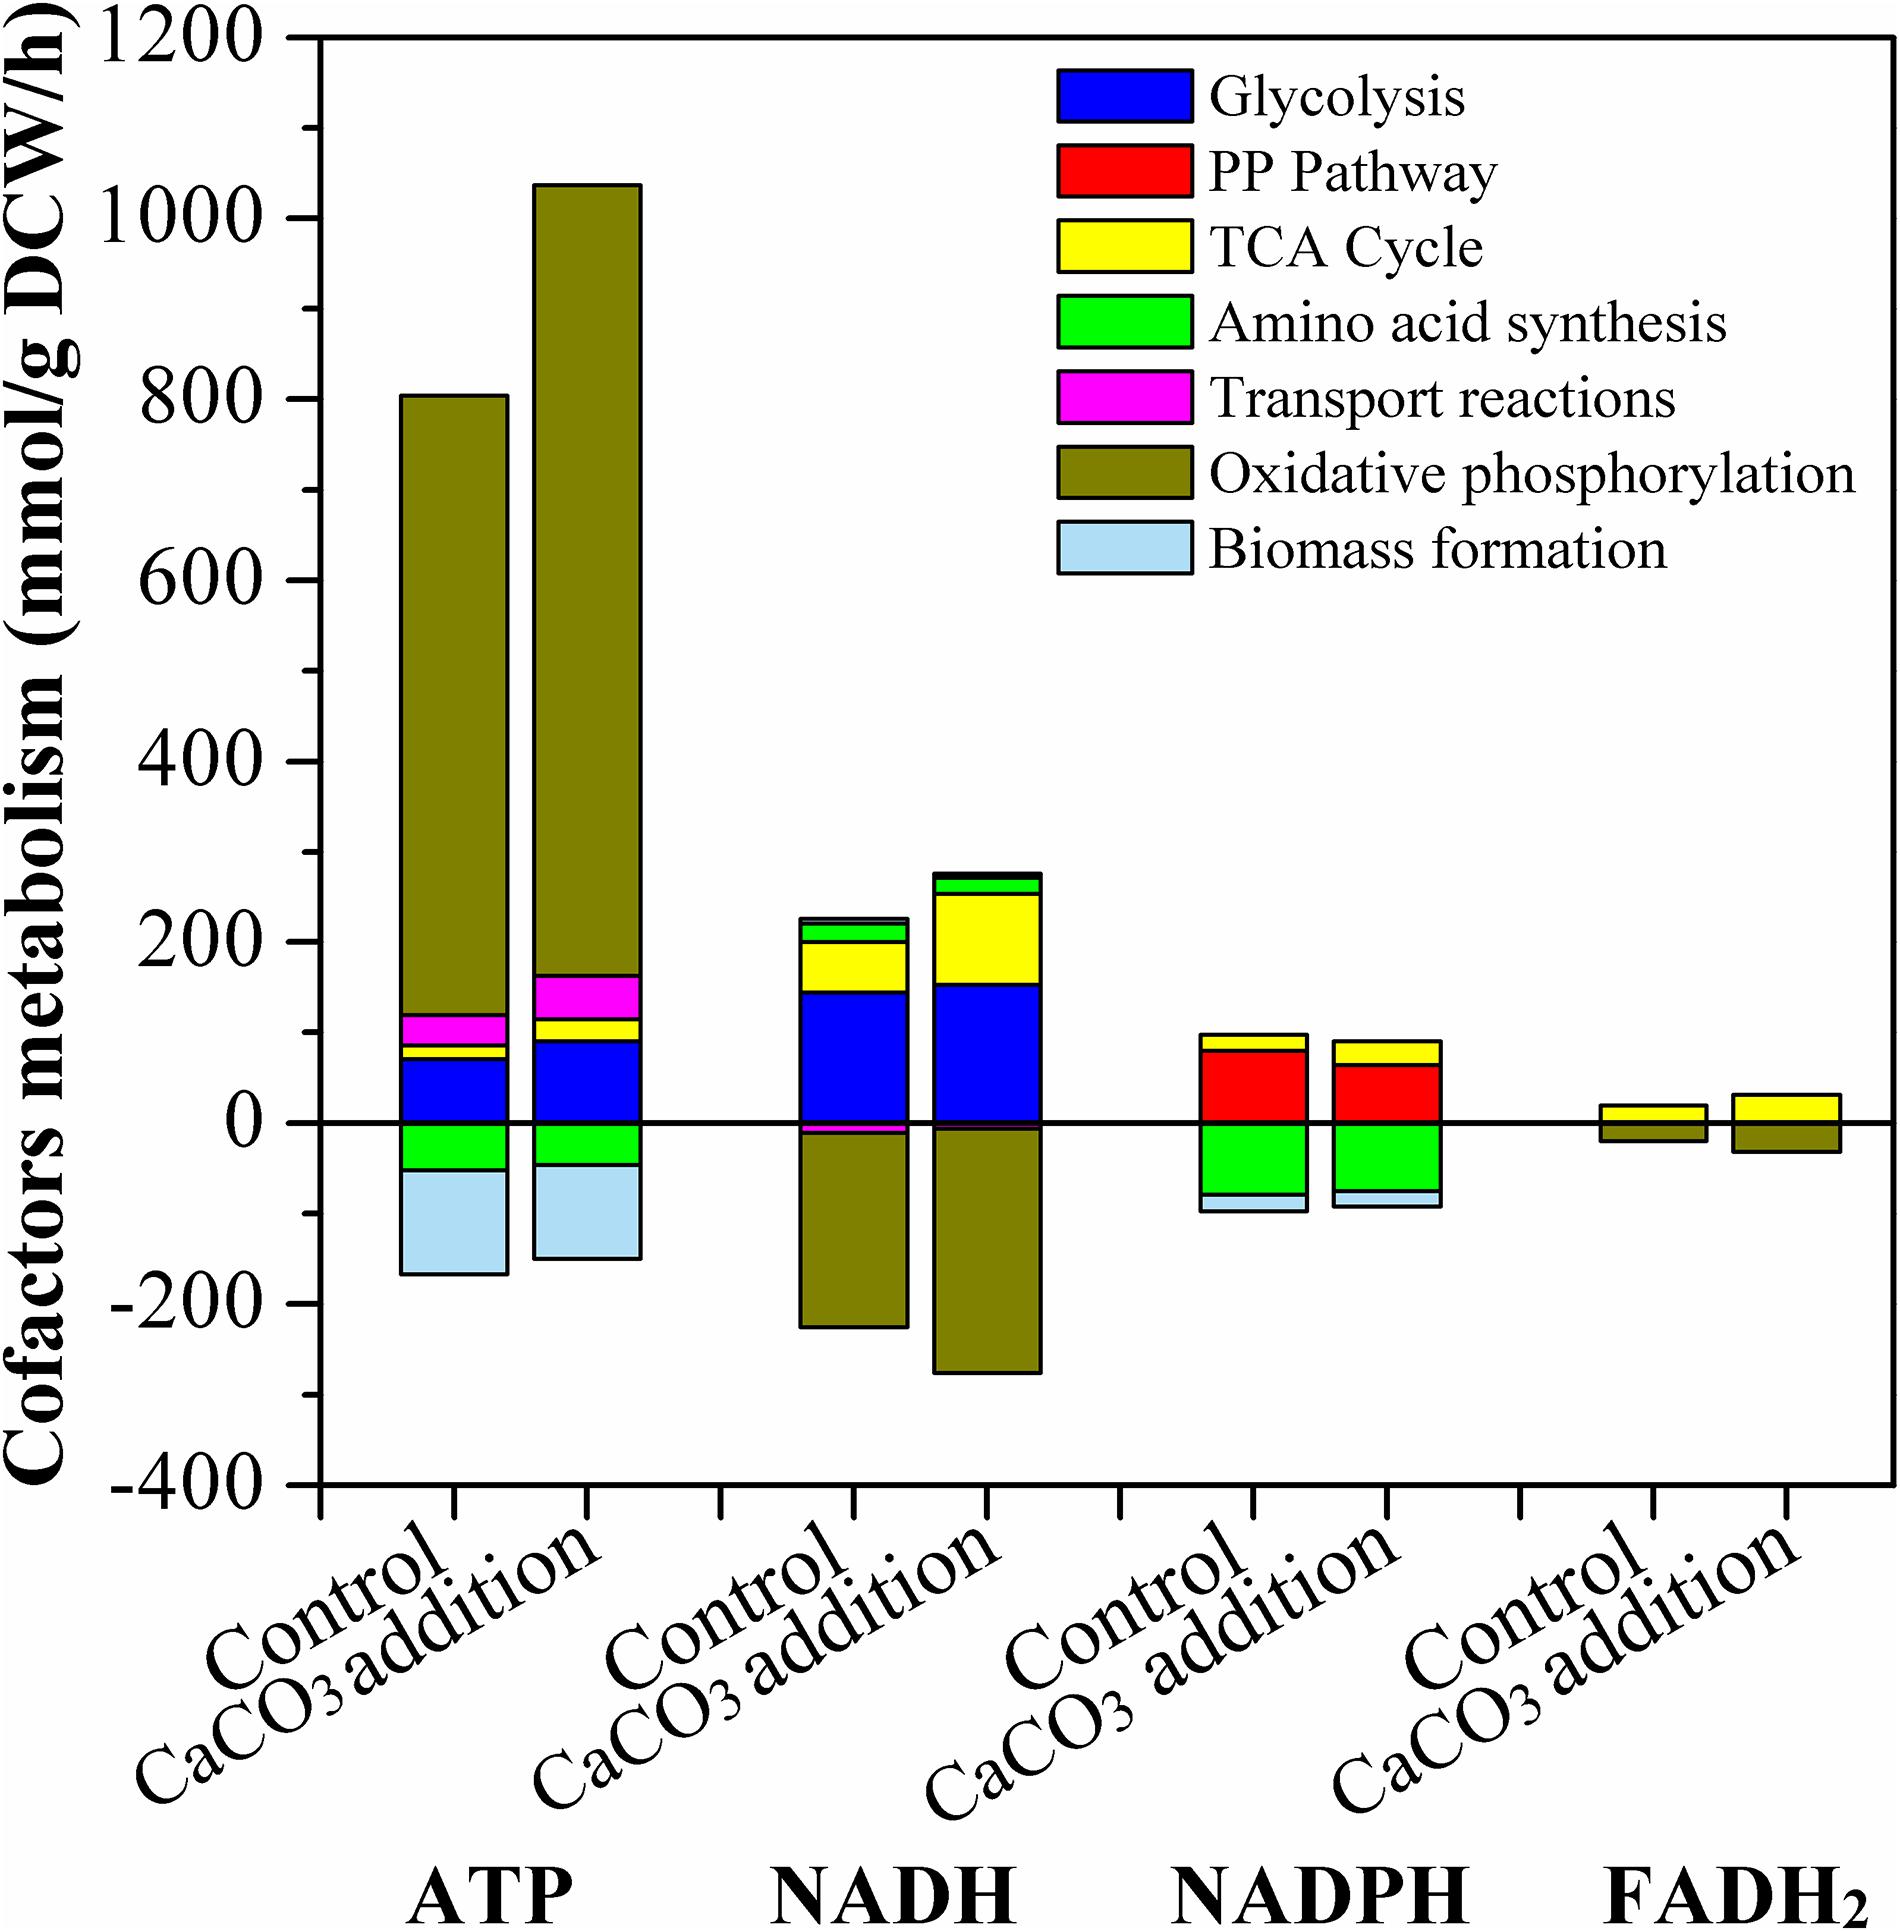
Figure 9. Estimated production and consumption of ATP, NADH, NADPH, and FADH2 by the E. coli W3110-BL without or with CaCO3 addition. All data represent the average value of three estimation. For clarity, the error bars were not shown. The hydrolysis of ATP to ADP was not included in this figure.
The major pathway of NADPH supply included PP pathway and TCA cycle, and NADPH was mainly consumed by amino acid synthesis and biomass formation. Different from NADPH, NADH was synthesized through glycolysis and TCA cycle, and oxidative phosphorylation was its dominant consumption pathway. The main source of FADH2 was TCA cycle and it was solely used for oxidative phosphorylation. These results were in good agreement with those of other studies (Kind et al., 2013; He et al., 2014). As Figure 9 indicated, Ca2+ could regulate the intracellular cofactor levels, through increasing the generation of NADPH, NADH and FADH2 in TCA cycle, or increasing the consumption of NADH and FADH2 in oxidative phosphorylation.
NADH, FADH2, and NADPH are the key cofactors (or coenzymes) in the cellular metabolic network. NADH and FADH2 function as electron carriers and participate in almost all oxidation-reduction reactions. They play crucial roles in cellular energy generation in the living cells. Generally, the ATP yielded during direct glucose metabolism is very limited, while both NADH and FADH2 involved in the process of cellular respiration can help in producing more ATP through electron transfer and oxidative phosphorylation reaction. NADPH usually acts as a hydrogen donor to participate in various metabolic reactions (Kind et al., 2013); Besides, it affects numerous enzymatic activities and endogenous concentrations of regulators in many chemical reactions (Xu et al., 2018), such as the synthesis pathway of lipids, fatty acids, and nucleotides. Therefore, the level of cofactors NADH, FADH2, and NADPH are essential to amino acid biosynthesis via microbial fermentation (Singh et al., 2007). It has been proved that, increasing the supply of NADPH has a positive effect on the fermentative production of amino acids (Sharp, 2013; Wang et al., 2013). Furthermore, based on regulation of the intracellular cofactor level, optimization of cellular physiological and metabolic functions to maximize the carbon flux distribution and energy supply for the biosynthetic pathway of several kinds of amino acids has been achieved (Bartek et al., 2010; Yin et al., 2014; Xu et al., 2018).
As a summary, exogenous addition of CaCO3 could regulate the oxidative phosphorylation pathway to produce more ATP. Additionally, the intracellular cofactors concentration also varied due to CaCO3 existence. These results suggested that the improvement of L-Met biosynthesis was correlated with ATP and cofactor metabolism, and was likely due to the collaborative contribution of these effects. It provided an important reference in metabolic engineering to channel more energy flux into the synthesis of target amino acid.
Conclusion
The positive impact of Ca2+ on L-Met biosynthesis of the engineered E. coli W3110-BL was demonstrated through comparative assay of different modes of batch fermentation with or without Ca2+ addition into the fermentation medium. Intracellular metabolic flux distribution and the metabolism of ATP and cofactors in response to Ca2+ existence at the late logarithmic growth phase (19 h) were estimated by FBA. The results indicated that addition of CaCO3 (30 g/L) into the fermentation medium resulted in an increased metabolic flux in TCA cycle and a relatively high level of ATP and cofactors generation, which may collaboratively contribute to the enhancement of L-Met biosynthesis. This study lay important fundament for further modification of the potential metabolic control node to channel more metabolic flux into L-Met over-production.
Data Availability Statement
The raw data supporting the conclusions of this article will be made available by the authors, without undue reservation, to any qualified researcher.
Author Contributions
H-YZ, W-JW, KN, Z-QL, and Y-GZ participated in designing of work. The analysis and interpretation of experimental the data was jointly conducted by all authors. H-YZ and W-JW prepared the manuscript with the help of Z-QL. W-JW, Y-YX, and BZ performed the experiments.
Funding
This work was financially supported by the National Key Research and Development Program of China (2018YFA0901400) and the National Natural Science Foundation of China (Nos. 31971342 and 31500031).
Conflict of Interest
The authors declare that the research was conducted in the absence of any commercial or financial relationships that could be construed as a potential conflict of interest.
Supplementary Material
The Supplementary Material for this article can be found online at: https://www.frontiersin.org/articles/10.3389/fbioe.2020.00300/full#supplementary-material
References
Anakwenze, V. N., Ezemba, C. C., and Ekwealor, I. A. (2014). Optimization of fermentation conditions of Bacillus thuringiensis EC1 for enhanced methionine production. Adv. Microbiol. 4, 344–352. doi: 10.4236/aim.2014.47041
Ando, D., and Garcia Martin, H. (2018). “Two-scale 13C metabolic flux analysis for metabolic engineering,” in Synthetic Metabolic Pathways, 1st Edn, eds M. K. Jensen and J. D. Keasling (New York, NY: Humana Press), 333–352. doi: 10.1007/978-1-4939-7295-1_21
Armingol, E., Tobar, E., and Cabrera, R. (2018). Understanding the impact of the cofactor swapping of isocitrate dehydrogenase over the growth phenotype of Escherichia coli on acetate by using constraint-based modeling. PLoS One 13:e0196182. doi: 10.1371/journal.pone.0196182
Bartek, T., Blombach, B., Zonnchen, E., Makus, P., Lang, S., Eikmanns, B. J., et al. (2010). Importance of NADPH supply for improved L-valine formation in Corynebacterium glutamicum. Biotechnol. Prog. 26, 361–371. doi: 10.1002/btpr.345
Bradford, M. M. (1976). A rapid and sensitive method for the quantitation of microgram quantities of protein utilizing the principle of protein-dye binding. Analyt. Biochem. 72, 248–254. doi: 10.1006/abio.1976.9999
Cheng, F., Chen, H., Lei, N., Zhang, M., Wan, H., and Shu, G. (2019). Effect of prebiotics, inorganic salts and amino acids for cell envelope proteinase production from Lactobacillus plantarum LP69. Acta Sci. Polon. Technol. Aliment. 18, 269–278. doi: 10.17306/J.AFS.0656
Converti, A., Perego, P., and Del Borghi, M. (2003). Effect of specific oxygen uptake rate on Enterobacter aerogenes energetics: carbon and reduction degree balances in batch cultivations. Biotechnol. Bioeng. 82, 370–377. doi: 10.1002/bit.10570
Egnatchik, R. A., Leamy, A. K., Jacobson, D. A., Shiota, M., and Young, J. D. (2014). ER calcium release promotes mitochondrial dysfunction and hepatic cell lipotoxicity in response to palmitate overload. Mol. Metab. 3, 544–553. doi: 10.1016/j.molmet.2014.05.004
He, L., Xiao, Y., Gebreselassie, N., Zhang, F., Antoniewiez, M. R., Tang, Y. J., et al. (2014). Central metabolic responses to the overproduction of fatty acids in Escherichia coli based on 13C-metabolic flux analysis. Biotechnol. Bioeng. 111, 575–585. doi: 10.1002/bit.25124
Hon, M. K., Mohamad, M. S., Mohamed Salleh, A. H., Choon, Y. W., Mohd Daud, K., Remli, M. A., et al. (2019). Identifying a gene knockout strategy using a hybrid of simple constrained artificial bee colony algorithm and flux balance analysis to enhance the production of succinate and lactate in Escherichia coli. Interdiscipl. Sci. Comput. Life Sci. 11, 33–44. doi: 10.1007/s12539-019-00324-z
Hong, S. H., and Lee, S. Y. (2001). Metabolic flux analysis for succinic acid production by recombinant Escherichia coli with amplified malic enzyme activity. Biotechnol. Bioeng. 74, 89–95. doi: 10.1002/bit.1098
Huang, B., Qin, P., Xu, Z., Zhu, R., and Meng, Y. (2011). Effects of CaCl2 on viscosity of culture broth, and on activities of enzymes around the 2-oxoglutarate branch, in Bacillus subtilis CGMCC 2108 producing poly-(γ-glutamic acid). Bioresour. Technol. 102, 3595–3598. doi: 10.1016/j.biortech.2010.10.073
Huang, J. F., Liu, Z. Q., Jin, L. Q., Tang, X. L., Shen, Z. Y., Yin, H. H., et al. (2017). Metabolic engineering of Escherichia coli for microbial production of L-methionine. Biotechnol. Bioeng. 114, 843–851. doi: 10.1002/bit.26198
Huang, J. F., Shen, Z. Y., Mao, Q. L., Zhang, X. M., Zhang, B., Wu, J. S., et al. (2018). Systematic analysis of bottlenecks in a multibranched and multilevel regulated pathway: the molecular fundamentals of L-methionine biosynthesis in Escherichia coli. ACS Synth. Biol. 7, 2577–2589. doi: 10.1021/acssynbio.8b00249
Jacob, J., Rajendran, R. U., Priya, S. H., Purushothaman, J., and Saraswathy Amma, D. K. B. N. (2017). Enhanced antibacterial metabolite production through the application of statistical methodologies by a Streptomyces nogalater NIIST A30 isolated from western ghats forest soil. PLoS One 12:e0175919. doi: 10.1371/journal.pone.0175919
Kaleta, C., Schäuble, S., Rinas, U., and Schuster, S. (2013). Metabolic costs of amino acid and protein production in Escherichia coli. Biotechnol. J. 8, 1105–1114. doi: 10.1002/biot.201200267
Kase, H., and Nakayama, K. (1975). L-Methionine production by methionine analog-resistant mutants of Corynebacterium glutamicum. Agric. Biol. Chem. 39, 153–160. doi: 10.1271/bbb1961.39.153
Kind, S., Becker, J., and Wittmann, C. (2013). Increased lysine production by flux coupling of the tricarboxylic acid cycle and the lysine biosynthetic pathway - Metabolic engineering of the availability of succinyl-CoA in Corynebacterium glutamicum. Metab. Eng. 15, 184–195. doi: 10.1016/j.ymben.2012.07.005
Klamt, S., Muller, S., Regensburger, G., and Zanghellini, J. (2018). A mathematical framework for yield (vs. rate) optimization in constraint-based modeling and applications in metabolic engineering. Metab. Eng. 47, 153–169. doi: 10.1016/j.ymben.2018.02.001
Koffas, M., Roberge, C., Lee, K., and Stephanopoulos, G. (1999). Metabolic engineering. Ann. Rev. Biomed. Eng. 1, 535–557. doi: 10.1146/annurev.bioeng.1.1.535
Krömer, J. O., Wittmann, C., Schröder, H., and Heinzle, E. (2006). Metabolic pathway analysis for rational design of L-methionine production by Escherichia coli and Corynebacterium glutamicum. Metab. Eng. 8, 353–369. doi: 10.1016/j.ymben.2006.02.001
Kumar, D., Garg, S., Bisaria, V. S., Sreekrishnan, T. R., and Gomes, J. (2003). Production of methionine by a multi-analogue resistant mutant of Corynebacterium lilium. Process Biochem. 38, 1165–1171. doi: 10.1016/S0032-9592(02)00287-X
Li, X., Deng, Y., Yang, Y., Wei, Z., Cheng, J., Cao, L., et al. (2017). Fermentation process and metabolic flux of ethanol production from the detoxified hydrolyzate of cassava residue. Front. Microbiol. 8:1603. doi: 10.3389/fmicb.2017.01603
Liu, L., Li, Y., Zhu, Y., Du, G., and Chen, J. (2007). Redistribution of carbon flux in Torulopsis glabrata by altering vitamin and calcium level. Metab. Eng. 9, 21–29. doi: 10.1016/j.ymben.2006.07.007
Livak, K. J., and Schmittgen, T. D. (2001). Analysis of relative gene expression data using real-time quantitative PCR and the 2(-Delta Delta C(T)) Method. Methods 25, 402–408. doi: 10.1006/meth.2001.1262
Martinez-Monge, I., Albiol, J., Lecina, M., Liste-Calleja, L., Miret, J., Sola, C., et al. (2019). Metabolic flux balance analysis during lactate and glucose concomitant consumption in HEK293 cell cultures. Biotechnol. Bioeng. 116, 388–404. doi: 10.1002/bit.26858
Morales, Y., Bosque, G., Vehí, J., Picó, J., and Llaneras, F. (2016). PFA toolbox: a MATLAB tool for metabolic flux analysis. BMC Syst. Biol. 10:46. doi: 10.1186/s12918-016-0284-1
Noftsger, S., St-Pierre, N. R., and Sylvester, J. T. (2005). Determination of rumen degradability and ruminal effects of three sources of methionine in lactating cows. J. Dairy Sci. 88, 223–237. doi: 10.3168/jds.S0022-0302(05)72680-1
Oh, Y. K., Park, S., Seol, E. H., Kim, S. H., Kim, M. S., Hwang, J. W., et al. (2008). Carbon and energy balances of glucose fermentation with hydrogenproducing bacterium Citrobacter amalonaticus Y19. J. Microbiol. Biotechnol. 18, 532–538.
Oraei, M., Razavi, S. H., and Khodaiyan, F. (2018). Optimization of effective minerals on riboflavin production by Bacillus subtilis subsp. subtilis ATCC 6051 using statistical designs. Avicen. J. Med. Biotechnol. 10, 49–55.
Papp, B., and Simeonidis, E. (2007). Flux balance analysis and its applications. BMC Syst. Biol. 1:77. doi: 10.1186/1752-0509-1-S1-P77
Park, S. D., Lee, J. Y., Sim, S. Y., Kim, Y., and Lee, H. S. (2007). Characteristics of methionine production by an engineered Corynebacterium glutamicum strain. Metab. Eng. 9, 327–336. doi: 10.1016/j.ymben.2007.05.001
Pera, L. M., and Callieri, D. A. (1997). Influence of calcium on fungal growth, hyphal morphology and citric acid production in Aspergillus niger. Folia Microbiol. 42, 551–556. doi: 10.1007/bf02815463
Pera, L. M., and Callieri, D. A. (1999). Influence of calcium on fungal growth and citric acid production during fermentation of a sugarcane molasses-based medium by a strain of Aspergillus niger. World J. Microbiol. Biotechnol. 15, 647–649. doi: 10.1023/A:1008902724942
Quandt, E. M., Gollihar, J., Blount, Z. D., Ellington, A. D., Georgiou, G., and Barrick, J. E. (2015). Fine-tuning citrate synthase flux potentiates and refines metabolic innovation in the Lenski evolution experiment. eLife 4, e09696. doi: 10.7554/eLife.09696
Rawls, K. D., Dougherty, B. V., Blais, E. M., Stancliffe, E., Kolling, G. L., Vinnakota, K., et al. (2019). A simplified metabolic network reconstruction to promote understanding and development of flux balance analysis tools. Comput. Biol. Med. 105, 64–71. doi: 10.1016/j.compbiomed.2018.12.010
Robson, G. D., Wiebe, M. G., and Trinci, A. P. J. (1991). Involvement of Ca2+ in the regulation of hyphal extension and branching in Fusarium graminearum A 3/5. Exp. Mycol. 15, 263–272. doi: 10.1016/0147-5975(91)90028-C
Santos, V. E., Galdeano, C., Gomez, E., Alcon, A., and Garcia-Ochoa, F. (2006). Oxygen uptake rate measurements both by the dynamic method and during the process growth of Rhodococcus erythropolis IGTS8: modelling and difference in results. Biochem. Eng. J. 32, 198–204. doi: 10.1016/j.bej.2006.09.025
Sharp, J. (2013). Improved production of L-threonine in Escherichia coli by use of a DNA scaffold system. Appl. Environ. Microbiol. 79, 774–782. doi: 10.1128/AEM.02578-12
Singh, R., Mailloux, R. J., Puiseuxdao, S., and Appanna, V. D. (2007). Oxidative stress evokes a metabolic adaptation that favors increased NADPH synthesis and decreased NADH production in Pseudomonas fluorescens. J. Bacteriol. 189, 6665–6675. doi: 10.1128/JB.00555-07
Srere, P. A. (1969). [1] Citrate synthase: [EC 4.1.3.7. Citrate oxaloacetate-lyase (CoA-acetylating). Methods Enzymol. 13, 3–11.
Stephanopoulos, G., and Sinskey, A. J. (1993). Metabolic engineering — methodologies and future prospects. Trends Biotechnol. 11, 392–396. doi: 10.1016/0167-7799(93)90099-U
Themelis, D. G., Tzanavaras, P. D., Anthemidis, A. N., and Stratis, J. A. (1999). Direct, selective flow injection spectrophotometric determination of calcium in wines using methylthymol blue and an on-line cascade dilution system. Analyt. Chim. Acta 402, 259–266. doi: 10.1016/S0003-2670(99)00503-6
Tran, L. M., Rizk, M. L., and Liao, J. C. (2008). Ensemble modeling of metabolic networks. Biophys. J. 95, 5606–5617. doi: 10.1529/biophysj.108.135442
Usuda, Y., and Kurahashi, O. (2005). Effects of deregulation of methionine biosynthesis on methionine excretion in Escherichia coli. Appl. Environ. Microbiol. 71, 3228–3234. doi: 10.1128/AEM.71.6.3228-3234.2005
Vallino, J. J., and Stephanopoulos, G. (1993). Metabolic flux distributions in Corynebacterium glutamicum during growth and lysine overproduction. Biotechnol. Bioeng. 41, 633–646. doi: 10.1002/bit.260410606
Varma, A., and Palsson, B. O. (1994). Metabolic flux balancing: basic concepts, scientific and practical use. Nat. Biotechnol. 12, 994–998. doi: 10.1038/nbt1094-994
Wang, Y., San, K.-Y., and Bennett, G. N. (2013). Cofactor engineering for advancing chemical biotechnology. Curr. Opin. Biotechnol. 24, 994–999. doi: 10.1016/j.copbio.2013.03.022
Wiesenberger, G., Steinleitner, K., Malli, R., Graier, W. F., Vormann, J., Schweyen, R. J., et al. (2007). Mg2 + deprivation elicits rapid Ca2 + uptake and activates Ca2 +/calcineurin signaling in Saccharomyces cerevisiae. Eukaryot. Cell 6, 592–599. doi: 10.1128/ec.00382-06
Xin, X., and Wang, Y. (2007). Ultrastructural and intracellular chemical changes of a novel alophilic strain V430 of Staphylococcus saprophyticus under CaCl2 stress. Appl. Biochem. Biotechnol. 142, 298–306. doi: 10.1007/s12010-007-0038-z
Xu, J. Z., Yang, H. K., and Zhang, W. G. (2018). NADPH metabolism: a survey of its theoretical characteristics and manipulation strategies in amino acid biosynthesis. Crit. Rev. Biotechnol. 38, 1061–1076. doi: 10.1080/07388551.2018.1437387
Yin, L., Zhao, J., Cheng, C., Hu, X., and Wang, X. (2014). Enhancing the carbon flux and NADPH supply to increase L-isoleucine production in Corynebacterium glutamicum. Biotechnol. Bioprocess Eng. 19, 132–142. doi: 10.1007/s12257-013-0416-z
Zhao, X., Kasbi, M., Chen, J., Peres, S., and Jolicoeur, M. (2017). A dynamic metabolic flux analysis of ABE (acetone-butanol-ethanol) fermentation by Clostridium acetobutylicum ATCC 824, with riboflavin as a by-product. Biotechnol. Bioeng. 114, 2907–2919. doi: 10.1002/bit.26393
Zhou, H. Y., Wu, W. J., Niu, K., Xu, Y. Y., Liu, Z. Q., and Zheng, Y. G. (2019). Enhanced L-methionine production by genetically engineered Escherichia coli through fermentation optimization. 3 Biotech. 9:96. doi: 10.1007/s13205-019-1609-8
Keywords: L-methionine, metabolic flux, Escherichia coli, calcium carbonate, flux balance analysis
Citation: Zhou H-Y, Wu W-J, Xu Y-Y, Zhou B, Niu K, Liu Z-Q and Zheng Y-G (2020) Calcium Carbonate Addition Improves L-Methionine Biosynthesis by Metabolically Engineered Escherichia coli W3110-BL. Front. Bioeng. Biotechnol. 8:300. doi: 10.3389/fbioe.2020.00300
Received: 01 August 2019; Accepted: 20 March 2020;
Published: 24 April 2020.
Edited by:
Haifeng Zhao, South China University of Technology, ChinaReviewed by:
Zhenming Chi, Ocean University of China, ChinaYingping Zhuang, East China Normal University, China
Copyright © 2020 Zhou, Wu, Xu, Zhou, Niu, Liu and Zheng. This is an open-access article distributed under the terms of the Creative Commons Attribution License (CC BY). The use, distribution or reproduction in other forums is permitted, provided the original author(s) and the copyright owner(s) are credited and that the original publication in this journal is cited, in accordance with accepted academic practice. No use, distribution or reproduction is permitted which does not comply with these terms.
*Correspondence: Zhi-Qiang Liu, microliu@zjut.edu.cn