Combined effects of alkaline pH and high Ca concentration on root morphology, cell-wall polysaccharide concentrations and blueberry plant performance
 Guy Tamir
 Qilong Zeng2†
  Asher Bar-Tal
- 1Institute of Plant Sciences, The Volcani Institute, Agricultural Research Organization, Rishon LeZion, Israel
- 2Institute of Botany, Jiangsu Province and Chinese Academy of Sciences, Nanjing, China
- 3Institute of Plant Sciences and Genetics in Agriculture, The Robert H. Smith Faculty of Agriculture, Food and Environment, The Hebrew University of Jerusalem, Rehovot, Israel
- 4Institute of Soil, Water and Environmental Sciences, The Volcani Institute, Agricultural Research Organization, Rishon LeZion, Israel
The appropriate soil pH for blueberry production is <5.5. However, the exact factors involved in the retardation of blueberry growth at higher pH levels have not yet been completely identified. In this study, we examined the short- and long-term combined effects of pH level and Ca concentrations on root morphology and development in relation to blueberry plant performance. Southern highbush blueberry (Vaccinium corymbosum, cv. Windsor) plants were grown in solutions of pH 4.5 or 7.5 that contained 0, 5, 10, 50 or 100 mg L-1 of Ca. The dimensions of the epidermal cell walls of the roots and the levels of pectin and hemicellulose 1 and 2 in those cells were determined after 1 and 3 days. Concentrations of essential macro and micro-elements in the plant organs, chlorophyll concentrations in the leaves and whole-plant biomass production were measured after 12 weeks. The results demonstrate a rapid (3 days) negative response of root tips at pH 7.5 expressed as reduced dimensions and deformation of the epidermal cell walls. This response was accompanied by reduced concentrations of pectin and hemicellulose 1 in those cell walls. These negative effects of pH 7.5 were amplified by a 100 mg L-1 of Ca over the long term (12 weeks), where the concentrations of P and Ca on the epidermal cell of the root were increased. Additionally, the translocation of Mn from the root to the shoot was retarded. The negative effect of the pH level on roots development and on the Mn translocation were associated with significant reductions in chlorophyll concentrations and biomass production. The results presented in this study demonstrate, for the first time, the negative effect of the combination of slightly alkaline pH and a high Ca concentration on root development, which associated with retarding blueberry plants performance.
Highlights
● Alkaline pH elicits an intense negative response in root epidermal cells
● The negative response of the root to pH 7.5 is amplified by a high Ca concentration
● Ca and P accumulate on the surface of damaged roots at alkaline pH
● Translocation of Mn from the root to the leaf is retarded by alkaline pH
● Negative root responses were associated with decreased biomass production
1 Introduction
Blueberry is a calcifuge plant (i.e., mainly established on silicate soils; Haynes and Swift, 1985; Korcak, 1988). The optimal pH for the growth of northern highbush blueberry (Vaccinium corymbosum L., cv. Blueray) is 4.6 (Haynes and Swift, 1985). Recently, we showed that the growth of rabbiteye (V. virgatum Ait., cv. Titan) and Southern highbush (V. corymbosum L., cv. Sunshine Blue) cultivars decreases linearly as pH rises above 5.5 (Tamir et al., 2021a; Tamir et al., 2021b).
Several factors have been suggested to be associated with the retardation of blueberry growth under non-acidic soil conditions. It has been suggested that plant growth may be retarded due to deficiencies of microelements, mainly iron (Brown, 1978; Haynes and Swift, 1985; Poonnachit and Darnell, 2004; Darnell et al., 2015; Nunez et al., 2015). Recently, we demonstrated that Mn is the main element that is lacking in blueberry plants under alkaline pH conditions (Tamir et al., 2021a; Tamir et al., 2021b; Tamir et al., 2022). Other studies have suggested that blueberry plants favor an ammonium form of nitrogen (Cain, 1952; Merhaut and Darnell, 1995; Merhaut and Darnell, 1996; Claussen and Lenz, 1999; Poonnachit and Darnell, 2004; Darnell et al., 2015). However, the ammonium levels in soils at neutral and alkaline pH are quickly decrease due to the oxidization of ammonium to nitrate (Molina, 1985; Tamir et al., 2013).
There are also indications that CaCO3, which is a dominant component of alkaline soils, has a direct negative effect on blueberry growth. Blueberry plants grown in a medium without CaCO3 produced more biomass than those grown in a similar medium that contained CaCO3 (Claussen and Lenz, 1999). Similarly, Tamir et al. (2018) showed that the biomass production of rabbiteye blueberry (cv. Ochlockonee) plantlets grown in tissue-culture medium that contained 1% (w/w) CaCO3 was lower than that of plantlets grown in the same medium at the same pH (7.0), but without CaCO3.
In contrast to the above-described results, Schreiber and Nunez (2021), showed that the addition of low dose of CaCO3 to an acidic growing medium improved the performance of blueberry plants. Note that the positive effect of CaCO3 amendment was achieved in an acidic substrate with a very low buffer capacity.
The pH level is known to have a direct impact on plant root development. Barbez et al. (2017) reported that cell-wall acidification triggers cellular expansion in Arabidopsis thaliana. That expansion was highly correlated with a preceding increase in auxin signaling. In addition, Yu and Tang (2000) showed that a higher concentration of H+ in the apoplast is required to maintain optimal root cell-wall elongation in a calcifuge plant (lupin, Lupinus angustifolius L.), as compared to a non-calcifuge plant (pea, Pisum sativum L.). Wolf and Greiner (2012) showed that Ca2+-mediated cross-linking of pectin chains enhances the stability of the cell wall in the elongation zone. Koyama et al. (2001) and Graças et al. (2021) presented that, in low-pH-sensitive Arabidopsis thaliana plants, increasing the Ca concentration ameliorates the cell-wall disturbance under acidic pH condition. Graças et al. (2021) suggested that the counteracting effect of Ca+2 on H+ increases the stabilization of the pectin cross-linking in the cell wall and enhances cell-wall extension under the adverse condition of acidic pH. In contrast, Zhang et al., 2015 presented that, combination of a high concentration of Calcium (Ca) and alkaline pH strengthens the bridges between pectin chains to such level that inhibits cell-wall extension in seedlings of the alkaline pH-sensitive jack pine (Pinus banksiana) tree. Therefore, we assume that there are combined effect of calcium concentrations and the proton concentrations (pH) on root development. Our hypothesis is that one of the main factors that limit the growth of blueberries in calcareous soils is the retardation of the development of the roots by high pH combined with high concentration of Ca. Consequently, in the current study, we investigated the short- and long-term combined effects of pH level and wide range of Ca concentration on root morphology and development, in relation to the performance of blueberry plants.
2 Material and methods
2.1 Description of the experiment
We performed two separate experiments in a screen-house located on the campus of the Agricultural Research Organization, The Volcani Institute, Rishon LeZion, Israel (40 m above sea level). The screen-house was covered with 50-mesh white netting and black 40% shade netting (The actual shade at the time of the experiment was 64% of the outside light radiation). Growing blueberries in relatively warm climates with high radiation, such as the one in which this study was done (Mediterranean basin), is often conducted under shading screen in order to prevent damage to plant by too high radiation.
2.1.1 Experiment 1: Short-term combined effects of pH level and Ca concentration on root morphology and development
Well established southern highbush blueberry (Vaccinium corymbosum, cv. Windsor) plants (originated from tissue cultures) were transferred to 10.6-L containers filled with growth solution after their roots were washed with water to remove the residual growth medium {mixture of peat/coconut coir/polystyrene (33/33/33% by vol.}. The growth solution contained 30 mg L−1 nitrogen (N, 80% N-NH4+/total N), 10 mg L−1 phosphorous (P), 30 mg L−1 potassium (K), 10 mg L−1 Ca and 10 mg L−1 magnesium (Mg) and 53 mg L-1 S. The salts included in the growth solution were (NH4)2SO4, KNO3, KH2PO4, K2SO4, CaCl2 and MgSO4. The concentrations of the microelements (chelated with EDTA) were as follows: 1 mg L−1 iron (Fe), 1 mg L−1 manganese (Mn), 0.25 mg L−1 zinc (Zn), 0.045 mg L−1 copper (Cu) and 0.013 mg L−1 molybdenum (Mo). In addition, 1.2 mg L−1 (= 5% of N-NH4+ concentration) of the nitrification inhibitor DMPP (3,4-dimethylpyrazole phosphate; Wacker Chemie AG, Burghausen, Germany) were added. The growth solution was adjusted to pH 4.5 using sulfuric acid (50%) and prepared with distilled water (electrical conductivity < 80 µS m-1). For this stage, the plants were positioned in a 3-cm-thick Styrofoam tray, which floated on the solution surface. An air pump (RESUN LP100, Beijing, China) was used to inject atmospheric air into the bottom of each container at a flow rate of 3.5 L min-1. During this stage, the pH of the growth solution was monitored every 2 days using a pH electrode (FC 200b; Hanna Instruments, Woonsocket, RI, USA) and, if necessary, corrected with sulfuric acid (50%) or 10 mol L-1 NaOH. In addition, the growth solution was replaced once a week.
After 12 weeks in adaptation of plant to the growth solution, the established plants were transferred to 1-L glass bottles that were covered with aluminum foil and filled with growth solutions with different pH levels and Ca concentrations. The treatments included two levels of pH (4.5 or 7.5) combined with two concentrations of Ca (10 or 100 mg L-1). We chose these two levels of pH based on our previous works (Tamir et al., 2021a; Tamir et al., 2021b; Tamir et al., 2022) which showed optimal biomass production of blueberries at pH 5.5 or maximum damage to plant biomass production at pH 7.0 and higher. The treatments of Ca concentration were chosen based on the Ca concentrations that characterize alkaline or neutral pH in different soils (>100 mg L-1, Bar-Tal et al., 1991; Tyler and Olsson, 2001; Erner et al., 2017) or a minimal concentration (10 mg L-1) which will prevent inhibition to the biomass production as a results of deficiency of this element. The rational for using only two widely differing concentrations was to emphasize the short-term effect of this element on root development. The concentrations of all the other nutrients in the growth solution (except Ca) were identical to those presented above. Each glass bottle contained one plant as a replicate and each treatment included three different bottles as three replicates, overall 24 plants were tested in this short-term experiment. Atmospheric air was injected into the bottom of each bottle using the same pump described above. On Days 1 or 3 after the transfer, root-tip sections (1 cm in length) were excised for the analysis of cell-wall polysaccharide content and microscopic observation and measurements.
2.1.2 Experiment 2: Long-term combined effects of pH level and Ca concentration on root development and morphology, biomass production and mineral concentrations
Well established southern highbush blueberry (Vaccinium corymbosum, cv. Windsor) plants (originated from tissue cultures) were transferred to 10.6-L containers filled with growth solution after their roots were washed with water to remove the residual growth medium {mixture of peat/coconut coir/polystyrene (33/33/33% by vol.}. For this experiment, two plants were positioned in a 3-cm-thick Styrofoam tray, which floated on the solution surface in each container. The treatments included two levels of pH (4.5 or 7.5) combined with five concentrations of Ca (0, 5, 10, 50 or 100 mg L-1) in the growth solution, overall 80 plants were tested during this long-term experiment. The growth solutions were prepared with distilled water (electrical conductivity< 80 µS m-1). The pH levels were adjusted with diluted sulfuric acid (50%) or 10 mol L-1 NaOH. The Ca concentrations were adjusted using CaCl2 salt (Sigma-Aldrich, St. Louis, MO, USA). The growth solution contained 30 mg L−1 N (80% N-NH4+/total N), 10 mg L−1 P, 30 mg L−1 K, 10 mg L−1 Mg and 53 mg L-1 S. The salts included in the growth solution were (NH4)2SO4, KNO3, KH2PO4, K2SO4 and MgSO4. The concentrations of micronutrients (chelated with EDTA) were as follows: 1 mg L−1 Fe, 1 mg L−1 Mn, 0.25 mg L−1 Zn, 0.045 mg L−1 Cu and 0.013 mg L−1 Mo. In addition, 1.2 mg L−1 (= 5% of N-NH4+ concentration) of the nitrification inhibitor DMPP (3,4-dimethylpyrazole phosphate; Wacker Chemie AG) were added to each of the treatments. Tricine {N-[tris(hydroxymethyl)methyl]glycine; Sigma-Aldrich} at 0.36 mg L−1 was added to the pH 7.5 treatment only. An air pump (RESUN LP100) was used to inject atmospheric air into the bottom of each container at a flow rate of 3.5 L min-1. During the experiment, the pH of the growth solution was monitored every 2 days using a pH electrode (FC 200b; Hanna Instruments) and, if necessary, corrected with sulfuric acid (50%) or 10 mol L-1 NaOH. In addition, the growth solution was replaced once a week. The experiment was arranged in four randomized blocks. Each replicate contained two plants.
2.2 Plant measurements and analyses
2.2.1 Experiment 1: Short-term effects of pH and Ca concentration on the root-tip cell walls
2.2.1.1 Extraction and analysis of cell-wall polysaccharides
The levels of pectin and hemicellulose 1 and 2 in the root epidermal cell walls were determined according to the following procedure. One-cm sections of the root tip were excised and subjected to cell-wall extraction, as described by Zhong and Lauchli (1993). Briefly, the excised roots were ground in liquid N with a mortar and pestle, and then transferred to 15 mL ice-cold 75% ethanol. The mixture was then re-suspended using a vortex and incubated on ice for 20 min. Then, the mixture was centrifuged at 4000 rpm for 10 min at 4°C. The supernatant was removed and the residue was washed consecutively with acetone (99.5%), absolute methanol (99.8%), chloroform (99%) and pure methanol (99.8%), for 20 min each. The washed residues were freeze-dried and stored as cell-wall material at -20°C until use. About 3 mg of cell-wall material were used for polysaccharide extraction, using the method described by Wang et al. (2015) and Sun et al. (2016). The pectin fraction was extracted twice with 1 mL boiling water for 1 h and the supernatants were pooled after centrifugation at 13200 rpm for 10 min. The residue was subsequently subjected to triple extraction with 4% KOH containing 0.1% NaBH4 at room temperature for a total of 24 h, followed by a similar extraction with 24% KOH containing 0.1% NaBH4. The pooled supernatants from the 4% and 24% KOH extractions were used after centrifugation at 13200 rpm for 10 min to obtain hemicellulose fractions 1 and 2, respectively.
The concentration of uronic acids was determined using the meta-hydroxydiphenyl method (Blumenkrantz and Asboe-Hansen, 1973) and used as an indicator of the concentrations of pectin and hemicellulose 1 and 2 (Yang et al., 2008; Xiong et al., 2009; Wang et al., 2018). Briefly, 200 μL of the extracted polysaccharides were incubated in 1 mL 98% H2SO4 combined with 12.5 mmol L-1 Na2B4O7 at 100°C for 5 min and then immediately chilled. Then, 20 μL of 0.15% M-hydro-diphenyl were added to the solution and the solution was kept at room temperature for 20 min. The absorbance of this solution at 520 nm was measured using galacturonic acid (Sigma-Aldrich) as a standard.
2.2.1.2 Microscopic observation and measurement of root epidermal cells
To determine the length and width of the cells in each treatment, root epidermal cells were excised 0.5 cm away from the root tip. These samples were stained in 15-mL tubes filled with 0.1% Calcofluor white for 20 min. Then, five root samples, from each plant, were laid on a microscope slides after washed by distilled water and. These slides were covered with a coverslip. Samples were examined using a Leica DMLB epi-fluorescence microscope (Weiziar, Germany) with a 340–380 nm excitation filter and 425-nm emission filter, coupled to a DS-Fi1 digital camera and NIS-Elements BR3.0 software (Nikon Instruments Inc., Tokyo, Japan). We measured the dimensions of 10 cells in each root.
2.2.2 Experiment 2: Long-term effects of pH and Ca concentration on biomass accumulation, chlorophyll concentration and concentrations of selected elements
2.2.2.1 SEM-EDS observation and analysis of elements in root-tip cell walls
After 12 weeks, root-tip sections (1 cm in length) were sampled from the most developed plant of each replicate of the two pH levels combined with three Ca concentrations (0, 10 and 100 mg L-1) treatments. The root samples were immediately rinsed with tap water and then with de-ionized water. The rinsed samples were then placed in 10 mL of 70% ethanol at 4°C. The relative frequencies (%) of major elements (Ca, Mg, K, P and S) in the cell walls of the root-tip epidermis were analyzed using a scanning electron microscope (SEM; Wd = 15 mm, Hv = 19 kV, Bi = 16; VEGA3; Tescan, Czech Republic) coupled to an energy-dispersive detector (EDS, Model X-act; Oxford Instruments, UK; Tan et al., 2020).
2.2.2.2 Biomass accumulation and chlorophyll concentrations
After 12 weeks the most developed plant in each replicate of all treatments was sampled and its total fresh weight was determined. Then, the plants’ organs (root, shoot and leaves) were separated and weighed (fresh weight). The plant organs were rinsed was washed consecutively in tap water and then in two different containers filled with deionized water. After that, the plant organs were dried at 65°C for 72 h. The dry weights of the organs were determined and then subsamples were ground to a fine powder for element analysis.
The chlorophyll concentration was determined in diagnostic leaves (i.e., the youngest fully developed leaf, usually the fourth to sixth leaf from the shoot apex) of the most developed plant among the 2 plants that grew in each container, on the 11th week after the start of the experiment. The chlorophyll concentrations were measured with a SPAD device (502 Plus Chlorophyll Meter; Spectrum Technologies Inc., Aurora, IL, USA). The SPAD readings were calibrated (R2 = 0.93, p < 0.0001) to the chlorophyll concentrations that were determined by dimethyl sulfoxide (DMSO) extraction (Barnes et al., 1992) of subsamples of leaves and spectrophotometer measurements (UV-2401PC; Shimadzu Scientific Instruments, Nakagyoku, Kyoto, Japan).
2.2.2.3 Concentrations of selected elements in plant organs
The concentrations of N, P, K, Ca, Mg Fe, Mn and Zn in each of the plant organs were determined using the following procedures. The concentrations of N and P were determined by auto-analyzer (Automated Photometric Discrete Analyser; Gallery Plus, Thermo Fisher Scientific, Vantaa, Finland) in digested plant organs with sulfuric acid and hydrogen peroxide. Concentrations of K, Ca, Mg, Fe, Mn and Zn were determined by atomic absorption spectrophotometry (Analyst 400; PerkinElmer, Waltham, MA,USA) after digestion of the samples with nitric acid and perchlorate.
2.3 Statistical analysis
The effects of the pH level, Ca concentration, blocks and their interactions on the root-tip cell wall in Experiment 1 and plant biomass, concentrations of chlorophyll in diagnostic leaf and element concentrations in roots, shoots and leaves in Experiment 2 were examined using three-way ANOVA, which was conducted using JMP 16 software (SAS Institute, 2005). Default significance levels were set at α = 0.05.
3 Results
3.1 Experiment 1: Short-term (up to 3 days) combined effects of pH level and Ca concentration on root morphology and epidermal cell-wall polysaccharide polymers
The length (Figures 1A–C) and width (Figures 1B–D) of the root cell-wall epidermal surface were greater at pH 4.5 than at pH 7.5 after 3 days (Figures 1C, D), but not after 1 day (Figures 1A, B). However, the Ca concentration did not affect the cell size dimensions and there were no pH × Ca interaction effects.
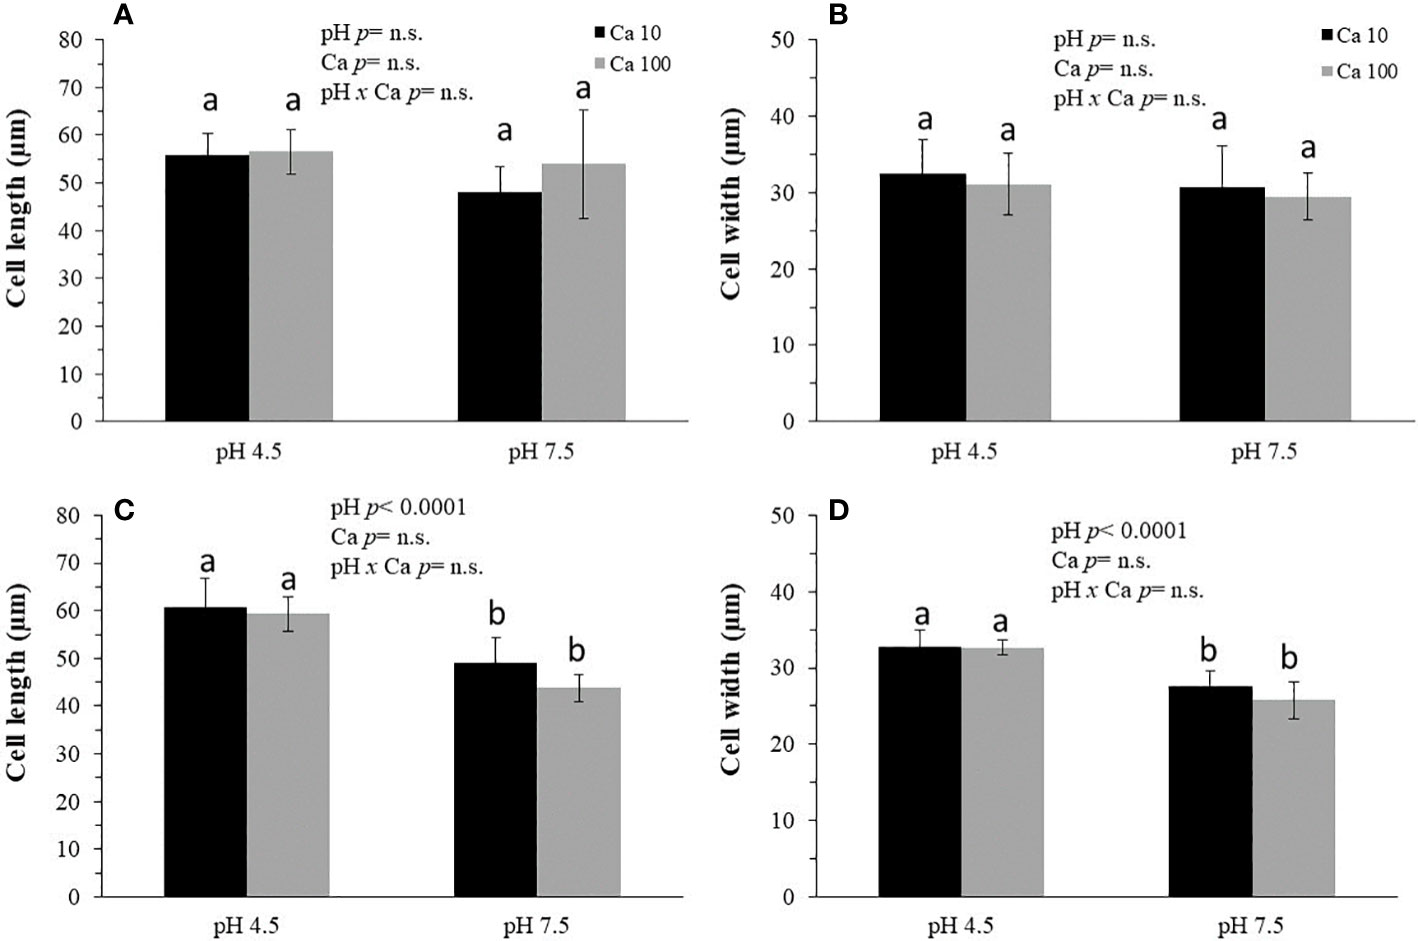
Figure 1 The effects of pH and Ca concentration on epidermal cell-wall length (A, C) and width (B, D) in blueberry roots. Southern highbush blueberry plants (Vaccinium corymbosum, cv. Windsor) were cultured for 1 (A, B) or 3 (C, D) days in nutrient solutions of pH 4.5 or 7.5 that contained 10 or 100 mg L-1 Ca. Means in the sub-figures followed by different letters (a, b) are different according to LSMeans Student's t test. One cm of the root tip was stained with Calcofluor white and root epidermal cells were sampled at a distance of 500 μm from the root tip to determine the length and width of root epidermal cells. Data are means ± SD (n = 3). All data were subjected to a three-way analysis of variance (ANOVA).
As can be seen in Figure 2, there is negative effect of slight-alkaline pH on structure of the root-tip on Day 1 (Figures 2C, D), this negative effect was exacerbated on Day 3 (Figures 2E–H). Additionally, the negative effect of slight-alkaline pH on the structures of the root-tip was greater in the higher concentration of Ca (100 mg L-1) than in the lower concentration of Ca {10 mg Ca L-1, (Figures 2C, D)} on Day 1, respectively. The negative effect of the Ca even more apparent on Day 3 (Figures 2G, H). In contrast to the negative effect of the pH on the structure of the root –tip at pH 7.5, in the acidic pH treatments no negative effect on the structure of the root-tip was observed either at a low Ca concentration or at a high Ca concentration on Day 1 and Day 3 (Figures 2A–F).
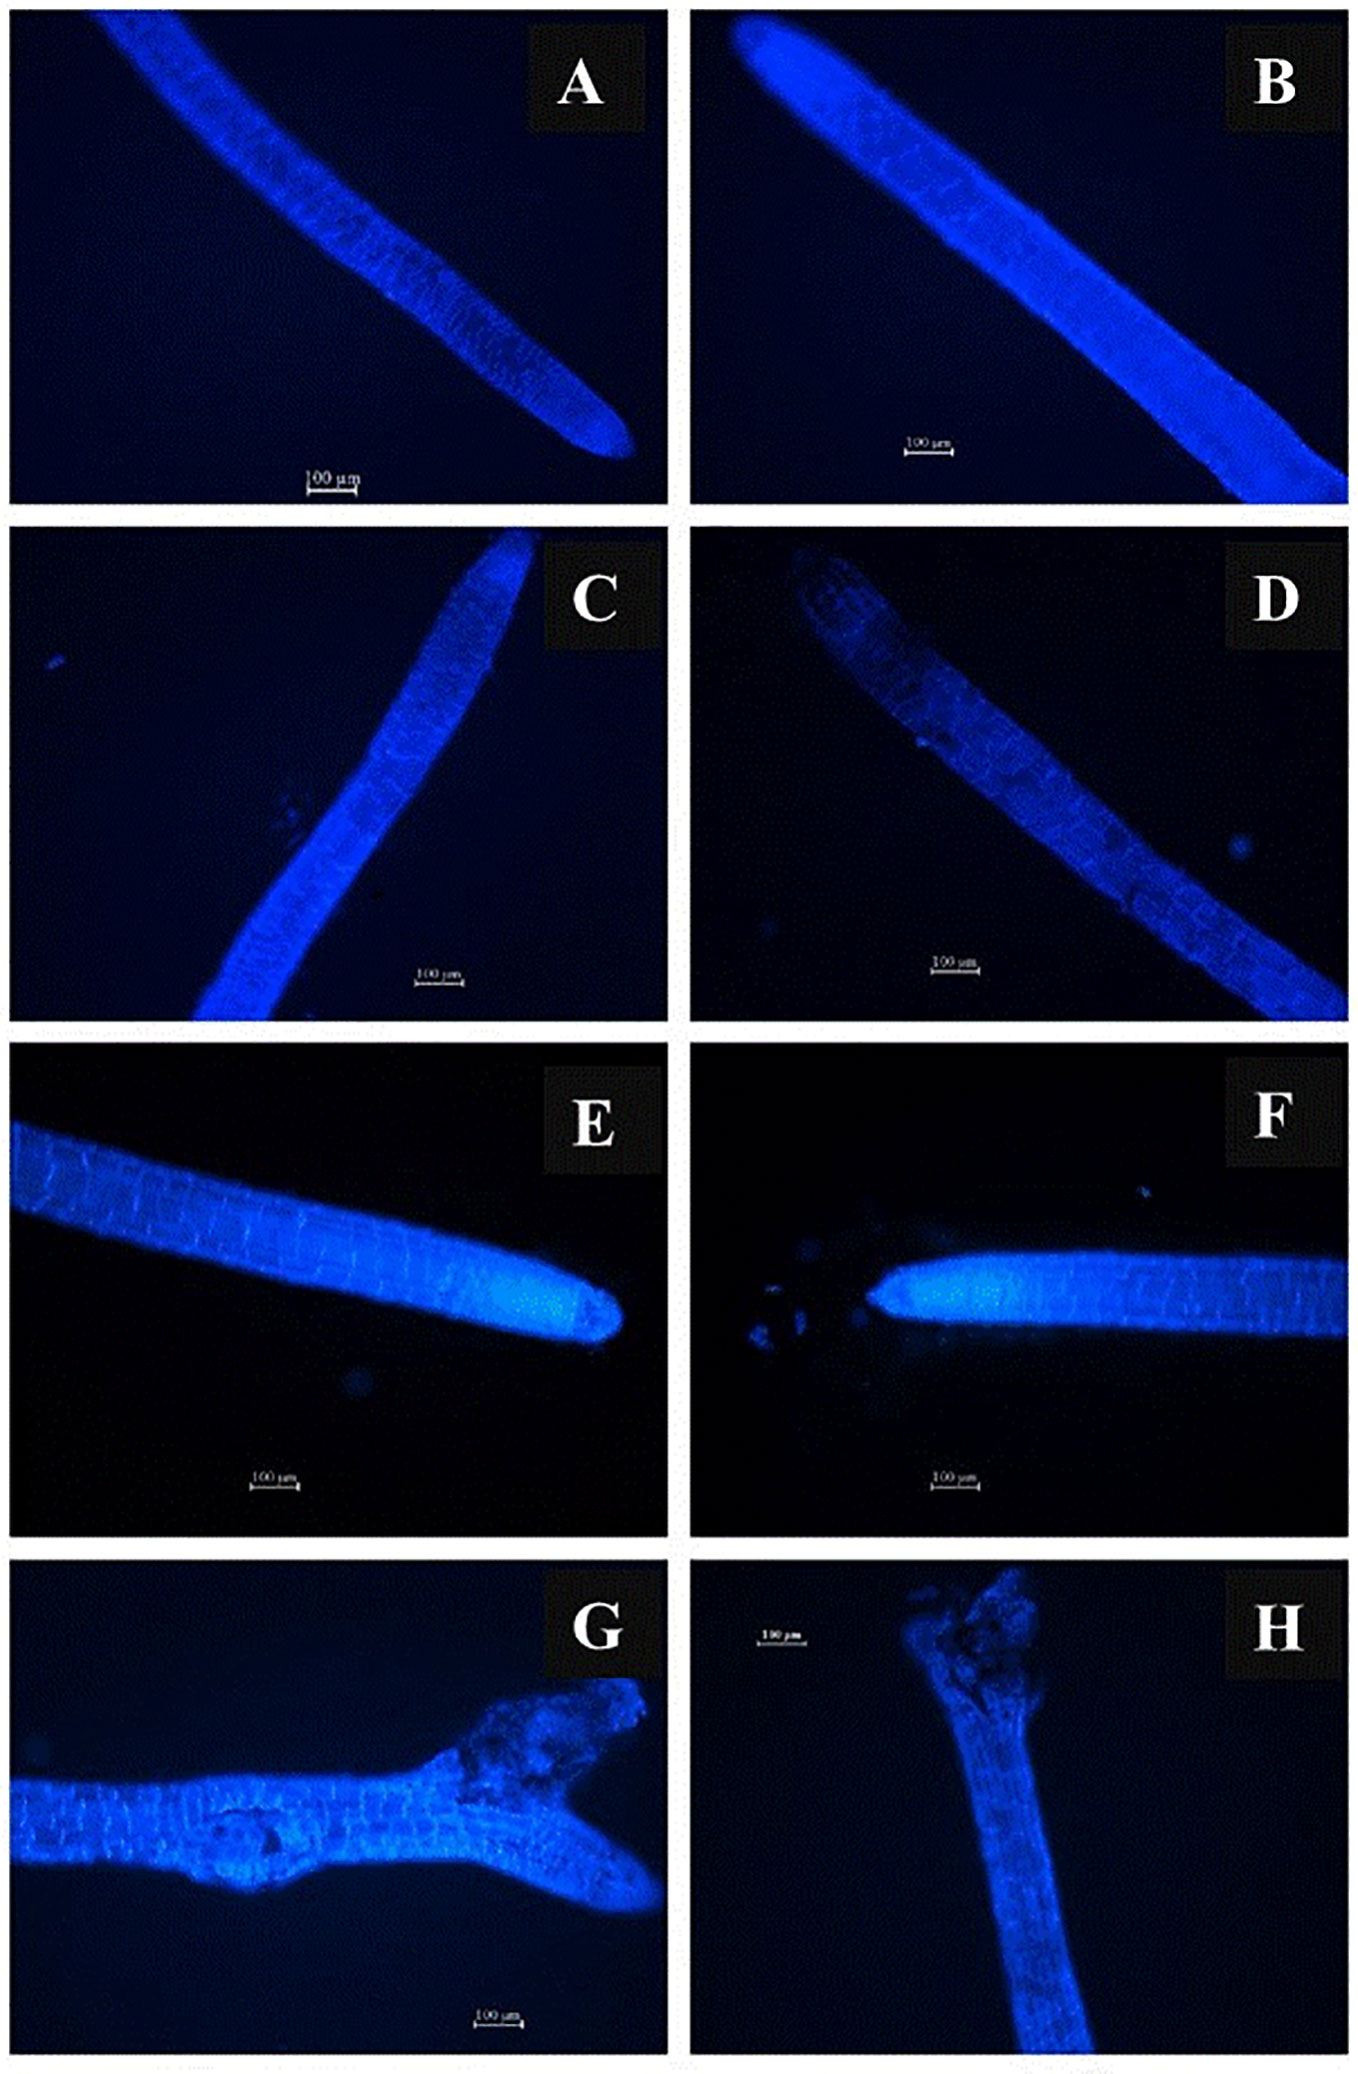
Figure 2 Representative 1-cm samples of roots including the tip and the elongation zone were stained with Calcofluor white and examined under a fluorescence microscope. Southern highbush blueberry plants (Vaccinium corymbosum, cv. Windsor) were cultured in nutrient solution with pH 4.5 containing 10 (A, E) or 100 mg L-1 Ca (B, F), or pH 7.5 containing 10 (C, G) or 100 mg L-1 Ca (D, H) for 1 day (A–D) and 3 days (E–H).
On Day 1, the uronic acids content of pectin was higher at pH 4.5 than at pH 7.5 in the presence of 10 mg Ca L-1, but not in the presence of 100 mg Ca L-1 (Figure 3A). However, at the same time, the levels of hemicellulose 1 and 2 did not differ significantly between the pH treatments or between the Ca treatments (Figures 3B, C). After 3 days, the effect of the treatments became more apparent for pectin and hemicellulose 1, but not for hemicellulose 2 (Figures 3D–F). Regarding pectin, the uronic acids content of pectin was lower at pH 7.5 than pH 4.5, at each of the Ca concentrations levels (Figure 3D). Additionally, the uronic acids content of pectin was lower at the higher concentration of Ca (100 mg Ca L-1) than at the lower one (10 mg Ca L-1), at each of the pH levels. Regarding hemicellulose 1, the uronic acids content was significantly higher at pH 4.5 than at pH 7.5 for both concentrations of Ca (Figures 3D, E). In addition, the uronic acids content was higher at 10 mg Ca L-1 than at 100 mg Ca L-1 for pH 4.5, but not for pH 7.5. No interactive pH × Ca effects on the uronic acids in pectin and hemicellulose 1 and 2 were observed on Day 1 or Day 3.
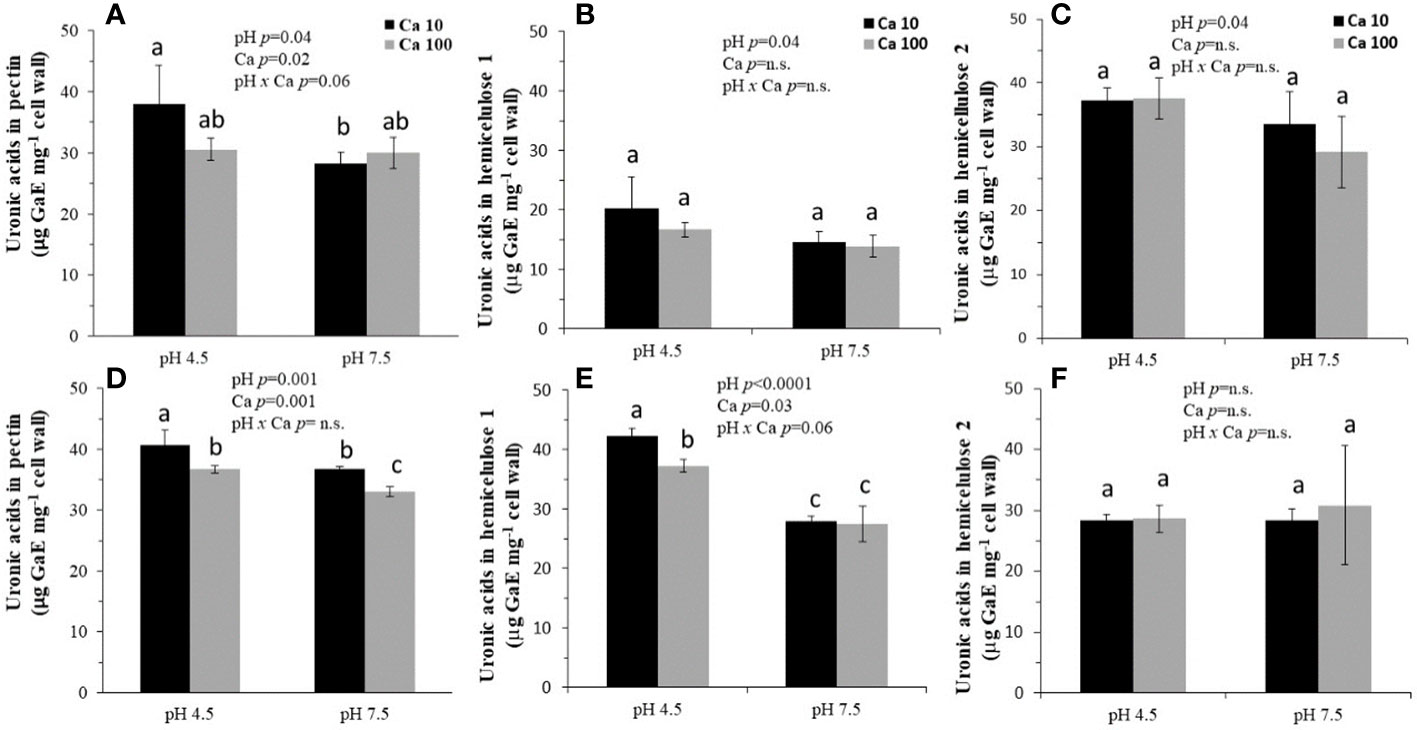
Figure 3 Uronic acids content of the cell-wall fractions pectin (A, D), hemicellulose 1 (B, E) and hemicellulose 2 (C, F) extracted from blueberry roots on Day 1 (A–C) and Day 3 (D–F). Southern highbush blueberry (Vaccinium corymbosum, cv. Windsor) plants were cultured for 1 day and 3 days in nutrient solutions of pH 4.5 or 7.5 containing 10 or 100 mg L-1 Ca. Means in the sub-figures followed by different letters (a, b, c) are different according to LSMeans Student's t test One cm of root tip was excised and cell-wall polysaccharides were fractionated into pectin and hemicellulose fractions and the uronic acid content of each fraction was determined. Data are means ± SD (n = 3). All data were subjected to a three-way analysis of variance (ANOVA).
3.2 Experiment 2: Long-term (12 weeks) combined effects of pH level and Ca concentration on root morphology, SEM-EDS element analysis, plant performance and plant element concentrations
3.2.1 Root morphology and SEM-EDS element analysis
After 12 weeks of growth in solution, the external surfaces of root epidermal cells were smoother and more organized at pH 4.5 (Figures 4A–C) than at pH 7.5 (Figures 4D–F). The relative frequency of Ca on the epidermal layer of the root increased as the concentration of Ca in the growth solution increased at slight alkaline pH treatments (Figure 4). Similar to that, but not exactly, at acid pH treatments, the relative frequency of Ca on the epidermal layer of the root was higher in 100 mg L-1 of Ca than in the lower concentrations. Furthermore, at pH 7.5, the increased concentration of Ca in the growth solution and the increased relative frequency of Ca on the epidermal layer of the root were associated with an increase in the relative frequency of P; opposite to that, at pH 4.5, the relative frequency of P was highest in the treatment that included no Ca (Figure 4). No other elements among those determined were consistently affected by the applied treatments.
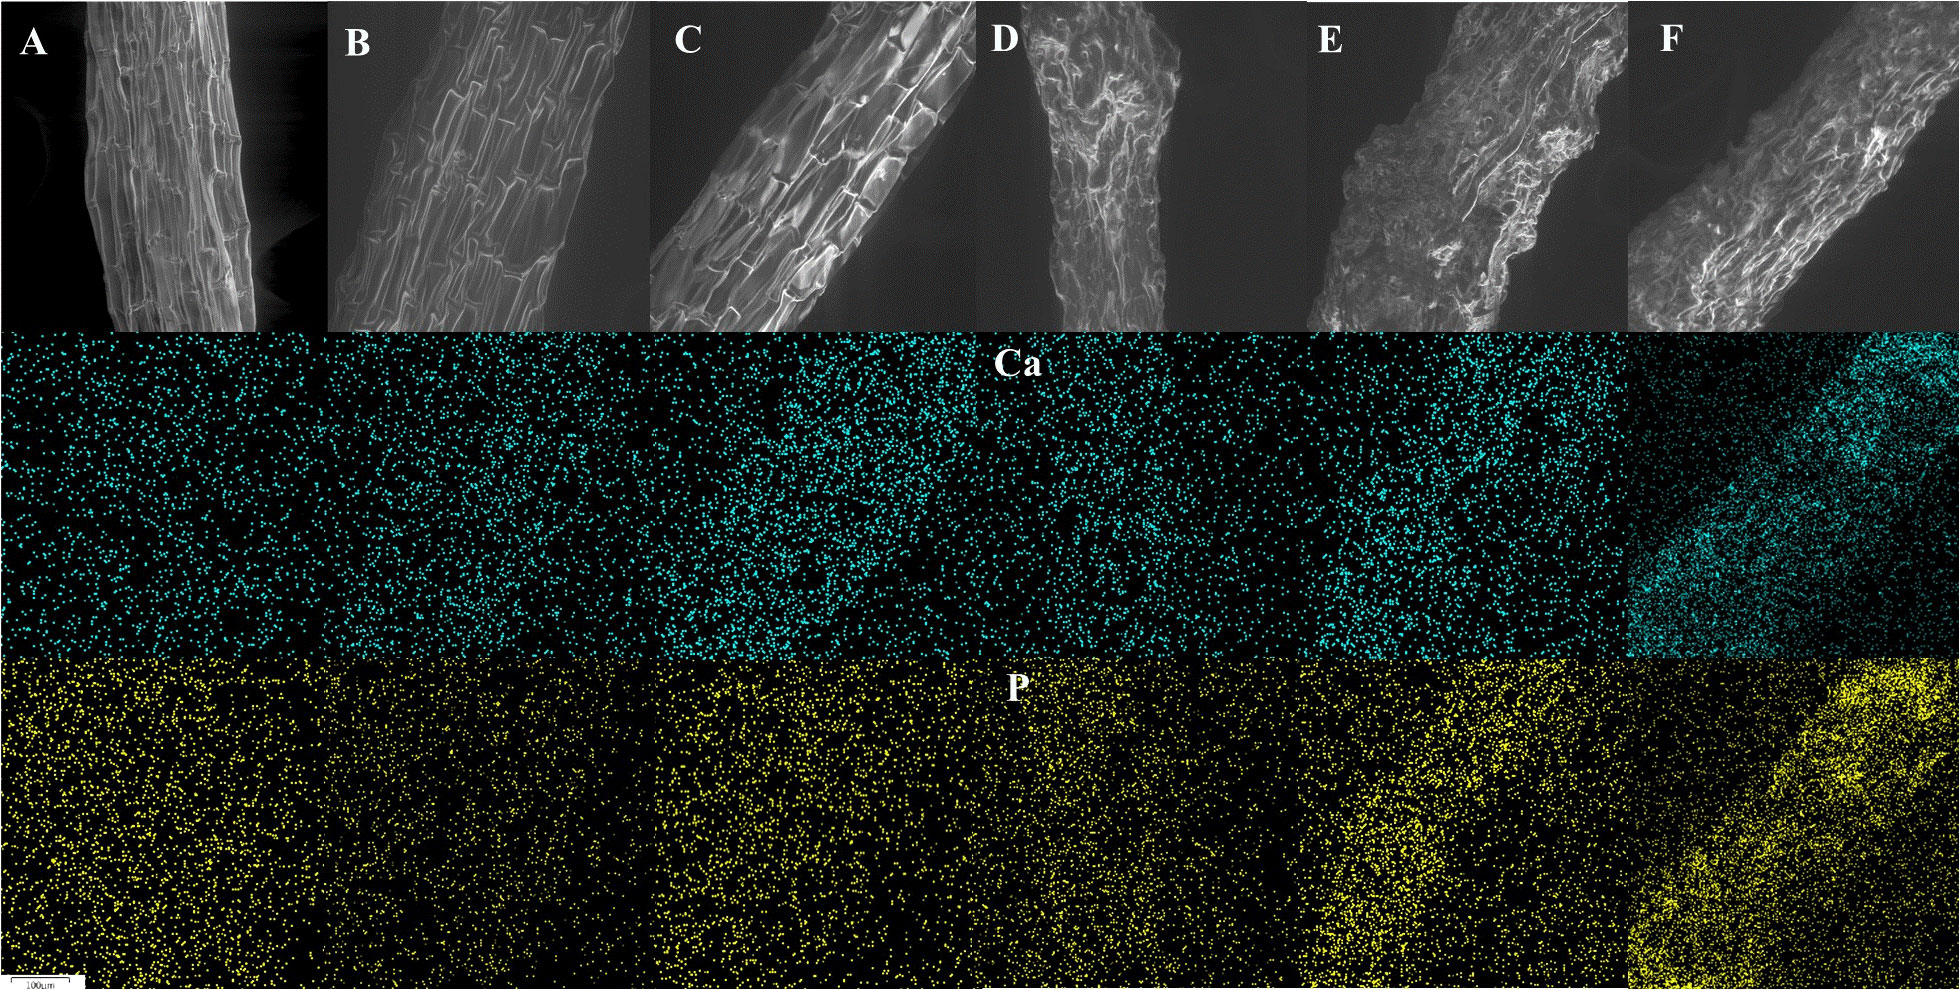
Figure 4 Representative SEM images (Wd = 15 mm, Hv = 19 kV, Bi = 16) of Southern highbush blueberry (Vaccinium corymbosum, cv. Windsor) roots after 12 weeks of growth in nutrient solutions at pH 4.5 (a–c) and 7.5 (d–f) that included three different concentration of Ca: 0 (A, D), 10 (B, E) and 100 (C, F) mg L-1 and the corresponding illustrations of their Ca and P distributions that were created by the EDS detector.
3.2.2 Biomass production and chlorophyll concentration
The biomass production of all plant organs and the chlorophyll concentration in the leaves were significantly affected by the pH. The biomass of all of the plant organs and the chlorophyll concentration were about 10 and 2 times higher at pH 4.5 than at pH 7.5 (Table 1), respectively. However, no effects of the Ca concentration and no interactive effects of Ca and pH on the biomass production of the plant organs or the leaf chlorophyll concentrations were observed.
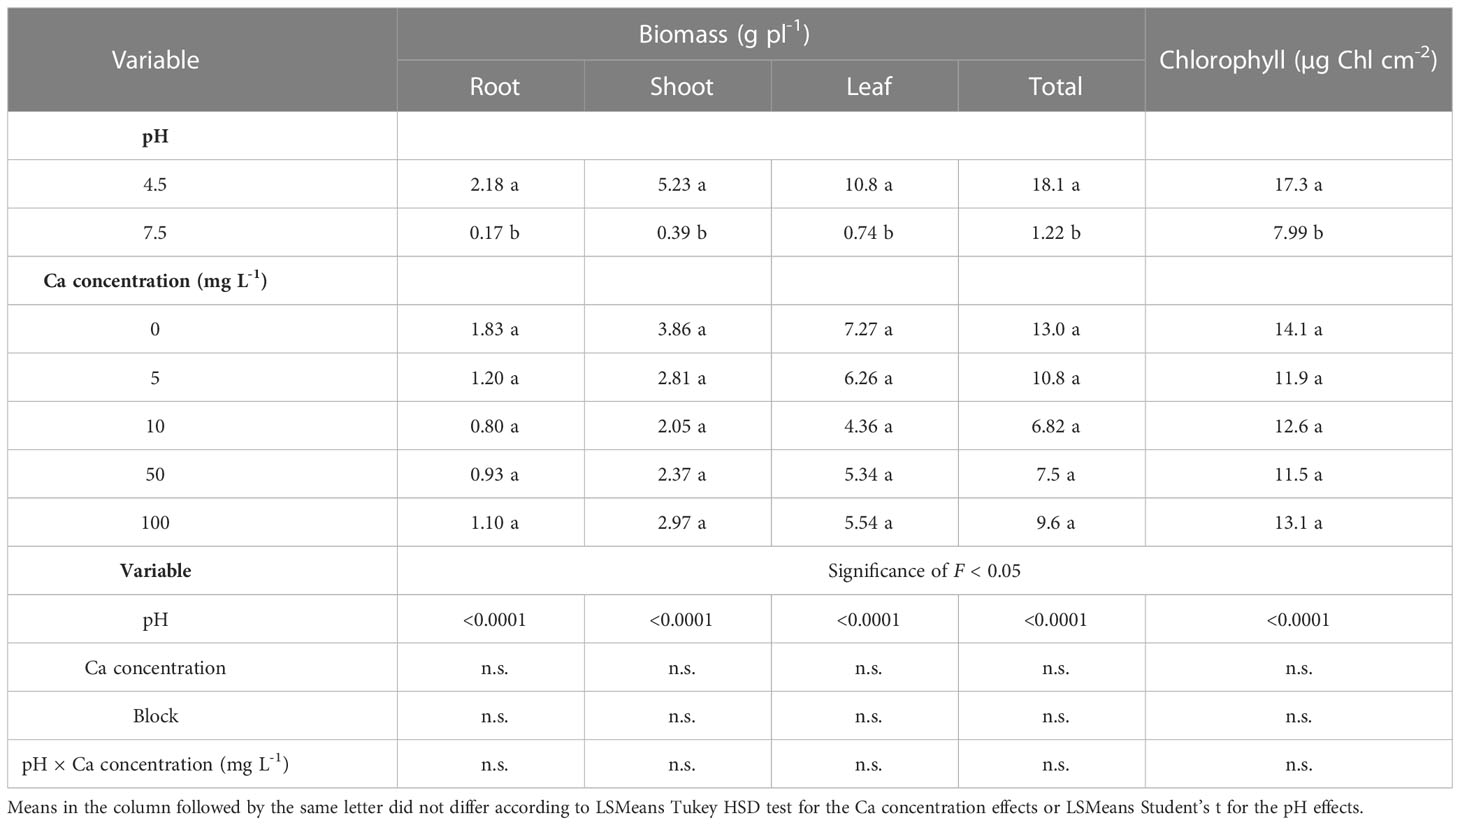
Table 1 Effects of pH (4.5 and 7.5) and Ca concentration (0, 5, 10, 50 and 100 mg L-1) on the biomass of Southern highbush blueberry (Vaccinium corymbosum, cv. Windsor) organs (root, shoots, leaf and total biomass) after 12 weeks of growth in nutrient solution and chlorophyll concentrations after 11 weeks of growth in a nutrient solution.
3.2.3 Concentrations of P, Ca, Fe and Mn in plant organs
The concentrations of Ca, P, Fe and Mn in the plant organs, which were significantly affected by the treatments, are presented in Table 2, while no other element was affected (not shown).
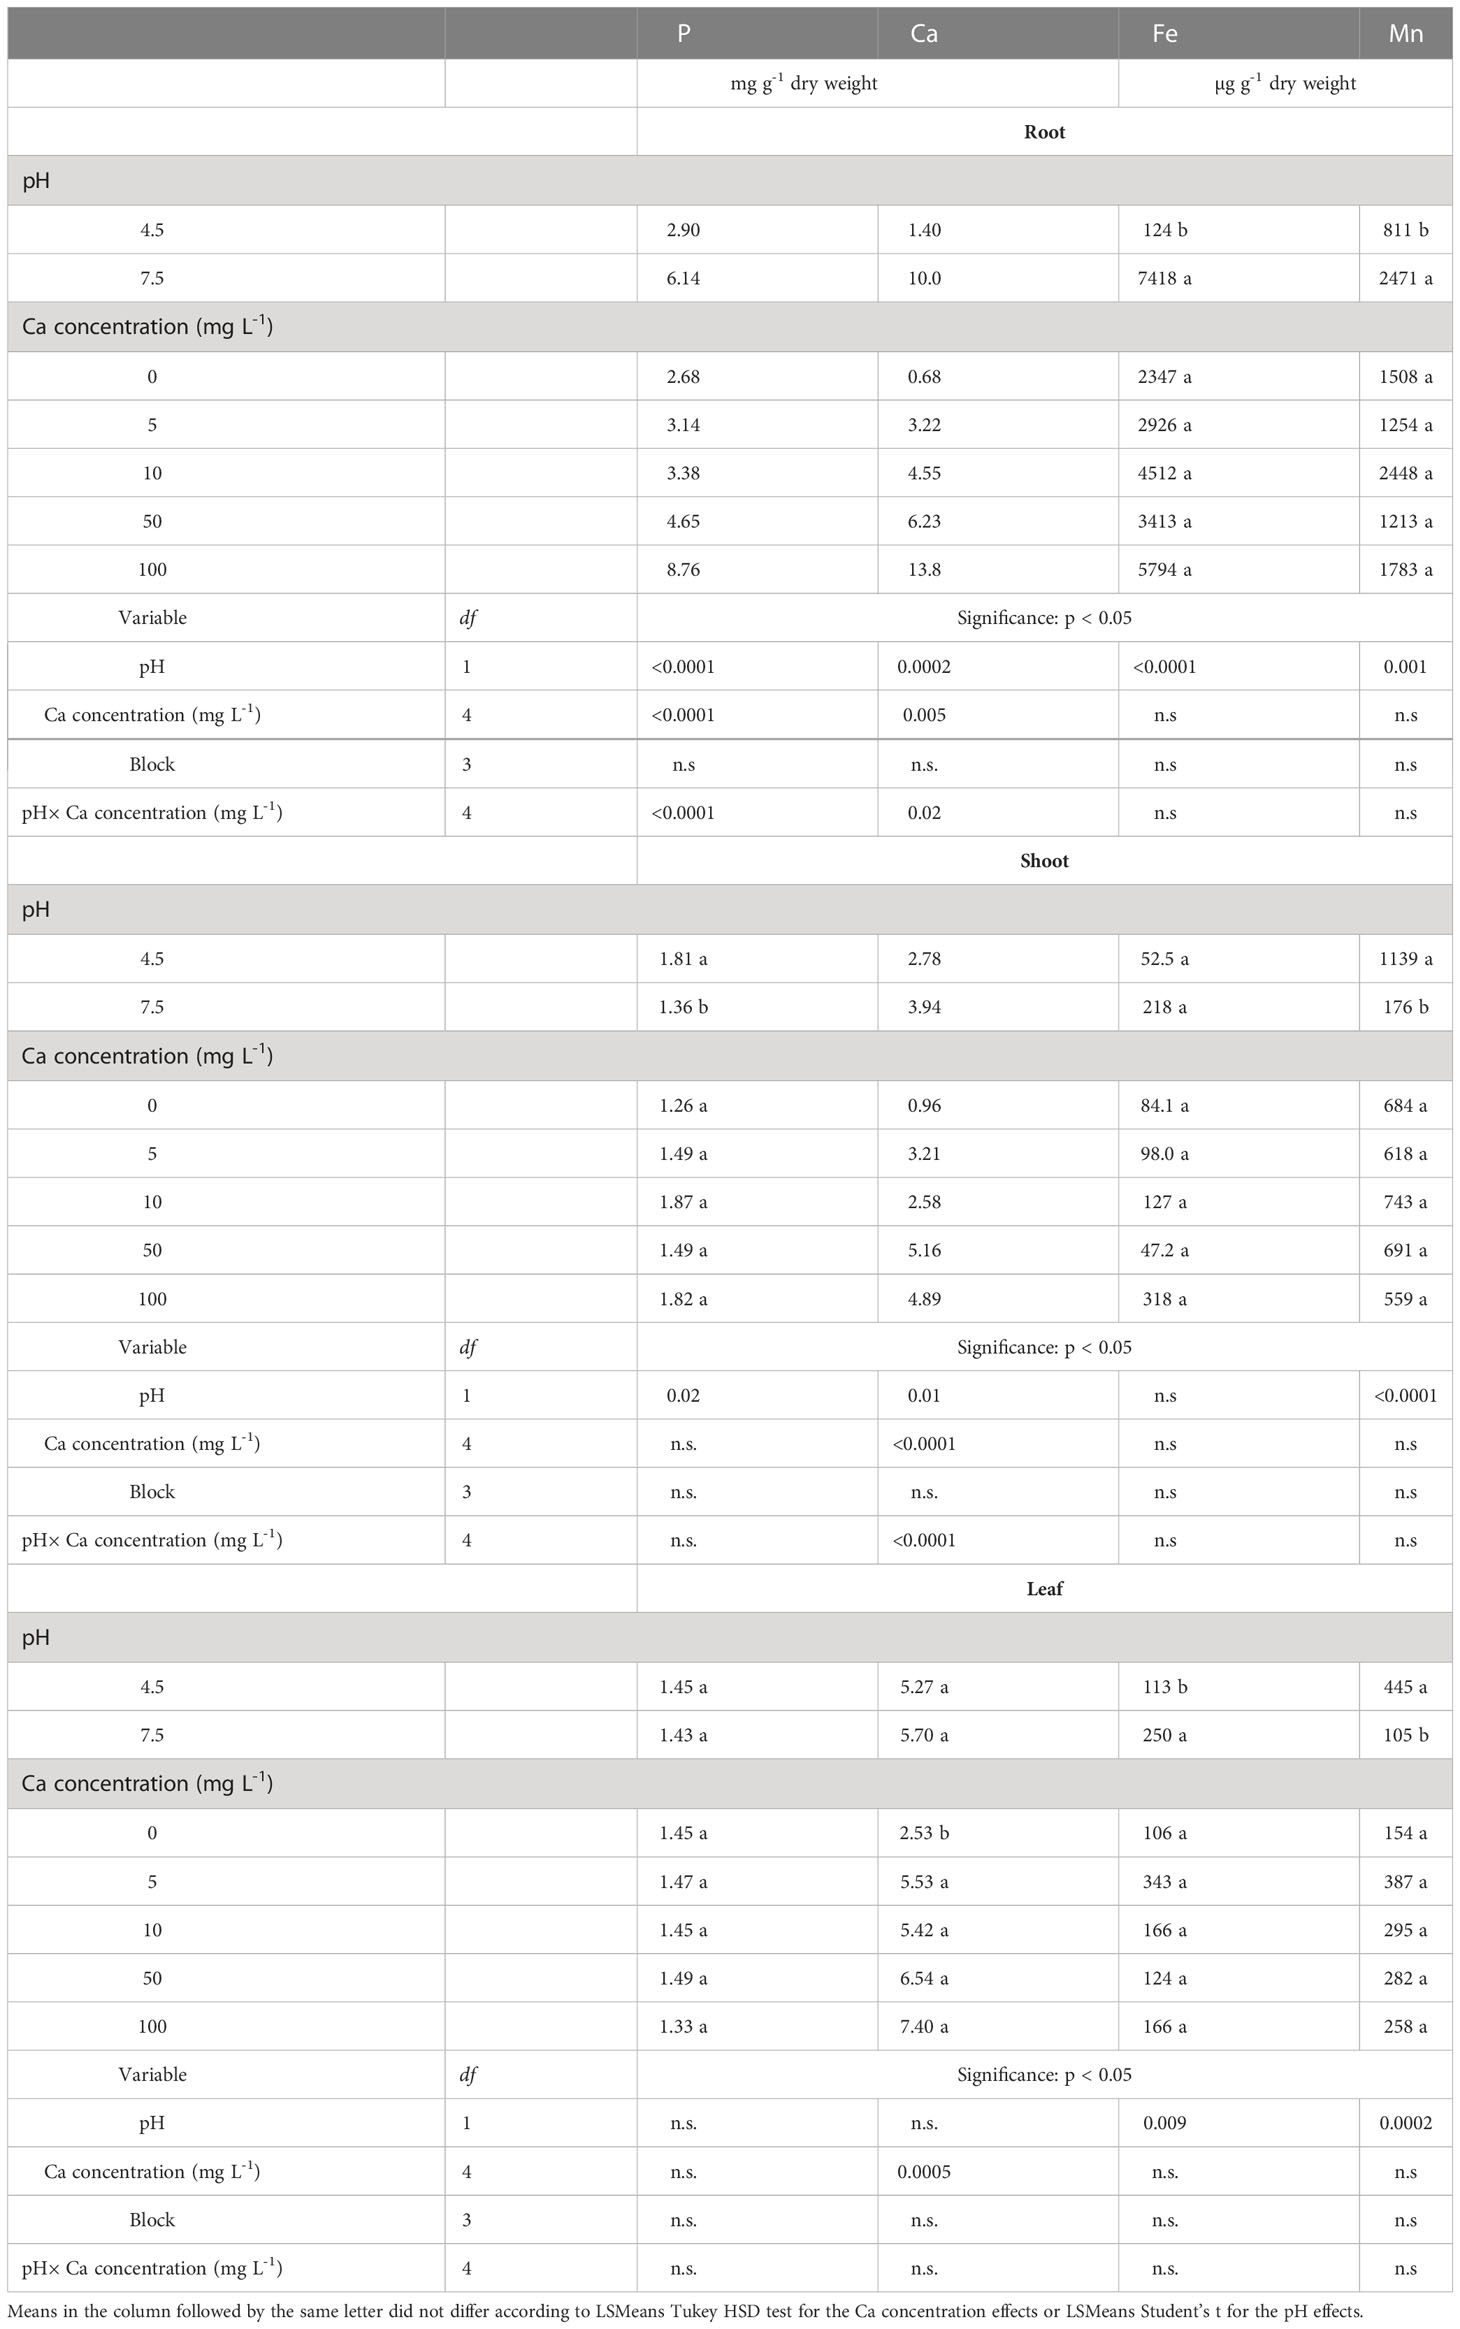
Table 2 Effects of pH (4.5 and 7.5) and Ca concentration (0, 5, 10, 50 and 100 mg L-1) on the concentrations of selected elements in the root, shoot and leaf of Southern highbush blueberry (Vaccinium corymbosum, cv. Windsor) plants after 12 weeks of growth in nutrient solutions.
The concentrations of Fe and Mn in the roots were significantly lower at pH 4.5 than at pH 7.5 (Table 2). In contrast, the Ca treatments did not affect the concentrations of these elements in the roots. However, significant interactive effects of the Ca and pH treatments on the P and Ca concentrations in the roots were observed (Table 2). Therefore, the effects of the Ca treatments on the concentrations of those elements are presented separately for each pH level (Table 3). At pH 7.5, there was a clear trend of increasing concentrations of P and Ca in the roots as the concentration of Ca in the solution increased, but that was not the case at pH 4.5. The increased concentrations of these elements are congruent with the results of SEM-EDS analysis, which revealed the accumulation of Ca and P on the epidermal layer of the root (Figure 4).
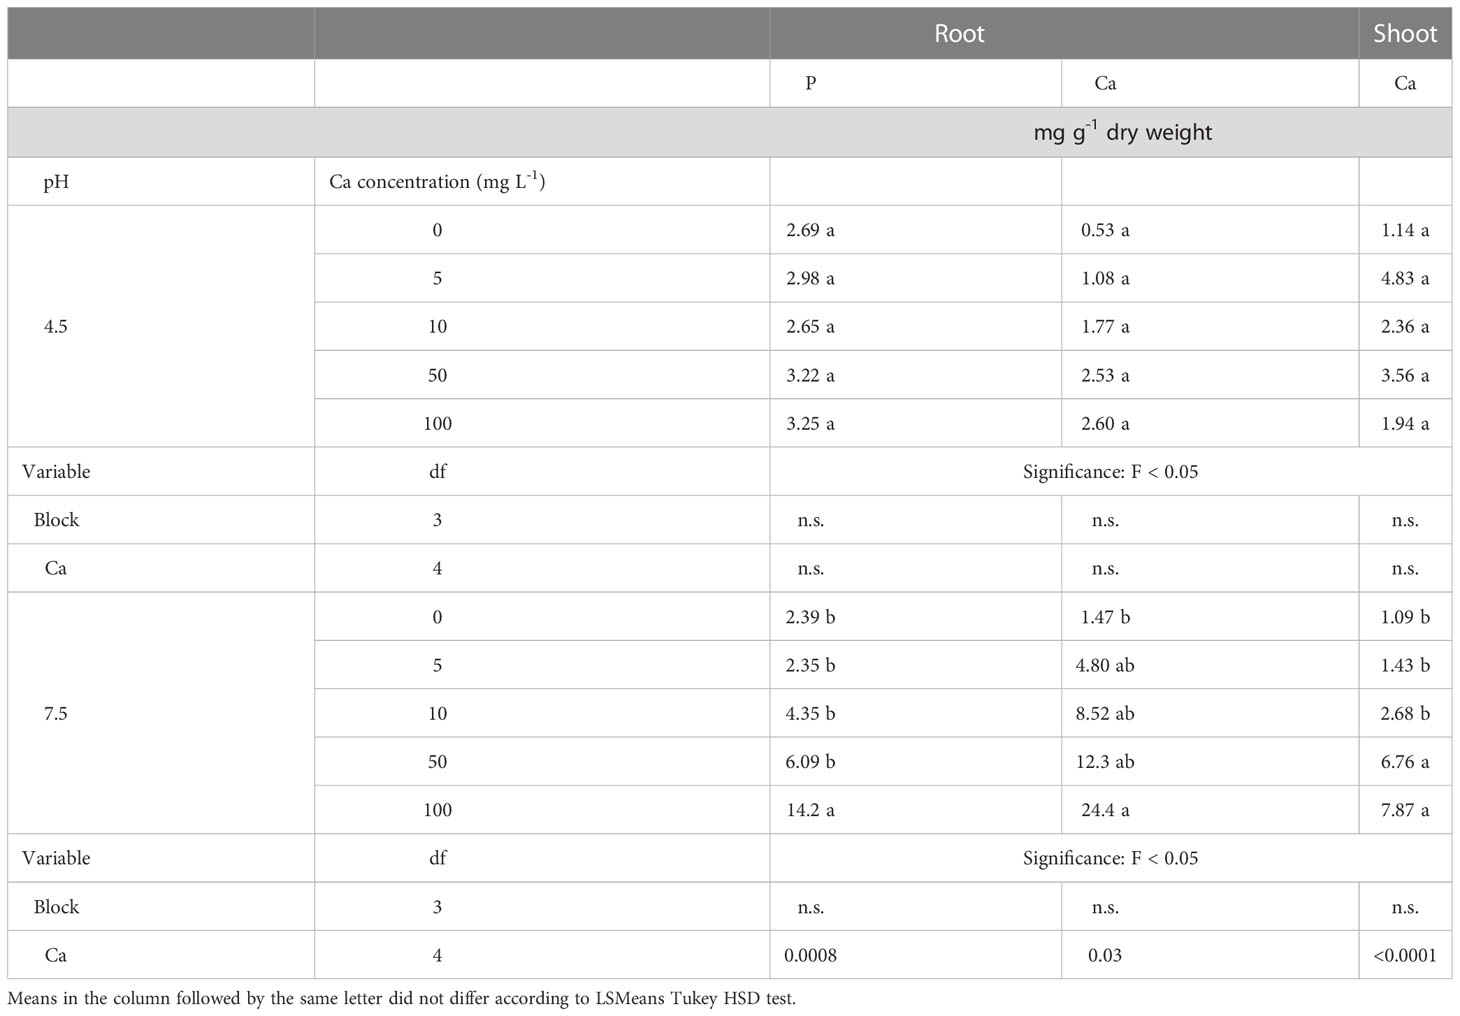
Table 3 The interactive effect of pH (4.5 and 7.5) and Ca concentration (0, 5, 10, 50 and 100 mg L-1) on the concentrations of selected elements in the root and shoot of Southern highbush blueberry (Vaccinium corymbosum, cv. Windsor) plants after 12 weeks of growth in nutrient solutions.
The concentrations of P and Mn in shoots were significantly higher at pH 4.5 than at pH 7.5 (Table 2). The concentrations of P, Mn and Fe in the shoots were not affected by the Ca treatments. However, there was a significant interactive effect of the Ca concentration and pH level on the Ca concentration in the shoots (Table 2). Therefore, in Table 3, the concentrations of this element is presented separately for each pH level. Similar to the roots, the Ca concentrations in the shoot increased as the concentration of Ca in the solution increased at pH 7.5, but not at pH 4.5.
The Fe concentrations in the leaves were higher at pH 7.5 than at pH 4.5. In contrast, the Mn concentrations were more than four times higher at pH 4.5 than at pH 7.5 (Table 2). The Ca concentration in the leaves increased as the concentration of Ca in the growth solution increased. However, Ca treatments did not affect the concentrations of P, Fe and Mn in the leaves.
4 Discussion
The results presented in this study demonstrate a relatively rapid (up to 3 days) negative response of root growth and morphology to pH 7.5, which was amplified by a high concentration of Ca (100 mg Ca L-1 as compared to 10 mg Ca L-1). This adverse response was expressed as reduced dimensions of the epidermal cell wells (Figure 1) and lower concentrations of pectin and hemicellulose 1 in the epidermal cell walls (Figure 3) of the elongation zone part in the root. Additionally to that, it was also presented a deformation of root-tip (Figure 2). These results are in agreement with reports showing that increased levels of pectin and hemicellulose 1 in the cell wall are associated with increased cell-wall elongation and extension (Cosgrove, 2005; Peaucelle et al., 2012; Cosgrove, 2014). Additionally, Graças et al. (2021), suggested that the counteracting effect of Ca+2 on H+ enhances cell-wall extension under condition of acidic pH in low-pH-sensitive Arabidopsis thaliana plants.
In contrast to that, our results suggest that this counteracting effect interfere cell-size elongation and extension in slight alkaline-pH-sensitive blueberry plants. These results might support Zhang et al. (2015) explanation that slightly alkaline pH combined with a high concentration of Ca decreases the flexibility of cell walls.
The combined treatment of slightly alkaline pH and a high concentration of Ca, which adversely affected the elongation and root-tip cells in short-term, also caused to increase the concentrations of P and Ca in the root, after 12 weeks of growth (Table 3). Part of these increased concentrations is results of their accumulation on the root surface. These accumulations were associated with the degradation of root morphology (Figure 4). We demonstrated, in a previous study (Tamir et al., 2018), an accumulation of Ca on the root surface of blueberry in alkaline solution too. In that study we presented that this accumulation of Ca decreases gradually from the root surface toward the xylem (Tamir et al., 2018). Therefore, it is suggested, that the increased concentrations of Ca and P on the root surface (Figure 4) might be caused by precipitation of Ca–P on the root surface under slightly alkaline pH. Under such conditions, the major forms of the orthophosphate ions are HPO42- and H2PO4- (Lindsay, 1979). This Ca–P precipitation probably reduces the flexibility of the root cells and consequently disrupts root elongation and extension. This disruption is in addition to the short-term mechanism of decreasing the flexibility of the cell wall because of the presence of high concentration of Ca. The rapid and slow negative combined effects of slight alkaline pH and high concentration of Ca on root development were associated with lower biomass production at pH 7.5, as compared to pH 4.5, after 12 weeks of growth (Table 1). To the best of our knowledge, the current report is the first to report rapid damage (up to 3 days) to the root epidermis cells and slow damage (12 weeks) to whole-root development in response to the combination of slightly alkaline pH and high concentrations of Ca in blueberry. However, the implications of the described responses of the roots for the long-term response of the whole plant should be investigated further. Furthermore, the overall findings from nutrient solution experiment have to be drawn with care to the limitation of such system and in relation to findings from sand and soil systems (Xu et al., 2020).
The slightly alkaline pH treatment caused also to deficiency of Mn in the leaves. The Mn concentration in the roots was higher at pH 7.5 than at pH 4.5 (Table 2), indicating that the Mn deficiency in the leaves at pH 7.5 was caused by a reduction in its translocation from roots to shoots, rather than any reduced uptake of Mn by the roots. A similar effect of pH on Mn distribution in blueberry plants was found in our previous study (Tamir et al., 2021b), in which, under increased pH, the concentration of Mn in the shoots increased and the concentration of Mn in the leaves decreased.
In contrast to Mn, the concentration of Fe in the leaves was higher at pH 7.5 than at pH 4.5 (Table 2), contrary to the adverse effects of high pH on chlorophyll concentration and biomass production (Table 1). This observation is in agreement with the results presented by Jiang et al. (2019), which showed no effect of pH level on the concentration of Fe in the leaves of blueberry plants. It is well known that in Strategy I plants, most of the Fe that is taken up by roots is in a reduced state (Fe2+); whereas most of the iron transported through the xylem is in the form of Fe3+-citrate (Broadley et al., 2012). Chen and Barak (1982) showed a stronger correlation between chlorophyll content and reduced-state Fe than between chlorophyll content and Fe3+. The results presented in Table 2 indicate that the translocation of Fe to the leaves of the blueberry plants was not affected by the slightly alkaline pH. Based on that finding, we suggest that the slight alkaline pH inhibited the reduction of Fe3+ to Fe2+ in the leaves. This inhibition led to low chlorophyll content independent of the total Fe concentration in the leaves. This result is indirectly supported by Payá-Milans et al. (2017), who reported that ferric chelate reductase activity was higher in the roots of blueberry plants at pH 6.5 than at pH 4.5, suggesting that the uptake of Fe by the roots was not inhibited by the higher pH.
Blueberry plants are defined as calcifuge (Korcak, 1988) and retarded growth of blueberry plants in calcareous soils has been reported in many publications (Claussen and Lenz, 1999; Tamir et al., 2018; Tamir et al., 2021b; Tamir et al., 2022). In contrast to the above described literature, other publications (Haynes and Swift, 1985; Schreiber and Nunez, 2021), reported that the addition of low dose of CaCO3 to an acidic substrate with very low buffer capacity growing medium improved the performance of blueberry plants. The addition of CaCO3 to the growth media can have an effect in two ways: a nutritional effect (Hawkesford et al., 2012) and an effect on the pH (Bloom et al., 2005), which indirectly also affects the availability of nutrient elements (Neumann and Römheld, 2012). The CaCO3 component has the highest buffer capacity against pH changes compared to the other soil components (Bloom et al., 2005). Haynes and Swift (1985) reported that too high dose of CaCO3 raised the pH to 6.7 and leads to retardation of blueberry plants growth. Schreiber and Nunez (2021) presented that, the effect of adding CaCO3 on the biomass production of blueberry plants was more significant at high acidic pH (4.5) substrate compared to slight acidic pH (6.5) substrate. The meaning of their results is that the positive effect of CaCO3 on plant performance was more significant due to its buffer capacity effect than the nutritional effect, suggested that amendment of poor Ca and acidic substrate with low dose of CaCO3 supplied sufficient Ca to eliminate Ca deficiency. On the other hand, as presented in this study and support our hypothesis that in slight alkaline pH condition, excess of supply Ca contributes to retard growth of blueberry plants.
5 Conclusion
In the current study, we have demonstrated a rapid negative effect of slightly alkaline pH on blueberry root morphology and growth, which is amplified by a high Ca concentration. These visible effects were accompanied by reductions in the levels of the polysaccharide polymers pectin and hemicellulose 1, which might reduce the flexibility of the root epidermal cell walls and inhibit root development.
The translocation of Mn from the root to the shoot was retarded in response to the slightly alkaline pH condition, causing a deficiency of Mn in the leaves. The harmful combined effects of alkaline pH and high Ca on blueberry roots and the Mn deficiency in the leaves eventually have an adverse effect on whole-plant performance, as expressed by the significant reductions in chlorophyll concentrations and biomass production. This study sheds light on physiological aspects that help us to better understand the responses of blueberry plants to alkaline pH and high Ca concentration in calcareous soils. However, the results shown were obtained at two relatively extreme pH levels (4.5 compared to 7.5), further research is required to examine the effect of intermediate pH value.
Data availability statement
The original contributions presented in the study are included in the article/supplementary material. Further inquiries can be directed to the corresponding author.
Author contributions
GT, QZ, ND, and AB-T designed the experiment. GT and QZ analyzed the results and wrote the manuscript. QZ and DE conducted the experiment and measurements and took part in the analysis of the results. SZ and AB-T proofread the original manuscript and edited the final version of the manuscript. All authors contributed to the article and approved the submitted version.
Funding
This research was funded by the Chief Scientist of the Israeli Ministry of Agriculture and Rural Development.
Acknowledgments
We thank Raneen Shawahna for her significant contribution to the atomic absorption spectrophotometry measurements and Shiran Cohen for the auto-analyzer measurements.
Conflict of interest
The authors declare that the research was conducted in the absence of any commercial or financial relationships that could be construed as a potential conflict of interest.
Publisher’s note
All claims expressed in this article are solely those of the authors and do not necessarily represent those of their affiliated organizations, or those of the publisher, the editors and the reviewers. Any product that may be evaluated in this article, or claim that may be made by its manufacturer, is not guaranteed or endorsed by the publisher.
References
Barbez E., Dünser K., Gaidora A., Lendl T., Busch W. (2017). Auxin steers root cell expansion via apoplastic pH regulation in Arabidopsis thaliana. Proc. Natl. Acad. Sci. USA 114, E4884–93. doi: 10.1073/pnas.1613499114.
Barnes J. D., Balaguer L., Manrique E., Elvira S., Davison A. W. (1992). A reappraisal of the use of DMSO for the extraction and determination of chlorophylls a, and b, in lichens and higher plants. Environ. Exp. Bot. 32, 85–100. doi: 10.1016/0098-8472(92)90034-Y
Bar-Tal A., Feigenbaum S., Sparks D. L. (1991). Potassium-salinity interactions in irrigated corn. Irrig. Sci. 12, 27–35. doi: 10.1007/BF00190706
Bloom P. R., Skyllberg U. L., Sumner M. E. (2005). “Soil acidity,” in The chemical processes in soils, vol. 8 . Eds. Tabatabai M. A., Sparks D. L. (Madison, Wisconsin, USA: SSSA Book Series 8), 411–460.
Blumenkrantz N., Asboe-Hansen G. (1973). New method for quantitative determination of uronic acids. Anal. Biochem. 54, 484–489. doi: 10.1016/0003-2697(73)90377-1
Broadley M., Brown P., Cakmak I., Rengel Z., Zhao F. (2012). “Function of nutrients: micronutrients,” in The marschner’s mineral nutrition of higher plants, 3rd edition. Ed. Marschner P. (London, UK: Elsevier academic press), 191–248.
Brown J. C. (1978). Mechanism of iron uptake by plant. Plant Cell Environ. 1, 249–257. doi: 10.1111/j.1365-3040.1978.tb02037.x
Cain J. C. (1952). A comparison of ammonium and nitrate nitrogen for blueberries. Proc. Amer. Soc Hortic. Sci. 59, 161–166.
Chen Y., Barak P. (1982). Iron nutrition of plants in calcareous soils. advan. Agron. 35, 217–240. doi: 10.1016/S0065-2113(08)60326-0
Claussen W., Lenz F. (1999). Effect of ammonium or nitrate nutrition on net photosynthesis, growth, and activity of the enzymes nitrate reductase and glutamine synthetase in blueberry, raspberry and strawberry. Plant Soil 208, 95–102. doi: 10.1023/A:1004543128899
Cosgrove D. J. (2005). Growth of the plant cell wall. Nat. Rev. Mol. Cell Biol. 6, 850–861. doi: 10.1038/nrm1746
Cosgrove D. J. (2014). Re-constructing our models of cellulose and primary cell wall assembly. Curr. Opin. Plant Biol. 22, 122–131. doi: 10.1016/j.pbi.2014.11.001
Darnell R. L., Casamali B., Williamson J. G. (2015). Nutrient assimilation in southern highbush blueberry and implications for the field. HortTechnology 25, 460–463. doi: 10.21273/HORTTECH.25.4.460
Erner Y., Bar-Tal A., Tagari E., Levkowich I., Bar-Yosef B. (2017). Nitrogen source and nitrification inhibitors affect soil nutrient status and 'Star ruby' grapefruit performance. Citrus R&T 37, 182–193. doi: 10.4322/crt.ICC020
Graças J. P., Belloti M., Lima J. E., Peres L. E. P., Burlat V., Jamet E., et al. (2021). Low pH-induced cell wall disturbances in Arabidopsis thaliana roots lead to a pattern-specific programmed cell death in the different root zones and arrested elongation in late elongation zone. Environ. Exp. Bot. 190, 104596. doi: 10.1016/j.envexpbot.2021.104596
Hawkesford M., Horst W., Kichey T., Lambers H., Schjoerring J., Møller. I. S., et al. (2012). “Functions of macronutrients,” in The marschner’s mineral nutrition of higher plants, 3rd edition. Ed. Marschner P. (London, UK: Elsevier academic press), 135–189.
Haynes R. J., Swift R. S. (1985). Effects of liming on the extractability of fe, Mn, zn and Cu from a peat medium and the growth and micronutrient uptake of highbush blueberry plants. Plant Soil 84, 213–223. doi: 10.1007/BF02143185
Jiang Y., Zeng Q., Wei J., Jiang J., Li Y., Chen J., et al. (2019). Growth, fruit yield, photosynthetic characteristics, and leaf microelement concentration of two blueberry cultivars under different long-term soil pH treatments. Agronomy 9, 357. doi: 10.3390/agronomy9070357
Korcak R. F. (1988). Nutrition of blueberry and other calcifuges. Hortic. Rev. 10, 183–227. doi: 10.1002/9781118060834.ch6
Koyama H., Toda T., Hara T. (2001). Brief exposure to low-pH stress causes irreversible damage to growing root in Arabidopsis thaliana: Pectin-Ca interaction may play an important role in proton rhizotoxicity. J. Exp. Bot. 52, 361–368. doi: 10.1093/jexbot/52.355.361
Merhaut D. J., Darnell R. L. (1995). Ammonium and nitrate accumulation in containerized southern highbush blueberry plants. HortScience 30, 1378–1381. doi: 10.21273/HORTSCI.30.7.1378
Merhaut D. J., Darnell R. L. (1996). Vegetative growth and nitrogen/carbon partitioning in blueberry as influenced by nitrogen fertilization. J. Amer. Soc Hortic. Sci. 121, 875–879. doi: 10.21273/JASHS.121.5.875
Molina J. A. E. (1985). Components of rates of ammonium oxidation in soil. Soil Sci. Soc Am. J. 49, 603–609. doi: 10.2136/sssaj1985.03615995004900030014x
Neumann G., Römheld V. (2012). “Rhizosphere chemistry in relation to plant nutrition,” in The marschner’s mineral nutrition of higher plants, 3rd edition. Ed. Marschner P. (London, UK: Elsevier academic press), 347–368.
Nunez G. H., Olmstead J. W., Darnell R. L. (2015). Rhizosphere acidification is not part of the strategy I iron deficiency response of Vaccinium arboreum and the southern highbush blueberry. HortScience 50, 1064–1069. doi: 10.21273/HORTSCI.50.7.1064
Payá-Milans M., Nunez G. H., Olmstead J. W., Rinehart T. A., Staton M. (2017). Regulation of gene expression in roots of the pH-sensitive Vaccinium corymbosum and the pH-tolerant Vaccinium arboreum in response to near neutral pH stress using RNA-seq. BMC Genomics 18, 580. doi: 10.1186/s12864-017-3967-0
Peaucelle A., Braybrook S., Höfte H. (2012). Cell wall mechanics and growth control in plants: The role of pectins revisited. Front. Plant Sci. 3. doi: 10.3389/fpls.2012.00121
Poonnachit U., Darnell R. L. (2004). Effect of ammonium and nitrate on ferric chelate reductase and nitrate reductase in Vaccinium species. Ann. Bot. (Lond) 93, 399–405. doi: 10.1093/aob/mch053
Schreiber M. J., Nunez G. H. (2021). Calcium carbonate can be used to manage soilless substrate pH for blueberry production. Horticulturae 7, 74. doi: 10.3390/horticulturae7040074
Sun C., Lu L., Yu Y., Liu L., Hu Y., Ye Y., et al. (2016). Decreasing methylation of pectin caused by nitric oxide leads to higher aluminum binding in cell walls and greater aluminum sensitivity of wheat roots. J. Exp. Bot. 67, 979–989. doi: 10.1093/jxb/erv514
Tamir G., Afik G., Zilkah S., Dai N., Bar-Tal A. (2021a). The use of increasing proportions of n-NH4+ among the total applied inorganic n to improve acidification and the nutritional status and performance of blueberry plants in soilless culture. Sci. Hortic. 276, 109754. doi: 10.1016/j.scienta.2020.109754
Tamir G., Bar-Tal A., Zilkah S., Rotbaum A., Oren A., Freund G., et al. (2018). The effects of pH level and calcium carbonate on biomass and mineral uptake of blueberry grown in tissue-culture medium. Acta Hortic. 1265, 203–210. doi: 10.17660/ActaHortic.2019.1265.28
Tamir G., Eli D., Zilkah S., Bar-Tal A., Dai N. (2022). Improving rabbiteye blueberry performance in a calcareous soil by growing plants in pits filled with low-CaCO3 growth media. Agronomy 12, 574. doi: 10.3390/agronomy12030574
Tamir G., Shenker M., Heller H., Bloom P. R., Fine P., Bar-Tal A. (2013). Organic n mineralization and transformations in soils treated with an animal waste in relation to carbonates dissolution and precipitation. Geoderma 209-210, 50–56. doi: 10.1016/j.geoderma.2013.05.028\
Tamir G., Zilkah S., Dai N., Shawahna R., Cohen S., Bar-Tal A. (2021b). Combined effects of CaCO3 and the proportion of n-NH4+ among the total applied inorganic n on the growth and mineral uptake of rabbiteye blueberry. J. Soil Sci. Plant Nutr. 21, 35–48. doi: 10.1007/s42729-020-00339-2
Tan J., Ben-Gal A., Shtein I., Bustan A., Dag A., Erel R. (2020). Root structural plasticity enhances salt tolerance in mature olives. Environ. Exp. Bot. 179, 104224. doi: 10.1016/j.envexpbot.2020.104224
Tyler G., Olsson T. (2001). Concentrations of 60 elements in the soil solution as related to the soil acidity. Euro. J. Soil Sci. 52, 151–165. doi: 10.1046/j.1365-2389.2001.t01-1-00360.x
Wang P., Yang B., Wan H., Fang X., Yang C. (2018). The differences of cell wall in roots between two contrasting soybean cultivars exposed to cadmium at young seedlings. Environ. Sci. pollut. Res. 25, 29705–29714. doi: 10.1007/s11356-018-2956-4
Wang W., Zhao X. Q., Chen R. F., Dong X. Y., Lan P., Ma J. F., et al. (2015). Altered cell wall properties are responsible for ammonium-reduced aluminum accumulation in rice roots. Plant Cell Environ. 38, 1382–1390. doi: 10.1111/pce.12490
Wolf S., Greiner S. (2012). Growth control by cell wall pectins. Protoplasma 249 Suppl. 2, S169–S175. doi: 10.1007/s00709-011-0371-5
Xiong J., An L., Lu H., Zhu C. (2009). Exogenous nitric oxide enhances cadmium tolerance of rice by increasing pectin and hemicellulose contents in root cell wall. Planta 230, 755–765. doi: 10.1007/s00425-009-0984-5
Xu F., Vaziriyeganeh M., Zwiazek J. ,. J. (2020). Effects of pH and mineral nutrition on growth and physiological responses of trembling aspen (Populus tremuloides), jack pine (Pinus banksiana), and white spruce (Picea glauca) seedlings in sand culture. Plants (Basel). 9, 682. doi: 10.3390/plants9060682
Yang J. L., Li Y. Y., Zhang Y. J., Zhang S. S., Wu Y. R., Wu P., et al. (2008). Cell wall polysaccharides are specifically involved in the exclusion of aluminum from the rice root apex. Plant Physiol. 146, 602–611. doi: 10.1104/pp.107.111989
Yu Q., Tang C. (2000). Lupin and pea differ in root cell wall buffering capacity and fractionation of apoplastic calcium. J. Plant Nutr. 23, 529–539. doi: 10.1080/01904160009382037
Zhang W., Xu F., Zwiazek J. J. (2015). Responses of jack pine (Pinus banksiana) seedlings to root zone pH and calcium. Environ. Exp. Bot. 111, 32–41. doi: 10.1016/j.envexpbot.2014.11.001
Keywords: plant nutrition, root development, Mn translocation, Ca concentration, P concentration
Citation: Tamir G, Zeng Q, Eli D, Zilkah S, Bar-Tal A and Dai N (2023) Combined effects of alkaline pH and high Ca concentration on root morphology, cell-wall polysaccharide concentrations and blueberry plant performance. Front. Agron. 5:1121448. doi: 10.3389/fagro.2023.1121448
Received: 11 December 2022; Accepted: 09 February 2023;
Published: 07 March 2023.
Edited by:
Mohammad Bagher Hassanpouraghdam, University of Maragheh, IranReviewed by:
Jiwan Paul Palta, University of Wisconsin-Madison, United StatesAbhay Kumar, University of Tuscia, Italy
Copyright © 2023 Tamir, Zeng, Eli, Zilkah, Bar-Tal and Dai. This is an open-access article distributed under the terms of the Creative Commons Attribution License (CC BY). The use, distribution or reproduction in other forums is permitted, provided the original author(s) and the copyright owner(s) are credited and that the original publication in this journal is cited, in accordance with accepted academic practice. No use, distribution or reproduction is permitted which does not comply with these terms.
*Correspondence: Guy Tamir, scagtamir@gmail.com
†These authors have contributed equally to this work