First in-human quantitative plaque characterization with ultra-high resolution coronary photon-counting CT angiography
 Victor Mergen1
  Hatem Alkadhi
- 1Institute of Diagnostic and Interventional Radiology, University Hospital Zurich, University of Zurich, Zurich, Switzerland
- 2Department of Cardiology, University Heart Center, University Hospital Zurich, University of Zurich, Zurich, Switzerland
Purpose: To assess the effect of ultra-high-resolution coronary CT angiography (CCTA) with photon-counting detector (PCD) CT on quantitative coronary plaque characterization.
Materials and methods: In this IRB-approved study, 22 plaques of 20 patients (7 women; mean age 77 ± 8 years, mean body mass index 26.1 ± 3.6 kg/m2) undergoing electrocardiography (ECG)-gated ultra-high-resolution CCTA with PCD-CT were included. Images were reconstructed with a smooth (Bv40) and a sharp (Bv64) vascular kernel, with quantum iterative reconstruction (strength level 4), and using a slice thickness of 0.6, 0.4, and 0.2 mm, respectively (field-of-view 200 mm × 200 mm, matrix size 512 × 512 pixels). Reconstructions with the Bv40 kernel and slice thickness of 0.6 mm served as the reference standard. After identification of a plaque in coronary arteries with a vessel diameter ≥2 mm, plaque composition was determined using a dedicated, semi-automated plaque quantification software. Total plaque, calcified, fibrotic, and lipid-rich plaque components were quantified in all datasets.
Results: Median plaque volume was highest (23.5 mm3, interquartiles 17.9–34.3 mm3) for reconstructions with the reference standard and lowest for ultra-high-resolution reconstructions with a slice thickness of 0.2 mm and the Bv64 kernel (18.1 mm3, interquartiles 14.1–25.8 mm3, p < 0.001). Reconstructions with the reference standard showed largest calcified (85.1%, interquartiles 76.4–91.1%) and smallest lipid-rich plaque components (0.5%, interquartiles 0.0–1.5%). Smallest calcified plaque components (75.2%, interquartiles 69.9–80.8%) and largest lipid-rich components (6.7%, interquartiles 5.1–8.4%) were found for ultra-high-resolution reconstructions with a slice thickness of 0.2 mm and the Bv64 kernel. At an identical slice thickness, volume of calcified components was always lower, and volume of lipid-rich components was always higher for reconstructions with the Bv64 kernel compared with reconstructions with the Bv40 kernel (all, p < 0.001).
Conclusion: This patient study indicates significant differences of ultra-high-resolution scanning with PCD-CT on quantitative coronary plaque characterization. Reduced blooming artifacts may allow improved visualization of fibrotic and lipid-rich plaque components with the ultra-high-resolution mode of PCD-CT.
Introduction
Coronary CT angiography (CCTA) is the primary imaging modality for the non-invasive anatomical assessment of coronary artery disease (1–5). CCTA provides an excellent visualization of atherosclerotic plaques and enables the characterization of certain coronary plaque types (2, 6–10). While macrocalcified plaques are considered to be relatively stable, low attenuation plaques, positive remodeling, the napkin ring sign, and spotty calcifications on CCTA have been associated with plaque instability (6, 7, 11). Moreover, total burden of low-attenuating coronary plaques has been identified as the strongest predictor of adverse coronary events in patients with acute and chronic coronary syndrome (6, 12). Thus, precise plaque characterization and quantification is decisive to accurately identify patients at risk for future cardiovascular events.
Current plaque characterization in clinical routine is often based on a pure, subjective visual assessment or on the measurement of plaque attenuation (6, 7, 13, 14). However, blooming artifacts may lead to an overestimation of the volume of calcified plaques and to difficulties in the delineation of adjacent, noncalcified components. In addition, precise separation of plaque borders to the adventitial layer and to the epicardial adipose tissue may be hampered because of only subtle attenuation differences between these structures (15).
Novel photon-counting detector CT (PCD-CT) offers the possibility to acquire ECG-gated ultra-high-resolution CCTA. The direct conversion process of detected X-ray photons used in PCD-CT optimizes the geometric dose efficiency, enabling a maximum in-plane resolution of 0.11 mm × 0.11 mm and a maximum through-plane resolution of 0.16 mm (16, 17). PCD-CT has been shown to outperform conventional energy-integrating detector CT with regard to the visualization of calcified and noncalcified plaques along with a significant reduction of blooming artifacts (16, 18). Considering ultra-high-resolution CCTA with PCD-CT, reconstruction parameters such as the slice thickness, matrix size, and reconstruction kernel need to be carefully chosen as they have a major influence on visualization of the coronary arteries and hence, on atherosclerotic wall changes (16).
The aim of this study was to assess the effect of reconstruction parameters on quantitative coronary plaque characterization in patients undergoing ultra-high-resolution CCTA with PCD-CT. Our hypothesis was that the high spatial resolution in combination with the optimal reconstruction kernel would enable a better visualization of coronary plaques with less blooming and improved delineation of non-calcified plaque components compared with standard reconstructions.
Materials and methods
Patients
Consecutive patients undergoing ultra-high-resolution CCTA prior to transcatheter aortic valve replacement between February and May 2022 were screened for study inclusion. Patients were included when atherosclerotic plaques in proximal coronary arteries with a vessel diameter equal to or larger than 2 mm were present.
This retrospective single-center study was approved by the local ethics committee and was performed in compliance with the declaration of Helsinki. All patients are part of a nation-wide TAVR registry (clinicalTrials.gov, Identifier: NCT01368250) and provided written informed consent.
CT data acquisition and image reconstruction
CT was performed on a whole-body, dual-source PCD-CT system (NAEOTOM Alpha; version syngo CT VA50; Siemens Healthcare GmbH; Forchheim, Germany) equipped with two cadmium telluride detectors. All patients were pretreated with sublingual nitroglycerin (2.5 mg isosorbide dinitrate). No beta-blockers for heart rate control were administered. Scan acquisition included an ECG-gated unenhanced cardiac scan for calcium scoring followed by an ECG-gated ultra-high-resolution CCTA and a thoracoabdominal CT aortography.
Ultra-high-resolution CCTA was initiated with bolus tracking by placing a region of interest (ROI) in the ascending aorta. Depending on the body weight of the patients, a total volume of 50–70 ml contrast material (Iopromide, Ultravist 370 mg iodine/ml, Bayer Healthcare, Berlin, Germany) was administered with a power injector at a weight-based flow rate of 3.3–4.4 ml/s through an 18-gauge needle placed into an antecubital vein. After contrast material injection, a saline chaser (NaCl 0.9%) of 20 ml was administered applying the same flow rate. Scan start was initiated after the attenuation within the ROI exceeded 140 Hounsfield units (HU) at 90 kV. Ultra-high-resolution CCTA image data was acquired with a retrospective ECG-gated dual-source helical (pitch 0.22–0.28 depending on the heart rate) or a prospective ECG-gated dual-source sequential mode. Scan parameters were as follows: tube voltage 120 kV, collimation 120 × 0.2 mm, tube current-time product at an image quality level of 64 using automated tube current modulation. The constant image quality level ensured similar image quality across different scan modes. Heart rate dependent ECG-pulsing was applied.
After selection of a cardiac phase with no motion artifacts, ultra-high-resolution CCTA images were reconstructed using three different slice thicknesses (0.6, 0.4, and 0.2 mm, respectively) and two kernels with different sharpness levels (smooth Bv40 kernel and sharp Bv64 kernel, respectively). Whole spectrum of detected photons employing a single energy threshold at 20 keV is used to reconstruct the ultra-high-resolution CCTAs. The Bv40 kernel is the default vascular kernel recommended by the manufacturer for CCTA, while the Bv64 was determined as the optimal kernel for the reconstruction of ultra-high-resolution CCTA in a previous study (16). Quantum iterative reconstruction (19) at a strength level of 4 was applied to all reconstructions. Field-of-view and matrix size were set to 200 mm × 200 mm and 512 × 512 pixels, respectively. The reconstruction with a slice thickness of 0.6 mm, increment of 0.3 mm, and using the default Bv40 kernel served as the reference standard for further comparisons.
Quantitative plaque analysis
Quantitative evaluation of atherosclerotic plaques was performed using a semiautomatic software (CT Coronary Plaque Analysis, software version 5.0.2, Syngo.via VB60A, Siemens Healthcare GmbH; Forchheim, Germany) (20), previously evaluated by Tesche et al. (21). After automatic centerline extraction of the coronary arteries, one trained reader (V.M., resident with three years of experience in cardiovascular imaging) manually defined the proximal and the distal aspect of the coronary artery segment with atherosclerotic plaque. In the next step, the software automatically detected the outer and inner vessel wall including the atherosclerotic plaque. If the segmentation was inaccurate, manual adjustments were performed by the reader. Finally, plaque constituents were assessed based on their attenuation using preset HU ranges. Non-calcified plaque components were considered as low-attenuating, lipid-rich when showing an attenuation between −100 and 29 HU and as intermediate, fibrotic when showing an attenuation between 30 and 189 HU (22, 23). Plaque components were considered calcified when showing an attenuation above 190 HU. Software output included the total plaque volume, volume and plaque ratio of the calcified, fibrotic, and lipid-rich components as well as a histogram displaying all CT attenuation values. Quantitative results were noted. If more atherosclerotic plaques were present in one coronary artery, only the most proximal plaque was considered. For each plaque, segmentation and characterization was performed on all six reconstructed datasets, carefully selecting identical proximal and distal aspects of the coronary artery segment. Figure 1 provides a representative example of the quantitative plaque analysis process.
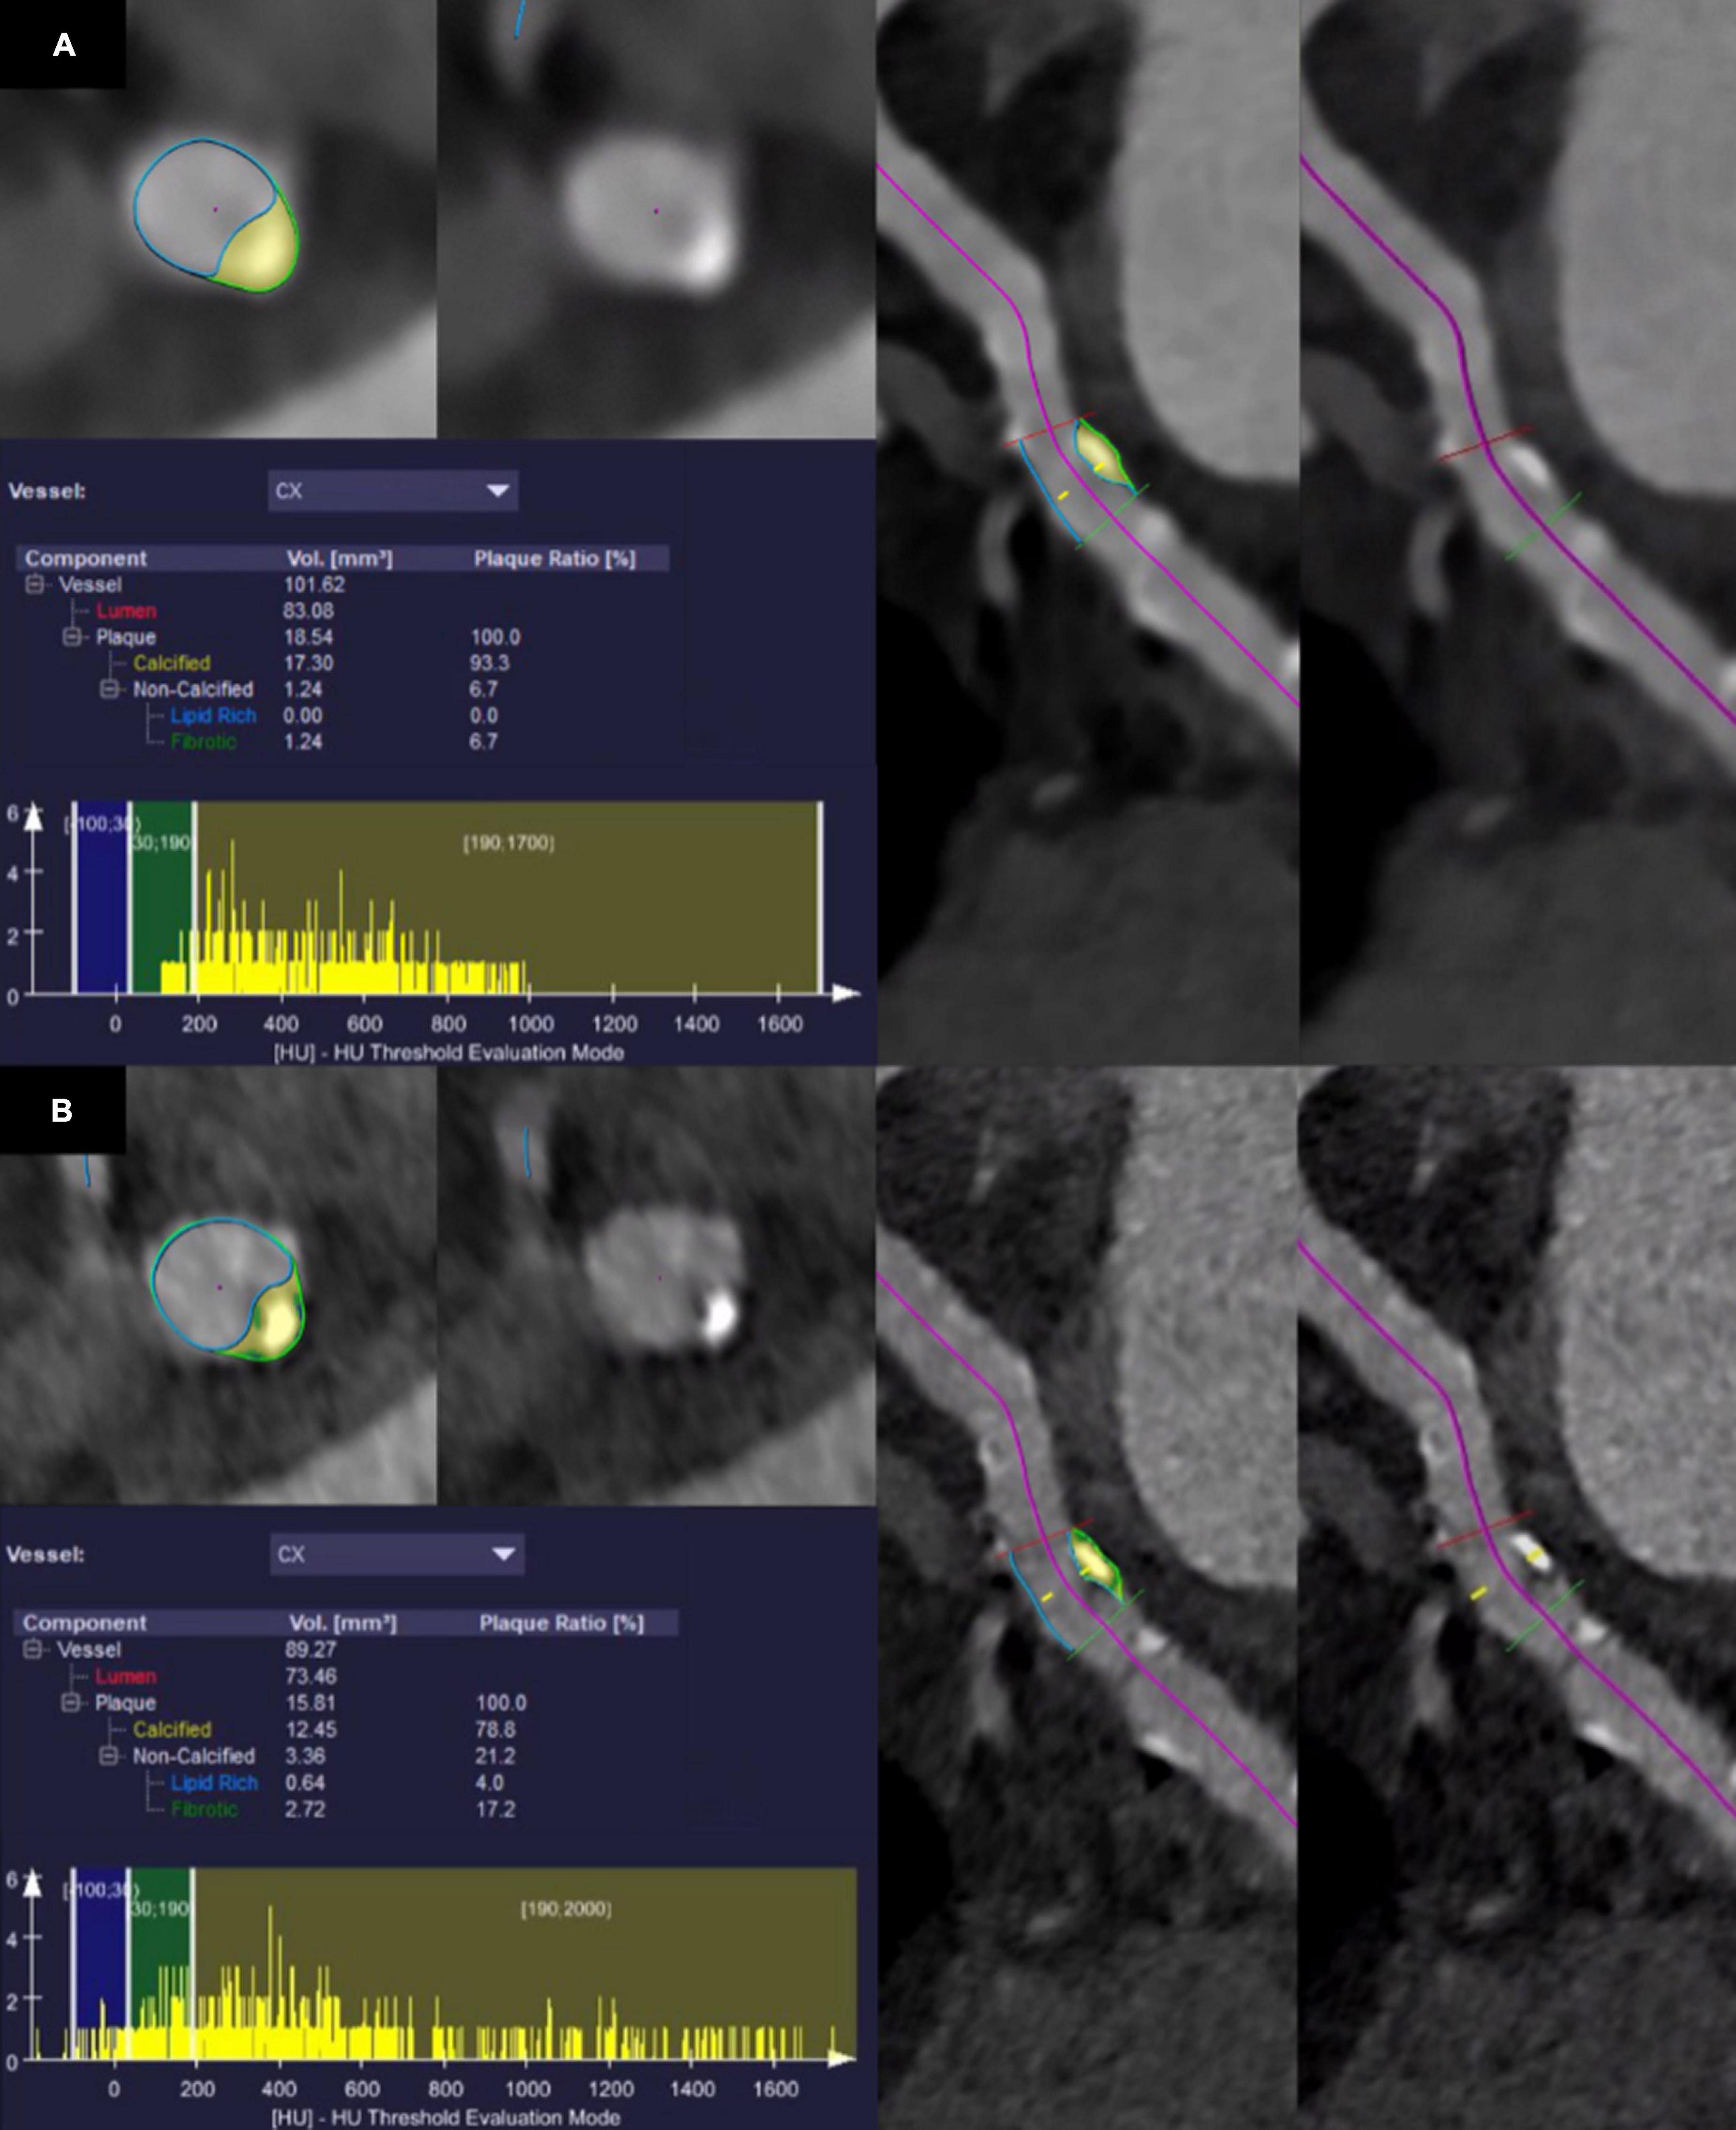
Figure 1. Segmentation and quantitative results of plaque characteristics in the circumflex artery of a 75-year-old male patient who underwent coronary CT angiography with photon-counting detector CT. Note the shift of CT values in the histogram towards lower values using ultra-high-resolution reconstructions with a slice thickness of 0.2 mm and the Bv64 kernel (B) compared with reconstructions with a slice thickness of 0.6 mm and the Bv40 kernel (A).
Statistical analysis
Continuous variables were assessed by Shapiro–Wilk tests for normal distribution. Normally distributed variables are presented as mean ± SD, whereas non-normally distributed variables are reported as median and interquartiles. Friedman tests followed by Wilcoxon-tests served to check for differences in non-normally distributed values. The Benjamini–Hochberg procedure was applied to adjust for multiple comparisons. A two-tailed p-value < 0.05 was considered to infer statistical significance. Categorical variables are reported as counts and percentages. All statistical analyses were performed using R statistical software (R, version 4.1.1; R Foundation for Statistical Computing, Vienna, Austria1).
Results
Among 25 patients undergoing ultra-high-resolution CCTA with PCD-CT, 3 patients were excluded because of the absence of atherosclerotic plaques in the proximal coronary arteries and 2 patients were excluded because of extensive calcified plaques in the proximal coronary arteries that extended to distal segments. No patients were excluded because of other criteria (e.g., motion artifacts). Finally, a total of 22 plaques from 20 patients were included (7 women, 13 men, mean age 77 ± 8 years, mean body mass index 26.1 ± 3.6 kg/m2). Nine scans were acquired with retrospective ECG-gating [mean volume CT dose index (CTDIvol) 36.8 ± 6.3 mGy]; 11 scans were acquired with prospective ECG-gating (mean CTDIvol 28.1 ± 6.8 mGy). The average heart rate was 69 ± 15 beats per minute during data acquisition. Patient demographics are shown in Table 1. Eight out of 20 patients were also included in the patient sample of our previous study on image reconstruction parameters of ultra-high-resolution CCTA (16).
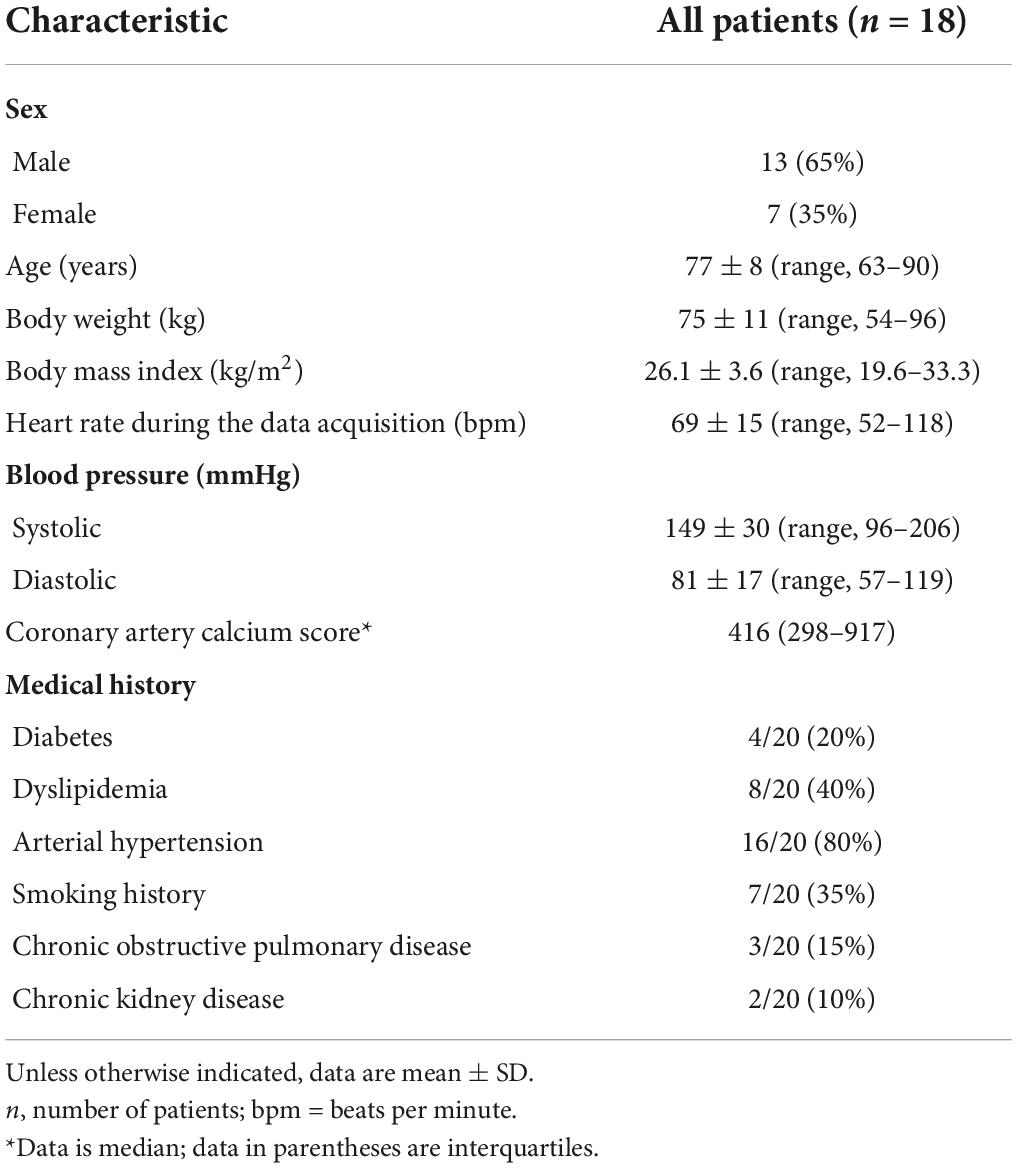
Table 1. Patient demographics.
Quantitative plaque analysis
Twenty-two plaques in six image datasets each were analyzed. Two plaques were located in the left main artery, eight plaques in the left anterior descending artery, five plaques in the circumflex artery, and seven plaques in the right coronary artery. A summary of the quantitative results is shown in Table 2. Total plaque volume (p < 0.001) and volume of calcified (p < 0.001), fibrotic (p = 0.003), and lipid rich components (p < 0.001) significantly differed across all reconstructions (Figure 2). Median total plaque volume was highest for reconstructions with the reference standard (slice thickness 0.6 mm and Bv40 kernel: 23.5 mm3, interquartiles 17.9–34.3 mm3) and smallest for ultra-high-resolution reconstructions with a slice thickness of 0.2 mm and the Bv64 kernel (18.1 mm3, interquartiles 14.1–25.8 mm3, p < 0.001, post hoc Wilcoxon test). Total plaque volume and volume of calcified components were on average 23 ± 6% and 32 ± 7% lower on reconstructions with a slice thickness of 0.2 mm and the Bv64 kernel compared with the reference standard. At identical slice thickness, volume of calcified components was always lower and volume of lipid-rich components was always higher (all, p < 0.001, post hoc Wilcoxon tests) while volume of fibrotic components was similar (all, p > 0.05, post hoc Wilcoxon tests) on reconstructions with the Bv64 kernel compared with reconstructions with the Bv40 kernel.
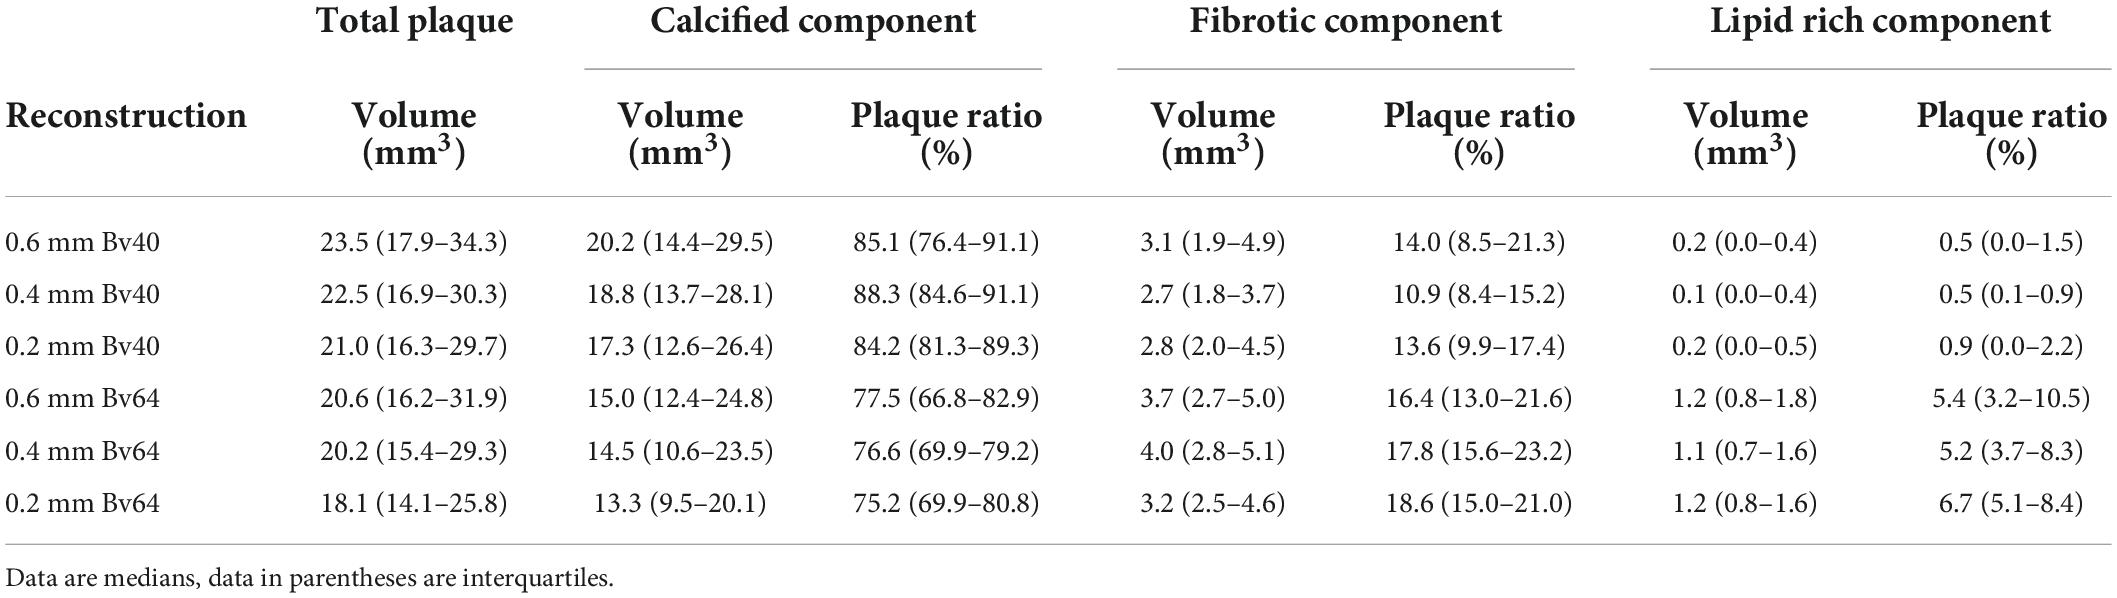
Table 2. Results of quantitative plaque analysis.
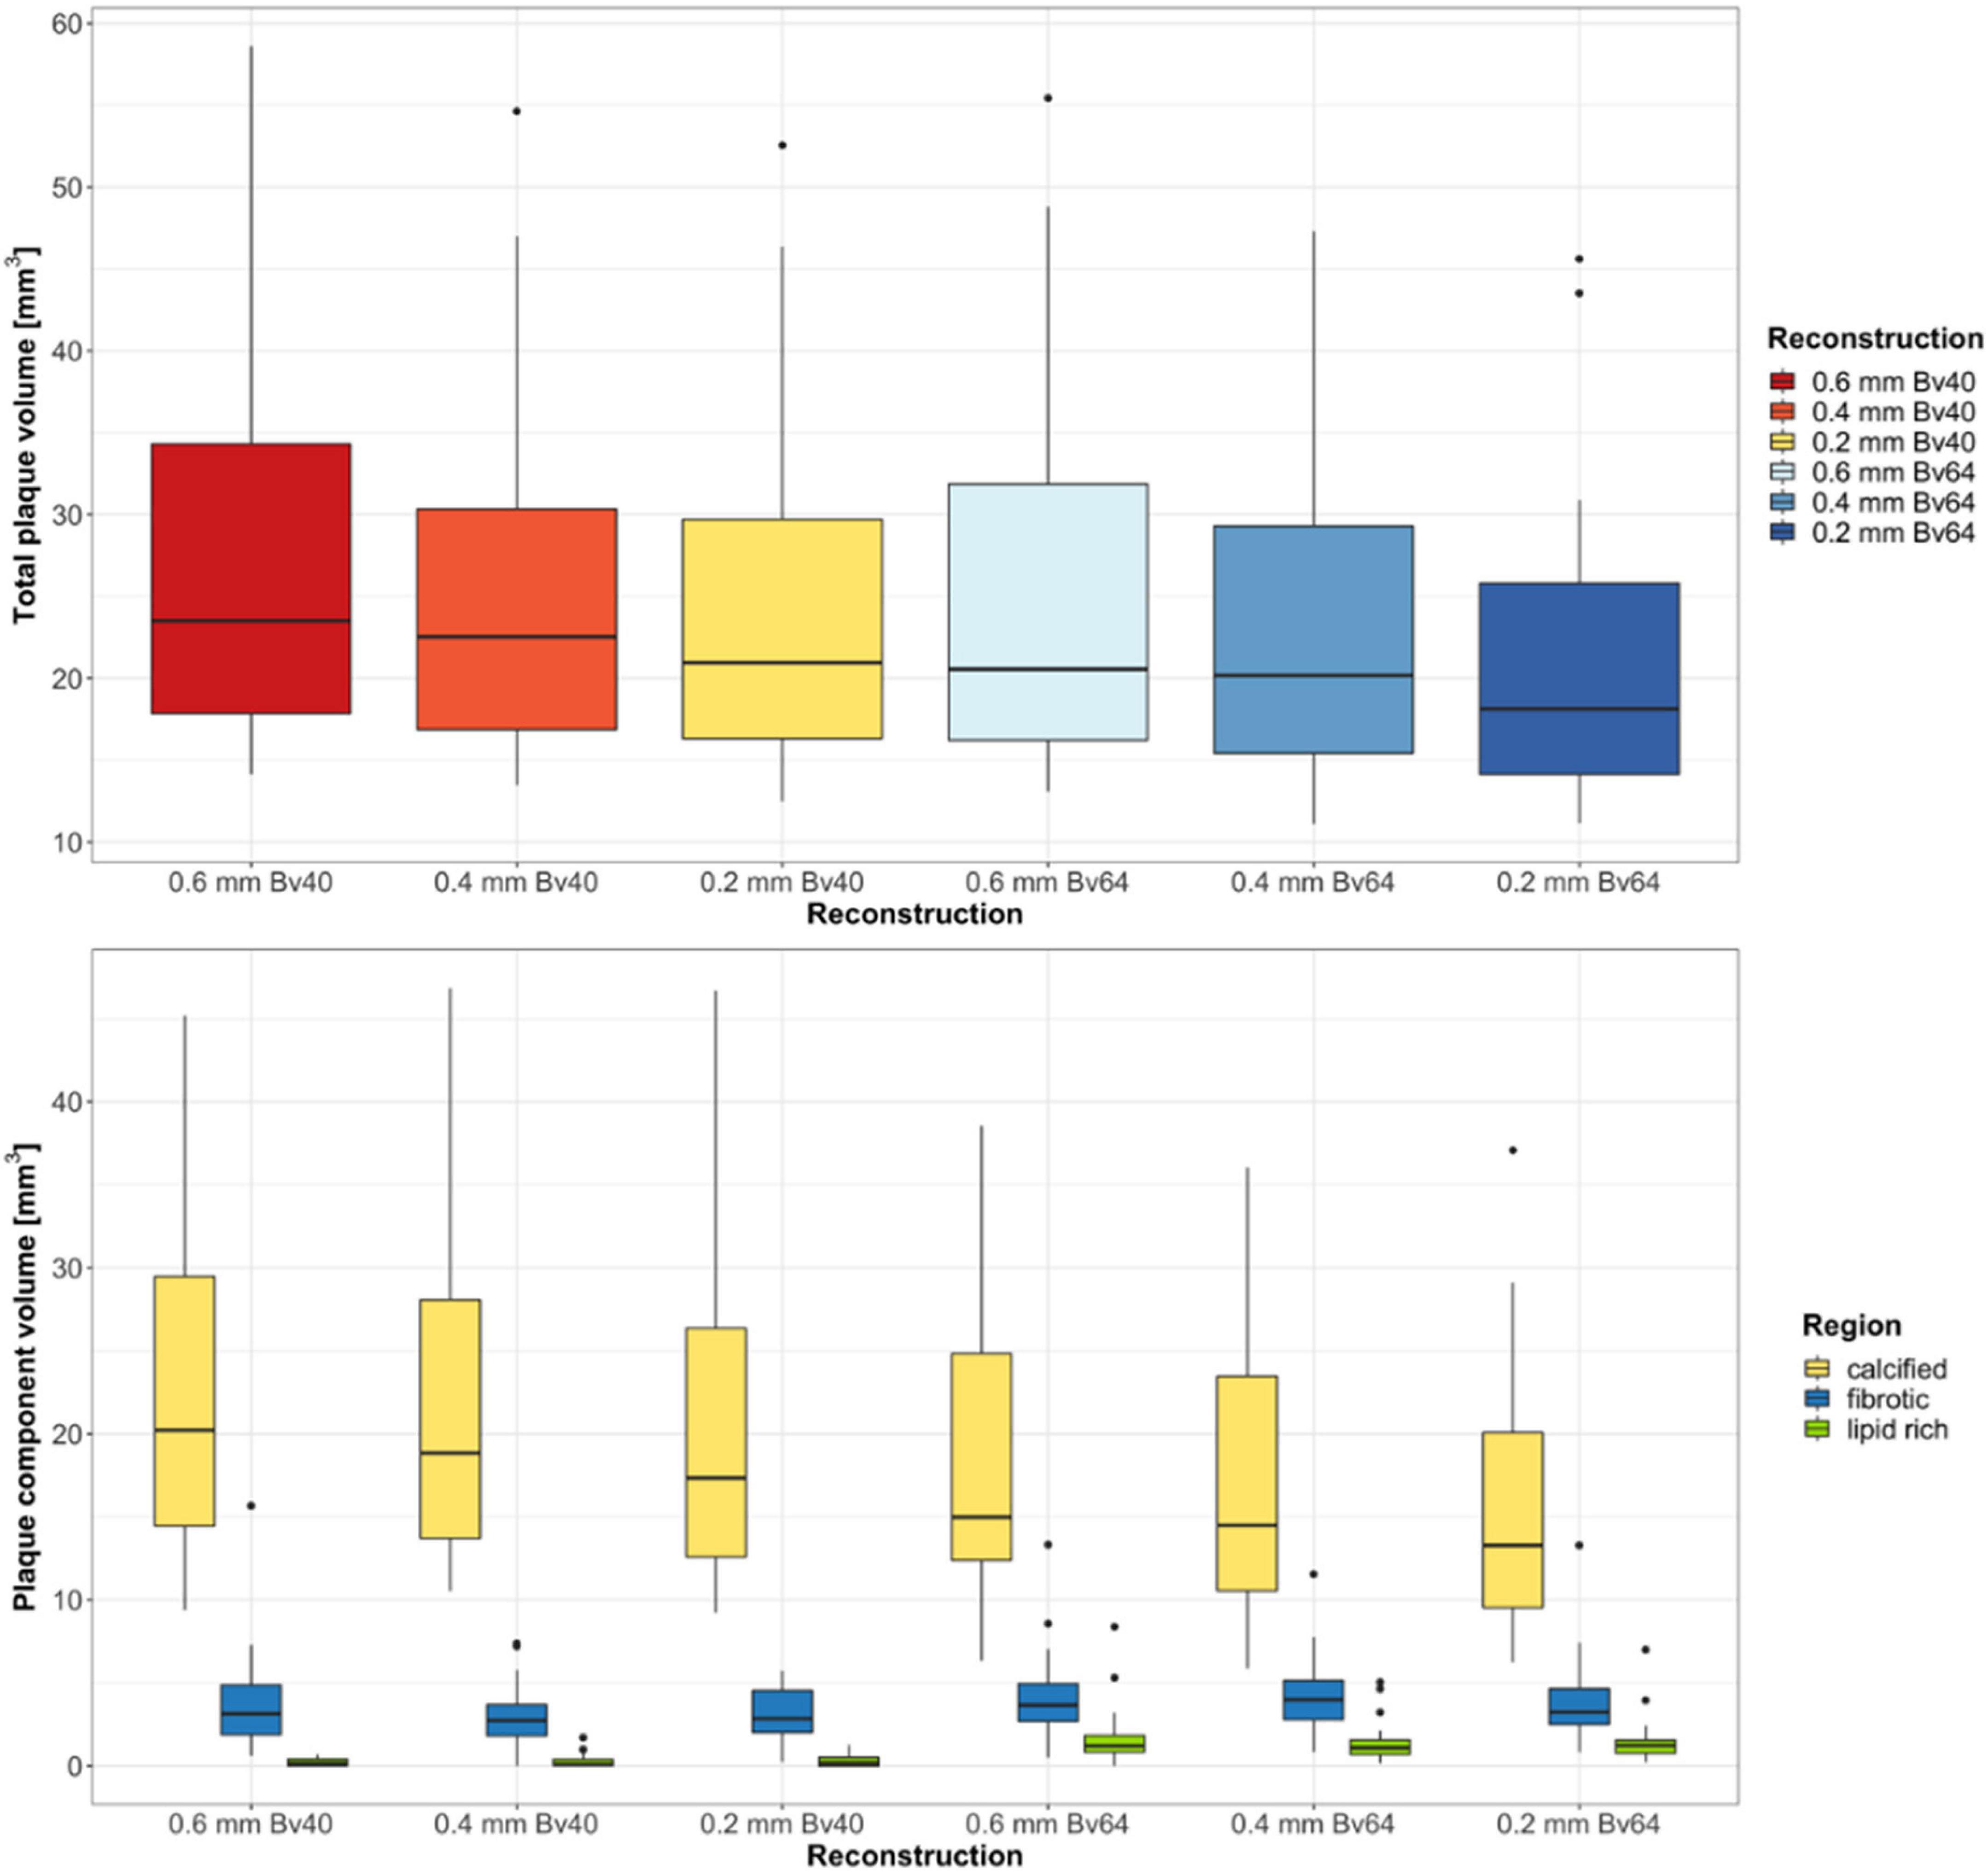
Figure 2. Results of the quantitative plaque analysis. Boxplots at the top show the total plaque volume and boxplots at the bottom depict the volume of the different plaque components determined on reconstructions with three different slice thicknesses and two different kernel strengths. Horizontal lines in the boxes indicate the median, and the top and bottom lines of boxes indicate the first and third quartiles, respectively. Whiskers show lowest and highest values within 1.5 interquartile range of the lower and upper limits, and circles indicate outliers.
Reconstructions with the reference standard yielded the highest ratio of calcified (85.1%, interquartiles 76.4–91.1%) and the lowest ratio of lipid-rich plaque components (0.5%, range 0.0–1.5%). Lowest ratio of calcified plaque components (75.2%, interquartiles 69.9–80.8%) and highest ratio of lipid rich components (6.7%, interquartiles 5.1–8.4%) were found for reconstructions with a slice thickness of 0.2 mm and the Bv64 kernel.
A representative example of improved plaque visualization along with the differences in the automated segmentation of different plaque components is shown in Figure 3.
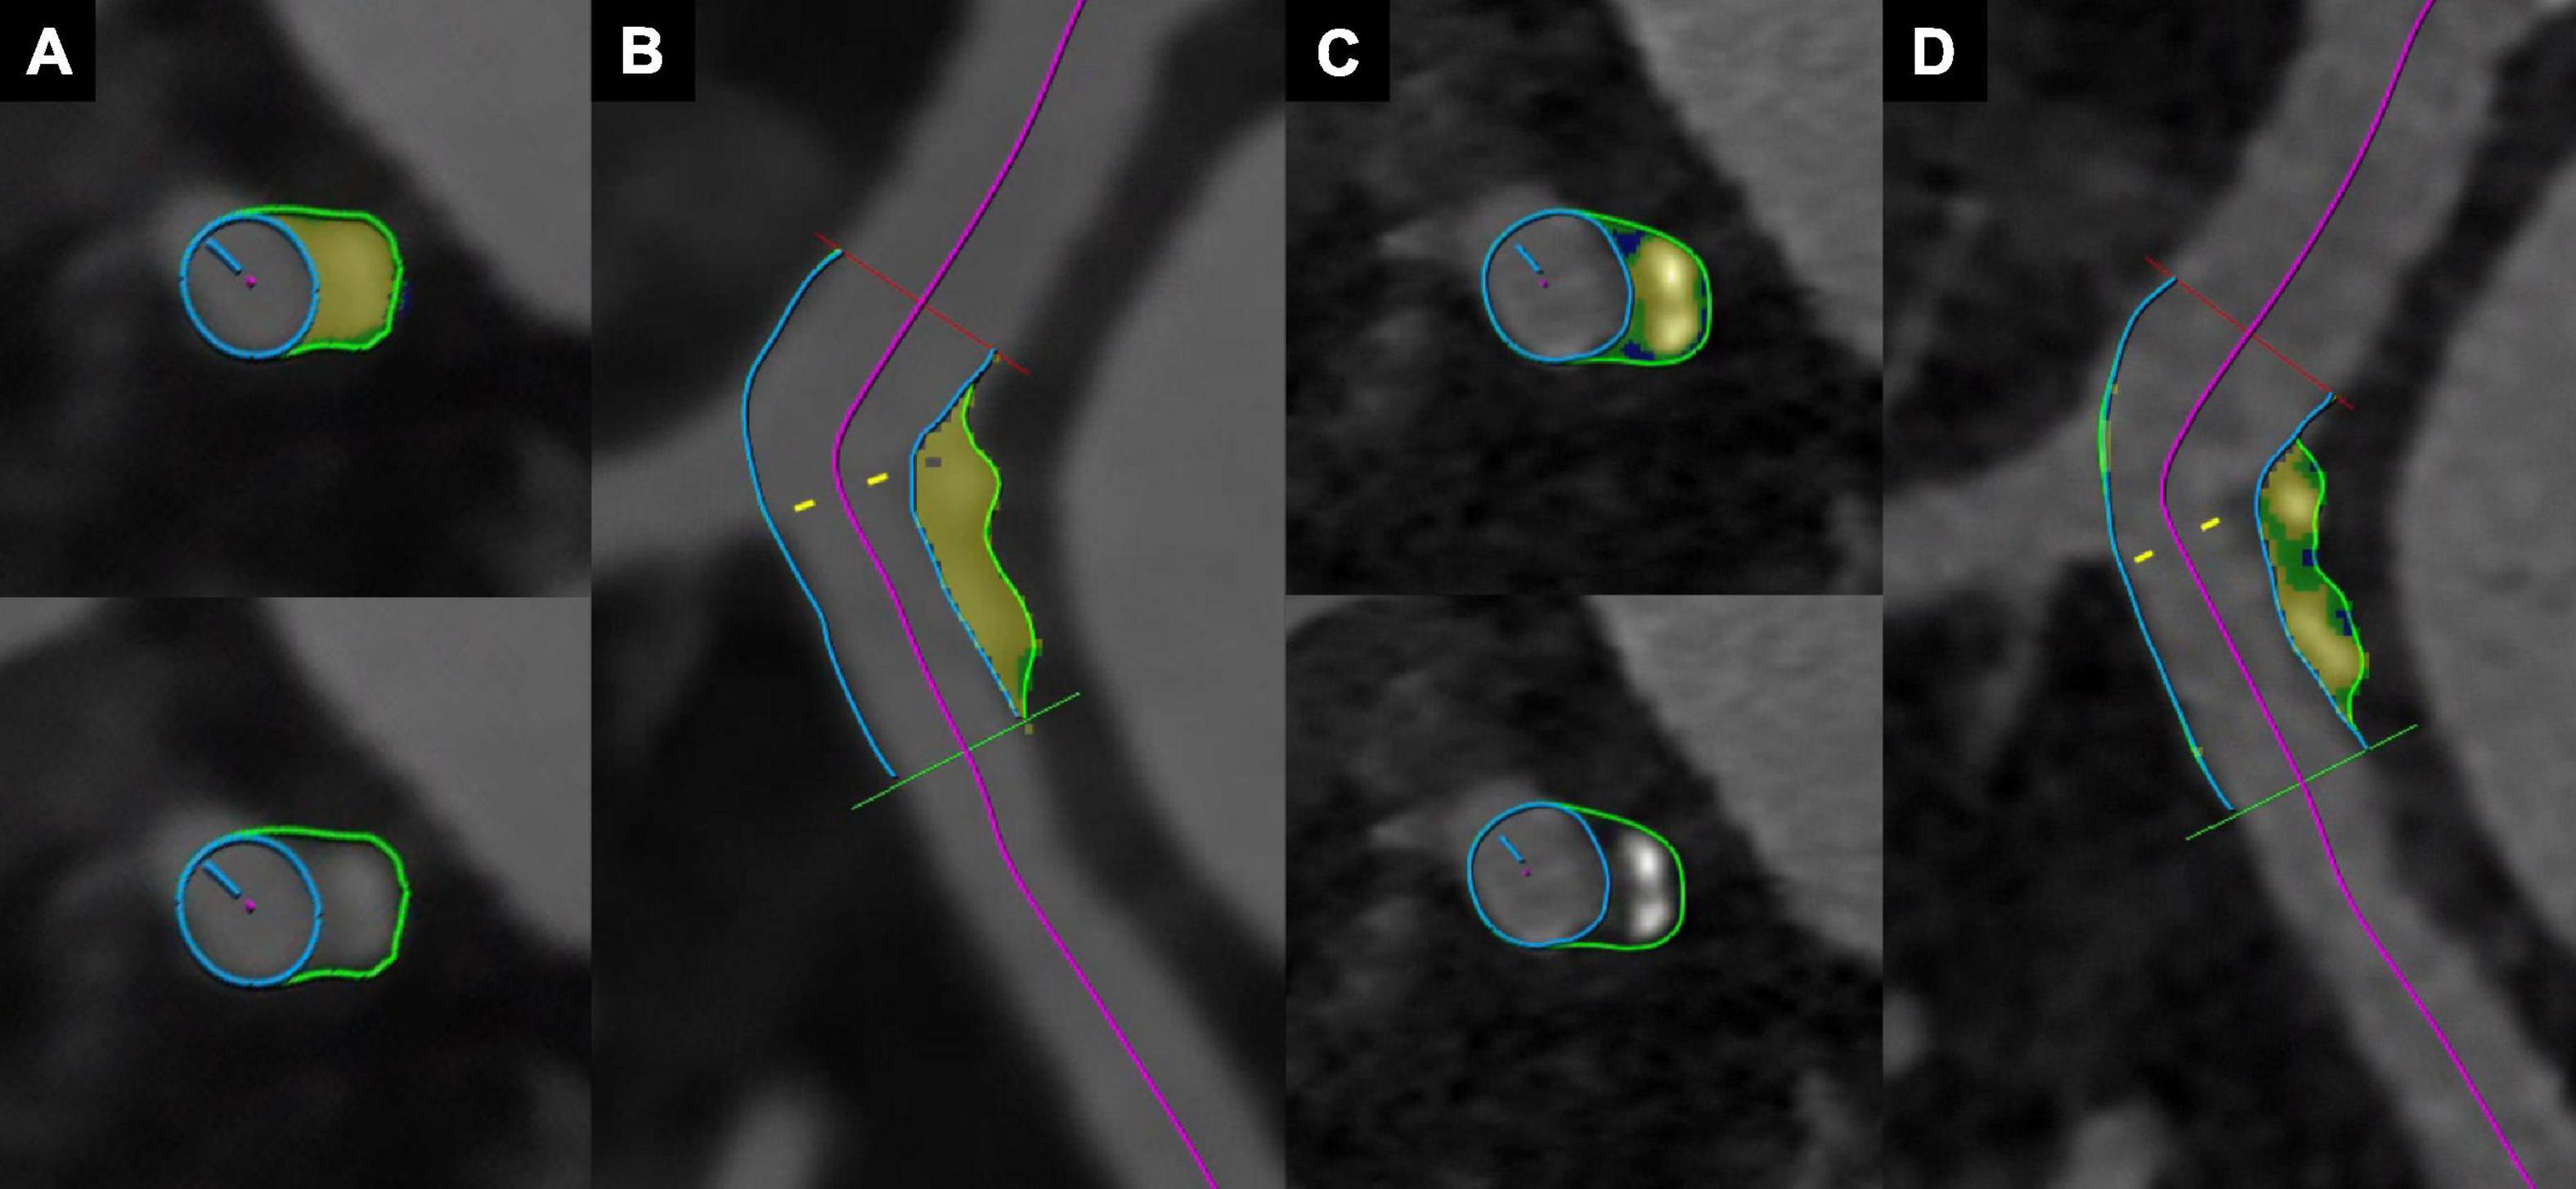
Figure 3. Coronary CT angiography with photon-counting detector CT of an 88-year-old male patient. Images show a mixed plaque reconstructed with a slice thickness of 0.6 mm and the Bv40 kernel (A,B), and with a slice thickness of 0.2 mm and the Bv64 kernel (C,D). Note the improved visualization of non-calcified components (blue color corresponds to lipid rich components, green color to fibrotic components, and yellow color to calcified components) at a slice thickness of 0.2 mm with the Bv64 kernel (C,D).
Discussion
CT-based coronary plaque characterization and quantification may help to identify patients at risk for future adverse cardiac events (6, 7, 12, 24, 25). PCD-CT allows for the acquisition of CCTA image data with a high in-plane and through-plane resolution of 0.11 mm × 0.11 mm and 0.16 mm, respectively. In this study, we evaluated the effect of spatial resolution in combination with various reconstruction kernels on quantitative plaque characterization using ultra-high-resolution CCTA. Our results indicate significantly lower total plaque volumes and significantly lower calcified plaque components on ultra-high-resolution reconstructions with a slice thickness of 0.2 mm and using the Bv64 kernel as compared with reference standard reconstructions. Interestingly, the volume of non-calcified plaque (i.e., both fibrotic and lipid-rich) components was highest on ultra-high-resolution reconstructions with the thinnest slice thickness and with the sharp vascular kernel.
The clinical PCD-CT system allows for two acquisition modes for ECG-gated CCTA, i.e., the ultra-high-resolution mode and the spectral (QuantumPlus) mode. The ultra-high-resolution mode used in this study is characterized by a so-far unprecedented spatial resolution for clinical CT when applying a collimation of 120 × 0.2 mm. Detector pixels are read out separately and so-called “T3D” images are reconstructed employing the whole spectrum of absorbed photons and using a single energy threshold at 20 keV(16, 26). Currently, this mode does not allow for collecting additional spectral information. The spectral (QuantumPlus) mode generates spectral information, while the spatial resolution is limited to a collimation of 144 × 0.4 mm (27). CCTA with spectral information enables the computation of virtual noniodine images (PureCalcium), potentially obviating the need for true noncontrast scans (28) and for the reconstruction of images with a virtual, dual energy-based removal of calcified plaques (PureLumen), potentially facilitating coronary artery stenosis assessment (29). The spectral mode enables also the dual energy-based characterization of plaque components (20), which would be a potential advantage compared with the ultra-high-resolution mode. In an experimental study, PCD-CT operated in a multi-energy mode even allowed for the detection and quantification of the macrophage burden within calcified atherosclerotic plaques using gold nanoparticles (30).
Mergen et al. were the first to assess the feasibility of ultra-high-resolution PCD-CCTA in patients and to perform a systematic evaluation of the optimal reconstruction parameters including slice thickness and reconstruction kernel (16). They observed that slice thickness as well as the reconstruction kernel had a major impact on vessel sharpness as well as blooming artifacts. Based on their quantitative and qualitative results, they identified the Bv64 kernel to be the optimal kernel for the reconstruction of ultra-high-resolution CCTA. Findings of this previous study formed the rationale to investigate the influence of slice thickness on plaque characterization applying the Bv40 and the Bv64 kernel.
In our study, total plaque volume and volume of calcified plaque components was smallest on reconstructions with a slice thickness of 0.2 mm and the Bv64 kernel. This suggests that higher spatial resolution results in lower blooming artifacts from calcium. These results are consistent with a study of Si-Mohamed et al. in which image quality and diagnostic confidence of CCTA acquired with conventional CT and with a prototype PCD-CT system were compared (18). These authors observed a significant reduction of blooming artifacts and a considerable improvement in the visualization of noncalcified plaques on CCTA images using PCD-CT with a slice thickness of 0.25 mm.
Subtle plaque characteristics on CCTA such as low attenuation plaque components, positive remodeling, spotty calcifications, and the napkin-ring sign type have been identified as features of high-risk plaques (7, 11, 31). It is important to mention that virtually all calcified plaques have non-calcified plaque components as well (32). This is corroborated by the recent findings of Yin et al. who identified four unstable plaques on histopathology that appeared as purely calcified plaques on CCTA (33). Thus, it must be the aim to reduce blooming artifacts in CCTA for visualization of non-calcified components. In our study, we found the highest volume of lipid-rich plaque components on ultra-high-resolution reconstructions (slice thickness 0.2 mm, Bv64 kernel), whereas smallest were found in the reference standard reconstructions. Thus, ultra-high-resolution CCTA with PCD-CT has the potential to improve patient risk stratification.
It should be noted that all available thresholds for morphometric plaque analysis were established for standard resolution CCTA acquired with conventional energy-integrating detector CT and reconstructed as polychromatic images (22, 23). Although T3D images of PCD-CT emulate polychromatic images of EID-CT (34), thresholds have not yet been validated for PCD-CT.
The following study limitations merit consideration. First, this single-center retrospective study encompassed only a limited number of plaques and patients. Second, differentiation of plaque components was entirely based on quantitative CT attenuation differences and lacks correlation to intravascular ultrasound or intravascular optical coherence tomography. Third, no outcome data was available in our patients. Fourth, all ultra-high-resolution images were reconstructed using QIR at a strength level of 4, and the influence of different QIR strength levels on plaque characterization was not analyzed. Fifth, we did not evaluate the reproducibility of plaque quantification with the software tool used in our study. Finally, patients included in this study had a stable coronary artery disease with a high burden of coronary artery calcifications (median coronary artery calcium score of 456). In a patient sample presenting with acute chest pain or acute coronary syndrome divergent results with a higher ratio of noncalcified plaque components are to be expected.
Conclusion
In conclusion, ultra-high-resolution CCTA with PCD-CT using ultra-high-resolution reconstructions (slice thickness 0.2 mm) and using a sharp vascular kernel (Bv64) yield smallest calcified and largest non-calcified coronary plaque components, which suggests reduced blooming artifacts and better visualization of non-calcified plaque components, the latter being considered important for individualized risk prediction. Certainly, future studies in a larger patient cohort with comparison of the ultra-high-resolution mode with intravascular ultrasound, intravascular optical coherence tomography, or histopathology are needed. In addition, the potential improvement for optimized risk prediction of this scan mode in comparison with conventional, energy-integrating detector CT should be addressed.
Data availability statement
The raw data supporting the conclusions of this article will be made available by the authors, without undue reservation.
Ethics statement
The studies involving human participants were reviewed and approved by the Kantonale Ethikkommission Zürich. The patients/participants provided their written informed consent to participate in this study.
Author contributions
HA and VM conceived this study design. VM performed data collection, image analysis, statistical analysis, interpreted the data, and prepared manuscript draft. HA supervised this study, interpreted the data, and prepared manuscript draft. ME, RM, and AE prepared manuscript draft. All authors contributed to the article and approved the submitted version.
Acknowledgments
We thank Felix Denzinger, employee of Siemens Healthcare GmbH, Forchheim, Germany, for his support during the plaque analysis.
Conflict of interest
The authors declare that the research was conducted in the absence of any commercial or financial relationships that could be construed as a potential conflict of interest.
Publisher’s note
All claims expressed in this article are solely those of the authors and do not necessarily represent those of their affiliated organizations, or those of the publisher, the editors and the reviewers. Any product that may be evaluated in this article, or claim that may be made by its manufacturer, is not guaranteed or endorsed by the publisher.
Footnotes
References
1. Channon KM, Newby DE, Nicol ED, Deanfield J. Cardiovascular computed tomography imaging for coronary artery disease risk: plaque, flow and fat. Heart. (2022). doi: 10.1136/heartjnl-2021-320265 [Epub ahead of print].
2. Meah MN, Maurovich-Horvat P, Williams MC, Newby DE. Debates in cardiac CT: coronary CT angiography is the best test in asymptomatic patients. J Cardiovasc Comput Tomogr. (2022) 16:290–3. doi: 10.1016/j.jcct.2022.02.001
3. Knuuti J, Wijns W, Saraste A, Capodanno D, Barbato E, Funck-Brentano C, et al. 2019 ESC guidelines for the diagnosis and management of chronic coronary syndromes: the task force for the diagnosis and management of chronic coronary syndromes of the European Society of Cardiology (ESC). Eur Heart J. (2020) 41:407–77. doi: 10.1016/10.1093/eurheartj/ehz425
4. Schwartz FR, Koweek LM, Nørgaard BL. Current evidence in cardiothoracic imaging: computed tomography-derived fractional flow reserve in stable chest pain. J Thorac Imaging. (2019) 34:12–7. doi: 10.1097/rti.0000000000000369
5. Maurovich-Horvat P, Bosserdt M, Kofoed KF, Rieckmann N, Benedek T, Donnelly P, et al. CT or invasive coronary angiography in stable chest pain. N Engl J Med. (2022) 386:1591–602. doi: 10.1056/NEJMoa2200963
6. Williams MC, Kwiecinski J, Doris M, McElhinney P, D’Souza MS, Cadet S, et al. Low-attenuation noncalcified plaque on coronary computed tomography angiography predicts myocardial infarction: results from the multicenter scot-heart trial (Scottish computed tomography of the heart). Circulation. (2020) 141:1452–62. doi: 10.1161/circulationaha.119.044720
7. Motoyama S, Sarai M, Harigaya H, Anno H, Inoue K, Hara T, et al. Computed tomographic angiography characteristics of atherosclerotic plaques subsequently resulting in acute coronary syndrome. J Am Coll Cardiol. (2009) 54:49–57. doi: 10.1016/j.jacc.2009.02.068
8. Szilveszter B, Vattay B, Bossoussou M, Vecsey-Nagy M, Simon J, Merkely B, et al. CAD-RADS may underestimate coronary plaque progression as detected by serial CT Angiography. Eur Heart J Cardiovasc Imaging. (2021). doi: 10.1093/ehjci/jeab215 [Epub ahead of print].
9. Bittner DO, Mayrhofer T, Budoff M, Szilveszter B, Foldyna B, Hallett TR, et al. Prognostic value of coronary CTA in stable chest pain: CAD-RADS, CAC, and cardiovascular events in promise. JACC Cardiovasc Imaging. (2020) 13:1534–45. doi: 10.1016/j.jcmg.2019.09.012
10. Brandt V, Bekeredjian R, Schoepf UJ, Varga-Szemes A, Emrich T, Aquino GJ, et al. Prognostic value of epicardial adipose tissue volume in combination with coronary plaque and flow assessment for the prediction of major adverse cardiac events. Eur J Radiol. (2022) 148:110157. doi: 10.1016/j.ejrad.2022.110157
11. Maurovich-Horvat P, Hoffmann U, Vorpahl M, Nakano M, Virmani R, Alkadhi H. The napkin-ring sign: CT signature of high-risk coronary plaques? JACC Cardiovasc Imaging. (2010) 3:440–4. doi: 10.1016/j.jcmg.2010.02.003
12. Meah MN, Tzolos E, Wang K-L, Bularga A, Dweck MR, Curzen N, et al. Plaque burden and 1-year outcomes in acute chest pain: results from the multicenter rapid-CTCA trial. JACC Cardiovasc Imaging. (2022).
13. Hoffmann U, Moselewski F, Nieman K, Jang IK, Ferencik M, Rahman AM, et al. Noninvasive assessment of plaque morphology and composition in culprit and stable lesions in acute coronary syndrome and stable lesions in stable angina by multidetector computed tomography. J Am Coll Cardiol. (2006) 47:1655–62. doi: 10.1016/j.jacc.2006.01.041
14. Bittner DO, Mayrhofer T, Puchner SB, Lu MT, Maurovich-Horvat P, Ghemigian K, et al. Coronary computed tomography angiography-specific definitions of high-risk plaque features improve detection of acute coronary syndrome. Circ Cardiovasc Imaging. (2018) 11:e007657. doi: 10.1161/circimaging.118.007657
15. Liu H, Wingert A, Wang J, Zhang J, Wang X, Sun J, et al. Extraction of coronary atherosclerotic plaques from computed tomography imaging: a review of recent methods. Front Cardiovasc Med. (2021) 8:597568. doi: 10.3389/fcvm.2021.597568
16. Mergen V, Sartoretti T, Baer-Beck M, Schmidt B, Petersilka M, Wildberger JE, et al. Ultra-high-resolution coronary CT angiography with photon-counting detector CT: feasibility and image characterization. Invest Radiol. (2022). doi: 10.1097/rli.0000000000000897 [Epub ahead of print].
17. Flohr T, Petersilka M, Henning A, Ulzheimer S, Ferda J, Schmidt B. Photon-counting CT review. Phys Med. (2020) 79:126–36. doi: 10.1016/j.ejmp.2020.10.030
18. Si-Mohamed SA, Boccalini S, Lacombe H, Diaw A, Varasteh M, Rodesch PA, et al. Coronary CT angiography with photon-counting CT: first-in-human results. Radiology. (2022) 303:303–13. doi: 10.1148/radiol.211780
19. Sartoretti T, Landsmann A, Nakhostin D, Eberhard M, Röeren C, Mergen V, et al. Quantum iterative reconstruction for abdominal photon-counting detector CT improves image quality. Radiology. (2022) 303:339–48. doi: 10.1148/radiol.211931
20. Denzinger F, Wels M, Hopfgartner C, Lu J, Schöbinger M, Maier A, et al. Coronary plaque analysis for CT angiography clinical research. In: C Palm, TM Deserno, H Handels, A Maier, K Maier-Hein, T Tolxdorff editors. Bildverarbeitung Für Die Medizin. Wiesbaden: Springer (2021). p. 223–8.
21. Tesche C, De Cecco CN, Caruso D, Baumann S, Renker M, Mangold S, et al. Coronary CT angiography derived morphological and functional quantitative plaque markers correlated with invasive fractional flow reserve for detecting hemodynamically significant stenosis. J Cardiovasc Comput Tomogr. (2016) 10:199–206. doi: 10.1016/j.jcct.2016.03.002
22. Opolski MP, Kepka C, Achenbach S, Pregowski J, Kruk M, Staruch AD, et al. Advanced computed tomographic anatomical and morphometric plaque analysis for prediction of fractional flow reserve in intermediate coronary lesions. Eur J Radiol. (2014) 83:135–41. doi: 10.1016/j.ejrad.2013.10.005
23. Sun J, Zhang Z, Lu B, Yu W, Yang Y, Zhou Y, et al. Identification and quantification of coronary atherosclerotic plaques: a comparison of 64-MDCT and intravascular ultrasound. AJR Am J Roentgenol. (2008) 190:748–54. doi: 10.2214/ajr.07.2763
24. Shaw LJ, Blankstein R, Bax JJ, Ferencik M, Bittencourt MS, Min JK, et al. Society of cardiovascular computed tomography / north american society of cardiovascular imaging – Expert consensus document on coronary ct imaging of atherosclerotic plaque. J Cardiovasc Comput Tomogr. (2021) 15:93–109. doi: 10.1016/j.jcct.2020.11.002
25. Eberhard M, Hinzpeter R, Schönenberger ALN, Euler A, Kuzo N, Reeve K, et al. Incremental prognostic value of coronary artery calcium score for predicting all-cause mortality after transcatheter aortic valve replacement. Radiology. (2021) 301:105–12. doi: 10.1148/radiol.2021204623
26. Sartoretti T, Racine D, Mergen V, Jungblut L, Monnin P, Flohr TG, et al. Quantum iterative reconstruction for low-dose ultra-high-resolution photon-counting detector CT of the lung. Diagnostics (Basel). (2022) 12:522. doi: 10.3390/diagnostics12020522
27. Mergen V, Ried E, Allmendinger T, Sartoretti T, Higashigaito K, Manka R, et al. Epicardial adipose tissue attenuation and fat attenuation index: phantom study and in-vivo measurements with photon-counting CT. AJR Am J Roentgenol. (2021) 218:822–29. doi: 10.2214/ajr.21.26930
28. Emrich T, Aquino G, Schoepf UJ, Braun F, Woznicki P, Decker JA, et al. Coronary CTA-based calcium scoring: in-vitro and in-vivo validation of a novel virtual non-iodine reconstruction algorithm on a clinical, first generation photon counting-detector system. Invest Radiol. (2022) 57:536–43. doi: 10.1097/RLI.0000000000000868
29. Allmendinger T, Nowak T, Flohr T, Klotz E, Hagenauer J, Alkadhi H, et al. Photon-counting detector CT-based vascular calcium removal algorithm: assessment using a cardiac motion phantom. Invest Radiol. (2022) 57:399–405. doi: 10.1097/rli.0000000000000853
30. Si-Mohamed SA, Sigovan M, Hsu JC, Tatard-Leitman V, Chalabreysse L, Naha PC, et al. In vivo molecular K-edge imaging of atherosclerotic plaque using photon-counting CT. Radiology. (2021) 300:98–107. doi: 10.1148/radiol.2021203968
31. Motoyama S, Kondo T, Sarai M, Sugiura A, Harigaya H, Sato T, et al. Multislice computed tomographic characteristics of coronary lesions in acute coronary syndromes. J Am Coll Cardiol. (2007) 50:319–26. doi: 10.1016/j.jacc.2007.03.044
32. Pundziute G, Schuijf JD, Jukema JW, Decramer I, Sarno G, Vanhoenacker PK, et al. Head-to-head comparison of coronary plaque evaluation between multislice computed tomography and intravascular ultrasound radiofrequency data analysis. JACC Cardiovasc Interv. (2008) 1:176–82. doi: 10.1016/j.jcin.2008.01.007
33. Yin WH, Wang HY, Sun Y, Li XN, Lu ZF, An YQ, et al. Unstable plaques hide in heavily calcified coronary arteries. Quant Imaging Med Surg. (2022) 12:2744–54. doi: 10.21037/qims-21-521
34. Euler A, Higashigaito K, Mergen V, Sartoretti T, Zanini B, Schmidt B, et al. High-pitch photon-counting detector computed tomography angiography of the aorta: intraindividual comparison to energy-integrating detector computed tomography at equal radiation dose. Invest Radiol. (2021). doi: 10.1097/rli.0000000000000816
Keywords: coronary computed tomographic angiography (CCTA), coronary artery disease, high risk plaque, ultra-high-resolution CT, photon-counting detector CT (PCD-CT)
Citation: Mergen V, Eberhard M, Manka R, Euler A and Alkadhi H (2022) First in-human quantitative plaque characterization with ultra-high resolution coronary photon-counting CT angiography. Front. Cardiovasc. Med. 9:981012. doi: 10.3389/fcvm.2022.981012
Received: 29 June 2022; Accepted: 18 August 2022;
Published: 06 September 2022.
Edited by:
Akos Varga-Szemes, Medical University of South Carolina, United StatesReviewed by:
Martin Willemink, Stanford University, United StatesTilman Emrich, Johannes Gutenberg University Mainz, Germany
Copyright © 2022 Mergen, Eberhard, Manka, Euler and Alkadhi. This is an open-access article distributed under the terms of the Creative Commons Attribution License (CC BY). The use, distribution or reproduction in other forums is permitted, provided the original author(s) and the copyright owner(s) are credited and that the original publication in this journal is cited, in accordance with accepted academic practice. No use, distribution or reproduction is permitted which does not comply with these terms.
*Correspondence: Hatem Alkadhi, hatem.alkadhi@usz.ch