The CoronaSurveys System for COVID-19 Incidence Data Collection and Processing
 Carlos Baquero1
  Paolo Casari2
  Antonio Fernandez Anta3*
  Amanda García-García3
  Davide Frey4
  Augusto Garcia-Agundez5
  Chryssis Georgiou6 Benjamin Girault7 Antonio Ortega7 Mathieu Goessens8
  Harold A. Hernández-Roig9
  Nicolas Nicolaou10
  Efstathios Stavrakis10
  Oluwasegun Ojo11
  Julian C. Roberts12 Ignacio Sanchez13
- 1U. Minho and INESC TEC, Braga, Portugal
- 2Department of Information Engineering and Computer Science, University of Trento, Trento, Italy
- 3IMDEA Networks Institute, Madrid, Spain
- 4Inria Rennes, Rennes, France
- 5Multimedia Communications Lab, TU Darmstadt, Darmstadt, Germany
- 6Department of Computer Science, University of Cyprus, Nicosia, Cyprus
- 7Department of Electrical and Computer Engineering University of Southern California, Los Angeles, CA, United States
- 8Consulting, Rennes, France
- 9Department of Statistics, UC3M & UC3M-Santander Big Data Institute, Getafe, Spain
- 10Algolysis Ltd, Nicosia, Cyprus
- 11IMDEA Networks Institute and UC3M, Madrid, Spain
- 12Skyhaven Media, Liverpool, United Kingdom
- 13InqBarna, Barcelona, Spain
CoronaSurveys is an ongoing interdisciplinary project developing a system to infer the incidence of COVID-19 around the world using anonymous open surveys. The surveys have been translated into 60 languages and are continuously collecting participant responses from any country in the world. The responses collected are pre-processed, organized, and stored in a version-controlled repository, which is publicly available to the scientific community. In addition, the CoronaSurveys team has devised several estimates computed on the basis of survey responses and other data, and makes them available on the project’s website in the form of tables, as well as interactive plots and maps. In this paper, we describe the computational system developed for the CoronaSurveys project. The system includes multiple components and processes, including the web survey, the mobile apps, the cleaning and aggregation process of the survey responses, the process of storage and publication of the data, the processing of the data and the computation of estimates, and the visualization of the results. In this paper we describe the system architecture and the major challenges we faced in designing and deploying it.
1 Introduction
During the current coronavirus pandemic, monitoring the evolution of COVID-19 cases is of utmost importance for the authorities to make informed policy decisions (e.g., lock-downs), and to raise awareness in the general public for taking appropriate public health measures.
At the time of the pandemic outbreak, a lack of laboratory tests, materials, and human resources implied that the evolution of officially confirmed cases did not represent the total number of cases (Ruppert et al., 2018; Maxmen, 2020). Even now, there are significant differences across countries in terms of the availability of tests. For this reason, given the rapid progression of the pandemic, in some cases health authorities are forced to make important decisions based on sub-optimal data. For this reason, alternatives to testing that can be rapidly deployed are likely to help authorities, as well as the general population, to better understand the progress of a pandemic (Yang et al., 2012), particularly at its early stages or in low income countries, where massive testing is unfeasible.
To this end, we have created a system, named CoronaSurveys1 to estimate the number of COVID-19 cases based on crowd-sourced open anonymous surveys. CoronaSurveys has been operating since March 2020, starting with only three countries (Spain, Portugal and Cyprus) and currently offering surveys for all the countries in the globe.
CoronaSurveys uses the network scale-up method (NSUM) (Russell Bernard et al., 1991; Bernard et al., 2010), which implements indirect reporting to: 1) reach a wider coverage in a shorter time frame, 2) obtain estimates that converge faster to the true value, and 3) preserve the privacy of the participants. The individual responses act as snapshots of knowledge of the current situation of the pandemic from a personal point of view. When these responses are analyzed collectively, across time and geographic locations, a combined view of the pandemic can be inferred. To the best of our knowledge, this is the largest scale NSUM system ever deployed and the only one to be collecting data continuously over a period of over a year using open surveys.
In this paper, we present the main components of the current CoronaSurveys infrastructure, including the collection, processing and visualization methods used. The computational system powering CoronaSurveys has been designed as the aggregation of lightly coupled components that can be replaced and modified almost independently (see architecture in Figure 1). This has enabled the system to continuously adapt to the evolution of the COVID-19 pandemic with relatively low effort, demonstrating its extensibility, re-usability, and potential to be used for tracking future pandemic outbreaks.
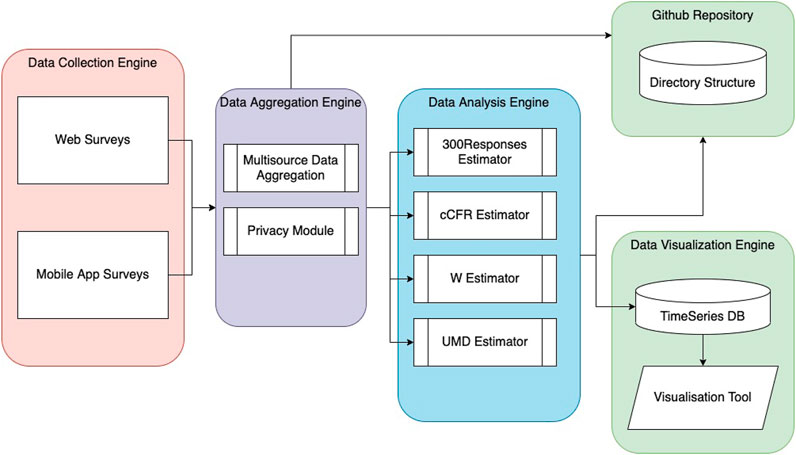
FIGURE 1. CoronaSurveys computational system architecture.
2 Data Collection
The data collection subsystem consists of 1) a user-centered web and mobile front-end interface, providing a straightforward and intuitive access to the surveys, and 2) a data collection back-end enabling response aggregation in a consistent and structured format to facilitate post-processing.
2.1 Front-end: Survey Design
Usability, interaction, and user interfacing play key roles in the initial engagement and subsequent retention of participants. To this end, we pay attention to two main elements: 1) the appearance and usability of the front-end solutions, and 2) the contents and length of the survey.
The web and mobile survey applications have been designed to have minimal loading times, with lightweight graphical elements, a color scheme and page layout suitable for all users, including visually impaired participants and participants in geographic locations where internet speeds may be poor (see Figure 2). For instance, a tailor-made cache system has been built and deployed to minimize the survey loading time. Similarly, in order to be able to improve accessibility and user experience, the initial website was migrated from GitHub pages to a Wordpress deployment in a server managed by the project team.
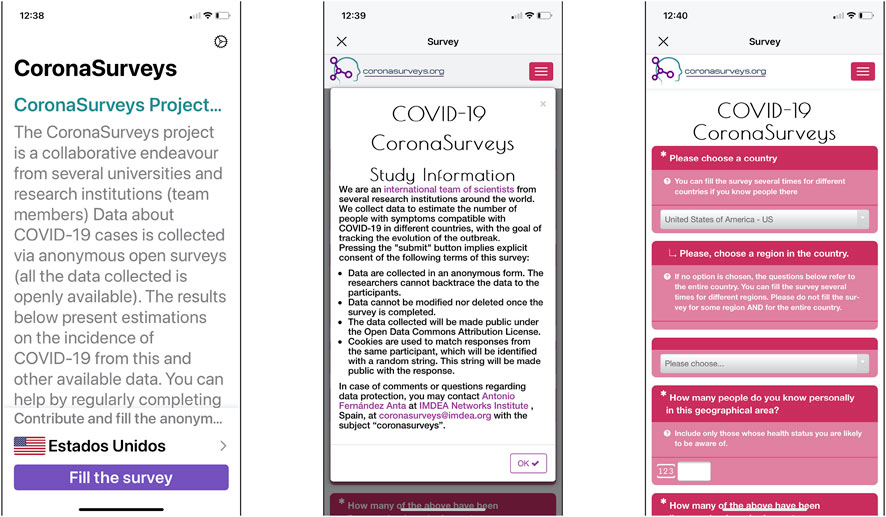
FIGURE 2. Snapshots of the Coronasurveys app. It shows the main app screen (left), the information about the project shown when accessing the survey (center), and the survey questions (right).
To preserve user engagement, minimize participant fatigue, and ensure a steady flow of responses we initially designed a minimal survey consisting of two simple questions:
1. How many people do you know personally in this geographical area? Include only those whose health status you are likely to be aware of (The geographical area was previously selected, see Figure 2.)
2. How many of those were diagnosed with or have symptoms of COVID-19?
We denote the reply to the first question as the Reach,
As CoronaSurveys expanded its reach, additional questions were introduced to improve granularity and estimate more parameters of the pandemic (like fatalities), while maintaining the survey completion time at around 1 min. Currently, the survey also includes the following questions:
3. Of the people with symptoms, how many are still sick?
4. How many started with symptoms in the latest 7 days?
5. How many passed away?
By including these additional questions, we are able to track the number of active cases (Question 3), new cases (Question 4), and the cumulative number of fatalities (Question 5).
2.2 Data Aggregation
The back-end data collection engine was designed to provide seamless aggregation of the data in a consistent and structured format. Timeliness, consistency, and proper dissemination of the data were the three main pillars of the aggregation process. CoronaSurveys updates its estimates daily to provide a comparison with the estimates of officially confirmed cases, which are also updated once per day. This daily aggregation also serves as a privacy preserving measure, as we discuss in the next section.
During aggregation, survey responses are classified by country and stored in individual files named as

TABLE 1. Aggregation row format.
2.3 User Privacy
Ensuring anonymity and privacy is important to minimize reservations from participants on filling the survey. Ideally, we would like to acquire as much relevant data as possible (e.g., geolocation), but this is orthogonal to anonymity and is likely to lead to less responses. CoronaSurveys implements four anonymity strategies:
2.3.1 Avoid Third Party Tracking
One of the initial concerns was to eliminate the possibility of a third party to collect data from participants. Although first deployed in Google Forms, we quickly moved the surveys to a self-hosted instance of the open-source tool Limesurvey (LimeSurvey Project Team/Carsten Schmitz, 2012) to minimize this risk.
2.3.2 Avoid Revealing User Identity
CoronaSurveys does not ask any personal questions, and only collects data about the contacts of the participant. The data collected from each participant is limited to the day in which the survey was completed, the geographical region for which the user wishes to provide information, and the replies to the aforementioned questions.
2.3.3 Secure User Identification
Identifying users who return to the CoronaSurveys system, while preserving their anonymity, is necessary to prevent malicious and repetitive responses that can skew our input data. Given our goal to avoid storing personal information, creating personal accounts was not possible, and instead we decided to create a random cookie at the participants browser, or device, to provide an identification for the user and stored it along with the time the survey was last filled in. The cookie is stored in an encrypted form. This cookie can help us detect some duplicate responses and some malicious attacks (anonymous duplication), but does not ensure security. For example, a user could submit its responses from multiple devices, and each would be associated with a different cookie. To remove further malicious responses, we implement outlier detection algorithms described in Section 3.
2.3.4 Protecting User Identity
Tracking the time when a user submits a response may allow an adversary to recover their true identity. For this reason, we 1) do not include the time of the day in the aggregated and published data, and 2) shuffle the responses of a single day preventing an adversary from extracting the order in which responses were received.
3 Data Analysis
Based on the aggregated, anonymous data, CoronaSurveys employs several methods to produce estimates of the number of COVID-19 cases in all geographical areas for which sufficient data are available, comparing these estimates with those provided by the official authorities. The estimation methods are:
• cCFR-based: This method is based on estimating the corrected case fatality ratio (cCFR), from the official numbers of cumulative cases and fatalities, and taking an estimation of the approximate number of cases with known outcomes into consideration. It is also assumed that a reliable value of the traditional case fatality ratio (
• cCFR-fatalities: This method divides the official number of fatalities on a given day d by
• UMD-Symptom-Survey: This method uses the responses to direct questions about symptoms from the University of Maryland COVID-19 World Survey (Fan et al., 2020) to estimate active cases. In particular, it counts the number of responses that declare fever, and cough or difficulty breathing. This survey collects more than
• UMD-Symptom-Survey-Indirect: This method estimates active cases applying the NSUM method to the responses of an indirect question from the University of Maryland COVID-19 World Survey (Fan et al., 2020). In this estimation method the Reach is obtained from the CoronaSurveys data, while the Number of Cases are the cases reported by answering YES to the question 1) “Do you personally know anyone in your local community who is sick with a fever and either a cough or difficulty breathing?” and answering the question 2) “How many people do you know with these symptoms?”
• 300Responses: This method uses a weighted average of 300 filtered CoronaSurveys responses for a given geographical area. Filtering consists in discarding answers that report an unusually large reach (entries larger than 1.5 times the interquartile range above the upper quartile) or an unusually large number of cases (over
• Estimates-W: This method uses a weighted average of CoronaSurveys responses from the last W days, using the same filtering criteria as 300Responses.
Cookies allow us to make sure we only count the latest answer for each respondent in each aggregated batch (set of 300 responses for estimates-300, or last W days for estimates-W).
The estimates obtained with the above methods are stored in the online public repository. Each method M stores the estimates in a folder named estimates-M/PlotData, and the estimates for each country
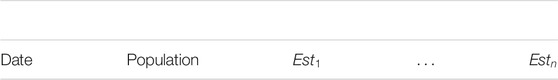
TABLE 2. Estimates row format.
Once in the predefined format, the estimates are imported in a time-series database, from which we generate visualizations. Time-series databases are often used to store streaming data organized in measurements. For CoronaSurveys, each series of estimates obtained with a given method is one such measurement, while the date, the country, the region, and the population, are characteristics of the measurements, facilitating the localization of the estimates.
4 Data Visualization
Finally, converting the computed data to meaningful visualizations is essential to observe trends, insights, and behaviors from our data, as well as to communicate our outcomes to a wider audience. Our visualization engine employs the Grafana (Grafana Labs, 2018) framework, which enables the creation of interactive plots of various types. We can group our plots into three categories, based on the information they provide:
• CoronaSurveys participation statistics
• Global-scale visualizations
• Local-scale visualizations
To better map the effects of the pandemic and in order to capture a holistic view of its impact, we present the computed estimates in both global, and countrywide (local) visualisations. Global visualisations intend to expose the distribution of the pandemic around the globe, and identify areas with higher infection rates. Countrywide visualisations aim to pinpoint the estimated magnitude of the problem compared to officially reported cases.
4.1 Coronasurveys Participation Statistics
Figure 3 depicts the statistics of CoronaSurveys participation. In just over 12 months, CoronaSurveys has collected data from roughly
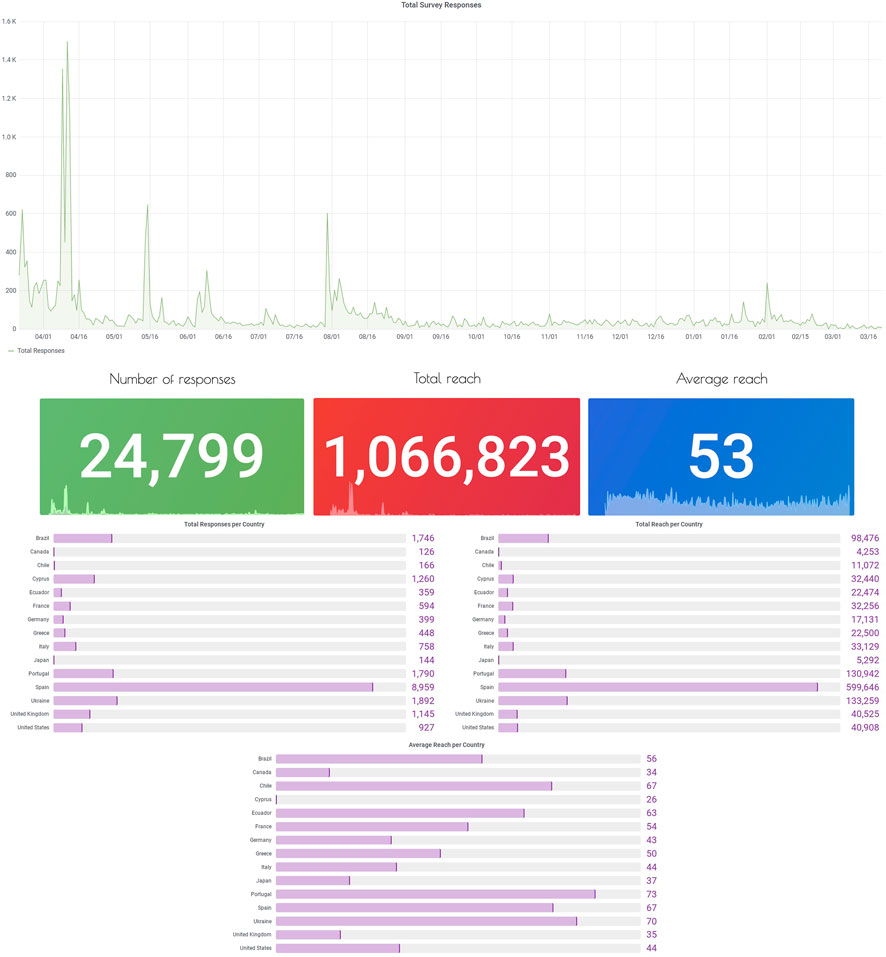
FIGURE 3. Coronasurveys statistics of participation and reach.
4.2 Global-Scale Visualizations
Our goal for the global visualisations is twofold: 1) to provide a snapshot of the pandemic based on the latest computed estimates and 2) to provide a comparative plot exposing the progress of the virus in multiple countries.
A map is one of the most intuitive ways to present an instance of the data on a global scale. Therefore, Figure 4 presents a map visualization that includes the estimates of the percentage of cumulative cases (infected) per country based on the cCFR algorithm (ccfr-based). Bubble points can capture the magnitude of a value by adjusting their color based on a predefined color scale, and their radius relative to the maximum and minimum values on the map. On the top left of the figure there are visible drop-down menus to select other estimators and metrics.
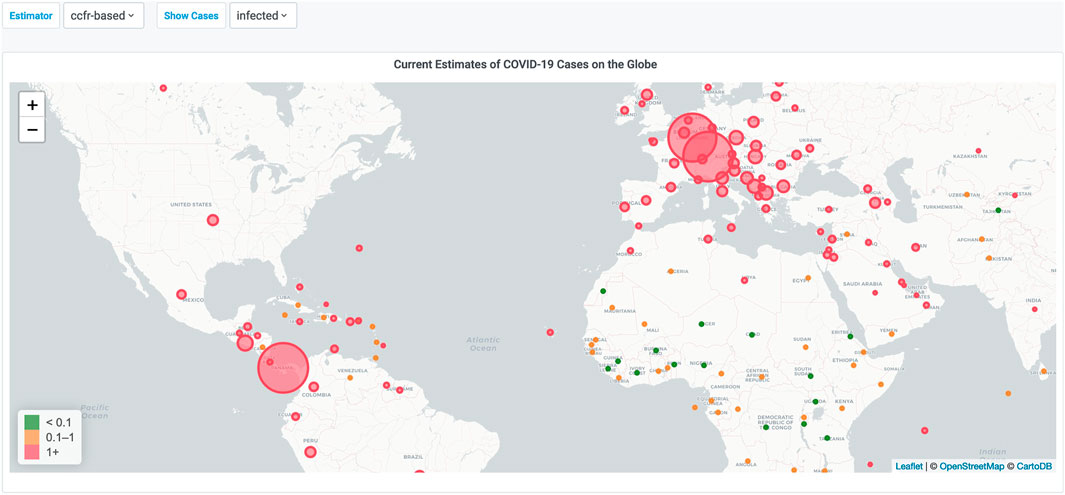
FIGURE 4. Cumulative number of cases, estimated with the cCFR-based method, around the globe. A larger radius means a higher percentage.
Figure 5 provides a comparison of the countries most affected by the pandemic. This plot also presents the estimates, based on the Estimates-W algorithm. We show in this figure only the lines for United Kingdom, Brazil, Portugal, France and Chile are shown for clarity (Lines can be shown or hidden individually in the website plot.)
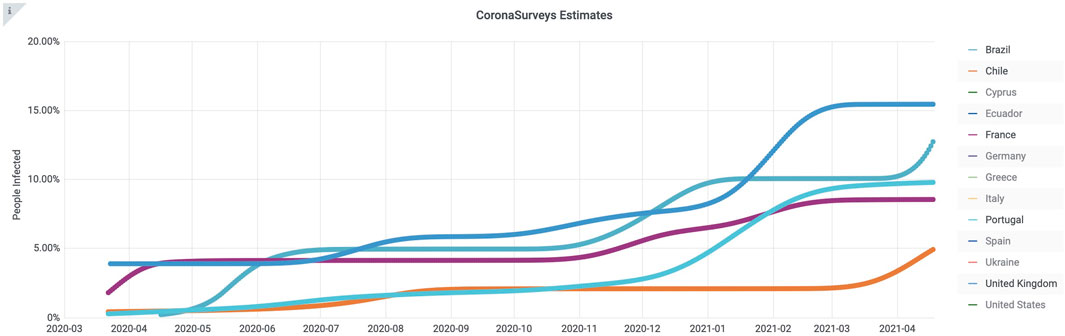
FIGURE 5. Global estimates of cumulative number of cases obtained with method Estimates-W. Only the lines for United Kingdom, Brazil, Portugal, France and Chile are shown for clarity.
4.3 Local-Scale Visualizations
For local-scale visualization, we display the evolution in the number of active cases, new daily cases, and contagious cases (see Figure 6), estimated with some of the methods described above. To estimate the number of active and contagious cases when only daily cases are available (e.g., from confirmed data) we assume that cases are active and contagious for 18 and 12 days, respectively, (Centers for Disease Control and Prevention, 2021a; Centers for Disease Control and Prevention, 2021b). Observe in Figure 6 that the ratios of active cases estimated on the last day (April 26th, 2021) with the responses to direct symptom questions (blue line,
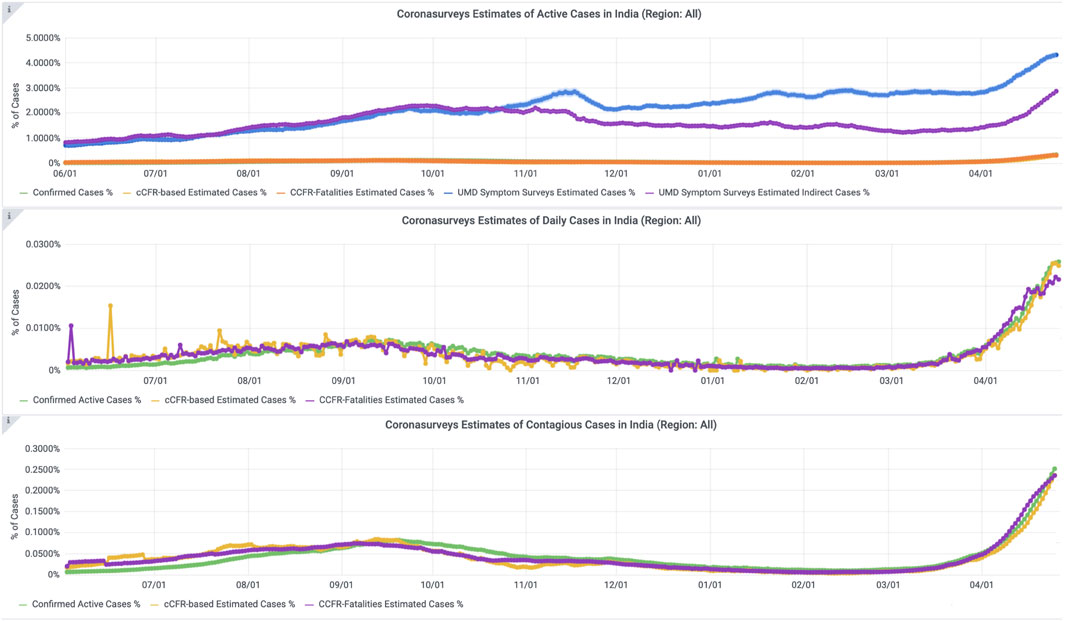
FIGURE 6. Estimates of number of cases in India. The estimates of active cases obtained with data from the University of Maryland COVID-19 World Survey (Fan et al., 2020) are one order of magnitude higher than those obtained from official data.
To illustrate the estimates obtained from the survey we use Portugal, a country for which we obtained a good number of replies (see Figure 7). Observe the increase in the number of replies in February 2021, when a paid campaign in Facebook Ads was deployed in Portugal. Country-level plots present a comparison of the different estimation methods for cumulative number of cases, including the report of the official authorities. Figure 8 presents the cumulative number of cases estimates in CoronaSurveys for Portugal. The thin green line is the number of cases reported by the official authorities, while the remaining curves present the estimates obtained with cCFR-based, 300Responses, and estimates-W. As can be seen, all curves have similar trends, but cCFR-based 300Responses, and estimates-W have sensibly larger values than the official data.
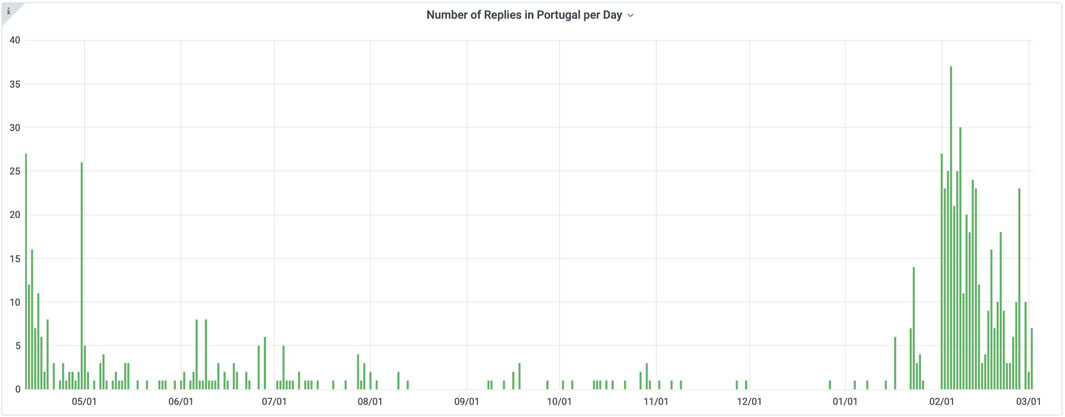
FIGURE 7. Survey responses in Portugal. Observe the increase of participation obtained in February 2021 with a paid campaign in Facebook Ads.
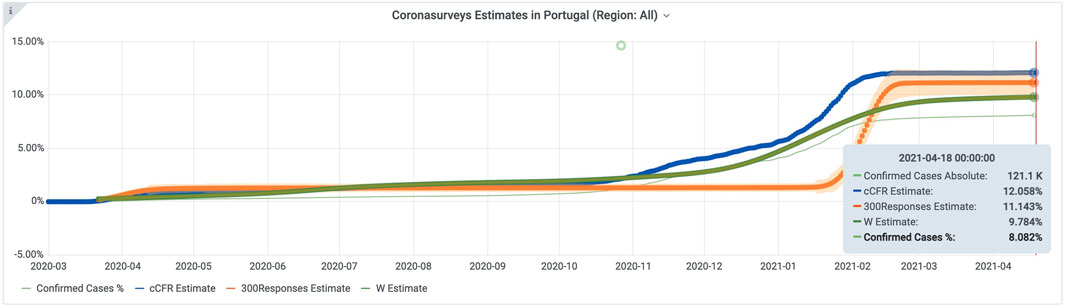
FIGURE 8. Estimates for Portugal.
5 Results
To test the feasibility of using CoronaSurveys to provide accurate estimates of the number of cases, we conducted a comparison between our estimates and the results of massive serology testing in Spain, a study conducted by Pollan et al. (Pollán et al., 2020). In this study (García-Agundez et al., 2021), we calculated the correlation between our estimates and the serology results across all regions (autonomous communities) of Spain in the timeframe of the serology study. The serology study recruited
This resulted in a Pearson R squared correlation of 0.89. In addition, we observed that CoronaSurveys systematically underestimates the number of cases by a factor of 46%, possibly due to asymptomatic cases. This ratio is consistent with other survey implementations that used direct reporting instead (Oliver et al., 2020).
Although further comparisons in other countries are necessary once we have sufficient data and similar serology studies are available, we believe this strongly supports the use of open surveys as an additional source of information to track the progress of pandemics.
6 Conclusion
In this article, we present the system architecture and estimation methods of CoronaSurveys, which uses open surveys to monitor the progress of the COVID-19 pandemic. Our graphical estimations require large amounts of data from active participants, but provide insightful depictions of the progress of the pandemic in different regions, offering an estimation of the cumulative and active number of cases in different geographical areas.
The most important challenge and limitation of CoronaSurveys is the number of survey responses. In this sense, the dissemination of our graphical estimations is important to maximize user engagement and retention. For this reason, in the future we aim to include a forecast of the number of cases and fatalities based on recent data for different geographical areas, in order to empower the dissemination of our graphical visualizations and with it increase user recruitment.
In addition, our outlier detection methods are heuristic and could, in the future, be improved to be more resilient to malicious responses. CoronaSurveys is a work in progress, and features such as the number of responses per day could be implemented to detect certain types of malicious attacks which open online surveys may be subjected to.
Our first evaluation, comparing the results of CoronaSurveys with a serology study in Spain provided excellent results, supporting open surveys and indirect reporting as potential sources of information to track pandemics, although further comparisons in different regions are required. An interesting topic of discussion would be the minimum number of responses required to provide reasonably accurate estimates, as increasing number of replies will balance out individual inaccuracies of over- or underestimation and improve the functionality of our outlier detection methods, following the “wisdom of the crowd” phenomenon. Naturally, the minimum number of responses will depend on factors such as population dispersion and cultural differences on behavior, but our initial estimate is that by indirectly providing information for a percentage of the population similar to that of a massive serology study, we can already provide valuable estimates.
In conclusion, massive serology testing is ultimately the standard to accurately estimate the prevalence of COVID-19 in a region. However, this has its limitations, since it requires time until deployment, involves massive resources, and is unfeasible in some scenarios and countries. As an example, in the current outbreak in India as of April 2021, the level of underreporting is likely to be very high (Institute for Health Metr, 2021), which matches what is observed in Figure 6. In these scenarios, we believe indirect reporting can provide a viable alternative to obtain early approximations of prevalence. Although CoronaSurveys is a work in progress and much fine tuning is still required, we believe it provides a proof of concept of indirect reporting, as well as early results on its feasibility.
Data Availability Statement
The datasets presented in this study can be found in online repositories. The names of the repository/repositories and accession number(s) can be found below: https://github.com/GCGImdea/coronasurveys/.
Ethics Statement
The studies involving human participants were reviewed and approved by the Ethics Committee of IMDEA Networks Institute. The patients/participants provided their written informed consent to participate in this study.
Author Contributions
All authors listed have made a substantial, direct, and intellectual contribution to the work and approved it for publication.
Funding
Partially supported by grant SOLID from Fundación IMDEA Networks, and CoronaSurveys-CM from IMDEA Networks Institute and Comunidad de Madrid.
Conflict of Interest
MG was employed by Consulting. NN and ES were employed by Algolysis Ltd. JR was employed by Skyhaven Media. IS was employed by InqBarna.
The remaining authors declare that the research was conducted in the absence of any commercial or financial relationships that could be construed as a potential conflict of interest.
Footnotes
1Accessible at https://www.coronasurveys.org
References
Bernard, H. R., Hallett, T., Iovita, A., Johnsen, E. C., Lyerla, R., McCarty, C., et al. (2010). Counting Hard-To-Count Populations: the Network Scale-Up Method for Public Health. Sex. Transm. infections 86 (Suppl. 2), ii11–ii15. doi:10.1136/sti.2010.044446
Centers for Disease Control and Prevention (2021a). Covid-19 Pandemic Planning Scenarios. Available at: https://www.cdc.gov/coronavirus/2019-ncov/hcp/planning-scenarios.html (Accessed December 12, 2020).
Centers for Disease Control and Prevention (2021b). Clinical Questions about Covid-19: Questions and Answers. Available at: https://www.cdc.gov/coronavirus/2019-ncov/hcp/faq.html (Accessed 05 09, 2021).
Fan, J., Yao, L., Stewart, K., Kommareddy, A. R., Bradford, A., Chiu, S., et al. (2020). Covid-19 World Symptom Survey Data Api. Available at: https://covidmap.umd.edu/api.html (Accessed May 28, 2021).
García-Agundez, A., Ojo, O., Hernández-Roig, H. A., Baquero, C., Frey, D., Georgiou, C., et al. (2021). Estimating the COVID-19 Prevalence in spain with Indirect Reporting via Open Surveys. Front. Public Health 9. Available at: https://www.medrxiv.org/content/10.1101/2021.01.29.20248125v1 (Accessed May 28, 2021).
GCGImdea/coronasurveys (2020). Coronasurveys Data Repository. Available at: https://github.com/GCGImdea/coronasurveys (Accessed November 5, 2020).
Grafana Labs (2018). Grafana Documentation. Available at: https://grafana.com/docs/ (Accessed May 28, 2021).
Institute for Health Metrics and Evaluation (2021). Covid-19 Results Briefing in india. Available at: http://www.healthdata.org/sites/default/files/files/Projects/COVID/2021/163_briefing_India_9.pdf (Accessed May 03, 2021).
LimeSurvey Project Team/Carsten Schmitz (2012). LimeSurvey: An Open Source Survey Tool. Hamburg, Germany: LimeSurvey Project.
Maxmen, A. (2020). How Much Is Coronavirus Spreading under the Radar?. Nature 10. doi:10.1038/d41586-020-00760-8Available at: https://www.nature.com/articles/d41586-020-00760-8
Oliver, N., Barber, X., Roomp, K., and Roomp, K. (2020). Assessing the Impact of the Covid-19 Pandemic in spain: Large-Scale, Online, Self-Reported Population Survey. J. Med. Internet Res. 22 (9), e21319. doi:10.2196/21319
Pollán, M., Pérez-Gómez, B., Pastor-Barriuso, R., Oteo, J., Hernán, M. A., Pérez-Olmeda, M., et al. (2020). Prevalence of Sars-Cov-2 in spain (Ene-covid): a Nationwide, Population-Based Seroepidemiological Study. The Lancet 396 (10250), 535–544. doi:10.1016/s0140-6736(20)32266-2
Ruppert, E., Grommé, F., Upsec-Spilda, F., and Cakici, B., (2018). Citizen Data and Trust in Official Statistics. Economie Statistique/Economics Stat. (505-506), 171–184. doi:10.24187/ecostat.2018.505d.1971
Russell Bernard, H., Johnsen, E. C., Killworth, P. D., and Robinson, S. (1991). Estimating the Size of an Average Personal Network and of an Event Subpopulation: Some Empirical Results. Soc. Sci. Res. 20 (2), 109–121. doi:10.1016/0049-089x(91)90012-r
Verity, R., Okell, L. C., Dorigatti, I., Peter, W., Whittaker, C., Imai, N., et al. (2020). Estimates of the Severity of Coronavirus Disease 2019: a Model-Based Analysis. Lancet Infect. Dis. 20, 669–677. doi:10.1016/S1473-3099(20)30243-7
Yang, P., Ma, C., Shi, W., Cui, S., Lu, G., Peng, X., et al. (2012). A Serological Survey of Antibodies to H5, H7 and H9 Avian Influenza Viruses Amongst the Duck-Related Workers in Beijing, china. PLoS One 7 (11), e50770. doi:10.1371/journal.pone.0050770Available at: https://journals.plos.org/plosone/article?id=10.1371/journal.pone.0050770
Keywords: COVID-19, monitoring, survey, indirect reporting, visualization, network scale-up method, mobile app
Citation: Baquero C, Casari P, Fernandez Anta A, García-García A, Frey D, Garcia-Agundez A, Georgiou C, Girault B, Ortega A, Goessens M, Hernández-Roig HA, Nicolaou N, Stavrakis E, Ojo O, Roberts JC and Sanchez I (2021) The CoronaSurveys System for COVID-19 Incidence Data Collection and Processing. Front. Comput. Sci. 3:641237. doi: 10.3389/fcomp.2021.641237
Received: 13 December 2020; Accepted: 17 May 2021;
Published: 08 June 2021.
Edited by:
Mina C. Johnson-Glenberg, Arizona State University, United StatesReviewed by:
Andrea Seveso, University of Milano-Bicocca, ItalyJan Mucha, Brno University of Technology, Czechia
Juan Julián Merelo, University of Granada, Spain
Copyright © 2021 Baquero, Casari, Fernandez Anta, García-García, Frey, Garcia-Agundez, Georgiou, Girault, Ortega, Goessens, Hernández-Roig, Nicolaou, Stavrakis, Ojo, Roberts and Sanchez. This is an open-access article distributed under the terms of the Creative Commons Attribution License (CC BY). The use, distribution or reproduction in other forums is permitted, provided the original author(s) and the copyright owner(s) are credited and that the original publication in this journal is cited, in accordance with accepted academic practice. No use, distribution or reproduction is permitted which does not comply with these terms.
*Correspondence: Antonio Fernandez Anta, antonio.fernandez@imdea.org