In silico antibody-peptide epitope prediction for personalized cancer therapy
 Ivan Jacobs
 Lim Chwee Ming2
  Nishant Malik
- 1Research and Development, AI4U S.A., Luxembourg, Luxembourg
- 2Department of Otolaryngology-Head and Neck Surgery, Singapore General Hospital Duke-NUS Medical School, Singapore, Singapore
- 3Biodevices and Diagnostics, Institute of Bioengineering and Nanotechnology, Singapore, Singapore
- 4Department of Informatics, Ionian University, Corfu, Greece
- 5School of Mathematical Sciences, Rochester Institute of Technology, Rochester, NY, United States
The human leukocyte antigen (HLA) system is a complex of genes on chromosome 6 in humans that encodes cell surface proteins responsible for regulating the immune system. Viral peptides presented to cancer cell surfaces by the HLA trigger the immune system to kill the cells, creating antibody–peptide epitopes (APE). This study proposes an in silico approach to identify patient-specific APEs by applying complex networks diagnostics on a novel multiplex data structure as an input for a deep learning model. The proposed analytical model identifies patient- and tumor-specific APEs with as few as 20 labeled data points. In addition, the proposed data structure employs complex network theory and other statistical approaches that can better explain and reduce the black box effect of deep learning. The proposed approach achieves an F1-score of 80% and 93% on patients one and two, respectively, and above 90% on tumor-specific tasks. In addition, it minimizes the required training time and the number of parameters.
1. Introduction
The human leukocyte antigen (HLA) system or complex is a complex of genes on chromosome 6 in humans that encode cell surface proteins responsible for regulating the immune system. The HLA system also known as the human version of the major histocompatibility complex (MHC) is found in many animals.
HLA genes are highly polymorphic, which means that there are thousands of different forms of these genes called alleles, allowing them to fine-tune the adaptive immune system. The proteins encoded by certain genes are also known as antigens because of their historic discovery as factors in organ transplants.
As shown in Figure 1, HLA's proteins present viral peptides from inside the cell to the surface of the cell. For example, if the cell is infected by a virus or is cancerous, the HLA system brings abnormal fragments, called peptides, to the surface of the cell so that the cell can be destroyed by the immune system.
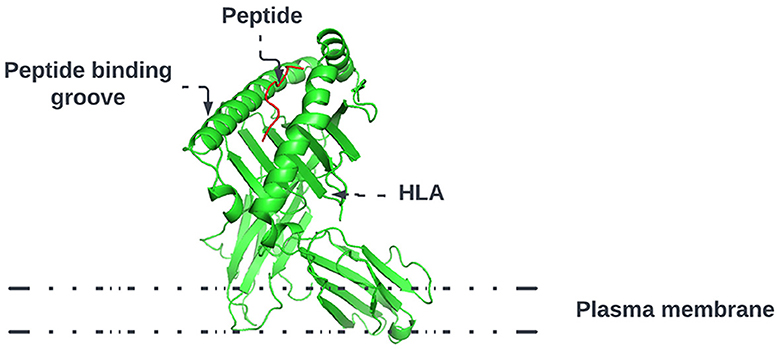
Figure 1. HLA proteins (green) display peptides (red) from inside the cell to help immune cells find cancerous or infected cells.
Predicting the specific HLA peptide combination that will present the peptide to the cell's surface permits the creation of a treatment that will trigger the human immune system to destroy the cell. Specifically, in cancer, this ability is essential, given that cancer is highly mutagenic with tumor and patient-specific mutations. This means that patients with the same tumor type will have different mutations that result in different reactions to the same treatment.
Advances in deoxyribonucleic acid (DNA) sequencing, messenger ribonucleic acid (mRNA) vaccines, and high-computational power allow us to work toward patient-specific therapy. This approach, called personalized mRNA-based antitumor vaccine, visualized in Figure 2, is bound to play a major role in future.
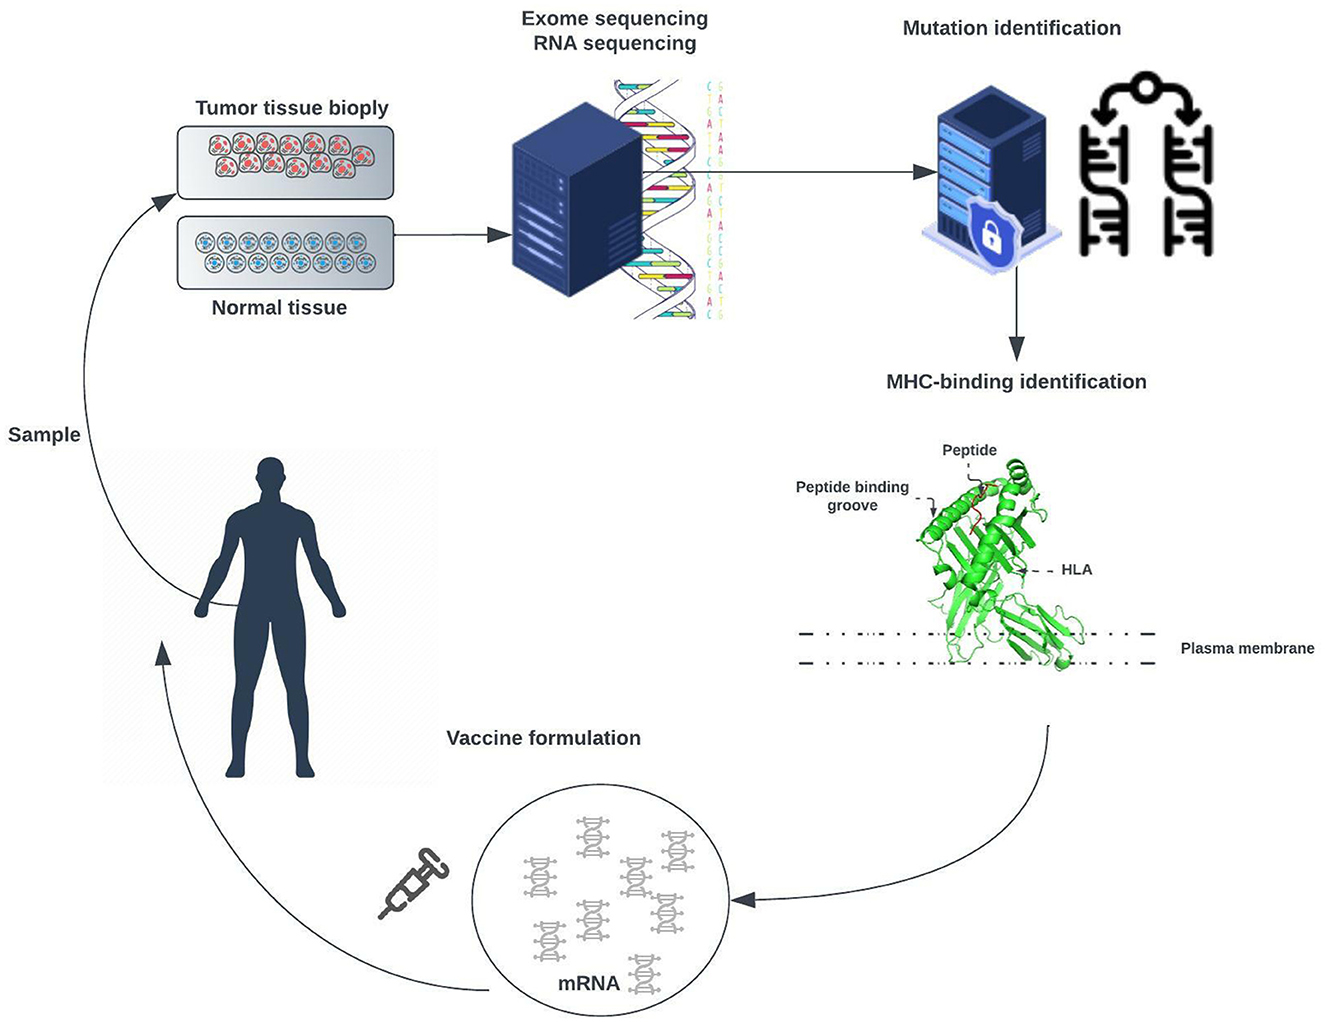
Figure 2. Exome of tumor cells isolated from a biopsy sample and the exome of normal cells are compared to identify tumor-specific mutations. Point non-synonymous mutations, gene deletions, or rearrangements can give rise to neoantigens. Several bioinformatic tools are used to predict major histocompatibility complex (MHC) class I and class II binding (necessary for recognition by T cells) and RNA expression presence of the mutated antigen among tumor cells (clonality). RNA sequencing enables verification that the gene encoding the neoantigen is expressed by tumor cells. A tandem gene encoding several neoantigen peptides is cloned into a plasmid and transcribed to mRNA. Finally, these mRNAs are injected as naked RNA, formulated into liposomes, or loaded into dendritic cells.
The approach is meant to trigger an antitumor immune response in patients by challenging them with mRNAs encoding tumor-specific antigens [1]. These mRNAs can be directly injected as naked RNA or loaded into patient-derived dendritic cells.
In this study, we propose to extend the approach with additional laboratory and analytical optimization steps. Concretely, DNA sequenced from the patient is used to select candidate peptides that will result from gene expression. As the space of possible combinations is huge a subset of potential peptides is synthesized and their reaction to the patient's specific HLA alleles are tested by applying an enzyme-linked immunospot (ELISpot) assay. An enzyme-linked immunospot (ELISpot) assay [2], shown in Figure 3, is a highly versatile and sensitive technique, that is, used for qualitative and quantitative measurement of the cytokine-secreting cells at the single-cell level [3].

Figure 3. Visualization of an enzyme-linked immunospot (ELISpot) assay.
This assay involves culturing cells on a surface on which a reagent (e.g., a specific capture antibody) is immobilized. Secreted proteins by the cells, such as cytokines, will be captured by the specific antibodies on the surface. Post-appropriate incubation time, cells are washed, and the secreted molecule is identified by applying a detection antibody. Adding a substrate produces a colored fluorescent or luminescent reaction (e.g., visible spots on the surface). Each spot corresponds to an individual cytokine-secreting cell and indicates the reactants' concentration. The generated data permit fine-tuning an analytical approach to a specific patient's and tumor's mutations and reevaluating the peptide sequences with the purpose of selecting the optimal HLA allele–peptide combination. Once a subset of peptides is identified an mRNA vaccine is created that will force the body to trigger an immune response and destroy cancerous cells. The mRNA vaccine creation and evaluation are outside the scope of this study. The purpose of this study is to identify an analytical approach that can predict HLA-peptide interaction. With this effort, we hope to provide a framework that gives the ability to select and optimize personalized analytical methods from a wide range of possibilities as graph theory, machine learning, deep learning, meta-learning, and machine learning on graphs and leverage on high-performance computing with graphic processing unit (GPU) acceleration.
2. Related work
Epitope prediction is an important approach in tumor immunology and immunotherapy. The main classes of importance in the HLA molecules are the Class I and II molecules, which present epitopes to CD8+ T cells and CD4+ T cells, respectively. The methods for assessing immunogenicity are MS-based MHC-I peptide binding prediction and immunogenicity verification by specific response assays [4–6]. Many analytical approaches have been applied to distinguish two main types of approaches: allele-specific and pan-specific. Where the former trains one model for every MHC-I allele [7–12], and the latter considers them to be as one and trains a global model together on both [13–16]. The methods with the highest achieved accuracy use data from the immune epitope database [17]. In recent years, the high rate of deep learning research resulted in a variety of deep learning based methods proposed by researchers [12, 13, 18, 19]. Many approaches combine graph theory principles with deep learning or deep learning on graphs [20–23] to detect interactive propensities embedded in HLA–peptide pairs.
Even though high affinity in an MHC–peptide complex tends to be associated with immune responsiveness, it is not sufficient to define immunogenicity. The existing analytical models lack several aspects influential to immunogenicities, such as the rate of expression, failure to represent sophisticated dynamics in molecular systems, and abundance of proteins. A number of top-ranking analytical approaches regularly falsely predict neoantigens [24–26]. Hence, the need to better comprehend immune responsiveness based on MHC–peptide complex and dynamic structures and interaction in the context of a complex dynamical system environment is a key for peptide-based personalized vaccines.
3. Approach
To compare and predict system interactions and behavior, we will look at measures and metrics that these networks express. Calculating and assigning these metrics for every individual system permit us to create a dataset that can be used in statistical, machine, and deep learning analysis approaches. Our approach takes the network measures as input and makes a binary decision about whether a system composed of multiple patient-specific peptides and HLAs will result in the presentation of viral epitopes (in known EBV-driven cancer such as nasopharyngeal cancer) on the surface of the cancer cells. As shown in Figure 4, the study can be divided into the following phases: (1) data collection, (2) ELISpot assay, (3) structures and measurements generation, and (4) analytical approach evaluation.
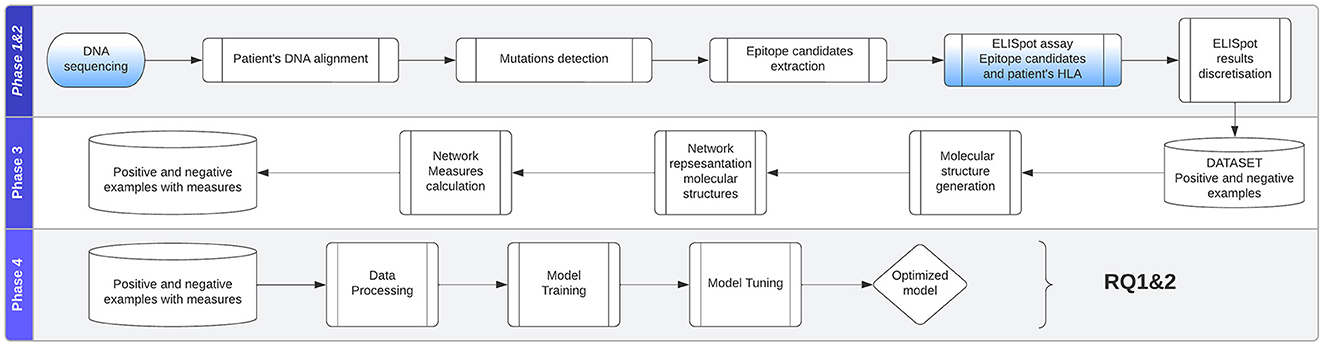
Figure 4. Approach is divided into the following phases: (1) data collection, (2) ELISpot assay, (3) structures and measurements generation, (4) analytical approach evaluation.
3.1. Data
The data, originally published in a study on patient-derived nasopharyngeal cancer (NPC) organoids for disease modeling [27], consist of 18 NPC tissue samples obtained from patients who underwent biopsy or surgical resection at the National University Hospital Singapore between March 2015 and April 2019. The datasets presented in Lucky et al. [27] can be found in online repositories. The names of the repository/repositories and accession number(s) can be found at NCBI Gene Expression Omnibus.
Specimen collection and experimental use for the study have been approved by the Institutional Review Board of the National Healthcare Group (DSRB Reference: 2015/00098-SRF0004). One part of the tissue collected from patients was immediately transferred to RPMI-1460 media with HEPES and L-Glutamine and 5X antibiotic/antimycotic and 5 μg/ml Metronidazole at 4°C. The other part was fixed in 10% neutral buffered formalin (10% NBF) for routine hematoxylin and eosin (HI&E) staining, and the remaining tissues were snap-frozen in liquid nitrogen for DNA and RNA extraction. As proof of our methodology, we used mRNA and DNA sequences of two patients where one sequence areas of the mutation have been selected and potential peptide candidates have been identified. Patient one was diagnosed with lung cancer and patient two with nasopharyngeal cancer.
In addition, enzyme-linked immunospot (ELISpot) assays have been performed with the corresponding patient-specific HLA alleles and peptides producing the quantitative measurements of the immune response (i.e., values we wish to predict).
To show the ability of the model to perform well on tumor-specific tasks, we apply the analytical approach to the Cancer Epitope Database and Analysis Resource (CEDAR) [28] containing 1,345,569 peptidic epitopes, 116,026 T-cell assays, 855,280 B-cell assays, 4,030,973 MHC ligand assays,1,588 epitope source organisms, 652 restricting MHC alleles and 4,452 references, originating from cancer-related studies. We apply the grouping and filtering described in Section 4.2 to select data points from studies close to patients one and two. This produces a total of 9,386 data points that grouped by the chosen antigen presenting cells tissue type blood, breast, lung, and lymphoid yield 2084,15,30,687 data points, respectively.
3.1.1. Data overview
The produced data's attributes as listed in Table 1 will give us the ability to create the data structures that represent the relationships between HLA alleles and peptides. This data structure will give us better insights and permit to apply analytical approaches to predict HLA–peptide interactions expressed as a discretized class representing ranges of the numbers of matched blood mononuclear cells (PBMCs).
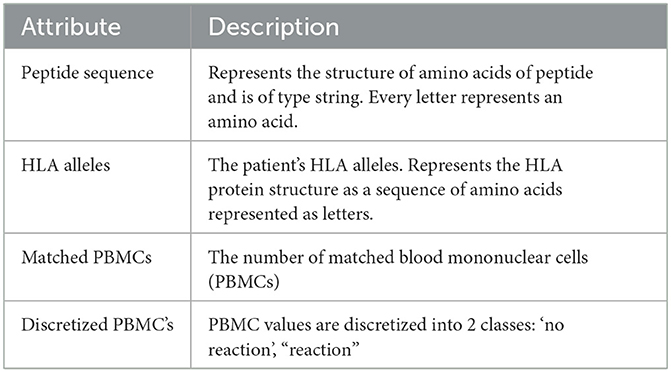
Table 1. Data dictionary of the used dataset.
3.1.2. Generated molecular structures
A peptide, as illustrated in Figure 5, is a short chain of amino acids (typically 2–50) linked by chemical bonds (called peptide bonds). The HLA cell surface protein, as illustrated in Figure 6, is a chain of amino acids, that is, responsible to regulate the immune system. To understand HLA–peptide interactions, we need to understand how the peptide is binding, as illustrated in Figure 7, to the HLA.

Figure 5. Peptide, a short chain of amino acids, represented in three-dimensional space.
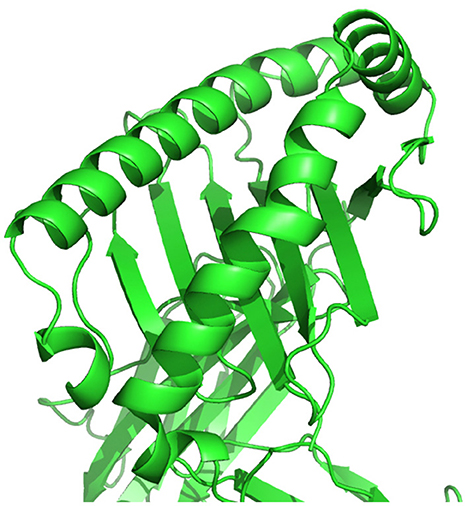
Figure 6. HLA cell surface protein, chain of amino acids, represented in three-dimensional space.
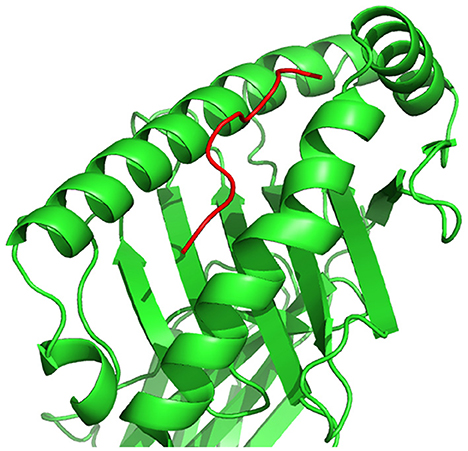
Figure 7. HLA–peptide complex formed by the binding of a peptide to an HLA cell surface protein, represented in three-dimensional space.
The HLA–peptide interaction is dependent on the amino acid atoms' chemical reactions that will fall close enough in three-dimensional space. During phase 2 of our study, as shown in Figure 8, we generate an in silico representation of the molecular structures composing a system, i.e., the patient-specific peptides and HLAs in a system.
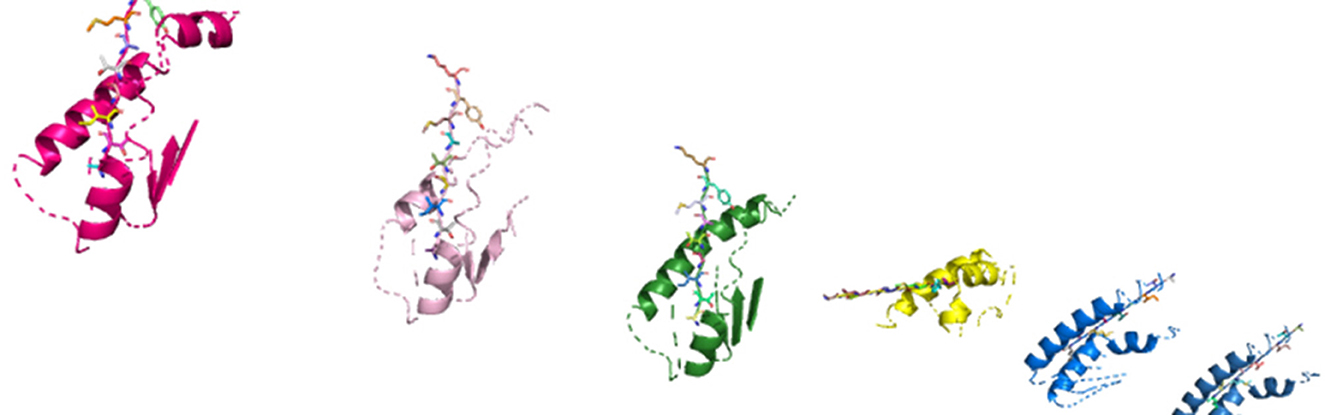
Figure 8. In silico molecular complexes present in a system, represented in three-dimensional space.
3.2. Generated network structures
We chose a network representation with layers to study the diverse relations and interactions between the components. These network representations are called multiplex networks, where a node corresponds to a “physical object,” while node-layer pairs are different instances of the same object.
For instance, a node could represent an online user, while node-layer pairs would represent different accounts of the same user in different online social networks; or a node could represent a social actor, while node-layer pairs would represent different social roles (e.g., friend, worker, and family member) of the same social actor; or a node could stand for a location in a transportation network, while node-layer pairs would represent stations of different transportation modes (e.g., streets, highways, and subways).
The connection between nodes and node-layer pairs is given by the notion of supra-nodes: i.e., cliques in the supra-graph formed by node-layer pairs that are instances of the same object. To correctly represent a physical object in the different layers of the multiplex network, we break down the peptides into amino acids and the amino acids to their smallest component atoms and their connection bonds. The layers coordinate, atom, monomer, polymer, complex, and system are introduced. The coordinate layer represents the three-dimensional coordinates of every atom in the system. The atom layer, as shown in Figure 9, is the layer that represents the atoms and their bonds that construct objects in the monomer layer, e.g., an amino acid.
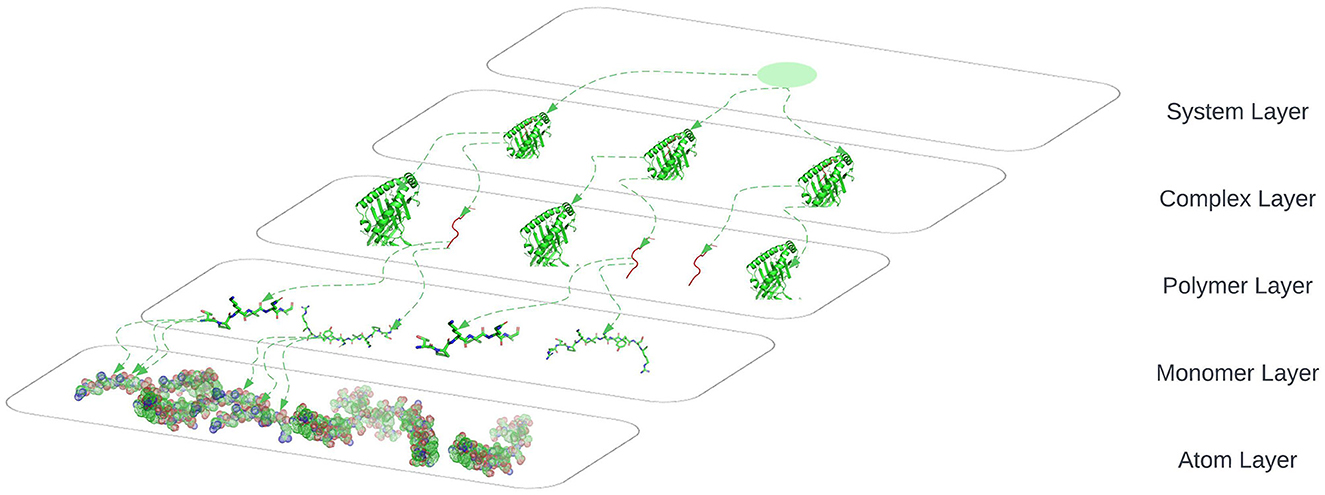
Figure 9. System layer represents the totality of complexes that exist in an ELISpot assay and is representative of multiple HLA–peptide complexes, represented in three-dimensional space.
The monomer layer, as shown in Figure 9, represents the objects of type monomer that are a molecule of any of a class of compounds, mostly organic, that can react with other molecules to form very large molecules or polymers.
The polymer layer, as shown in Figure 9, represents the objects of type polymer. A polymer is any object of a class of natural or synthetic substances composed of very large molecules, called macromolecules, which are multiples of monomers.
The complex layer, as shown in Figure 9, represents polymers that form a complex by binding to each other, e.g., the peptide binds to an HLA to form a complex as shown in Figure 5.
The system layer represents the totality of complexes that exist in an ELISpot assay and is representative of multiple HLA–peptide complexes. One system could be represented as shown in Figure 9 where we are omitting the coordinates layer.
3.3. Networks measures and metrics
After generating the graph structures, we calculate network measures on each system. The goal was to select measures such that the analytical model would be able to identify patterns in their values to allow them to distinguish between the two classes of systems, i.e., systems that will produce an antibody–peptide epitope and systems that will not produce an antibody–peptide epitope. The used network measures are discussed in detail in Section 8.3 in Appendix.
4. Model training
4.1. Model
We define the prediction of an antibody–peptide epitope as a binary classification problem. Our proposed model takes as input a set of complex networks measures and uses them as features to learn patterns and distinguish between systems that are more likely or less likely to produce an antibody–peptide epitope. Since we seek to discover latent features in the complex networks that represent systems, we choose to rely on deep learning, discussed in Section 8.2.4 in Appendix.
Our U-Net with self-attention (UNET-ATT) takes the U-net with attention deep learning architecture previously successfully applied on molecular structures by Jacobs and Maragoudakis [29], consisting of blocks of convolutions and deconvolutions, where a convolution block consists of one-dimensional convolutional layer followed by a max pooling layer and deconvolution blocks consisting of one-dimensional deconvolutional layer. The visualization of this architecture can be found in Figure 10.

Figure 10. Block diagram of the proposed U-NET with self-attention model architecture. The input feature vector is progressively down-sampled and filtered at each step. Attention gates (AG) filter the latent feature vectors that flow through the skip connections.
The input of the UNET-ATT is a vector with 22 complex network measure values that undergo batch normalization by introducing additional layers, to stabilize their distribution and control their mean and variance. The batch-normalized input flow into a convolution that reduces the input space. Convolutional layers extract higher dimensional representations by processing local features layerwise. Resulting in the separation of complex network measurements in a high-dimensional space based on their semantics. The output value of the layer with input size (N, Cin, L) and output (N, Cout, Lout) can be described as follows:
Where * is the valid cross-correlation operator, N is the batch size, C denotes the number of channels, L is the length of the signal sequence, and Θ is the optimizable parameters, i.e., weights. The layer output is produced by the sequential application of a linear transformation followed by a nonlinear activation function. We apply the rectified linear unit (ReLU) (Equation 2) as a nonlinear activation function for the convolution layers. To refine the weighting of the latent features, we apply a max-pooling layer.
The max pool layer considers the most prominent feature values by eliminating non-prominent features and reducing the feature space. The input to a deconvolution block is the output of the previous deconvolution gated through an attention gate together with the output of a corresponding convolution block. The deconvolution layer performs the opposite transformation to a convolution layer, by applying transformation with the layer parameters to augment the feature space. By minimizing the training objective, e.g., binary cross entropy loss (Equation 3), the weights of the layer are adjusted such that it learns to boost important features and makes them more prominent in the network.
The deconvolutional network layer applied to the network measures takes an input as a feature map yi, composed of Ko feature channels . Each channel c is represented as a linear sum of Ki latent feature maps convolved with filter fk, c:
Attention coefficients, α ∈ [0.1], are highlighting salient features that are flown through the skip connection, see Figure 10. The attention gate output is elementwise multiplication of the input and the attention coefficients: . Information extracted from previous layers is transformed through gating to disambiguate irrelevant activations in skip-connections. This is applied before the concatenation to merge exclusively important features. Hence, every attention gate optimizes to focus on a set of features, i.e., network measures. As depicted in Figure 10, the gating vector g∈ℝ is applied on each network measure to identify regions of interest. The attention mechanism is formulated as follows:
Where is the sigmoid activation function. The parameters Θatt comprised of: linear transformation and bias , , are computed using vector concatenation-based attention, i.e., channelwise convolutions of the input vector. The applied randomizing training procedure risk introducing bias into the model by overpredicting classes that are repeatedly fed into the model during training. To avoid this potential overfitting, we introduce a dropout layer that hides a random subset of nodes at each training iteration.
We extend [30] by using the output of the last deconvolution block, a dense representation of non-observable feature maps of the inputted complex network measure values, as input to the fully connected dense layer in which each node of the layer applies a transformation to output from all nodes from the previous layer. The fully connected layer produces the classification values by producing a probabilistic decision on whether the system will produce an antibody–peptide epitope given the initial inputs, i.e., the complex network measures of the system. The parameters of the UNET–ATT are learnt by minimizing the error, e.g., cross-entropy loss using a stochastic gradient descent (SGD).
4.2. Data preparation
To prepare the dataset, we discretize PBMC values and label the ELISpot assays with “1” if the value is above a threshold and is likely to produce an antibody–peptide epitope, and “0” if the value is beneath it. Our feature vector consists of 22 network measure values calculated for the positive and negative examples. For the tumor-specific task, we group the CEDAR data on the tissue type of the antigen-presenting cells and take epitopes into account with a length between 8 and 25 amino acids, originating from homo sapiens and being a part of MHC class I.
5. Evaluation and discussion
This section describes our empirical study aimed at evaluating the proposed approach and its main results. We formulated the following research questions:
Research question 1: To what extent is the UNET–ATT model able to correctly predict that a system composed of multiple patient and tumor-specific peptides and HLAs or T-cell receptors (TCRs) will result in the presentation of viral epitopes on the surface of the cancer cells in comparison with other models?
Research question 2: To what extent are the models personalized to the patient?
In the following paragraphs, we discuss the aforementioned research questions in detail.
5.1. Research question 1
5.1.1. Approach
To address research question 1, we explore the ability of the proposed models to correctly predict if a system composed of multiple patient-specific peptides and HLAs will result in the presentation of viral epitopes on the surface of the cancer cells. Hence, we train individual models for both patients and compare the performance of the decision tree classifier (DTC), multi-layer perceptron classifier (MLPC), random forest classifier (RFC), support vector machine (SVM), naive Bayes classifier (NBC), logistic regression classifier (LRC), K-neighbors classifier (KNC), U-net with self-attention (UNET–ATT), deep learning on graphs classifier (DLGCL). To evaluate the performance of the algorithms, we use out-of-sample bootstrap validation since this validation technique yields the best balance between the bias and variance compared with single-repetition holdout validation [30].
5.1.2. Results
Four metrics were used to measure the effectiveness of our various models: recall, precision, and F-measure, described in detail in Section 8.4 in Appendix. Precision is the ideal metric to determine the validity of our models and their adequacy in identifying potential systems that will trigger an immune system response. Precision tells the level in which the model was able to correctly identify the systems with high PBMC values in all instances with high PBMC values.
Recall was used because it allowed us to see the potentially skipped opportunities that the model missed. Utilizing the F-measure statistic, we combined recall and precision into a metric that was able to test the accuracy of the various models. The final metric used to compare the model types was the ROC curve area score, which computes a score from the variability generated by the ROC curve. This metric is useful to show an overall level of model effectiveness, although it summarizes the variability, that is, shown in the ROC curve. We trained personalized models for patients one and two with their respective data and evaluated them on unseen data. As shown in Table 2, for the personalized models of patient one, the decision tree classifier, random forest classifier, and UNET–ATT performed the best.
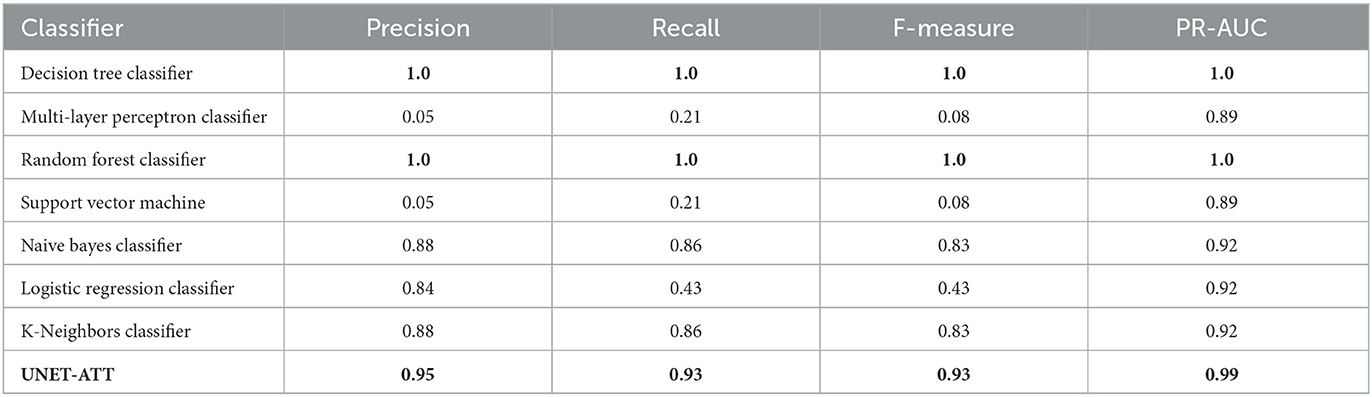
Table 2. Patient's one model: Performance of the classifiers with the highest value in bold.
However, as shown in Table 3, decision tree classifier and random forest classifier did not perform consistently in contrast with UNET–ATT with data from patient two.
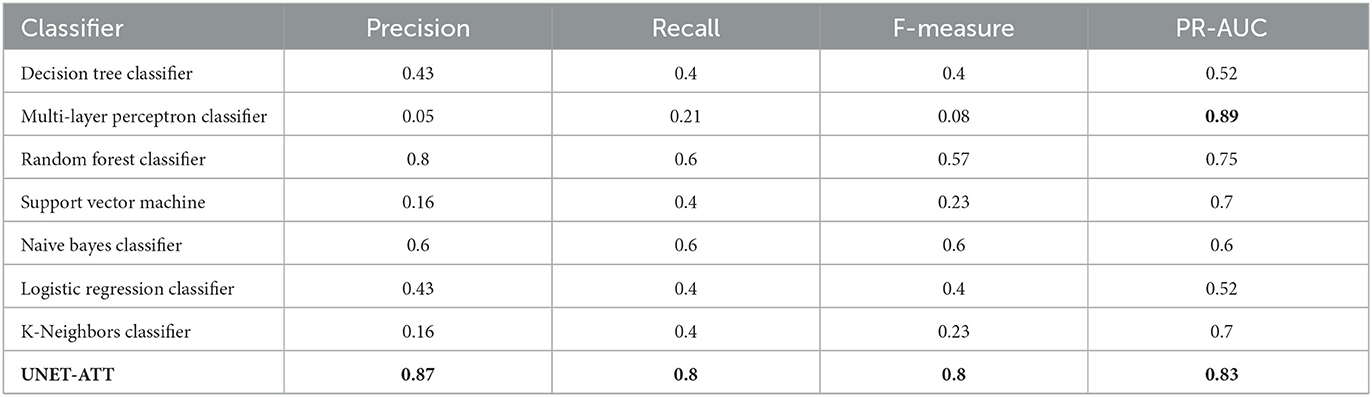
Table 3. Patient's two model: Performance of the classifiers with the highest value in bold.
We conjecture that a proper conveyance of the topological attributes, measures, and relationships in complex networks requires sophisticated feature engineering using a neural network classification strategy rather than traditional machine learning classification models. Since the UNET–ATT consistently outperforms the other models, we opt to choose it as our best candidate.
To statistically compare the performance of the models, we apply the McNemar test [31] and the odds ratio (OR) effect size, where OR larger than 1 indicates that the first technique outperformed the second.
We ran the statistical tests 10 times and compared the results, as shown in Tables 4, 5. To accommodate the fact that we performed multiple comparisons, we adjusted the p-values by applying the Bonferonni correction [32].
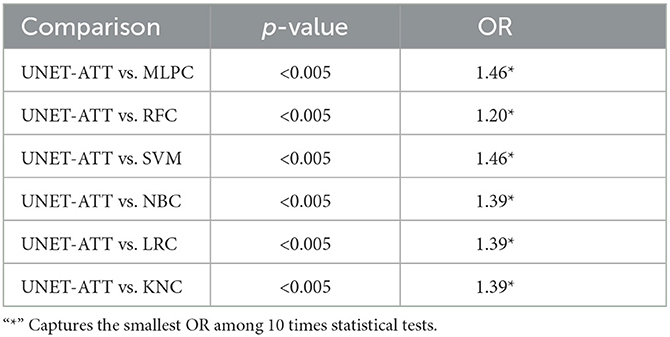
Table 4. Patient one: Statistical comparison between different classification algorithms (McNemar's test and Odds Ratio).
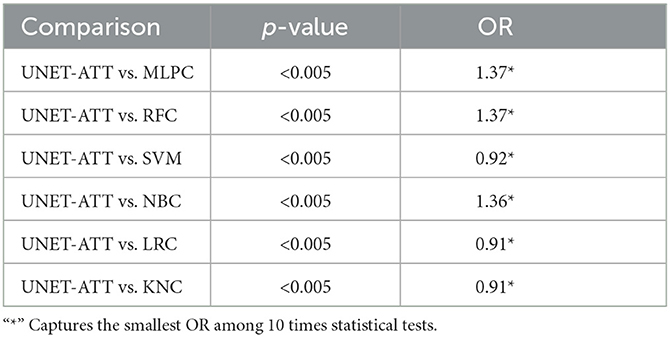
Table 5. Patient two: Statistical comparison between different classification algorithms (McNemar's test and Odds Ratio).
In this context, we formulate our null hypothesis for each test as there is no statistically significant difference between the performance of the two algorithms and the alternative hypothesis as there is a statistically significant difference between the performance of the two algorithms. We adjusted the alpha value to 0.005 to perform the hypothesis test at a 5% significance level.
As we can observe in Tables 4, 5, the McNemar test results show that the null hypothesis is rejected as there are statistically significant differences (p < 0.5/10) in the performance of the UNET–ATT model compared with all the other models. The OR values show that the UNET–ATT model has more chances to correctly predict that a system will result in the presentation of viral epitopes on the surface of the cancer cells from the other methods.
We further apply the analytical approach to the CEDAR dataset, which contains 1,345,569 tumor-related peptidic epitopes, where we create tumor-specific UNET–ATT models by grouping the data and filtering the data, as described in the data preparation Section 4.2, based on the cell tissue type of the antigen-presenting cells.
In Table 6, we present the performance metrics of the tumor-specific UNET–ATT models trained on antigen-presenting cell tissue type-specific data. The UNET–ATT model can generalize with acceptable F-measure performance on all tissue types, when trained on specific tissue types it archives remarkable F-measures of 100% and 92% for breast and lung, respectively, and is acceptable 71% for lymphoid.
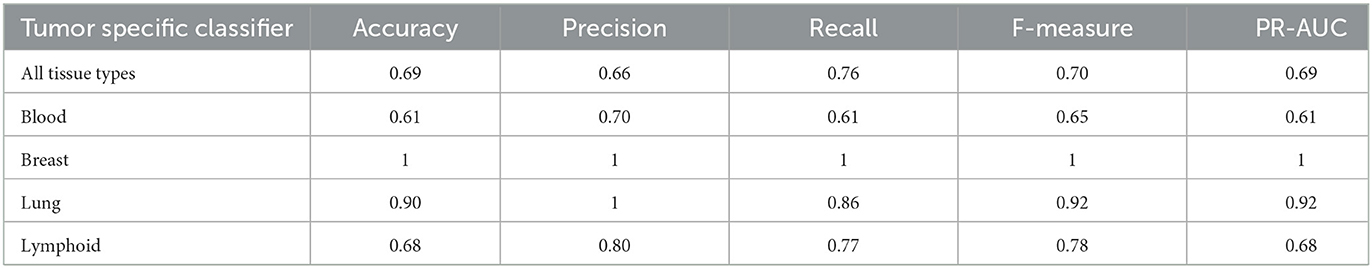
Table 6. Tumor-specific classifiers: Performance of the classifier on tumor-specific tasks.
5.2. Research question 2: Personalized model
5.2.1. Approach
To address research question 2 we compare the characteristics and derived network measures of0antibody–peptide epitopes for patient 1 and patient 2 to show the patient-specific nature of tumors expressed through peptides originating from tumor-induced mutations. To do so, we apply statistical analysis techniques such as multivariate analysis of variance (MANOVA) on the network measures to evaluate if they are statistically significantly different per patient. In addition, we look at how different network measures correlate with PMBC values per patient. We apply a structure learning algorithm to the data to learn the structure of the directed acyclic graph (DAG) to analyze the causality of data features, i.e., network measures and the matched PBMC values. Finally, we compare the performance of personalized models on unseen data from different patients to understand if models can generalize over unseen data from different patients. The applied statistical analysis techniques are discussed in detail in Section 8.3 in Appendix.
5.2.2. Results
We can conclude that data attributes have a patient-specific distribution and correlation from the performed data exploration on the network measures. This finding agrees with the general understanding that tumor mutations and immune system reactions are patient- and tumor-specific and that a personalized approach is required. In addition, the data exploration shows that network attributes of the molecular structures are patient- and tumor-specific and that some show correlations with statistical significance with the produced PMBC values. This indicates that a machine learning approach that relies on these attributes as input can be applied to produce predictions personalized toward a patient. Finally, we compared the performance of personalized models on unseen data from different patients. We observed that they do not generalize well to data from different patients and perform better on unseen data from the same patient. Concretely, as shown in Table 8 in Appendix, the metrics precision, recall, and F-measure drop compared with their respective values in Tables 2, 3 with 35%, 33%, and 33% and with 16%, 30%, and 26% for patient one and two, respectively.
6. Threats to validity
6.1. Internal and construct validity
Our analysis is mostly threatened by the generation of the molecular structures in a system, as the wrong placement of molecular structures in a complex may result in different network measure values. However, not all network measures will be impacted, and the “skewing” of these network measure values will be consistent over all the data systems. As for the selection of a threshold for the PBMC values such that they are split into positive and negative systems, i.e., systems that produce an antibody–peptide epitope and systems that do not, this threshold can be modified by domain experts. The same reasoning can be applied in choosing to predict more than two classes, i.e., splitting the PBMC values into bins and predicting a range of PMBC values within which a system would fall, e.g., map the qualitative measures “positive,” “positive-high,” and “negative” to bins of intervals [30, 300), [300, 1, 500), [0, −1500) where the qualitative measures class is assigned to all measurements whose PMBC values fall into its respective bin range.
6.2. External validity
Our analysis was performed on data from two patients with the same tumor. However, we cannot claim the generality of our observations to other tumors or all patients with the concrete tumor of our data. Further investigation is needed on data from multiple tumors and more patients to mitigate this threat.
7. Conclusion
Predicting the specific antibody–peptide that will be presented on the surface of a tumor cell is of paramount importance. It permits the creation of personalized treatments that will trigger the human immune system to destroy the tumor cell. In this study, we proposed a novel data structure leveraging multiplex networks and derive network measures as attributes leveraging the theory and methods of complex networks, together with a deep learning approach for optimal feature engineering and personalized antibody–peptide epitope binary classification. Our results reveal that machine learning and deep learning models are able to binary classify antibody–peptide epitopes based on the derived attributes from the proposed data structure.
In particular, the proposed UNET–ATT demonstrates an F-measure of 0.8 and 0.93 for personalized models for patients one and two, respectively. In addition, the UNET–ATT model consistently outperforms the other models on both patients in contrast with machine learning baseline models that show different results for different patients. In addition, UNETT–ATT can generalize with acceptable F-measure of 0.7 on a subset from a larger CEDAR dataset containing 9386 T-cell assays, 3679 peptidic epitopes, 69 restricting MHC alleles, and 374 references compared with patients one and two data containing combined 67 potential peptidic and 11 MHC alleles. UNETT–ATT demonstrated F-measures of 0.92 and 1.0 for lung and breast antigen-presenting tissue types, respectively, proving its ability to specialize in tumor-specific tasks.
In addition, we analyzed the validity of building personalized models and found that data attributes have patient-specific distribution and correlation. The data exploration shows that network measures of the molecular structures are patient- and tumor-specific and that some show a correlation with statistical significance with PMBC values. Finally, we compared the performance of models personalized toward a patient on unseen data from different patients. We observed, as demonstrated in Section 8.3.21 in Appendix and shown in Table 8 in Appendix, that they do not perform well in contrast to their performance on unseen data from the same patient as shown in Tables 2, 3.
These findings agree with the general understanding that tumor mutations and immune system reactions are patient- and tumor-specific and that a personalized approach is required for optimal results. However, we need to caution that these findings cannot be generalized to other tumors or even other patients with the same tumor from our data, given that the sample size is too small. Further investigation is needed on data from multiple tumors and more patients to mitigate this threat.
Data availability statement
The original contributions presented in the study are included in the article/Supplementary material, further inquiries can be directed to the corresponding author.
Author contributions
IJ performed the statistical analysis and wrote the first draft of the manuscript. IJ and NM contributed to the conception and design of the study. LM and JM contributed to the medical aspect of the study. All authors contributed to the manuscript revision, read, and approved the submitted version.
Conflict of interest
IJ is employed by AI4U S. A.
The remaining authors declare that the study was conducted in the absence of any commercial or financial relationships that could be construed as a potential conflict of interest.
Publisher's note
All claims expressed in this article are solely those of the authors and do not necessarily represent those of their affiliated organizations, or those of the publisher, the editors and the reviewers. Any product that may be evaluated in this article, or claim that may be made by its manufacturer, is not guaranteed or endorsed by the publisher.
Supplementary material
The Supplementary Material for this article can be found online at: https://www.frontiersin.org/articles/10.3389/fams.2023.1150381/full#supplementary-material
References
1. Pastor F, Berraondo P, Etxeberria I, Frederick J, Sahin U, Gilboa E, et al. An RNA toolbox for cancer immunotherapy. Nat Rev Drug Discov. (2018) 17:751–67. doi: 10.1038/nrd.2018.132
2. Engvall E, Perlmann P. Enzyme-linked immunosorbent assay (ELISA). Quantitative assay of immunoglobulin G. Immunochemistry. (1971) 8:871–4. doi: 10.1016/0019-2791(71)90454-X
3. Paulie S, Perlmann P, Perlmann H. Chapter 64-enzyme-linked immunosorbent assay. In:Celis JE, , editor. Cell Biology. 3rd ed. Burlington: Academic Press (2006). p. 533–8.
4. Tan X, Li D, Huang P, Jian X, Wan H, Wang G, et al. dbPepNeo: a manually curated database for human tumor neoantigen peptides. Database (Oxford). (2020) 2020:baaa004. doi: 10.1093/database/baaa004
5. Pearson H, Daouda T, Granados DP, Durette C, Bonneil E, Courcelles M, et al. MHC class I-associated peptides derive from selective regions of the human genome. J Clin Invest. (2016) 126:4690–701. doi: 10.1172/JCI88590
6. Barabas S, Spindler T, Kiener R, Tonar C, Lugner T, Batzilla J, et al. An optimized IFN-γ ELISpot assay for the sensitive and standardized monitoring of CMV protein-reactive effector cells of cell-mediated immunity. BMC Immunol. (2017) 18:14. doi: 10.1186/s12865-017-0195-y
7. Andreatta M, Nielsen M. Gapped sequence alignment using artificial neural networks: application to the MHC class I system. Bioinformatics. (2016) 32:511–7. doi: 10.1093/bioinformatics/btv639
8. Lundegaard C, Lamberth K, Harndahl M, Buus S, Lund O, Nielsen M. NetMHC-3.0: accurate web accessible predictions of human, mouse and monkey MHC class I affinities for peptides of length 8-11. Nucleic Acids Res. (2008) 36:W509–12. doi: 10.1093/nar/gkn202
9. Peters B, Sette A. Generating quantitative models describing the sequence specificity of biological processes with the stabilized matrix method. BMC Bioinform. (2005) 6:132. doi: 10.1186/1471-2105-6-132
10. Nielsen M, Andreatta M. NetMHCpan-3.0; improved prediction of binding to MHC class I molecules integrating information from multiple receptor and peptide length datasets. Genome Med. (2016) 8:33. doi: 10.1186/s13073-016-0288-x
11. Karosiene E, Lundegaard C, Lund O, Nielsen M. NetMHCcons: a consensus method for the major histocompatibility complex class I predictions. Immunogenetics. (2012) 64:177–86. doi: 10.1007/s00251-011-0579-8
12. Vang YS, Xie X. HLA class I binding prediction via convolutional neural networks. Bioinformatics. (2017) 33:2658–65. doi: 10.1093/bioinformatics/btx264
13. Han Y, Kim D. Deep convolutional neural networks for pan-specific peptide-MHC class I binding prediction. BMC Bioinform. (2017) 18:585. doi: 10.1186/s12859-017-1997-x
14. Liu Z, Cui Y, Xiong Z, Nasiri A, Zhang A, Hu J. DeepSeqPan, a novel deep convolutional neural network model for pan-specific class I HLA-peptide binding affinity prediction. Sci Rep. (2019) 9:794. doi: 10.1038/s41598-018-37214-1
15. Hu Y, Wang Z, Hu H, Wan F, Chen L, Xiong Y, et al. ACME: pan-specific peptide-MHC class I binding prediction through attention-based deep neural networks. Bioinformatics. (2019) 35:4946–4954. doi: 10.1093/bioinformatics/btz427
16. Jiang L, Yu H, Li J, Tang J, Guo Y, Guo F. Predicting MHC class I binder: existing approaches and a novel recurrent neural network solution. Brief Bioinform. (2021) 22:bbab216. doi: 10.1093/bib/bbab216
17. Vita R, Mahajan S, Overton JA, Dhanda SK, Martini S, Cantrell JR, et al. The immune epitope database (IEDB):2018 update. Nucleic Acids Res. (2019) 47:D339–43. doi: 10.1093/nar/gky1006
18. Jurtz V, Paul S, Andreatta M, Marcatili P, Peters B, Nielsen M. NetMHCpan-4.0: improved peptide-MHC class i interaction predictions integrating eluted ligand and peptide binding affinity data. J Immunol. (2017) 199:3360–8. doi: 10.4049/jimmunol.1700893
19. Shao XM, Bhattacharya R, Huang J, Sivakumar IKA, Tokheim C, Zheng L, et al. High-Throughput prediction of MHC class I and II neoantigens with MHCnuggets. Cancer Immunol Res. (2020) 8:396–408. doi: 10.1158/2326-6066.CIR-19-0464
20. Yang X, Zhao L, Wei F, Li J. DeepNetBim: deep learning model for predicting HLA-epitope interactions based on network analysis by harnessing binding and immunogenicity information. BMC Bioinform. (2021) 22:231. doi: 10.1186/s12859-021-04155-y
21. Zhao L, Wong L, Lu L, Hoi SC, Li J. B-cell epitope prediction through a graph model. BMC Bioinform. (2012) 13:S20. doi: 10.1186/1471-2105-13-S17-S20
22. Lu S, Li Y, Ma Q, Nan X, Zhang S. A structure-based b-cell epitope prediction model through combing local and global features. bioRxiv. (2022) 2021.07.13.452188. doi: 10.3389/fimmu.2022.890943
23. Wang Y, Tang H, Gao C, Ge M, Li Z, Dong Z, et al. Flexibility-aware graph model for accurate epitope identification. Comput Biol Med. (2022) 149:106064. doi: 10.1016/j.compbiomed.2022.106064
24. Lee CH, Yelensky R, Jooss K, Chan TA. Update on tumor neoantigens and their utility: why it is good to be different. Trends Immunol. (2018) 39:536–48. doi: 10.1016/j.it.2018.04.005
25. Gfeller D, Bassani-Sternberg M, Schmidt J, Luescher IF. Current tools for predicting cancer-specific T cell immunity. Oncoimmunology. (2016) 5:e1177691. doi: 10.1080/2162402X.2016.1177691
26. Liu XS, Mardis ER. Applications of immunogenomics to cancer. Cell. (2017) 168:600–12. doi: 10.1016/j.cell.2017.01.014
27. Lucky SS, Law M, Lui MH, Mong J, Shi J, Yu S, et al. Patient-Derived nasopharyngeal cancer organoids for disease modeling and radiation dose optimization. Front Oncol. (2021) 11:622244. doi: 10.3389/fonc.2021.622244
28. CEDAR. Cancer Epitope Database and Analysis Resource (2023). Available online at: http://www.iedb.org
29. Jacobs I, Maragoudakis M. De novo drug design using artificial intelligence applied on SARS-CoV-2 viral proteins ASYNT-GAN. BioChem. (2021) 1:36–48. doi: 10.3390/biochem1010004
30. Oktay O, Schlemper J, Folgoc LL, Lee M, Heinrich M, Misawa K, et al. Attention U-Net: learning where to look for the pancreas. arXiv. (2018) ArXiv:1804.03999 [cs]. doi: 10.48550/arXiv.1804.03999
31. Dietterich N. Approximate statistical tests for comparing supervised classification learning algorithms. Neural Comput. (1998) 10:1895–923. doi: 10.1162/089976698300017197
Keywords: complex networks, machine learning, deep learning, personalized medicine, cancer, tumor, antibody-peptide, epitope
Citation: Jacobs I, Ming LC, Mong J, Maragoudakis M and Malik N (2023) In silico antibody-peptide epitope prediction for personalized cancer therapy. Front. Appl. Math. Stat. 9:1150381. doi: 10.3389/fams.2023.1150381
Received: 24 January 2023; Accepted: 07 March 2023;
Published: 28 March 2023.
Edited by:
Roy Cerqueti, Sapienza University of Rome, ItalyReviewed by:
Frederic Cadet, INSERM Dynamique des Structures et Interactions des Macromolécules Biologiques (DSIMB), FranceXiao Li, Shandong Provincial Qianfoshan Hospital, China
Copyright © 2023 Jacobs, Ming, Mong, Maragoudakis and Malik. This is an open-access article distributed under the terms of the Creative Commons Attribution License (CC BY). The use, distribution or reproduction in other forums is permitted, provided the original author(s) and the copyright owner(s) are credited and that the original publication in this journal is cited, in accordance with accepted academic practice. No use, distribution or reproduction is permitted which does not comply with these terms.
*Correspondence: Ivan Jacobs, ivan.jacobs@ai4u.ai