Design for and from disassembly with timber elements: strategies based on two case studies from Switzerland
 Cäsar Grüter1,2*
  Matthew Gordon2
  Marcel Muster1
  Fabian Kastner3,4
  Philippe Grönquist5,6
  Andrea Frangi1
  Silke Langenberg3,4 Catherine De Wolf2
- 1Institute of Structural Engineering, ETH Zurich, Zurich, Switzerland
- 2Institute of Construction and Infrastructure Management, ETH Zurich, Zurich, Switzerland
- 3Institute for Preservation and Construction History, ETH Zurich, Zurich, Switzerland
- 4Institute of Technology in Architecture, ETH Zurich, Zurich, Switzerland
- 5Institute of Construction Materials, University of Stuttgart, Stuttgart, Germany
- 6Materials Testing Institute, University of Stuttgart, Stuttgart, Germany
When a timber building gets disassembled and its elements either are burned or biodegrade, the carbon stored in the timber structure gets released to the atmosphere as CO2. Reusing timber elements prevents this process from happening and thus delays the global warming caused by greenhouse gas emissions. Even if there is a long historic tradition of timber reuse in Switzerland, currently a low fraction of a timber building’s elements is being reused after its disassembly. In this study, strategies that could facilitate circular use of timber elements are analyzed. The focus lies on the design process, which is investigated from two perspectives: strategies at the start-of-life of buildings to enable new timber element cycles to emerge (design for disassembly, or DforD), and strategies at the end-of-life of buildings to keep existing timber elements cycles closed (design from disassembly, or DfromD). Two case studies of recently completed multi-story timber-hybrid buildings in Switzerland were analyzed from both perspectives. Regarding DforD, a scoring system was developed that assesses single elements according to their disassembly and reuse potential. Regarding DfromD, a building design optimization tool was created that takes dimensional design tolerances of a building as an input and proposes a procurement-optimized and structurally safe arrangement of reused elements, which are taken from an inventory that is based on the two case studies. It was found that connections between reinforced concrete and timber parts play a crucial role in terms of DforD and that building layouts with DfromD elements may vary widely according to the chosen optimization variable. In conclusion, both applications have the potential to scale up the competitiveness of reused elements.
1 Introduction
The use of timber elements in construction has increased in the last years and is projected to continue growing in the next 25 years (Peng et al., 2023). When a timber building gets disassembled and its elements either are burned or biodegrade, the carbon that was captured by photosynthesis and stored in the wood biomass (commonly referred to as biogenic carbon) gets released back into the atmosphere (Prentice et al., 2001; Andersen et al., 2021). In practice, these processes could be deferred considerably by an integrated design approach that considers keeping elements in place (preservation), reusing the elements for multiple building life cycles, and recycling elements instead of disposal (Stricker et al., 2021), thus reducing resource consumption, waste production, as well as delaying the global warming caused by GHG emissions.
Despite a long historic tradition of timber reuse in Switzerland (Meier, 2021), designing with reused building elements for new construction projects gets applied by only very few actors (Salza and Matériuum, 2020). A pioneer case study (K.1181, extension on an existing storage building, which was largely designed with reused elements) demonstrates the effects of designing with reused building elements: while it can be beneficial in terms of environmental impacts because the embodied emissions of materials from building life cycle phases A1 to A3 (resource extraction, transport, fabrication) and C3 and C4 (waste treatment, disposal) are majorly omitted, economic costs can increase due to the non-standard design process (Stricker et al., 2021).
Timber elements have a large potential to be reused, because contemporary timber construction is characterized as a lightweight technique (Cristescu et al., 2020), where mostly dry (non-glued or non-welded) connections are used (Klinge et al., 2019), which makes the elements easier to assemble, disassemble, and transport. Further, the current large degree of prefabrication in timber construction leads to adequate documentation and traceability of the utilized elements (Müller and Moser, 2022). Limitations in comparability due to large differences in environmental impacts of element reuse depending on the chosen assessment method have yet to be overcome (De Wolf et al., 2020). Regarding environmental assessment of reuse practices with timber structures, two different problems can be distinguished: the assessment of reused building elements in multiple use phases, and the assessment of biogenic carbon.
Tools to overcome this existing lack of data, such as the creation of material passports, which enable the tracking of elements throughout their life cycles, are currently being developed (Honic et al., 2019). While data collection of building elements and material passports gain attention (Honic et al., 2019), the reuse design process is less regarded (Çimen, 2021), and there is a lack of technical criteria to define circular design (Attia and Al-Obaidy, 2021). Such design strategies for element reuse can be understood from two perspectives: Upstream strategies promote design principles that enable the future reuse of new elements over multiple use cycles, while downstream strategies attempt to simplify the process of integrating reusable elements in new building designs (Piccardo and Hughes, 2022). In the present study, the two strategy types are summarized by the terms design for disassembly (DforD; upstream) and design from disassembly (DfromD; downstream). DforD is mainly characterized by the reversibility of connections (Ottenhaus et al., 2023). Three studies dealing with more differentiated indicators and scoring systems to assess the reuse potential were identified and serve as a basis for the present study (Thormark, 2001; Hradil et al., 2017; Pozzi, 2020). Hradil et al. (2017) developed an indicator that assesses the reusability of steel elements; Pozzi (2020) developed a DforD scoring system but limited his work on different timber connection types; and Thormark (2001) investigated an assessment method based on limited factors (working risks, time expenditure, tool requirements, accessibility of the connections, and damage to the elements caused by disassembly) that do not include a high level of detail and are not weighted against each other.
As a counterpart of DforD, DfromD includes matching reusable elements with designs of new projects. Digital databases that include a broad range of elements available for reuse might change the workflow for the design with reused building elements (Condotta and Zatta, 2021). Digital tools could support designers in the decision-making process and thereby enhance the process. Some examples of digital tools that enhance designs with reused elements and balance their environmental and economic impacts already exist (Brütting, 2020; Kim and Kim, 2020), but they have mainly been studied in the context of structural steel elements. Tomczak et al. (2023) developed a matching algorithm that assigns reusable elements to a given design. However, their tool does not optimize the geometry of that design according to the element availability.
The goal of the present study is to contribute to a better timber element reuse by elaborating on the potential of both DforD and DfromD strategies. For each of the perspectives, a practical method was developed, with potential applications for circular practices with timber elements. First, a scoring system to assess timber elements in new designs according to their DforD usability was created. Second, an optimization tool to facilitate the early-project-stage integration of DfromD elements was developed. In particular, the DforD score grades the reusability of single elements according to a set of technical indicators from the product and design. The DfromD optimization tool matches reusable elements from a stock with a design input that includes certain dimensional tolerances and is limited to a simple column/beam structure. Within this matching process, the building layout is optimized according to the available elements. Structural analysis of the individual elements, which defines the maximum heights (for columns) and spans (for beams and slabs), is included in the optimization. Both practical methods were based on the same two case studies from Switzerland.
2 Materials and methods
2.1 Case studies and general method
The two case studies are modern residential timber-hybrid buildings in the Swiss city of Winterthur, shown in Figure 1. Project sue&til2 was completed in 2018 for the client Allianz Suisse. Two architects, weberbrunner architected ag and Soppelsa Architekten GmbH, were involved in the planning. In total, the project consists of 20 houses, from which the data of the first floor of building part SA77 + SA79 was included in the present study. The floor space of sue&til is 59,245 m2, and the total building volume is 178,850 m3. In the second project Krokodil3, which was built for multiple clients and completed in 2021, the architect was Baumberger & Stegmeier AG. The building has dimensions of 106 × 65 × 25 m and a courtyard of 2,000 m2, and it includes a total number of 248 flats. In the present study, the building part GAIWO was considered. For both projects, Timbatec Holzbauingenieure AG designed the timber construction and provided the data used in this study.
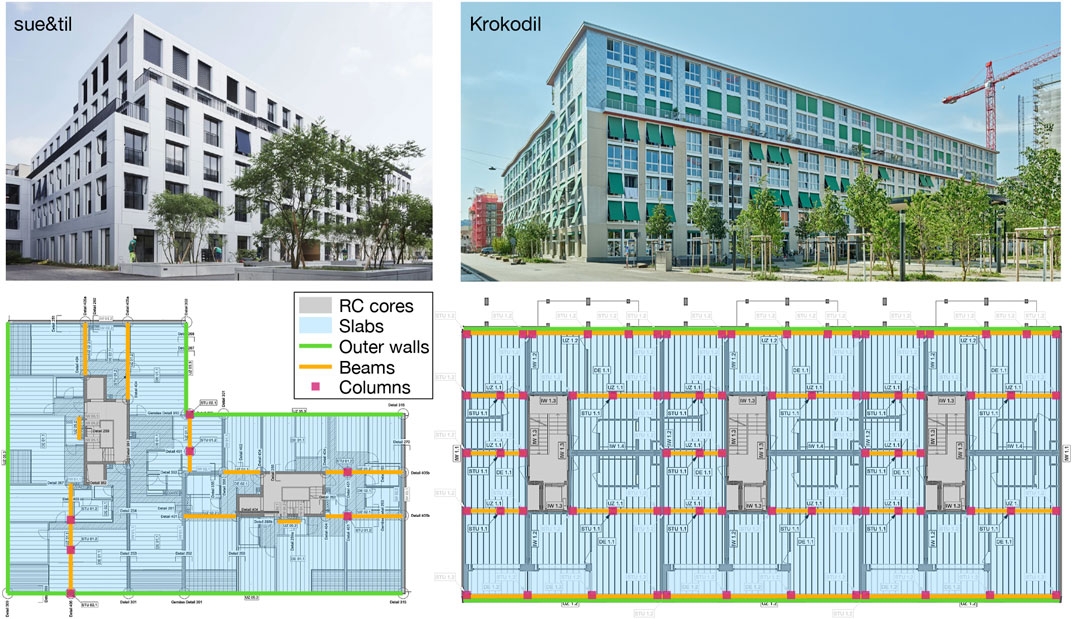
FIGURE 1. Project pictures of the finished buildings (top) and illustrative floor plans with considered element types (bottom) of sue&til, building part SA77 + SA79 (left) and Krokodil, building part GAIWO (right).
A major difference between the two case study buildings lies in the sequence of their construction processes. In sue&til, the glued laminated timber (GLT) slabs and timber frame walls were assembled on site after the completion of the reinforced concrete (RC) cores, whereas in Krokodil, the column/beam structure and the slab elements were pre-assembled, and timber boards served as a formwork for the later poured RC cores.
Each approach (DforD score and DfromD optimization tool) used a subset of the structural elements of the case study buildings (Figure 1, bottom). In particular, the DforD score assessed slabs, outer walls, and beams, and the DfromD optimization considered columns, beams, and slabs. The two independent approaches are thus connected by a consistent stock of elements (see Figure 2). Both an analysis for future reuse and tools for present reuse help ensure that the buildings elements will flow back to the element stock at the building’s end-of-life. The detailed methods of the DforD score and DfromD optimization tool are described in the following sections 2.2 and 2.3.
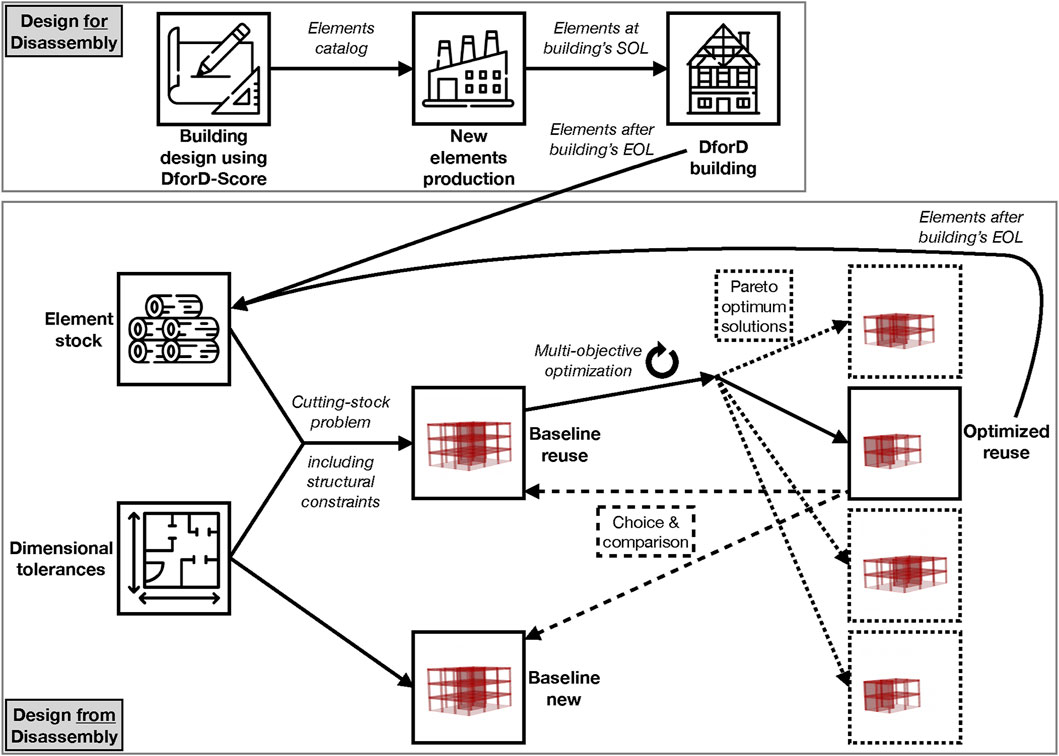
FIGURE 2. Relationship between DforD and DfromD, with the detailed workflow of the DfromD optimization tool (bottom); SOL = start-of-life; EOL = end-of-life.
2.2 DforD score
Prior to the score development, the mass fractions of the different element types were calculated for both case studies to identify the relevant proportions of the considered elements. To assess the single elements’ DforD characteristics, a score was established based on a synthesis of previously developed scoring systems by Hradil et al. (2017), Pozzi (2020), and Thormark (2001). In Figure 3, an overview of the new scoring system is presented. A review of the previous works resulted in four categorically different indicators to describe the DforD potential on different levels of hierarchy: reusability, structural connections, damages during disassembly, and accessibility/independence. Based on this finding, a model is proposed for two levels of analysis: level 1 for general design (reusability), and level 2, which is a sublevel of level 1, for operation of dismantling and joints (structural connections, damages during disassembly, and accessibility/independence).
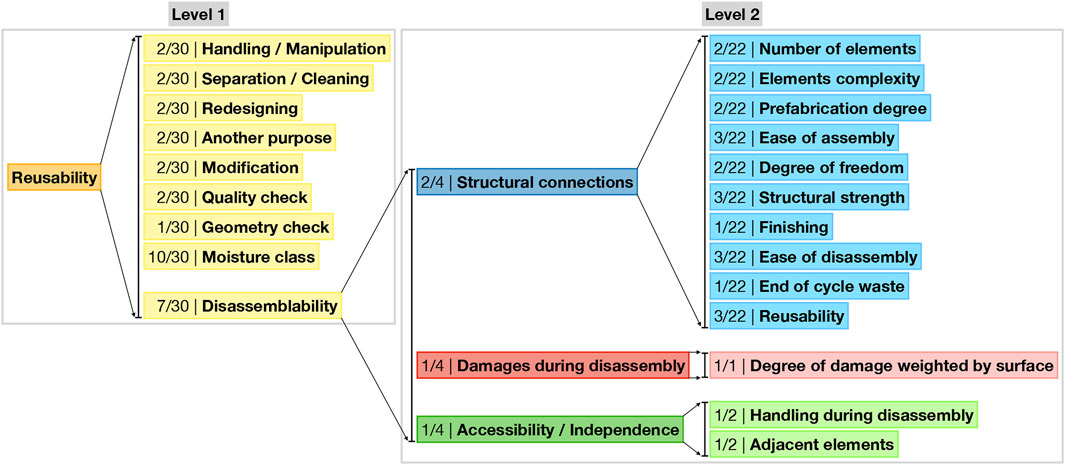
FIGURE 3. Overview of DforD score: (Level 1) Indicators of reusability, (Level 2) Indicators of subcategory disassemblability. The numbers represent weighting factors of each indicator and subcategory. Reusability was derived from Hradil et al. (2017), adding the subcategory moisture class, and structural connections was derived from Pozzi (2020), excluding the costs subcategory. Thormark (2001) highlighted the importance of two procedural indicators: damages during disassembly and accessibility/independence.
Starting from the more general indicator of reusability, Hradil et al.’s (2017) subcategories for the assessment of the reusability of steel structures are extended with a subcategory for the moisture class (service class in Eurocode), accounting for the degradation of timber. Next, the reusability indicator’s subcategory disassemblability of level 1 is subdivided into the operational indicators of level 2. This implies that the scores achieved for the operational indicators result in a cumulated score for the disassemblability, and thus influence the overall score of the reusability as well. At level 2, the subcategories of the indicator structural connections were derived from the work of Pozzi (2020), excluding the subcategory for financial costs. Both indicators damages during disassembly and accessibility/independence were supported by the disassembly assessment method proposed by Thormark (2001), and thus reflect the factors of working risks, time expenditure, tool requirements, accessibility of the connections, and damage to the elements caused by disassembly.
The weighting of each indicator and subcategory is conducted using a normalization approach (in which all indicators/subcategories are rated from zero to one) to transform previous quantitative indicators/subcategories derived from the literature to the new system. For every indicator/subcategory, a score closer to zero implies a more negative assessment (e.g., an element gets more damaged during disassembly), while a score closer to one implies a more positive assessment (e.g., an element gets less damaged during disassembly). The numbers in Figure 3 represent the weighting factors of each indicator/subcategory with respect to the overlying indicator/subcategory, e.g., the score for the disassemblability is calculated by the cumulation of 2/4 (=50%) of the score for structural connections, 1/4 (=25%) of the score for damages during disassembly, and 1/4 (=25%) of the score for accessibility/independence. This cumulated score results in a normalized number (from zero to one) as well. The new subcategory moisture class is proposed to have a significant weighting impact (one-third of total reusability indicator), as the time-dependent change in material properties of wood may vary considerably under different climatic conditions (Ehrhart et al., 2021). The normalization procedures and associated assumptions are summarized below.
• Moisture class: Consideration of three classes according to SN 505265:2012 (SIA, 2012) which correspond to the service classes of Eurocode 5 resulting in a range from 0 (moisture class 3), 0.5 (moisture class 2), to 1 (moisture class 1).
• Structural connections: Transformation of the initial weighting system for each subcategory by Pozzi (2020) from 1 (low DforD suitability) to 4 (high DforD suitability), which was adapted to the range of 0–1 with three intervals.
• Degree of damage weighted by surface: Definition of five intervals from 0 (total), 0.2 (high), 0.4 (medium high), 0.6 (medium low), 0.8 (low), to 1 (none).
• Handling during disassembly: Definition of a range from 0 (heavy machines are required to disassemble the element) to 1 (element is easily disassemblable by one person by hand).
• Adjacent elements: Based on the ratio of adjacent elements that need to be removed to access the considered element on a reverse scale (1 minus ratio). Additionally, the requirement of heavy machinery (not possible by hand or hand-held machinery) is considered by applying a factor 0.5; e.g., 2 out of 5 adjacent elements (1 − 0.4 = 0.6) need to be removed by heavy machinery: score = 0.6 × 0.5 = 0.3.
To apply the scoring system, two illustrative floors (see Figure 1) were used: the first floor of the building part SA77 + SA79 at sue&til; and the standard floor (first to fourth floors) of the building part GAIWO at Krokodil. Slabs, outer walls, and beams were the only element types that were assessed. Other elements (e.g., inner walls, columns) were considered as less relevant, because they are almost identical in the two case studies. In the case study sue&til, different product layouts within the assessed element types were considered individually. For both case studies, the different connection types (e.g., glued or screwed) of one element type to its adjacent elements were considered. The option of cutting off elements next to the connections was not considered in the assessment, so the disassembled elements retain their maximum dimensions.
Returning to the starting point of the proposed scoring system based on literature by Hradil et al. (2017), Pozzi (2020), and Thormark (2001), the interpretation of the quantitative results proposes a linear increase in utility with increasing results. For the reusability indicator, the predefined range is then discretized into intervals to qualitatively assess the results (0 corresponding to “impossible”, 0.5 corresponding to “somewhat easy”, 1 corresponding to “very easy” to reuse). Along these lines, we propose a threshold value of 0.5 for the aggregated reusability indicator above which reuse should be considered a viable option. Scores below this threshold would indicate that the effort for the element reuse is potentially larger than its benefit and thus strategies such as recycling or energy recovery would need to be considered. For results ranging from 0.5 to 1, we propose an interval-based interpretation of the required reuse effort from 0.5 to 0.67 (large); 0.67 to 0.83 (medium); 0.83 to 1 (small).
2.3 DfromD optimization tool
The DfromD optimization tool was implemented using the Grasshopper visual programming environment, using Rhino for visualization, using a design model with parametric controls, and data on the stock of available elements. The goal of the DfromD optimization tool, more specifically the user interface in Grasshopper, is to match reusable elements from the case study inventory to a new design, which is optimized according to the stock availability. Initially, the tool creates a baseline design with the assumption of new elements from default values for a set of user-supplied design parameters (design called baseline new). Each parameter is also assigned an acceptable range, from the tool user’s point of view, it could be altered to. Each design produced by tweaking the parameters was evaluated on its viability to be realized with reused elements, by solving a cutting stock problem (CSP) between its elements and the case study inventory. On top of the normal objective to minimize cut off waste, each problem formulation contains additional constraints produced from a structural analysis of the design iteration. This ensures each design element is only fulfilled by viable stock elements. When fulfilled entirely with reused elements, this creates the next design analysis case, with the baseline design parameters but a different procurement (design called baseline reuse). From here, a multi-objective optimization (MOO) algorithm is used to alter the design to simultaneously minimize the cut-off waste, mass, and difference from the baseline design, returning designs that are Pareto-optimal for these variables (design called optimized reuse). As each parameter has an independent range, a minimal functional unit could be defined based on floor area, above which a design iteration is considered a valid alternative. The baseline new, baseline reuse, and selections from the optimized reuse designs are then compared.
2.3.1 Element stock
Timber elements from the two case studies sue&til and Krokodil were used as the tool’s hypothetical inventory (Timbatec, 2019). The element types considered in the scope of this tool are columns, which are split up into inner and outer, as well as beams and slabs. Inner column elements were included from both case studies, whereas outer column elements were only present in sue&til. Project Krokodil consists of load-bearing wall elements at the envelope, which were not considered for the inventory. To enable a one-dimensional optimization of the slab elements, the customary element width was set to 0.6 m, which corresponds to the standardized width of sue&til’s slab elements. The slab elements of Krokodil on the other hand have a wide variety in widths and thus were not considered. In Table 1, the number of elements and the domain of the lengths, which are corresponding to the heights of columns and to the spans of beams and slabs, are listed for every element type.
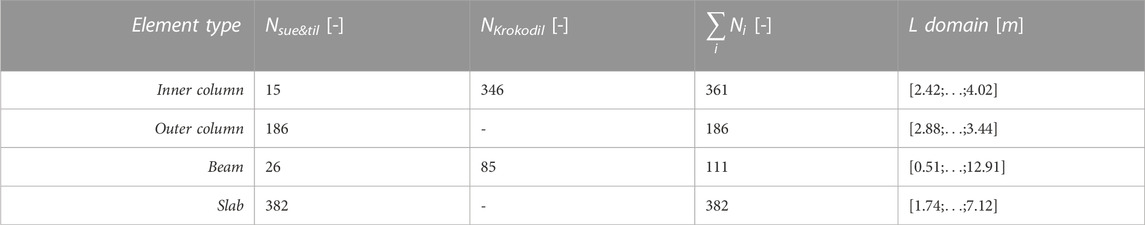
TABLE 1. Element types in stock with number of elements per case study (Nsue&til/NKrokodil), total number of elements (ΣiNi), and domain of the element lengths in meters (from minimum to maximum within every element type).
2.3.2 Design input
Six design parameters were used to generate the test design (see Table 2). The building type, column radius and slab thickness are set by the user initially and are considered constants in the structural analysis and design visualization. For the baseline new and baseline reuse scenarios, the default design values are set as the median of each parameter range. The outcome of optimized scenarios starting from default design values closer to either extreme was not studied here.
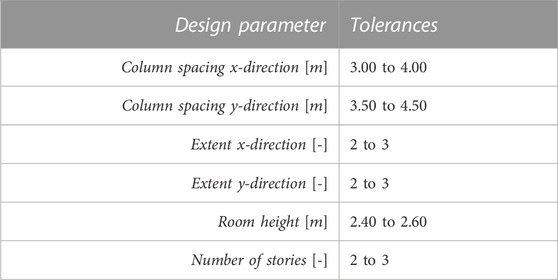
TABLE 2. Design parameters with dimensional tolerances.
2.3.3 Structural constraints
To ensure that the reusable elements still meet the normative requirements in their new placement situation, structural constraints were formulated for all element types. For the sake of simplicity and for illustrative purposes, only ultimate limit state constraints of members are considered in the present study, while serviceability limit state constraints, such as deflections of timber beams and slabs, which are governing in some cases, are ignored. Also, for the same reasons, no connections are designed, as a suitable connection system can always be adapted to existing members. The design system calculates the structurally maximum valid and useable length of each stock piece (e.g., the height of a column or the span of a beam) and determines whether each target design part type is realizable from it. This is applied by the CSP solver as an additional constraint on how each piece is cut.
All the considered elements are made of softwood GLT. Regarding the strength class according to SN 505265:2012 (SIA, 2012), GL24h was assumed for every element, even though there were individual beams and slabs with higher strengths (GL32h). This is a structurally conservative assumption. The relevant considered strength parameters on design level with a moisture content of 12% are the compressive (fc,0,d = 14.5 N/mm2), bending (fm,d = 16.0 N/mm2) and shear strength (fv,d = 1.8 N/mm2).
The loads acting on the individual element types were formulated in parametric form to consider the current design parameters and individual element dimensions (see Table 3). Three load types were considered according to SN 505261:2014 (SIA, 2014): self-weight, superimposed load and live load. For the columns, these were formulated as point loads [kN] and for the beam and slab elements as line loads [kN/m]. Self-weight was based on either the volume for columns or the cross-sectional area for beams and slabs, using a density of 4.39 kN/m3 for GLT (KBOB, 2022). However, since the self-weight makes up only a small share of the total loads, the initial stock lengths were taken for the calculation of the column’s volumes and there is no recalculation for each design iteration.
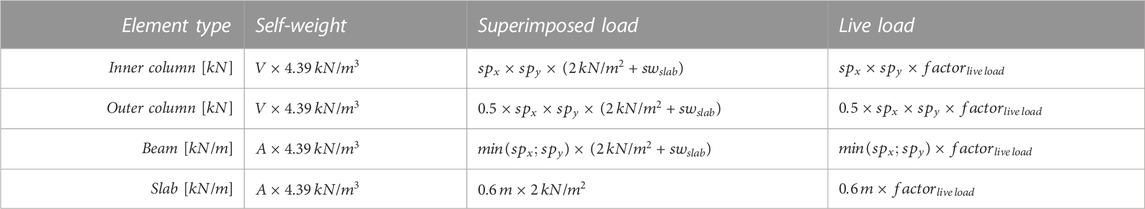
TABLE 3. Load types for every element type on characteristic level.
The superimposed and live load types also include design geometry parameters in their formulation. Since the slabs are supported by beams, which in turn are supported by the columns, the self-weight (sw in Table 3) of the slab acts as a superimposed load on the other elements. The superimposed load for timber slabs is 2 kN/m2 based on manufacturer data (Lignatur AG, 2022). The share of this load is calculated including the column spacing parameters in the design (spx, spy). All outer columns are calculated as half the load of inner columns, for simplicity.
The column elements carry the loads of all the overlying stories and not just the ones of the present floor as it is for the beams and slabs. Therefore, the characteristic value of the loads acting on one column was multiplied by the number of stories to represent the loads on the lowest floor, which is the critical one from a structural perspective. To avoid further differentiation, this maximum value was taken for the columns on every floor, which is again a structurally conservative assumption. To include the uncertainty factors and transform the loads from characteristic level to design level, Formula 1 was used according to SN 505260:2013 (SIA, 2013). The permanent loads are considered with a factor of 1.35 and the live load with 1.5.
Formula 1: Total load on design level.
For every element type, the material properties and loads were combined in a limit condition. The limiting failure state of a column was assumed to be the buckling under axial compression force. For a beam or slab element, both failure under bending and shear stress were considered as limit conditions. The dimensional limits associated with these force limits were determined by plotting loads across the relevant dimensional ranges, and geometrically determining their intersection with the limit condition. The results of this study are limited to these specific load cases and are not valid for any other ones (e.g., earthquake).
Formula 2 represents the limit condition for a column element. It is formulated by the multiplication of the buckling reduction factor (based on SN 505265:2012 (SIA, 2012), Section 4.2.8) with the compressive strength, followed by the subtraction of the effective axial stress, which results in a value that needs to be greater than or equal to 0. Since the column connections were considered as fixed supports, the buckling length was reduced to 50% of the effective length.
Formula 2: Limit condition for column element under axial compression.
Since there are many different load configurations within the stock due to the high variety in column lengths, only the largest load configuration per cross-section type is considered.
Concerning the beam and slab elements, the limit conditions for both bending and shear stress are stated in Formula 3 and Formula 4 and correspond to sections 4.2.3 and 4.2.5 in SN 505265:2012 (SIA, 2012), respectively. The maximum bending stress appears in the middle of the span. It is given by the division of the effective bending moment (Md = (Ed × l2) ⁄ 8) and the section modulus ((Wy = w × h2) ⁄ 6), where w stands for the cross-section width and h for the cross-section height. The maximum shear stress appears at the supports and is given by the term 1.5 × Vd ⁄ ((w × h)), where the effective shear force is Vd = Ed × l ⁄ 2.
Formula 3: Limit condition for beam and slab element under bending.
Formula 4: Limit condition for beam and slab element under shear.
For the beam and slab elements every load configuration is considered. These do not depend on the element lengths, as the loads are given per meter, but only on the cross-sectional areas, which remain constant over time.
2.3.4 Cutting stock problem (CSP)
The CSP is solved as an integer-linear programming (ILP) problem, using Python-MIP (version 1.13) as the solver interface and the Grasshopper Hops plugin (version 0.13.1) to communicate between software. Since 1D and 2D cutting stock problems are formulated differently for the solver, the two-dimensional slab elements are simplified. A predominant width of 0.6 m was chosen from the stock as a standard, allowing the pieces to be considered by their differing 1D lengths. The slab shapes of each design iteration are then tiled into individual parts. Each slab is initially divided to span across the shorter column spacing direction (or in line with the longer building extent if equal). These are then divided along their length by the standardized width from the stock, to define a size and number of required parts. The ILP solver returns a matching between the stock and design iteration with the cut-off waste minimized (being the unused portions of any stock pieces from which design pieces were cut). Even though Brütting et al. (2020) showed that a mix between reused and new elements could lead to the lowest environmental impact, only the case of 100% reused elements was considered in the present study.
2.3.5 Multi-objective optimization (MOO)
The design model is optimized across three goals: minimizing the cut-off waste, mass, and difference from the baseline design. The MOO runs using the Grasshopper plugin Octopus (version 0.4). Using the parameters and limits described in Table 2 as the genome, its objective values are derived from the CSP matching output, the geometry of the generated model, and the state of the genome itself. Once run, the set of pareto optimal solutions is presented to the user for further visualization and analysis. The illustrative optimization of the present study was run over 50 generations with a population size of 50.
The cut-off waste was selected as an optimization variable to represent the adverse environmental impact of a certain design solution, which should be minimized. To calculate the cut-off waste [kg], the resulting matching pattern from the Hops component is applied on the element stock to select the elements considered for the current design configuration. The design’s part lengths are subtracted from the lengths of these stock elements. The mass is then calculated from the part length, stock cross-section and product material density.
According to Brütting (2020), the financial price linked to the disassembly, transport, testing, storing, and reassembly of the elements of a certain design is represented by the mass [kg], which was therefore chosen as an optimization variable. It refers to the sum of all masses of the individual stock elements used for a specific solution, without reduction of the cut-off waste, and is calculated by multiplying the element’s volumes with the density.
To calculate the third optimization variable, the difference from the baseline design [-], all the six design parameters (see Section 2.3.2), normalized on a range between 0 and 1, are considered individually. First, their individual differences from their initial user-settings are calculated. Then, the absolute values of the results are added up.
2.3.6 Solution comparison
A scheme was set up to compare a chosen optimized reuse solution with both the baseline new and baseline reuse designs from various impact perspectives. It is used alongside the user interface of the MOO solver and assists the user in making decisions between possible designs in the pareto front.
To emphasize the optimization’s benefits, the prevented cut-off waste in comparison to the baseline reuse scenario is calculated. This amount is represented by the difference between the recorded cut-off waste of the baseline reuse scenario and the optimized cut-off waste of the optimized reuse scenario.
As a comparison to the baseline new scenario, the prevented waste is displayed. It is represented by the total mass of the optimized structure, being the amount of material to which an additional use cycle is given when the optimized reuse scenario is chosen instead of using new elements.
3 Results
3.1 DforD score
The calculated mass fractions of the element types are listed in Table 4. For both case studies, the slab elements make up a mass fraction of more than 90% of the element types considered.

TABLE 4. Mass fractions element types.
The results for the indicators structural connections, damages during disassembly and accessibility/independence are presented in Figure 4 for each element type per case study.
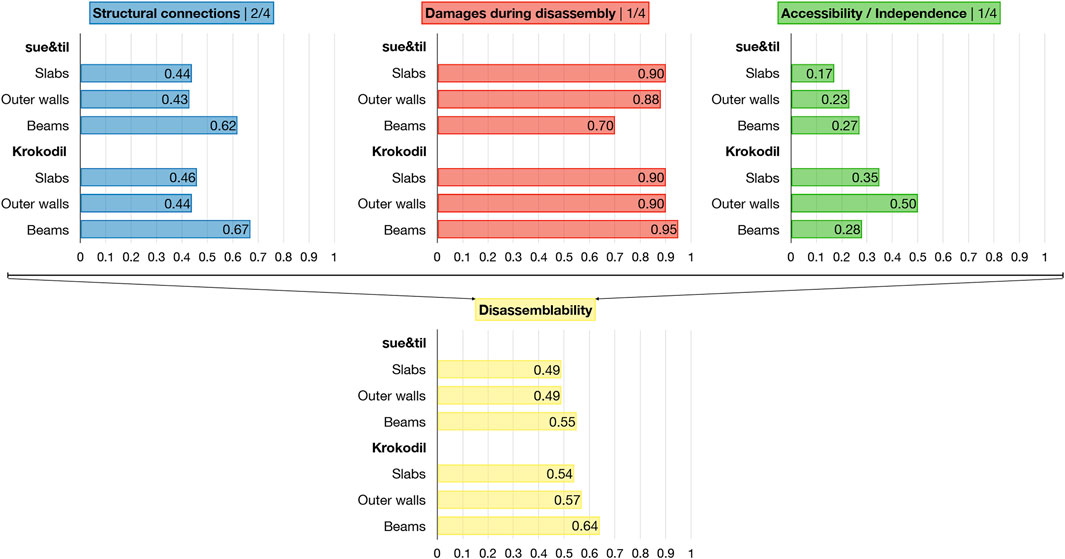
FIGURE 4. Scores per element type for the indicators structural connections, damages during disassembly, and accessibility/independence and for the resulting subcategory disassemblability.
Generally, the elements of the project Krokodil reach a higher score compared to the ones of sue&til. The largest differences between the assessments of the two projects occur in the indicators damages during disassembly for the beams (sue&til: 0.70/Krokodil: 0.95) and in the indicators accessibility/independence for the slabs (sue&til: 0.17/Krokodil: 0.35) and outer walls (sue&til: 0.23/Krokodil: 0.50). Only the scores of the slabs in the indicator damages during disassembly are identical for both projects. In the overall reusability indicator, the individual scores per element type of the two case studies are much closer to each other (see Figure 5).
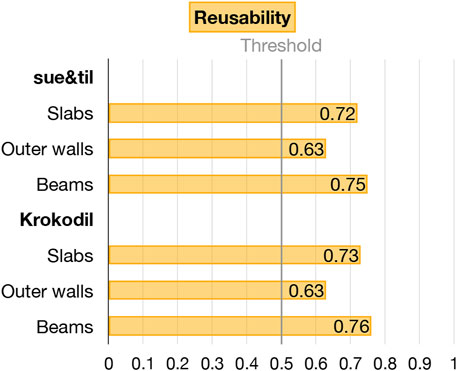
FIGURE 5. Scores per element type for the indicator reusability.
According to the proposed result intervals, the effort required to reuse the outer wall elements of both case studies at the building’s end-of-life is large, which is mainly due to their size. For slabs and beams, the assessed effort is medium. The comparison of the results for the different connection types is shown in Figure 6 by the example of the most used slab element types per case study. In the project Krokodil, beams are not only used to support the slab elements in the middle of the building, but also at the building’s envelope. For this reason, there are two additional columns in Figure 6 for sue&til, where outer wall and window elements were used to support the slabs at the envelope of the building. While the slabs connected to inner wall elements reach comparable results for both case studies (sue&til: 0.72/Krokodil: 0.71), there is a larger difference for the ones connected to a RC core.
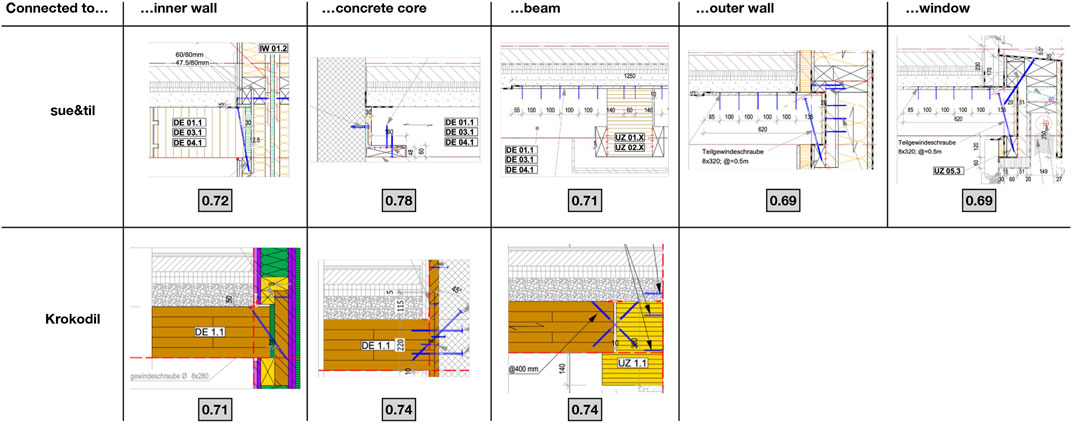
FIGURE 6. Scores for the indicator reusability of a slab element per connection type. Source element details: (Timbatec, 2019).
3.2 DfromD optimization tool
3.2.1 Tool output
The results of the illustrative optimization carried out in this study, which considered column, beam, and slab elements from the two case studies, are plotted in Figure 7 as a 3D representation of the optimized reuse solutions in Octopus. For this example, a total number of 50 generations, each consisting of 50 new solutions, was run and 61 non-dominated solutions were found (indicated by the gray surface). The three axes represent the three optimization variables—cut-off waste (x), mass (y) and difference from the baseline design (z)—that were minimized. For each variable, the axis is constrained to the extents of the saved solutions. This means that the point where the three axes cross is not at (0; 0; 0), but at (12.39; 13,009.64; 0) in this case.
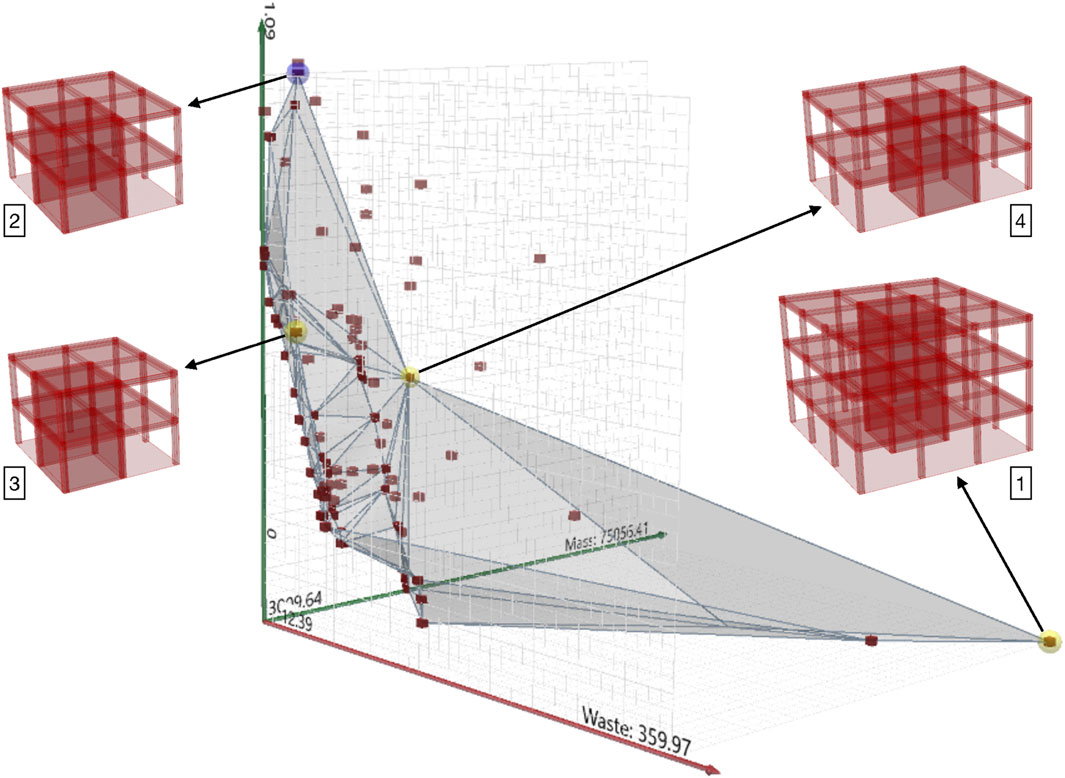
FIGURE 7. 3D representation of the optimized solutions in Octopus. Axes: (x) cut-off waste, (y) mass, and (z) difference from the baseline design. The gray surface represents the Pareto front. Illustrative optimum solutions: (1) baseline design, (2) minimum cut-off waste, (3) minimum mass, and (4) minimum cut-off waste and mass while having a value of 3 in one of the dimensional extents (extent x-direction, extent y-direction, or number of stories).
Four different points from the Pareto front were selected to visualize the output of the Rhinoceros model. The first one (1) is the baseline design, which is marked in yellow and is on the very right side in the plot of Figure 7. As it uses the default design parameters, it inherently occupies the lower bound for objective 3. The solution marked in blue (2) possesses the lowest cut-off waste from all the solutions that were found. The solution marked in yellow, which is closest to the z-axis (3), minimizes the mass variable the most. The third yellow marked point (4) was chosen because it is the best—both in terms of minimum cut-off waste and mass—that has a value of 3 in one of the dimensional extents, which implies a larger functional unit.
To clarify the dimensional differences between solution (2) and (3), their models were overlaid with each other in Figure 8. The building in red represents the minimum mass solution (3) and the building in gray represents the minimum cut-off weight solution (2). As an example for the suitable matching, there is a slab element with a length of 7.10 m that appears 36 times in the stock. With a predefined column radius of 0.15 m, the column spacing in x-direction was set to 3.40 m by the MOO in solution (2). In this way, one stock element of length 7.10 m could be used for two slab elements in the design, without any waste generation (2 × (3.40 m + 0.15 m) = 7.1 m).
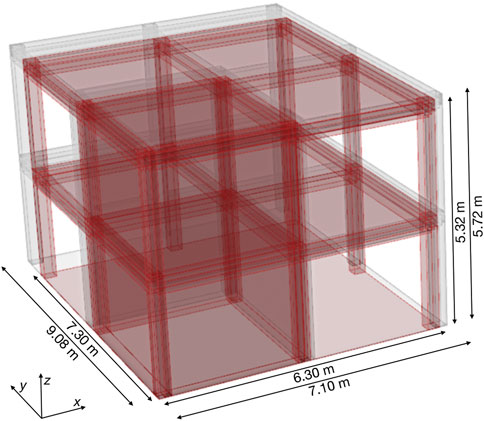
FIGURE 8. Comparison between minimum cut-off waste (gray) and minimum mass (red) solutions.
The minimum cut-off waste solution (2), marked in blue in Figure 7, was chosen to be further analyzed (illustrative optimization results see Table 5).
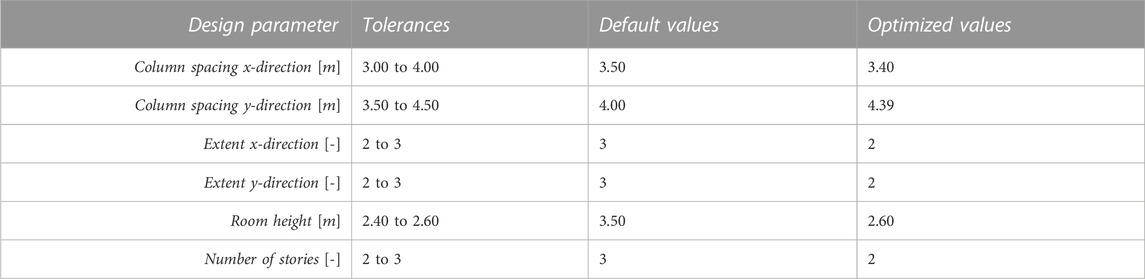
TABLE 5. Optimized design parameters minimum cut-off waste solution (2).
The scheme described in Section 2.3.6 highlights different benefits of the baseline reuse solution over both the baseline new and baseline reuse designs for the illustrative optimization carried out in the present study. By reusing elements instead of disposing them, almost 21 t of GLT waste could be prevented. The cut-off waste could be decreased from almost 360 kg to only around 12 kg by choosing the optimized reuse instead of the baseline reuse design.
3.2.2 Performance analysis
The objectives of the MOO system were evaluated across its run. Both the optimized values for cut-off waste and mass were compared to their initial values after the first generation. A population size of 50 was chosen for this investigation. The results, visualized in Figure 9, show that the cut-off point, where the effort for further optimization is expected to exceed the value required for most users, according to the elbow method (Bholowalia and Kumar, 2014), appears after 20 generations.
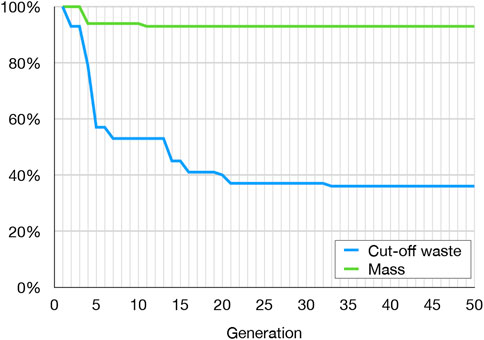
FIGURE 9. Optimized values of cut-off waste and mass per generation in [%] of the value after the first generation.
The calculation method introduced in this study that includes structural constraints indicates, in comparison to the calculation method without structural constraints, a different set of feasible solutions that are more viable for construction. However, for the illustrative optimization the results differ only slightly, as the minimum cut-off waste in the calculation without structural constraints is 5% lower and the minimum mass 2% lower than the values achieved with structural constraints.
4 Discussion
The two practical methods developed in the present study, a DforD score and a DfromD optimization tool, were both applied to two case studies in Switzerland. This resulted in various findings in terms of barriers within the design process related to timber element reuse and strategies to overcome them. The results are discussed individually for each practical method.
Regarding the DforD score application, the results of the mass fraction calculations clearly show for both case studies that the slabs constitute by far the largest part of the assessed element types. This emphasizes the large effect that slab elements have when the DforD score is used to make a statement about the whole building, and thus generally endorses the approach of predominantly focusing DforD practices on the elements with the greatest impact.
In general, the assessment of the elements with the DforD score showed a higher variance between the two case studies in the results for the disassemblability than for the reusability. This is mostly due to the heavily weighted impact of the moisture class, which is considered in the reusability and is the same for both projects. As Ehrhart et al. (2021) showed, the time-dependent change of material properties of GLT in moisture class 2 is not that severe, which could be taken as a reason to decrease the impact of the moisture class in the DforD score. However, more such long-term investigations with different materials and under different conditions are needed.
In addition to the moisture class, also the effect of load history might be considered in future development of the DforD score. The duration of load effect, which causes higher damages on a timber element with increased load and duration (Brandner and Ottenhaus, 2022), could be taken as a further subcategory for the reusability assessment. Crews et al. (2008) developed an interim industry standard, which grades reusable elements considering the duration of load effect, and could therefore serve as a basis for this subcategory. Regarding the durability of glues in laminated timber elements, the influence of moisture on different glue types and wood species has already been well studied (Musah et al., 2021; Purba et al., 2022), while less research exists on the duration of load effect on glues. As for the moisture class, more long-term investigations are also needed for a systematized quantification of the duration of load effect (Brandner and Ottenhaus, 2022).
The comparably low reusability scores of the outer wall elements and the correlating categorization into a large effort for reuse can be justified by their complexity and specific composition, which make them difficult to reuse for another purpose. On one hand, the reuse of large-sized and high quality elements (e.g., entire façade elements) would be very impactful, but on the other hand it is linked to a large risk regarding the availability due to multiple factors that need to match exactly when the elements are required (matching supply with demand), such as the demolition schedule or logistics (Salza and Matériuum, 2020).
A main reason for the differences in the results of the slab elements connected to a RC core in both case studies is their contrasting sequence of construction processes as described in section 2.1. As sue&til’s slab elements scored a higher reusability compared to Krokodil’s, the method of pouring the RC cores first and then adding the timber parts is considered the one to be preferred. In a broader sense, a distinct separation between the RC and timber parts is proposed, which complies with the findings of Hradil et al. (2014). Moreover, the higher variance within the reusability results for the connections to the RC cores in comparison to the pure timber connections implies less standardization for this connection types. However, Klinge et al. (2019) stated that a higher standardization leads to a higher acceptance for reuse, and Geldermans (2016) highlighted that if connections are already standardized, it is less important to standardize the dimensions of the connected elements. Therefore, it is proposed to better standardize connections between RC and timber parts.
The approach towards an interpretation of the DforD score’s results by setting a reuse threshold at 0.5 might not reflect actual conditions. Finding the exact values for the reuse threshold and the boundary between the recycling and energy recovery strategy was beyond the scope of the present study. Determining an applicable cut-off point will require tuning with data from further DforD projects combining expert opinions on the assessment. With the chosen threshold value of 0.5, all elements considered in this study were quantitatively classified as reusable, subject to an eventually required reuse effort (see proposed interval-based interpretation in Section 2.2), which corresponds to the author’s subjective judgement. Without stating any general validity, the prime purpose of the DforD score creation was to propose a list of indicators as comprehensive as possible to allow for comparability, levels of hierarchy to highlight the dependence within the indicators, and a workflow method to do the assessment.
It needs to be noted that the weighting of indicators and subcategories are not tuned with empirical data but are proposals based on the literature reviewed (Thormark, 2001; Hradil et al., 2017; Pozzi, 2020) and the authors’ personal experiences. Therefore, they can be seen as a starting point for further research and should be verified and improved using empirical data of DforD construction projects in the future.
In comparison to previous studies that were mainly focusing on reused steel elements (Brütting, 2020; Kim and Kim, 2020), the present DfromD optimization tool was created for a stock of timber elements. The high potential for the reuse of such elements was discovered in their ease of handling between two use cycles and in their capability to temporarily store carbon. Moreover, a method was formulated in the present study to consider 2D slab elements, which is an extension of previous structurally integrated studies where only reticular structures, such as trusses and frames, were optimized. The optimization includes changes in the geometry according to the availability of reusable elements, which is an extension compared to the tool developed by Tomczak et al. (2023).
The choice of the optimization variables—minimizing cut-off waste, mass, and difference from the baseline design—is justified by the literature review conducted in this study. As reusing elements without a change in shape was discovered to be the most effective way to reduce both the ecological and economic impacts (Kim and Kim, 2020), the minimum cut-off waste is believed to be an appropriate indicator. Regarding the minimization of the mass, there were three reasons found for the justification of its inclusion in the optimization. Firstly, the mass is an appropriate indicator for the price of a building according to Brütting (2020). Secondly, since only one material type was considered in the element stock, the GHG emissions are indirectly represented by the mass. If there were different material types, their factors quantifying the GHG emissions according to the KBOB database (KBOB, 2022) would differ and thus the mass would not linearly correlate with the total emissions. And thirdly, taking the prevented waste as an output of the tool could lead to a rebound effect, as stated by Castro et al. (2022). Namely, large building designs could be preferred so that more elements are reused, and thus more waste is prevented. However, large buildings generally have a greater adverse environmental impact. Therefore, having the mass as a minimization variable counteracts this rebound effect. The difference from the baseline design variable represents the compromise the customer needs to make in comparison to the initially intended design, which should be minimized. To increase the informative value of this variable, the floor area, which could be considered an important decision variable for the customer, could be directly linked to it.
Even though the mass was taken as an optimization variable representing the price, there was no direct economic comparison between the optimized reuse and the baseline new scenario implemented into the tool within the scope of this study. This was due to the lack of specific data. However, in the current context, the price per ton of reused elements is estimated to be higher than the price per ton of new elements (Stricker et al., 2021). The life cycle costing model proposed by Wouterszoon Jansen et al. (2020) could be a possibility to include a quantification of the price into the tool. A further consideration of the price refers to the operational costs, e.g., for heating or cooling, which increase with the size of a building. The same consideration is valid for the operational GHG emissions. However, neither of these values are directly considered in the tool and thus represent a possible extension.
Some limitations regarding the tool’s accuracy were discovered. For example, the column radius and slab thickness are initially defined and not updated throughout the optimization, leading to less accurate outputs of the tool. Predefining a slab thickness that deviates by, for example, 6 cm from the actual slab thickness selected from the stock during the optimization would lead to an inaccuracy in the story heights of exactly these 6 cm. Consequently, the optimized column heights would also differ by 6 cm from the truly intended ones. Moreover, the design mass, which is calculated for the quantification of the prevented waste, is also based on the initially set values of the column radius and slab thickness.
The illustrative solutions generated by the tool tended to promote simple designs with minimal dimensions, which was to be expected because it is encouraged by both the minimization of the cut-off waste and mass. Thus, the tool points out that the design with the lowest environmental as well as economic footprint is usually the simplest. However, the differences between the baseline new and the optimized reuse scenarios of the illustrative optimization are very extreme. In practice, a client of a designer using the tool, e.g., a builder, would probably not agree on decreasing the building’s dimensions to this extent. Therefore, industry implementations would rely on well-defined minimal functional units to allow individual design parameters to use the extremes of their range, but not all simultaneously. Even with such an extension of the tool, the customer flexibility needed to be quite high, because the dimensions of the optimized design might still differ from the initially intended design.
The integration of structural analysis into the tool showed no large change in the optimally matched (optimized reuse) solutions. Nevertheless, structural reliability is still considered fundamental in certain cases. Such cases could be, for example, a beam that was initially supported in three points and afterwards only in two, or a column that initially carried the loads of one overlying story and afterwards that of three. A possible mechanism to partly overcome this issue and to increase the structural redundancy would be to specify design criteria whereby elements that were initially used in office buildings could be used in their second use cycle only in residential buildings, which typically have shorter spans. Moreover, the strength parameters used to calculate the structural constraints for the optimization tool could be reduced by factors accounting for the effects of moisture and duration of load, which would ensure a more accurate element matching. This possible extension is a suggestion for future research.
An element stock like the one assumed for this study does not currently exist in Switzerland. The considered use case is thus not fully realistic regarding an application in current practice. A further consideration on the element stock concerns the interchangeability of different element types. Since all the elements included in the element stock are made of GLT, a column element, for instance, could also be used as a beam or vice versa. However, if further elements made of other material types, like the GL32h that were excluded in the present study, were added to the stock, the complexity of the tool’s matching process would drastically increase due to the different material properties. The same applies for elements of different strength classes, like the GL32h beams and slabs that were treated as GL24h elements in the present study for the sake of structural simplicity. With a higher complexity of the tool, the individual elements could be reused at the optimal level of their embedded use value. Meanwhile, to make the impact quantifiable, the embedded use value needs to be implemented in current life cycle assessment methods according to De Wolf et al. (2020). An open issue is whether and to what extend an originally GL24h graded element, for example, needs to be degraded, considering its moisture and load history, in order to be reused in a second use cycle (Niu et al., 2021).
5 Conclusion
The aim of this study was to evaluate strategies to facilitate a circular design process of timber elements. The research focused on combining circular strategies from a building’s start-of-life and end-of-life perspective by developing both a practical DforD and DfromD application. Timber slab, column, outer wall and beam elements from the same case studies were used in the two applications.
The DforD score, which was developed to compare single elements in terms of disassemblability and reusability, showed that the slab elements are responsible for the largest fraction of impact in both case studies and should thus be treated with special attention. Further, the assessment of different connection types revealed that a distinct separation of RC and timber parts, as well as a greater standardization of the connections in between, are crucial for a higher element reuse potential. A limitation of the scoring method is the degree of subjectivity underlying it. Particularly, the definitions of what to conclude from different scoring values, e.g., where the reuse threshold lies, would need further analyses, including the integration of life cycle assessment analysis. Moreover, the use of the score in a BIM software would potentially lead to an upscale of the assessment and a wider application of the comparison.
The DfromD optimization tool, which was developed to facilitate the integration of reused elements into new designs, promotes building layouts within dimensional tolerances that might differ largely from the initially intended baseline design. As the minimum mass is one minimization variable, besides the cut-off waste and the difference from the baseline design, optimized reuse designs that are kept in the lowest range of the dimensional tolerances result in the least amounts of GHG emissions. While further developments in this direction are required, the tool demonstrates which information the stock needs to include to directly integrate its elements into a new design. Lastly, if the tool were to be implemented into a BIM software, the stock lengths, other element properties or even the elements’ prices could directly be retrieved from there. This would allow the code to be better adaptable to new element types and less dependent on the specific element stock, which could lead to an overall increase in utilization of the tool. Moreover, the tool could serve as a data link between the previous and the following use phases of the individual elements by updating information, such as the moisture and load history, in their material passports.
The DforD score and DfromD optimization tool each partially close the research gap in the reuse related design process with timber elements, and they serve as a basis for future research. The mentioned extensions of both methods are considered as possible drivers to upscale reuse of timber elements, by helping to move the investor’s awareness to the used material and structural system, changing the view from waste to resources, and seeing the use of material as an investment.
Data availability statement
The original contributions presented in the study are included in the article/Supplementary Material, further inquiries can be directed to the corresponding author.
Author contributions
CG: Conceptualization, Investigation, Methodology, Software, Visualization, Writing–original draft. MG: Data curation, Resources, Software, Supervision, Writing–original draft, Writing–review and editing. MM: Data curation, Resources, Supervision, Writing–review and editing. FK: Supervision, Writing–original draft, Writing—original review and editing. PG: Supervision, Writing–review and editing. AF: Supervision, Writing–review and editing. SL: Writing–review and editing. CD: Funding acquisition, Supervision, Writing–review and editing.
Funding
The author(s) declare financial support was received for the research, authorship, and/or publication of this article. Components of this research were funded by Vlaanderen Circulair—Call Circulaire Bouweconomie—Vlaams Agentschap Innoveren & Ondernemen (VLAIO). Open access funding by ETH Zurich.
Acknowledgments
Special thanks go to Timbatec Holzbauingenieure AG for providing the floorplans and element catalogs of the case study projects, and to Zirkular GmbH for giving insights into its procurement methods through an interview.
Conflict of interest
The authors declare that the research was conducted in the absence of any commercial or financial relationships that could be construed as a potential conflict of interest.
Publisher’s note
All claims expressed in this article are solely those of the authors and do not necessarily represent those of their affiliated organizations, or those of the publisher, the editors and the reviewers. Any product that may be evaluated in this article, or claim that may be made by its manufacturer, is not guaranteed or endorsed by the publisher.
Footnotes
1https://zirkular.net/projekte/316-k118-kopfbau-halle-118
2https://www.timbatec.com/chde/holzbau/referenzen/1511-sue-til.php
3https://www.timbatec.com/chde/holzbau/referenzen/1968-Lokstast-Krokodil.php
References
Andersen, C. E., Rasmussen, F. N., Habert, G., and Birgisdóttir, H. (2021). Embodied GHG emissions of wooden buildings—challenges of biogenic carbon accounting in current LCA methods. Front. Built Environ. 7. doi:10.3389/fbuil.2021.729096
Attia, S., and Al-Obaidy, M. (2021). Design criteria for circular buildings. Available at: https://orbi.uliege.be/handle/2268/258348 (Accessed July 16, 2023).
Bholowalia, P., and Kumar, A. (2014). EBK-means: a clustering technique based on elbow method and K-means in WSN. Int. J. Comput. Appl. 105. doi:10.5120/18405-9674
Brandner, R., and Ottenhaus, L.-M. (2022). Properties of salvaged structural timber components: how to account for long-term loading effects given unknown load histories? COST ACTION CA 20139 Holist. Des. taller timber Build. (HELEN) STATE ART Rep., 71–75. Available at: https://cahelen.eu/wp-content/uploads/2022/12/CA20139_STAR_WG1.pdf#page=72. (Accessed October 22, 2023).
Brütting, J. (2020). Optimum design of low environmental impact structures through component reuse. Lausanne, Switzerland: Swiss Federal Institute of Technology Lausanne. doi:10.5075/epfl-thesis-8448
Brütting, J., Vandervaeren, C., Senatore, G., De Temmerman, N., and Fivet, C. (2020). Environmental impact minimization of reticular structures made of reused and new elements through Life Cycle Assessment and Mixed-Integer Linear Programming. Energy Build. 215, 109827. doi:10.1016/j.enbuild.2020.109827
Castro, C. G., Trevisan, A. H., Pigosso, D. C. A., and Mascarenhas, J. (2022). The rebound effect of circular economy: definitions, mechanisms and a research agenda. J. Clean. Prod. 345, 131136. doi:10.1016/j.jclepro.2022.131136
Çimen, Ö. (2021). Construction and built environment in circular economy: a comprehensive literature review. J. Clean. Prod. 305, 127180. doi:10.1016/j.jclepro.2021.127180
Condotta, M., and Zatta, E. (2021). Reuse of building elements in the architectural practice and the European regulatory context: inconsistencies and possible improvements. J. Clean. Prod. 318, 128413. doi:10.1016/j.jclepro.2021.128413
Crews, K., Hayward, D., and MacKenzie, C. (2008). Interim industry standard recycled timber–visually stress graded recycled timber for structural purposes. https://www.timberzoo.com.au/sitefiles/FWPA-Recycled-Timber-Structural-Grading-Standard.pdf.
Cristescu, C., Honfi, D., Sandberg, K., Sandin, Y., Shotton, E., Walsh, S. J., et al. (2020). Design for deconstruction and reuse of timber structures – state of the art review. https://www.infuturewood.info/wp-content/uploads/2021/02/InFutURe-Wood-Report-D2.1f.pdf.
De Wolf, C., Hoxha, E., and Fivet, C. (2020). Comparison of environmental assessment methods when reusing building components: a case study. Sustain. Cities Soc. 61, 102322. doi:10.1016/j.scs.2020.102322
Ehrhart, T., Grönquist, P., Schilling, S., Steiger, R., and Frangi, A. (2021). “Mechanical properties of European beech glulam after 32 years in a service class 2 environment,” in Proceedings of the 54th meeting of the International Network on Timber Engineering Research (INTER 2021), Karlsruhe, Germany, August, 2021. doi:10.3929/ethz-b-000506091
Geldermans, R. J. (2016). Design for change and circularity – accommodating circular material & product flows in construction. Energy Procedia 96, 301–311. doi:10.1016/j.egypro.2016.09.153
Honic, M., Kovacic, I., Sibenik, G., and Rechberger, H. (2019). Data- and stakeholder management framework for the implementation of BIM-based Material Passports. J. Build. Eng. 23, 341–350. doi:10.1016/j.jobe.2019.01.017
Hradil, P., Talja, A., Ungureanu, V., Koukkari, H., and Fülöp, L. (2017). 21.03: reusability indicator for steel-framed buildings and application for an industrial hall. ce/papers 1, 4512–4521. doi:10.1002/cepa.511
Hradil, P., Talja, A., Wahlström, M., Huuhka, S., Lahdensivu, J., and Pikkuvirta, J. (2014). Re-use of structural elements: environmentally efficient recovery of building components. Espoo, Finland: VTT Technical Research Centre of Finland.
Kbob, K. der B. L. der öffentlichen B. (2022). Ökobilanzdaten im Baubereich. Available at: https://www.kbob.admin.ch/kbob/de/home/themen-leistungen/nachhaltiges-bauen/oekobilanzdaten_baubereich.html (Accessed June 25, 2022).
Kim, S., and Kim, S.-A. (2020). Framework for designing sustainable structures through steel beam reuse. Sustainability 12, 9494. doi:10.3390/su12229494
Klinge, A., Roswag-Klinge, E., Radeljic, L., and Lehmann, M. (2019). Strategies for circular, prefab buildings from waste wood. IOP Conf. Ser. Earth Environ. Sci. 225, 012052. doi:10.1088/1755-1315/225/1/012052
Lignatur, A. G. (2022). Preliminary statics. Available at: https://www.lignatur.ch/en/product/statics/preliminary-statics (Accessed June 28, 2022).
Meier, H.-R. (2021). Spolien: phänomene der Wiederverwendung in der Architektur. Berlin, Germany: JOVIS Verlag GmbH. doi:10.1515/9783868599442
Müller, D., and Moser, D. (2022). Rückbau und Wiederverwendung von Holzbauten. Available at: https://www.pirminjung.ch/files/allgemein/220502_PJ_Rueckbau-Wiederverwendung-Holzbauten.pdf (Accessed September 26, 2022).
Musah, M., Wang, X., Dickinson, Y., Ross, R. J., Rudnicki, M., and Xie, X. (2021). Durability of the adhesive bond in cross-laminated northern hardwoods and softwoods. Constr. Build. Mater. 307, 124267. doi:10.1016/j.conbuildmat.2021.124267
Niu, Y., Rasi, K., Hughes, M., Halme, M., and Fink, G. (2021). Prolonging life cycles of construction materials and combating climate change by cascading: the case of reusing timber in Finland. Resour. Conserv. Recycl. 170, 105555. doi:10.1016/j.resconrec.2021.105555
Ottenhaus, L.-M., Yan, Z., Brandner, R., Leardini, P., Fink, G., and Jockwer, R. (2023). Design for adaptability, disassembly and reuse – a review of reversible timber connection systems. Constr. Build. Mater. 400, 132823. doi:10.1016/j.conbuildmat.2023.132823
Peng, L., Searchinger, T. D., Zionts, J., and Waite, R. (2023). The carbon costs of global wood harvests. Nature 620, 110–115. doi:10.1038/s41586-023-06187-1
Piccardo, C., and Hughes, M. (2022). Design strategies to increase the reuse of wood materials in buildings: lessons from architectural practice. J. Clean. Prod. 368, 133083. doi:10.1016/j.jclepro.2022.133083
Pozzi, L. E. (2020). Design for Change: an adaptable housing complex which deals with the impermanence of architecture. Available at: https://repository.tudelft.nl/islandora/object/uuid%3Ac8b85050-cd11-45eb-b3ac-c3624259654f (Accessed October 13, 2021).
Prentice, I., Farquhar, G., Fasham, M., Goulden, M., Heimann, M., Jaramillo, V., et al. (2001). “The carbon cycle and atmospheric carbon dioxide,” in Climate change 2001: the scientific basis. J. T. Houghton, Y. Ding, D. J. Griggs, M. Noguer, P. J. van der Linden, X. Dai, Editorset al. (Cambridge, England: Cambridge University Press), 183–237.
Purba, C. Y. C., Pot, G., Collet, R., Chaplain, M., and Coureau, J.-L. (2022). Assessment of bonding durability of CLT and glulam made from oak and mixed poplar-oak according to bonding pressure and glue type. Constr. Build. Mater. 335, 127345. doi:10.1016/j.conbuildmat.2022.127345
Salza, , and Matériuum, (2020). Wiederverwendung bauen. BAFU. Available at: https://reriwi.ch/ (Accessed September 24, 2022).
Sia, (2012). Schweizerischer Ingenieur-und Architektenverein SN 505265. https://shop.sia.ch/normenwerk/ingenieur/sia%20265/d/2021/D/Product.
Sia, (2013). Schweizerischer Ingenieur-und Architektenverein SN 505260. https://shop.sia.ch/normenwerk/architekt/sia%20260/d/2003/D/Product.
Sia, (2014). Schweizerischer Ingenieur-und Architektenverein SN 505261. https://shop.sia.ch/normenwerk/ingenieur/sia%20261/d/2020/D/Product.
Stricker, E., Brandi, G., Sonderegger, A., Angst, M., Buser, B., and Massmünster, M. (2021). Bauteile wiederverwenden. Park books. Available at: https://www.park-books.com/index.php?pd=pb&lang=de&page=books&book=1316.
Thormark, C. (2001). Recycling potential and design for disassembly in buildings. Available at: https://www.semanticscholar.org/paper/Recycling-Potential-and-Design-for-Disassembly-in-Thormark/ad379403148ded6623056d8f16b3434db75794fa#citing-papers.
Timbatec, (2019). Floorplans and elements catalogs projects sue&til and Krokodil. Thun, Switzerland: Timbatec.
Tomczak, A., Haakonsen, S., and Luczkowski, M. (2023). Matching algorithms to assist in designing with reclaimed building elements. Environ. Res. Infrastruct. Sustain. 3, 035005. doi:10.1088/2634-4505/acf341
Keywords: design for disassembly, design from disassembly, timber element reuse, reusability scoring system, reusable element matching, cutting stock problem, multi-objective optimization
Citation: Grüter C, Gordon M, Muster M, Kastner F, Grönquist P, Frangi A, Langenberg S and De Wolf C (2023) Design for and from disassembly with timber elements: strategies based on two case studies from Switzerland. Front. Built Environ. 9:1307632. doi: 10.3389/fbuil.2023.1307632
Received: 04 October 2023; Accepted: 23 October 2023;
Published: 09 November 2023.
Edited by:
Eugenia Gasparri, The University of Sydney, AustraliaReviewed by:
Lisa Ottenhaus, The University of Queensland, AustraliaOIga Ioannou, Delft University of Technology, Netherlands
Copyright © 2023 Grüter, Gordon, Muster, Kastner, Grönquist, Frangi, Langenberg and De Wolf. This is an open-access article distributed under the terms of the Creative Commons Attribution License (CC BY). The use, distribution or reproduction in other forums is permitted, provided the original author(s) and the copyright owner(s) are credited and that the original publication in this journal is cited, in accordance with accepted academic practice. No use, distribution or reproduction is permitted which does not comply with these terms.
*Correspondence: Cäsar Grüter, caesar.grueter@alumni.ethz.ch