Effects of fixational eye movements on retinal ganglion cell responses: A modelling study
- 1 Institute for Adaptive and Neural Computation, School of Informatics, University of Edinburgh, UK
- 2 Bernstein Center for Computational Neuroscience, University of Göttingen, Germany
Visual response properties of retinal ganglion cells (GCs), the retinal output neurons, are shaped by numerous processes and interactions within the retina. In particular, amacrine cells are known to form microcircuits that affect GC responses in specific ways. So far, relatively little is known about the influence of retinal processing on GC responses under naturalistic viewing conditions, in particular in the presence of fixational eye movements. Here we used a detailed model of the mammalian retina to investigate possible effects of fixational eye movements on retinal GC activity. Populations of linear, sustained (parvocellular, PC) and nonlinear, transient (magnocellular, MC) GCs were simulated during fixation of a star-shaped stimulus, and two distinct effects were found: (1) a fading of complete wedges of the star and (2) an apparent splitting of stimulus lines. Both effects only occur in MC-cells, and an analysis shows that fading is caused by an expression of the aperture problem in retinal GCs, and the splitting effect by spatiotemporal nonlinearities in the MC-cell receptive field. These effects strongly resemble perceived instabilities during fixation of the same stimulus, and we propose that these illusions may have a retinal origin. We further suggest that in this case two parallel retinal streams send conflicting, rather than complementary, information to the higher visual system, which here leads to a dominant influence of the MC pathway. Similar situations may be common during natural vision, since retinal processing involves numerous nonlinearities.
Introduction
Visual perception is initiated by the responses of multiple populations of neurons in the retina, each with different response properties. While the properties of neurons in the early visual system are responsible for a number of limitations of visual perception, not all specific response properties of a given neuron class are readily rediscovered at the perceptual level. Instead they may disappear in higher visual areas due to integration and other mechanisms which facilitate a correct interpretation of a stimulus.
A famous example of this kind is the aperture problem (Hildreth and Koch, 1987 ; Wallach, 1935 ). The area where a neuron in the visual system can be excited by a stimulus is constrained by the finite dimensions of its receptive field, the neuronquotidns window or aperture to the outer world. If an elongated stimulus passes over such a receptive field, the neuron will only respond to the motion component orthogonal to the orientation of the stimulus. This effect occurs essentially for all cells at lower visual processing stages where receptive fields are small and the ability of individual neurons to unambiguously encode stimulus properties is hence limited. On the other hand, the activity of a subset of neurons usually provides sufficient information to resolve these ambiguities at higher levels. It has, for instance, been demonstrated that the aperture problem is resolved by integration in the motion sensitive area MT (Pack and Born, 2001 ).
While this is only one example, large-scale integration effects are thought to be generally involved in the generation of stable visual percepts and the individual cell properties over which integration takes place remain, therefore, often hidden. As a consequence, specific properties of two dominant early visual processing streams, the parvo- (PC) or magnocellular (MC) systems, are not always discovered at the perceptual level.
In the primate retina, the PC stream is represented by linear, sustained PC-cells and the MC stream by MC-cells, which show fast, transient responses and nonlinear spatiotemporal summation (Benardete et al., 1992 ; Derrington and Lennie, 1984 ; Kaplan and Shapley, 1982 ; Leventhal et al., 1981 ; White et al., 2002 ). PC-cells have smaller receptive fields and a higher density than MC-cells, and only PC-cells have colour-opponent receptive fields. It is, therefore, often hypothesised that PC-cells mediate high-acuity vision for static stimuli while MC-cells are mainly involved in the processing of moving stimuli (Schiller and Logothetis, 1990 ; but see Lee et al., 1993 ). These two cell classes provide the basis for the segregation into the ventral and dorsal visual pathways, which have been associated with form- and motion analysis in the visual cortex (Merigan and Maunsell, 1993 ).
In this paper, we suggest that two visual illusions, caused by fixational eye movements, may be directly related to specific properties of retinal MC ganglion cells (GCs). To show this, we simulated responses of linear, sustained (PC) and nonlinear, transient (MC) GCs during stimulation with a star-shaped stimulus in the presence of fixational eye movements. We found two effects in the population response of MC-cells: a fading of lines or whole wedges of the stimulus, and an apparent splitting of single lines. Both effects, which were not visible in the PC-cell population, show spatiotemporal instabilities consistent with visual illusions caused by a number of related stimuli. We will show how the effects are induced by fixational eye movements and can be explained by specific properties of the retinal MC system. We will further discuss that under these conditions visual perception is dominated by MC responses, while information in the PC stream that cold facilitate a correct interpretation of the stimulus is bypassed.
Material and Methods
Structure of the model retina
The model aims to simulate responses of populations of two types of retinal GCs: a linear, sustained type with a small receptive field and a nonlinear, transient type with a larger receptive field. The specific parameters for each cell class were chosen, where possible, to reflect those of the primate foveal PC and MC on-centre channels under cone-dominated illumination conditions. We will show that important features of these neurons are well captured by this model. Therefore, we refer to the two types as PC- and MC-cells throughout this study. The model was largely based on an earlier model used to explore differences in X- and Y-cell behaviour in the cat retina (Hennig et al., 2002a ). The limitations of the model will be addressed in Discussion.
A schematic diagram of the connectivity of the model neurons is shown in Figure 1 A. Model neurons are arranged on two-dimensional, stacked hexagonal grids. The photoreceptor layer consists of 200 × 200 neurons, with a nearest-neighbour separation of 0.55′. Stimuli are first convolved with a PSF to account for the ocular optics (Figure 1 B; Westheimer, 1986 ). Horizontal and BCs receive synaptic input from photoreceptors. The horizontal cell layer was modelled as an electrically coupled syncytium and the activity is calculated at each site of synaptic contact to BCs. A transient and sustained on-centre BC type was included, with the same density as the photoreceptors (Dacey, 1993 ; Milam et al., 1993 ; Wässle and Boycott, 1991 ). Both sustained and transient BCs receive excitatory input from photoreceptors and are inhibited by horizontal cells. In addition, transient BCs receive recurrent inhibition from amacrine cells which leads to an amplification of transient response characteristics (‘nested amacrine circuitquotidn, shaded region in Figure 1 C). PC GCs receive synaptic input from sustained and MC-cells from transient BCs. Furthermore, both GC types receive inhibitory input from wide-field amacrine cells, which contributes to their receptive field surround (Flores-Herr et al., 2001 ; Sinclair et al., 2004 ). Figure 1 C illustrates representative responses of the sustained and transient pathway in the model.
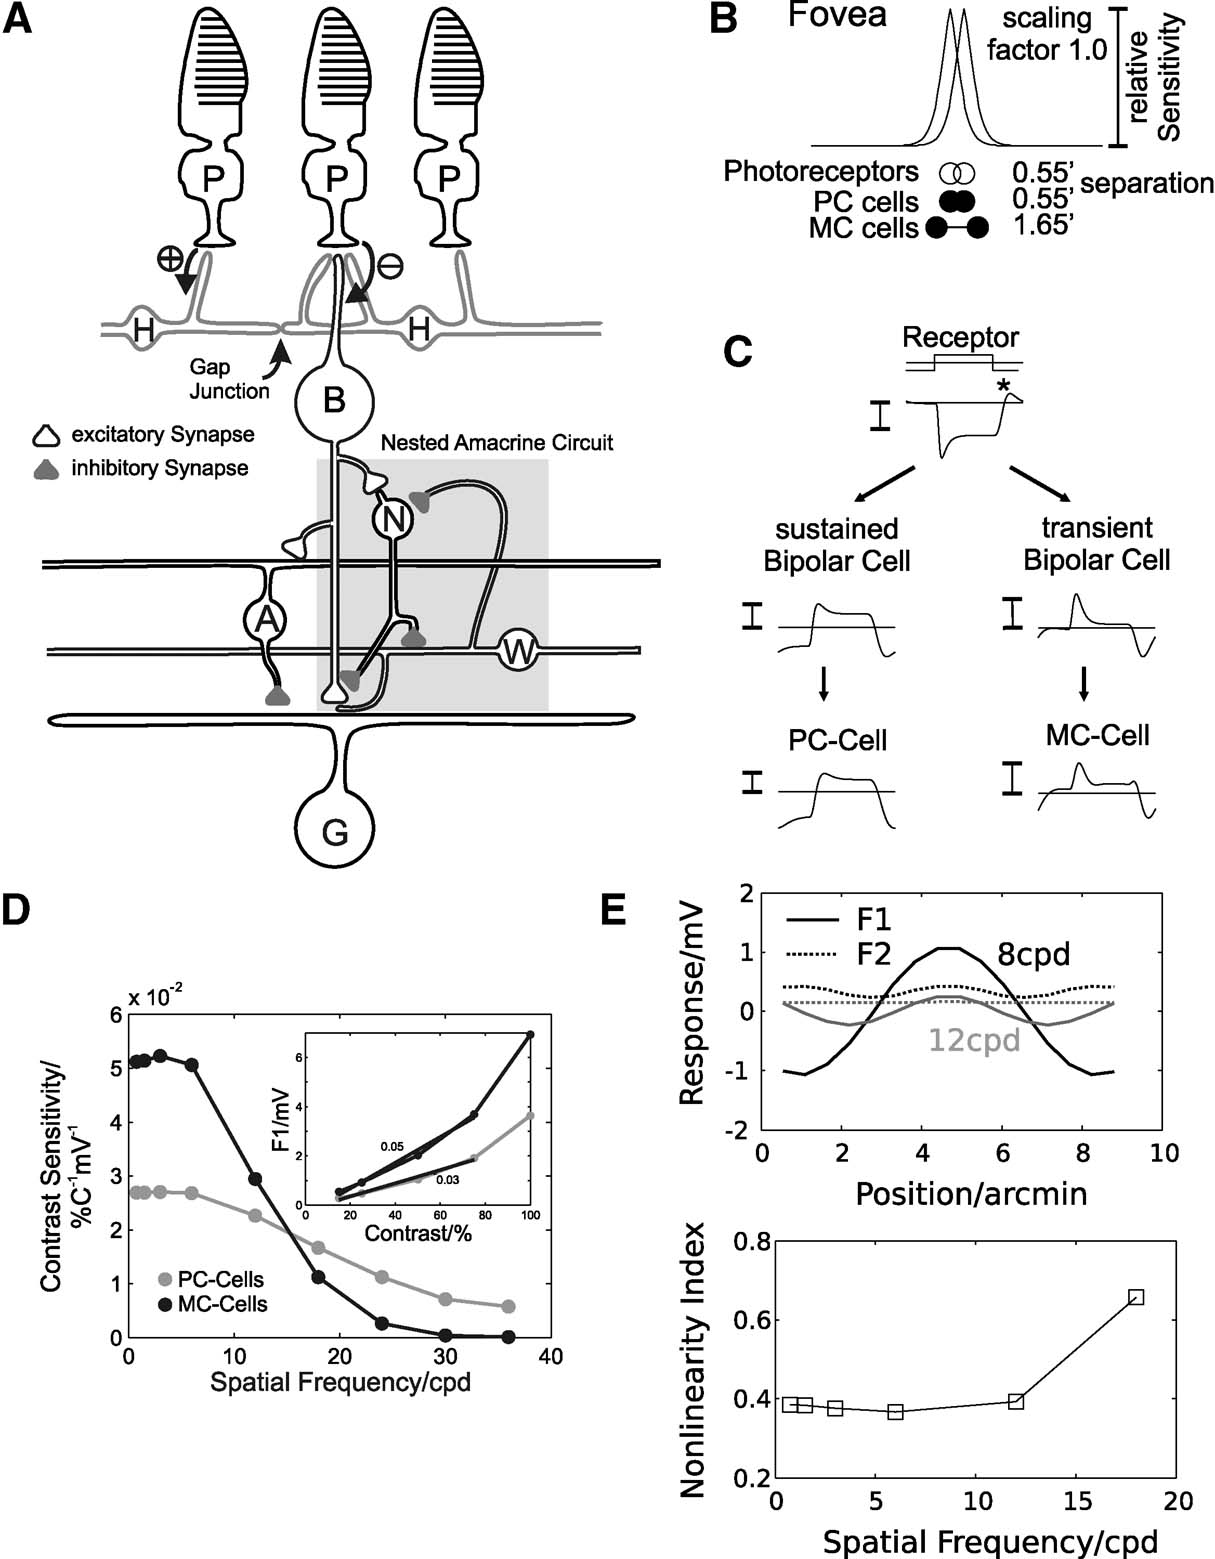
Figure 1. Summary of the model connectivity and behaviour. (A) Schematic diagram of the model retina. Photoreceptors (P) connect by excitatory synapses (⊕) to horizontal cells (H) and by sign-inverting synapses (⊖) to on-centre bipolar cells (BCs). Horizontal cells connect to BCs with sign-conserving synapses. The receptive field of on-centre GCs consists of excitatory input from on-centre BCs (centre) and inhibitory input from wide field amacrine cells (A, surround). For MC-cells, the presynaptic BCs receive inhibition from narrow-field amacrine cells (N) at the axon terminal (forming a subgroup of transient BCs). Narrow-field amacrine cells receive excitatory input from BCs and inhibition from wide-field amacrine cells (W). Wide-field amacrine cells are excited by transient BCs and receive inhibition from narrow-field amacrine cells. Combined, this coupling of amacrine cells forms a nested circuit (shaded region), which leads to transient responses in MC-GCs. (B) Spatial parameters of the simulated network (relative sizes are to scale). Shown are the point spread function (PSF) simulating ocular blurring, the separation of photoreceptors (open circles) and PC- and MC-GCs (filled circles). (C) Responses of a photoreceptor, sustained and transient BC and PC- and MC-GC during contrast reversal of a sinusoidal grating (90 degree phase, 11 cpd, 5Hz). (D) Contrast sensitivity for simulated PC- (grey) and MC-cells (black) as a function of spatial frequency, calculated by estimating the slope of the contrast-response function (inset shows this for a 2 cpd grating). Response amplitudes are the first harmonics (F1) of the membrane potential in response to drifting sinusoidal gratings (8 Hz). (E) Receptive field nonlinearities in simulated MC-cells. The top graph shows the first (F1) and second harmonic (F2) response of a MC-cell during stimulation with a contrast-reversed sine grating (8 Hz; black: 8 cpd; grey: 12 cpd) as a function of the RF location relative to the stimulus. The response amplitudes were multiplied by the sign of the response phase. The bottom graph shows the corresponding nonlinearity indices (F2/F1) as a function of the spatial frequency.
This connectivity, which will be described in more detail below, produces the typical receptive fields of GCs composed of a Gaussian-shaped excitatory centre and a wider surround. The temporal dynamics and gain of PC-cells closely follows that of the photoreceptors, whereas MC-cells are transient and show nonlinear spatiotemporal summation.
Neuron models and synaptic connectivity
Neurons were modelled by the equation for a passive neural membrane
Here C is the membrane capacitance, gi(t) the conductance evoked by input i, Ei its reversal potential, R the membrane resistance and Vrest the resting potential. To simplify the model, the following common set of parameters were used for all neurons: C = 100 pF, R = 100 MΩ and Vrest = −60 mV. For excitatory (glutamatergic) inputs the reversal potential was Erev,glu = 0 mV, and for inhibitory input, it was set to Erev, GABA = −70 mV for GABAergic and Erev, gly = −80 mV for glycinergic synapses.
Synaptic conductances were modelled as functions of the presynaptic potential, expressed as gi(t) = f(Vpre) ∙ 0.3 nS∕V for all cell types except for transient BCs, where gi,T(t) = f(Vpre) ∙ 0.4 nS∕V was used (see below). The glutamate release for BCs and amacrine cells was truncated at −3 mV below resting potential (assuming a low maintained transmitter release)

Photoreceptors. Cone photoreceptor responses under photopic conditions were simulated by means of a state-variable description. This is based on a model description of the photocurrent of macaque cones after brief stimulation (Schnapf et al., 1990 ), which was extended to calculate the corresponding photovoltage during light stimulation. The following set of equations describe the model:


Parameters and their description are given in Table 1 . This model reproduces the time course of the photovoltage during light stimulation as described by Schnapf et al. (1990) , produces a Michaelis Menten intensity-response relation and follows Weberquotidns law for background desensitisation (Hennig et al., 2002a ). The photovoltage response of the model is biphasic with a sharp onset transient, which is followed by a weaker sustained response. The response terminates due to action of an inward hyperpolarisation-activated current with a transient depolarisation (Equation 6), which is slower and slightly weaker than the initial onset transient (Figure 1 C). For a complete description and discussion of this photoreceptor model, see Hennig et al. (2002a) (note there is a mistake in Equation (4) in this paper).

Table 1. Constants, variables and parameters of the photoreceptor model.
It should be noted that a conceptually similar, but much more detailed model of a primate photoreceptor was recently developed by van Hateren (2005) , which was later extended to include their coupling to horizontal cells in the outer plexiform layer (van Hateren, 2007 ). These models, which produced excellent fits to experimental data from horizontal cells, share some features with our model (cf. Hennig et al., 2002a , Figure 2 ): sensitivity is regulated as a function of the background light intensity, at higher contrast the photovoltage response is increasingly distorted, and sensitivity regulation leads to nonlinearities in horizontal cell responses. An important difference is that our model operates only in a very limited luminance range, primarily because the feedback mechanisms were assumed to operate linearly. Nevertheless, we assume that our model is sufficiently accurate to realistically reproduce responses in the limited luminance and contrast range investigated here.
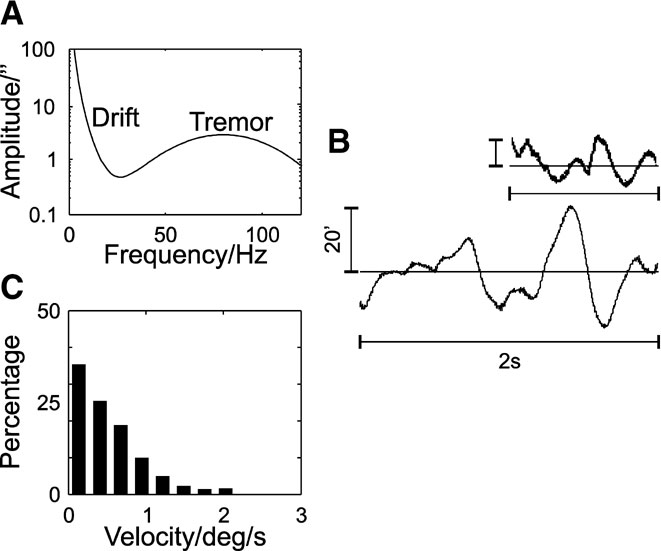
Figure 2. Simulated fixational eye movements. (A) Power spectrum of fixational eye movements. (B) Example trace. The inset shows 2s of slow drift movements as recorded by Murakami (2004) (vertical calibration bar indicates 20′). (C) Velocity distributions of the slow drift movements. The velocities were obtained after resampling the eye movement traces at 1 kHz, to allow for comparison with experimental data.
Horizontal cells. Horizontal cells were simulated as a syncytium of electrically coupled neurons. The spatial decay of the activity was assumed to be Gaussian shaped. We note that this is a strongly simplified model, a more accurate treatment would not predict a Gaussian spatial decay (Nelson, 1977 ). The standard deviation was set to four cone diameters, about the size of the midget cell receptive field surround in the fovea (Wässle et al., 1989 ). Hence, these horizontal cells best reflect the achromatic H1 population, which is held responsible for shaping midget BC receptive fields (Dacey et al., 2000 ; McMahon et al., 2004 ).
Bipolar cells. The model includes two types of BCs: sustained and transient on-centre BCs (see representative responses in Figure 1C ). All BC types receive sign-inverted excitatory input from cones and are antagonised by horizontal cells to account for their receptive field surround (Dacey et al., 2000 ; McMahon et al., 2004 ). This was simulated by inverting the horizontal cell activity and assuming a synapse with a reversal potential at Erev, inh = −70 mV (Feigenspan et al., 1993 ). When voltage-gated currents in cones/BCs are neglected, this implementation is mathematically equivalent to both a non-GABAergic mechanism which relies on the voltage modulation in the synaptic cleft (Kamermans and Spekreijse, 1999 ) or on an increase in the Cl− reversal potential above the resting potential in the cone axon or bipolar dendrites (Vardi et al., 2000 ).
In addition, transient BCs receive GABAergic inhibition from narrow-field amacrine cells at their axon terminals as part of a circuit which leads to more transient responses (see below). Their input conductance was increased by a factor of 1.3 to compensate for the reduced transient component due to inhibition.
Amacrine cells. The axon terminal of transient BCs receives inhibition from a narrow-field amacrine cell, which is part of a nested amacrine circuit (shaded region in Figure 1 A). Narrow-field amacrine cells receive excitatory input from a single BC and are inhibited by wide-field amacrine cells. Inhibitory wide-field amacrine cells receive excitatory input from transient BC terminals and are in turn inhibited by narrow field amacrine cells. A narrow-field amacrine cell receptive field centre is, therefore, equivalent to the BC receptive field, and that of wide-field cells Gaussian shaped with a radius of 2.5 cone diameters (σC = 1.4′).
This circuit reduces the sustained component of transient BCs by means of delayed inhibition. The onset transient is further amplified by wide-field amacrine cells, which then act in a disinhibitory way. This effect is particularly pronounced for larger stimuli that excite wide-field amacrine cells fully. Experimental results suggest that an equivalent amacrine cell circuit contributes to the transient responses of GCs (Nirenberg and Meister, 1997 ; Roska et al., 1998 ). In addition, a similar circuit has been used in a model to explain complex spike patterns in the turtle retina (Thiel et al., 2006 ). While this specific model is based on data obtained in the salamander retina (Roska et al., 1998 ), data from the cat retina suggests that an equivalent circuit may exist in mammals (O'Brien et al., 2003 ).
A further type of amacrine cell was included as an inhibitory interneuron with a wide receptive field that contributes to the GC receptive field surround. These cells receive excitatory input from BCs and inhibit GCs (Flores-Herr et al., 2001 ; Sinclair et al., 2004 ). The Gaussian radius of their receptive fields was set to 3.8 times the centre size of the respective postsynaptic GC.
Ganglion cells. PC-cells were separated by 0.55′ and MC-cells by 1.65′ on the hexagonal retinal grid (Dacey and Petersen, 1992 ; Goodchild et al., 1996 ). The receptive field centre of PC-cells consisted of input from a single BC, and MC-cells received input over a radius of 1.1′. Another study has reported higher values (Dacey and Petersen, 1992 ), but the receptive field size was not critical for the results presented here (see Discussion). The inhibitory surround is mediated by wide field amacrine cells with a receptive field of >3.8 times the centre input.
It should be noted that the receptive field dimensions specified above reflect the anatomical connectivity, and that the effective physiological receptive field is larger due to optical blurring and the presynaptic circuitry. Consistent with experimental data (Croner and Kaplan, 1995 ; Lee, 1996 ), the ‘physiological’ centre radius of simulated PC- and MC-cells, when tested with drifting gratings, is similar, but PC-cells respond at higher spatial frequencies than MC-cells (Figure 1 D).
Simulated PC-cells effectively inherit their response characteristics from photoreceptors after spatiotemporal filtering (Figure 1 C, compare photoreceptor, BC and PC-cell responses). In contrast, the response of MC-cells is strongly influenced by the action of the nested amacrine circuit, which leads to the pronounced transient behaviour (Figure 1 C, compare photoreceptor, transient BC and MC-cell responses). Simulated MC-cells have a higher contrast gain than PC-cells (Figure 1 D, see inset), but do not exhibit the type of contrast gain control found experimentally (Kaplan and Shapley, 1986 ).
In addition, simulated MC-cells show frequency-doubled responses during stimulation with a contrast-reversed sine grating. For these stimuli, the Fourier transform of the membrane potential response contains a second harmonic component, which is largely insensitive to the location of the stimulus relative to the receptive field (Figure 1 E, top). This behaviour has been thoroughly characterised in Y-cells in the cat and guinea pig retina (Demb et al., 1999 , 2001a ; Enroth-Cugell and Robson, 1966 ; Hochstein and Shapley, 1976 ; Victor, 1988 ), and was also found in primate MC-cells in the LGN (Benardete et al., 1992 ; Derrington and Lennie, 1984 ; Kaplan and Shapley, 1982 ; Leventhal et al., 1981 ) and retina (White et al., 2002 ). The nonlinearity index, which is defined as the second harmonic response divided by the first harmonic response (Hochstein and Shapley, 1976 ), measures the degree of spatiotemporal nonlinearity. Consistent with recordings in the primate retina (White et al., 2002 ), this value is less than 1 in our simulated MC-cells and increases with increasing spatial frequency (Figure 1 E, bottom).
Optical blurring
Optical blurring was simulated by convolving the stimulus with a PSF given by (Westheimer, 1986 ) for the human fovea

where ρ denotes the visual angle in minutes of arc. The PSF is illustrated in Figure 1 B.
Ocular micromovements
Simulated fixational eye movements include slow drift movements and the ocular microtremor, which were generated by a multiplication of Fourier-transformed white noise with a characteristic power spectrum. The power spectrum of the microtremor was modelled as Gaussian normal distribution with a peak at 80 Hz and standard deviation of 25 Hz (Bolger et al., 1999 ; Spauschus et al., 1999 ). For the ocular drift, following Eizenman et al. (1985) the following expression for the power spectrum was used:

where f[Hz] is the frequency. The variables were T2 = 0.1 second, A = 3000″ and T1 = 1.3 second, and the tremor was superimposed onto the drift spectrum. The resulting simulated eye movements consist of the tremor with a mean amplitude of 15″–20″ (Ditchburn and Ginsborg, 1953 ; Riggs and Ratliff, 1951 ; Steinman et al., 1973 ) and drift movements with a mean amplitude of 6.5′ and a mean velocity of 0.5 degree∕second (Murakami, 2004 ).
Stimulus
A static star shaped stimulus at 100% contrast with a diameter of 110′ and 24 bars, each 2.86″ wide.
Simulations
The simulation software was implemented in C++ and simulations were performed on a cluster of Intel × 86∕Linux computers. Numerical integration was performed in double precision using the second order Runge Kutta method for the photoreceptor model and forward Euler integration for the remaining cell types, both with a time step of 100 μs. This allowed for an accurate simulation of cone responses in the presence of fast ocular microtremor.
Results
The activity of GCs was simulated during fixation of a star shaped stimulus (Figure 3 A). Small eye movements were included to simulate a physiological fixation condition (Figure 3 B). In the following, a representative episode of 250 ms of the population response will be analysed to illustrate the main effects. Movies of these activity patterns are available at http://www.bccn-goettingen.de/Members/root/matthias\_hennig/visual-illusions .
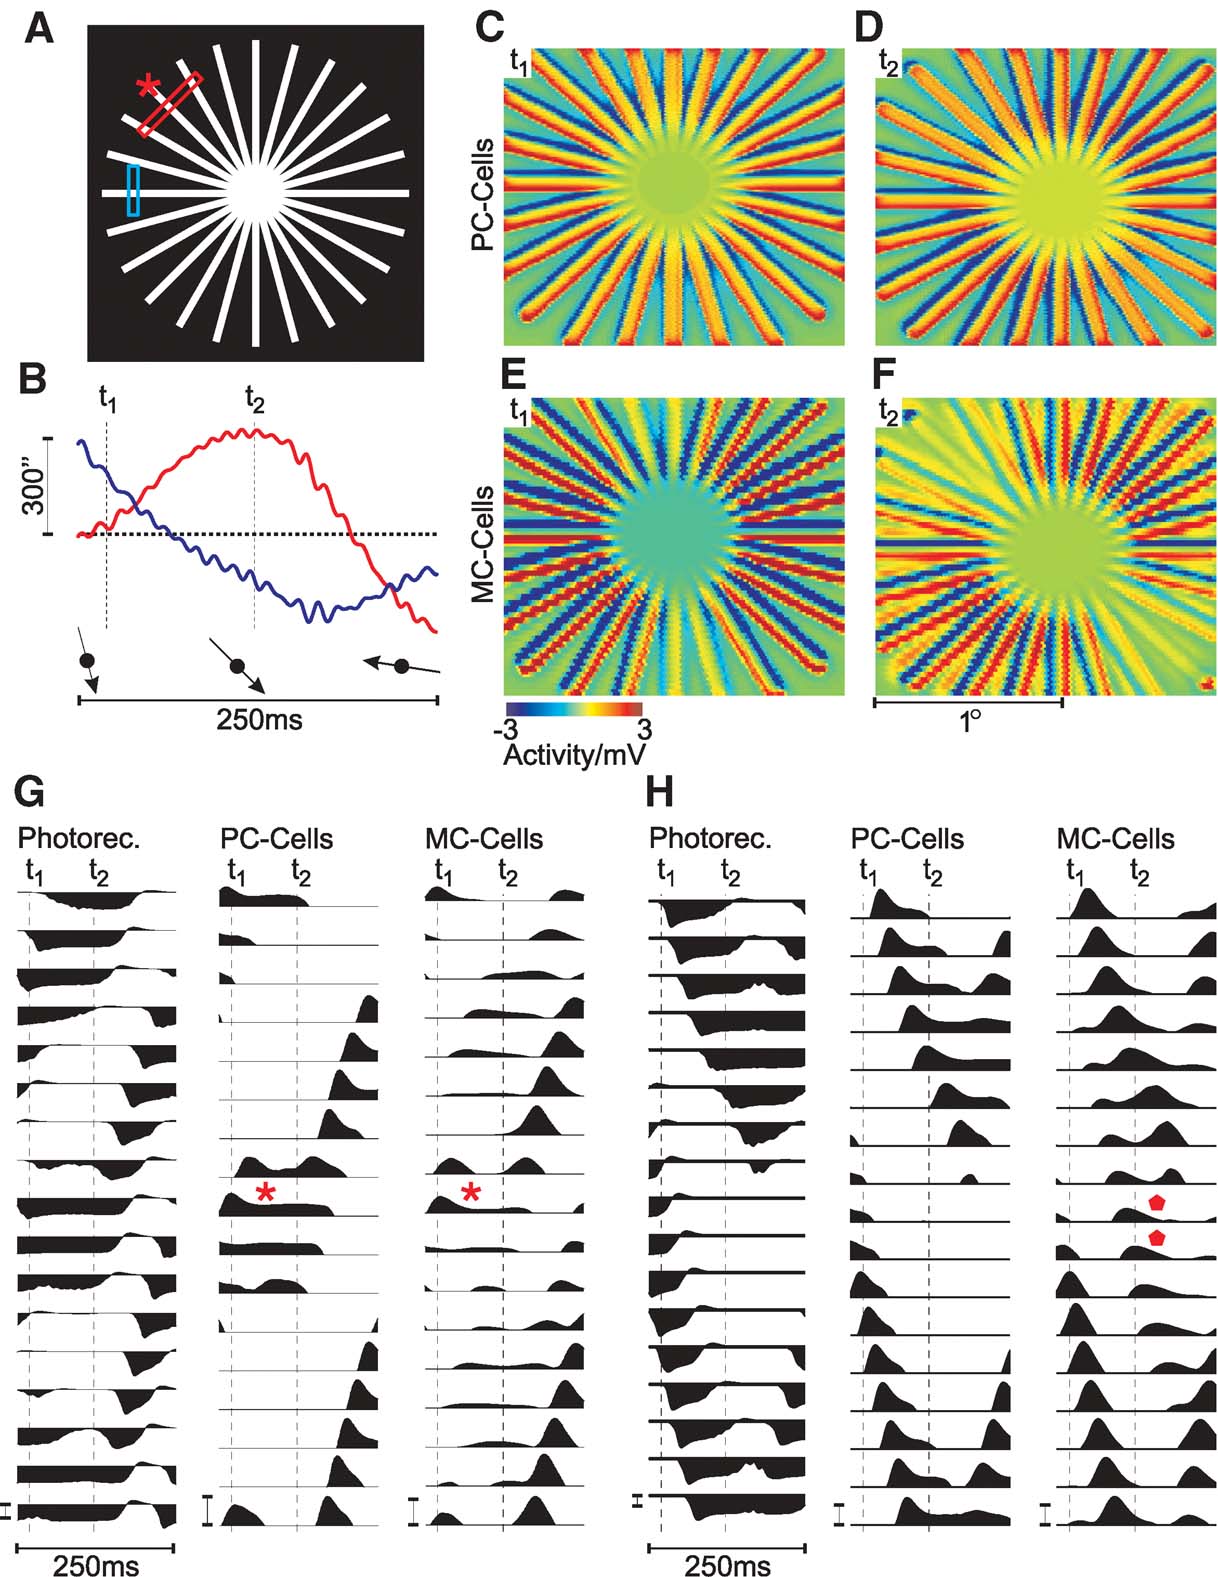
Figure 3. Population activity of retinal GCs during presentation of a star-shaped stimulus (at half-saturating photoreceptor luminance, 100% contrast, diameter 110′, bar width 2.86″). (A) Schematic drawing of the stimulus. Bars indicate where the single cell activity in panels G (red) and H (blue) was recorded. (B) Simulated horizontal (red) and vertical (blue) eye movements. t1 and t2 indicate where the snapshots in C, D and E, F were taken. The relative two-dimensional motion direction is indicated by arrows. (C--F) Spatial population activity of PC-cells (C and D) and MC-cells (E and F), taken at t1 and t2, as indicated in B. (G) Activity of single photoreceptors, PC- and MC-cells at a location where axial fading is visible at time t2 (red bar in A). The asterisks indicate where fading occurs in PC- and MC-cells (the location marked by an asterisk in A). (H) as G, but illustrating line-splitting. Responses were taken from the region marked by a blue bar in A. Diamonds indicate where splitting is visible. In G and H, GC responses were clipped below resting potential to enhance visibility of the effects. Calibration bars correspond to 3 mV.
Snapshots of the GC activity, taken at two different times t1 and t2 (as indicated in Figure 3 B), are shown in Figures 3 C–3 F. The top panels (Figure 3 C and 3 D) show PC-cell, those on the bottom (E,F) MC-cell responses. At time t1, the eye-movement direction is approximately vertical, top to bottom, which changes to bottom-right at t2 (arrows in Figure 3 B).
Both at t1 and t2, and for both cell types, the bars of the stimulus cause depolarising responses (colour-coded red in Figures 3 C–3 F). The stimulus motion also leads to a trailing hyperpolarisation (colour-coded blue), which is caused by stimulation of the receptive field surround. This is the expected behaviour of GCs, which respond to local changes in contrast.
A comparison of PC- and MC-cell response patterns, however, clearly shows that the activity of MC-cells is strongly reduced in two sectors, which are located along one axis of the stimulus. The orientation of this axis changes slowly as the direction of the eye movements change from vertical to oblique. This change is gradual over time and very pronounced in MC-cells, but also, albeit much weaker, visible in PC-cells (compare E, F and C, D). In PC-cells, the membrane potential in the sectors with a reduced response is reduced to about 50% of the peak activity. In MC-cells, the responses in these sectors are reduced almost to resting potential.
In addition, a second effect is visible in the simulated MC-cell population response in Figure 3 E and 3 F. The snapshot of the MC-cell population activity taken at t2 (Figure 3 F) shows that some lines display a spatially separated activity towards the periphery, which does not correspond to any part of the stimulus. Instead of the regular pattern of the stimulus, one finds pairs of depolarising lines next to each other. This effect does not occur in the PC-cell population.
The comparison of the membrane potential traces details this observation (Figure 3 H). Photoreceptors and PC-cells show two moving, spatially separated activity peaks, which correspond to two lines of the stimulus. The same peaks are found in the MC-cells. Between both real peaks, however, MC-cell responses show a smaller additional activity peak (marked by diamonds).
We note here that both effects can indeed be experienced during careful fixation of a star-shaped stimulus. The strength of the effect, however, varies from person to person and depends on specific stimulus parameters (see Discussion). The results presented here could, therefore, guide further psychophysical or electrophysiological experiments.
Line-fading
How are eye movements and direction of the ‘fading’ of star-segments related? In the transition from the first snapshot in Figure 3 at t1 to the second at t2, eye movement direction has changed from approximately vertical to bottom-right (arrows in Figure 3 B). Thus, in both situations, fading occurs in sectors parallel to the eye-movement direction.
The diagrams in panel G show the activity of modelled photoreceptors, PC- and MC-cells taken from the cross-section marked by the red bar in panel A. The receptive fields of the cells in the middle row (G, asterisks) are those stimulated by the line of the stimulus marked by an asterisk in A. Motion of this line is approximately axial, thus the spatial stimulation of the corresponding receptive fields does not change much during this interval. Both PC- and MC-cells at this location first respond with a depolarisation as the stimulus enters their receptive field. But after about 40 ms, their activity is reduced to a lower steady-state level (asterisks in G). This is particularly pronounced for MC-cells and explains the observed strong activity drop in the MC-cell population.
Strictly speaking, this effect might be interpreted as an expression of the aperture problem at the level of retinal GCs. The model responses suggest that MC-cells are susceptible to the aperture problem due to their transient nature—but while their response does not encode the direction of stimulus motion, axial motion will lead to a weak response. As higher motion-sensitive areas mainly receive input from the dorsal stream (Schiller and Logothetis, 1990 ), a stimulus under these conditions may, therefore, remain ‘invisible’ to parts of the visual cortex. Fixational eye movements will normally prevent this effect by providing additional motion to stimulate adjacent receptive fields, but for stimuli with large homogeneous structures like the star used here, may be the source of a false percept.
Line-splitting
The apparent splitting of lines of the stimulus in the mode arises from the nonlinear properties of MC-cells which also can lead to frequency-doubled responses during stimulation with contrast-reversed gratings (Derrington and Lennie, 1984 ; Kaplan and Shapley, 1982 ; Leventhal et al., 1981 ; White et al., 2002 ). Frequency-doubling, as first described for cat Y-cells (Enroth-Cugell and Robson, 1966 ), refers to the effect that some GCs respond with transient depolarisations to a contrast-reversed grating, which is positioned above the receptive field such that it receives no net excitation (see Demb et al., 1999 for a good summary). This effect is also present in the simulated MC-cell responses (Figure 1 E; see Methods).
During fixation of the star stimulus, fixational eye-movements may move two stimulus lines across opposite parts of a single MC-cell receptive field. In this case, due to the geometry of the stimulus, the situation can arise where as one line enters the receptive field at one side, the second line leaves it on the other side. This effectively producing a zero net excitation of the receptive field. A linearly summating GC located between both bars will not respond in this case.
If however, as for MC-cells, the receptive field includes nonlinear spatial summation, a response may be expected. Figure 4 provides a detailed illustration of this effect: The photoreceptor responses in Figure 4 A represent a case where one bar leaves and the other enters a MC-cell receptive field. Panel B shows numerically differentiated photoreceptor responses, highlighting the on- and offset-responses. This is a simplification that in this form is not computed by the full model, but illustrates best what happens. On- and off-transients in photoreceptors are of different temporal kinetics and magnitude, and, therefore, summation across the wide MC-receptive field (panel D) leads to a small remaining ‘ghost’ activity at a location without a physical stimulus. This response is superimposed, after scaling, inverting and applying a low-pass filter, onto the full MC-cell model response in panel C. The good match indicates that in a first approximation line-splitting can be understood from the amplification and integration of imbalanced photoreceptor transients. As suggested earlier (Hennig et al., 2002a ), in this model the amplification of asymmetries results from an inhibitory amacrine cell circuit. Note that this effect cannot occur for moving grating stimuli, as they will not produce the required balanced on- and off-stimulation of a single receptive field.
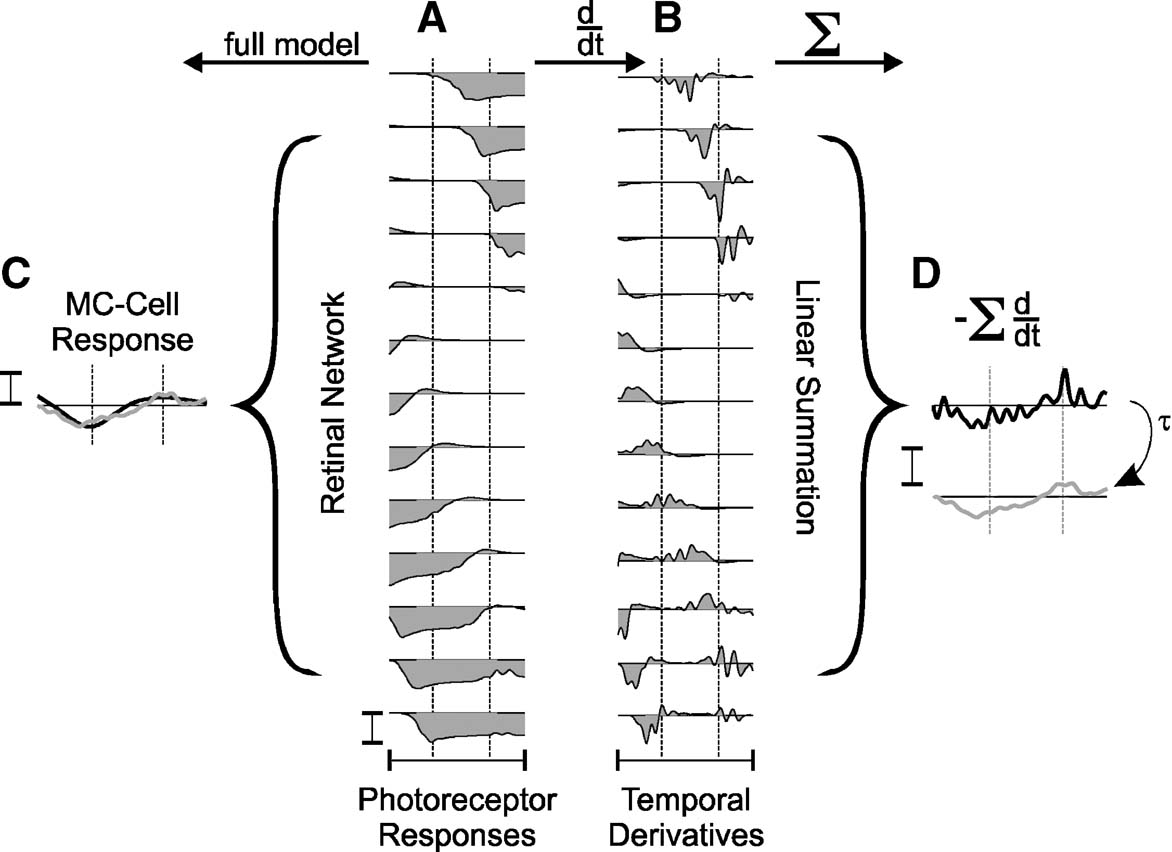
Figure 4. Nonlinear spatial summation in MC-cells causes line-splitting. (A) Simulated responses (150 ms) of photoreceptors; (B) their temporal derivatives calculated numerically and (C) MC-cell responses to two lines of the star-shaped stimulus calculated with the full model. Brackets indicate the central 7′ of the MC-cell receptive field. The response of the differentiated signals (B) summed across the bracket after inversion are shown in D (upper trace: raw data, lower trace: after low-pass filtering with τ = 4 ms). The low-pass filtered trace is also shown in C. All responses were taken from the simulations shown in Figure 3 . Calibration bars indicate 5 mV.
Differential effects of different sources of nonlinearities for line-splitting
To investigate the role of the different factors contributing to the nonlinear behaviour of simulated MC-cells to the line-splitting effect, Figure 5 shows snapshots of the GC population response for the original model and modified versions. Parts A and B show responses of unmodified PC- and MC-cells, respectively. The stimulus was presented at a higher luminance than in Figure 3 , and in this particular example, eye movements led mainly to a ‘rotational’ movement of the stimulus with little on-axis movement. Accordingly, the line-fading effect is weak, but line-splitting is visible in the MC-cell response (circle in Figure 5 B).
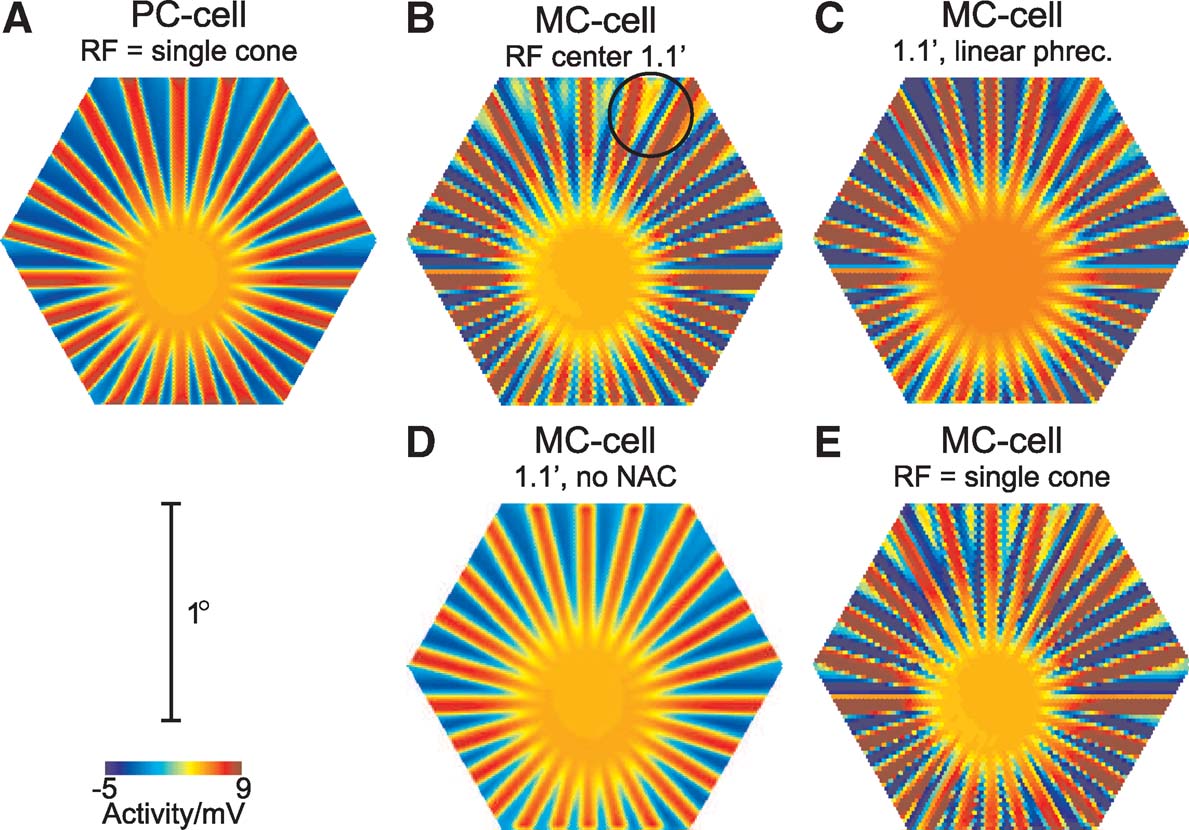
Figure 5. Effect of modifications of the model on the line-splitting effect. Each panel shows a snapshot of the GC population response during stimulation with the star-shaped stimulus (Figure 3 A, at saturating photoreceptor luminance, 100% contrast, diameter 91′, bar width 2.4″). (A, B) responses for the full PC- and MC-cell model, respectively. The circle in B indicates a location where line-splitting occurs. (C) MC-cell responses after replacing the original photoreceptor model with a linear model. (D) MC-cell response with an inactivated nested amacrine circuit. (E) Response for MC-cells, when the receptive field centre consists of a single cone.
Part C shows the MC-cell response after replacing the original photoreceptor model with a ‘linearised’ variant, which consists of a cascaded low-pass filter and a Michaelis—Menten saturation characteristic (cf. Hennig et al., 2002a ). In this case, line-splitting is reduced, indicating that photoreceptor response asymmetries play a role in generating the nonlinear response. It is, however, not fully abolished, indicating additional sources of nonlinear spatiotemporal summation in the amacrine cell circuit. This change is similar to the effect of a linear photoreceptor on the frequency-doubling response for contrast-reversed gratings in this type of model, as demonstrated earlier (Hennig et al., 2002a ).
Part D shows an example where the nested amacrine circuit, which leads to transient responses in MC-cells, was inactivated. This modification leads to a complete abolishment of the line-splitting effect. In addition, the response amplitudes of the GCs are weaker than for the full model, which results from the lack of amplification of onset-transients. Hence, in this model, the combination of inhibition and disinhibition caused by the nested amacrine circuit (see Hennig et al., 2002a for details) is the main factor that leads to the line-splitting effect.
This effect is further illustrated in Figure 5 E, where the responses of MC-cells receiving excitatory input from only a single photoreceptor are shown, but where the size of the amacrine cell receptive fields was unchanged. The splitting effect is in this case even more pronounced than for a larger receptive field, because the smaller receptive fields also reduce spatial blurring of the stimulus.
The separation of the spokes of the star stimulus used here increases with increasing eccentricity, and the splitting effect is visible for a separation of <10′–15′. This is by far more than the total receptive field diameter of a simulated MC-cell (about 10′ in this case), thus MC-cells will not directly receive asymmetric responses from BCs. Instead, the apparent splitting of the lines of the stimulus is caused by the wide-field amacrine cells, which contribute to the response of a given GC beyond its anatomical receptive field. A similar influence on simulated responses to contrast-reversed gratings in nonlinear GCs is also visible at low spatial frequencies (see Figure 7 in Hennig et al., 2002a ).
Summarising, these results predict that a line-splitting effect may be caused by nonlinearities in the inner retina, which form a part of the extra-classical receptive field of MC-cells (Benardete and Kaplan, 1999 ). This result leads to the prediction that in an electrophysiological experiment, the line-splitting effect should be largely abolished in the presence of antagonists that block inhibition in the inner retina. In addition, it may be expected that TTX-sensitive long-range inhibition in the inner retina by spiking amacrine cells, which has been shown to contribute to the frequency-doubling response in nonlinear GCs (Demb et al., 1999 ; not included in this model), may contribute to line-splitting in a similar way.
Discussion
In this paper, a computational model of the PC- and MC channels in the primate retina was used to assess the effects of fixational eye movements on the spatial representation of a star-shaped stimulus. In the presence of fixational eye movements this kind of stimulus is known to elicit spatiotemporal perceptual instabilities, and we found two distinct effects that are strongly related to these illusory percepts: fading of complete wedges of the star and an apparent splitting of stimulus lines. It was shown that both effects, which are not visible in the PC stream, are initiated by slow drift movements and result from the nonlinearities in MC-cells that lead to transient responses and the frequency-doubling nonlinearity. Qualitatively very similar effects are reported by observers viewing this type of stimulus (see below), and we propose that their origin may be traced back to the specific properties of retinal MC-cells.
Our results suggest that situations may exist where different retinal processing streams contain not complimentary, but conflicting, information about visual stimuli. To disambiguate these at the cortical level, as for instance in the case of the aperture problem, information about the retinal slip caused by fixational eye movements is required. This information, however, is provided by retinal image motion (Murakami and Cavanagh, 2001 ), and is in the case of the star stimulus, due to the stimulus symmetries, also incomplete. Given the striking similarities between the simulated activity patterns and the corresponding visual percepts, it appears that under these conditions activity in the MC stream dominates visual perception, and the retinal activity pattern directly matches the visual percept almost as if higher stages had not contributed to the processing. Two factors may contribute to this: First, MC-cell responses are generally strong and very transient under the conditions investigated, compared to tonically, but weakly active PC-cells. The more salient MC-cell activity may, therefore, dominate visual perception, even if the dorsal and ventral pathways provide conflicting information. Second, MC-cell responses have been shown to encode spatial detail with higher spatial accuracy than PC-cells (Lee et al., 1993 , 1995 ; Rüttiger et al., 2002 ; Wachtler et al., 1996 ), and may therefore generally dominate spatial perception during conditions of rapid image motion and achromatic stimulation. Given that retinal computations frequently involve nonlinearities, cases where the information in different channels is conflicting rather than complementary may even be quite common during natural vision. It is, therefore, an interesting question how the higher visual system deals with these situations in general.
The results in this paper provide specific predictions for psychophysical and electrophysiological experiments. Reported fading of lines in a star-shaped stimulus as well as an apparent splitting of lines should correlate with the direction of recorded eye movements, and can be investigated in multielectrode array recordings. As discussed below, these predictions are based on rather general assumptions about retinal GC responses, and the requirements on the mechanisms producing these effects are well supported by the existing experimental data.
Psychophysical correlates and related illusions
In a qualitative assessment, we presented the star stimulus to 35 naive subjects asking them to provide a verbal description of their percept during fixation. All observers reported that during fixation wedge-shaped sectors of this stimulus begin to fade; typically in two wedges opposite to each other. One participant confirmed the effect after being asked, the others reported the effect without any previous instructions. The location of the fading wedges rotates randomly, affecting all orientations. Most observers reported that the fading is particularly strong on an oblique axis, possibly due to additional contribution from the ‘oblique effect’ (Appelle, 1972 ), according to which horizontally and vertically oriented stimuli are better seen than oblique structures.
In addition, 66% of the participants (n = 23∕35) reported that lines appear to split or that they become denser, as if lines have been ‘added in between close to the centre’ that look like ‘split ends in hair’. Of these, five participants reported this effect only after being explicitly asked to confirm it. Hence, this illusion is less clear than the fading effect, and observers also consistently reported that the percept is more short-lived than the line-fading.
These results suggest that the predicted effects might indeed lead to corresponding visual illusions. But clearly this is only a preliminary test, as we could neither establish the origin of the illusions nor were the observerquotidns eye movements tracked to establish the proposed link between eye movement direction and direction of fading or line-splitting. These results, therefore, provide a basis for further experimental investigation of these effects.
Similar effects have been reported for other stimuli with a circular symmetry, such as the concentric circles of Purkinje and Helmholtz (Wade, 2003 ) and for well-known MacKay Illusion (Pirenne et al., 1958 ). In addition, several impressive visual illusions exist, that are elicited by retinal image motion due to eye movements during fixation (Figure 6 ; for a review, see Wade, 2003 ). More recently, a number of related illusions were systematically studied and a clear link to fixational instabilities has been established (Murakami et al., 2006 ). These aesthetically appealing pictures, which have also influenced the arts (‘Op-Art’), have also been used to deduce possible neuronal mechanisms which underlie their perception. During fixation, observers report unstable flickering or apparent motion percepts, which can affect the image as a whole or parts of it.
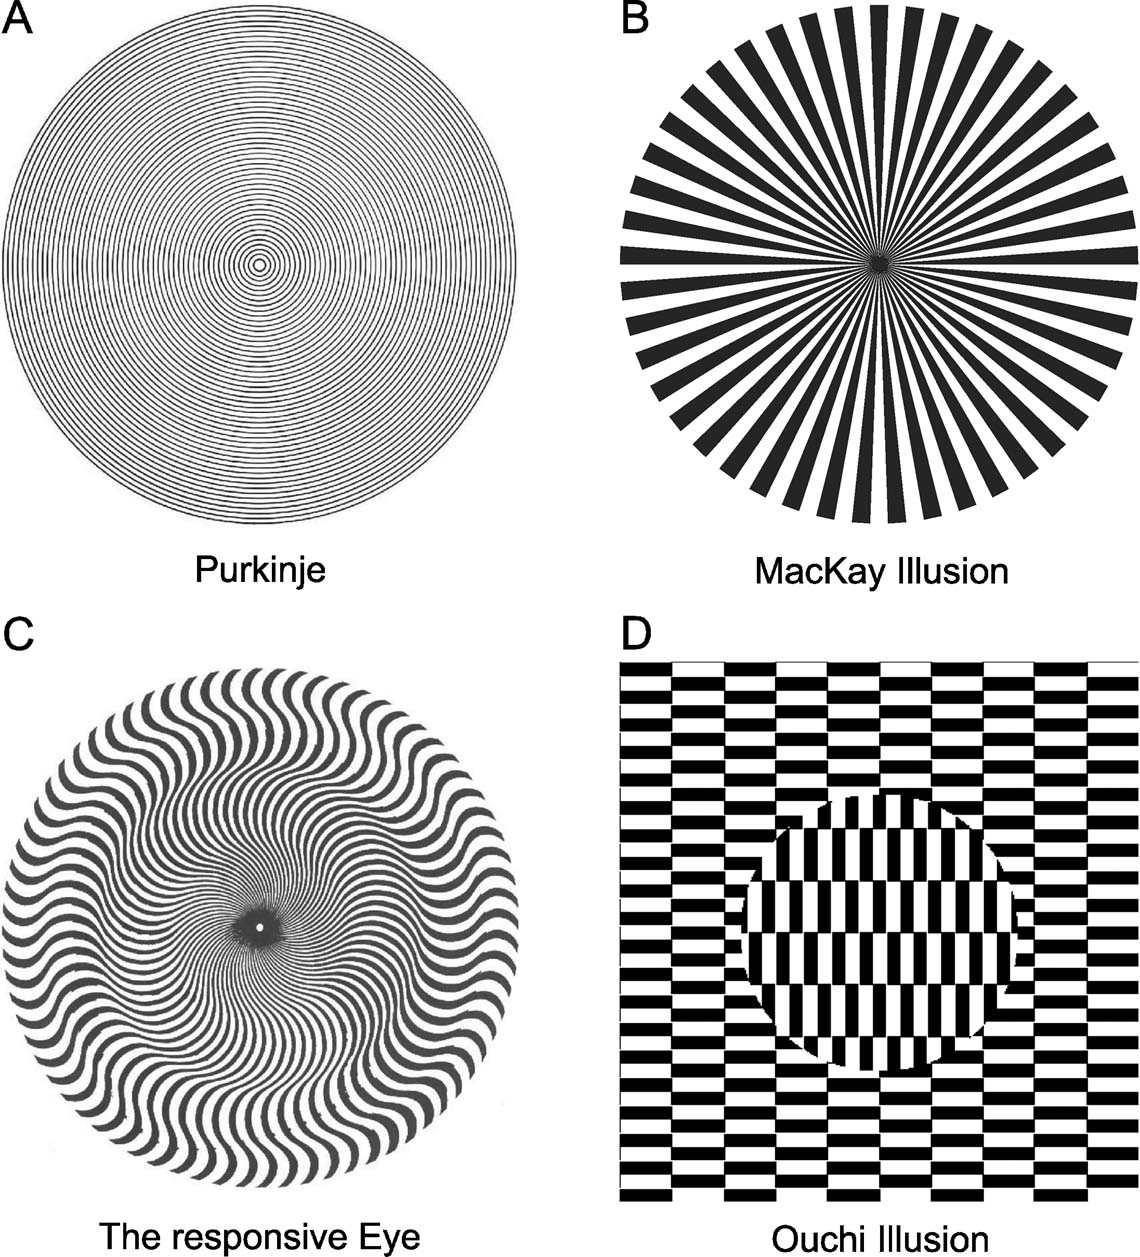
Figure 6. Examples of stimuli that elicit motion-induced illusions similar to those seen for the star. (A) Purkinje Illusion (Wade, 2003 ). (B) The Responsive Eye from Bridget Riley (Wade, 2003 ). (C) The MacKay Illusion (Pirenne et al., 1958 ). (D) Ouchi Illusion (Spillmann and Werner, 1990 ).
The aperture problem has been discussed previously in conjunction with apparent motion effects that are induced by fixational eye movements. Models have been made to explain the Ouchi illusion (Figure 6 D) and others (Fermüller et al., 1997 ; Fermüller et al., 2000 ; Mather, 2000 ) by means of simulated cortical motion detectors (Zanker, 2004 ; Zanker and Walker, 2004 ). Our study augments these findings by providing arguments for a retinal origin of such apparent motion effects. It is conceivable that the apparent motion elicited by these illusions requires at some point the activation of cortical motion detectors. Our results, however, indicate that this percept may not be the consequence of specific properties of cortical motion detectors.
The line-fading effect
In the model, the fading of sectors of the stimulus and the resulting apparent motion effect relies on transient responses, a well-documented feature of MC-cells (Lee et al., 1990 ). This effect may be related to perceptual fading under retinally stabilised conditions (Ditchburn and Ginsborg, 1952 ; Riggs et al., 1953 ), as at least one study has reported rapid perceptual fading within 80 ms during retinal image stabilisation (Coppola and Purves, 1996 ), matching well the transient time course of MC-cell responses. As mentioned, it is curious that PC-cells are still weakly tonically active under these conditions, and therefore still provide correct information about the stimulus. While perceptual fading effects may in fact occur at higher processing stages (e.g. Blakemore et al., 1971 ; Sharpe, 1972 ), PC-cell responses are generally weaker than MC-cell activity, which is dominated by transients and may, therefore, dominate visual perception. Two further observations would support this hypothesis: firstly, a fading effect can be reliably induced with moving low-contrast stimuli (unpublished data), and secondly, the effect is not seen for a red-green coloured version of the stimulus with equiluminant bars (then the whole stimulus quickly fades). Further experiments are needed to clarify these effects.
Here it was assumed that transient responses of MC-cells result from a combination of recurrent amacrine cell inhibition, disinhibition through a nested amacrine circuit and higher synaptic gain of BCs, a mechanism inspired by findings in the salamander retina (Roska et al., 1998 ). Similar circuits may exist in the mouse and cat retina (Nirenberg and Meister, 1997 ; O'Brien et al., 2003 ), but data from the salamander retina has also shown that cell-intrinsic factors can contribute to transient responses in BCs (Awatramani and Slaughter, 2000 ). Therefore, transient GC responses are likely to have multiple origins in the presynaptic circuitry, and may be mediated by different circuits, such as a delayed negative feedback either through a cell-intrinsic pathway or via an inhibitory interneuron. In principle, any such mechanism could produce a fading effect in the presence of slow drift movements. A simple delayed feedback, however, would render cells unresponsive after prolonged stimulation, and a mechanism such as the nested amacrine circuit proposed here is likely to be involved in regulating the inhibition received by BC and/or GC (Nirenberg and Meister, 1997 ; O'Brien et al., 2003 ).
The line-splitting effect
The apparent splitting of lines of the stimulus observed in the model is caused by nonlinear spatiotemporal summation, which causes a GC to respond to stimuli which cause zero net excitation of the receptive field (Figure 1 E; see Methods). This effect is, therefore, related to the frequency-doubling response for contrast-reversed gratings, as originally described for cat Y-cells (Enroth-Cugell and Robson, 1966 ).
To our knowledge, the line-splitting effect may be the first perceptual correlate of the frequency-doubling nonlinearity [it should be noted that a clinically applied glaucoma test where the rapid contrast reversal of a grating leads to the precept of doubled spatial frequency is not a consequence of MC-cell frequency-doubling (White et al., 2002 ). As for the fading effect, apparent line-splitting only has a neural correlate in MC-cells. This again suggests that for this stimulus, MC-cells seem to mediate perception, and that the conflicting information provided by PC-cells is bypassed by the visual system. Furthermore, this explanation for the splitting effect suggests that MC-cells have the ability to encode spatiotemporal variations on a smaller spatial scale than their classical receptive field allows. It has, for instance, been reported that Y-like cells could provide cues for second-order motion detection (Demb et al., 2001b ).
The origin of spatiotemporal nonlinearities in GCs is still not fully understood. Experimental data suggests that (1) amacrine cell involvement is less important (Demb et al., 1999 ), and (2) frequency-doubled activity might result from summation of spatially asymmetric BC activity (Demb et al., 2001a ). The latter is the basis for the nonlinear behaviour of MC-cells in the present model. As discussed in detail in an earlier paper, the spatial asymmetry of BC responses may result from a combination of photoreceptor response kinetics and the influence of amacrine cells (Hennig et al., 2002a ). In addition, mechanisms regulating the contrast gain in BCs (Beaudoin et al., 2007 ), not included in this model, might contribute.
Frequency-doubled responses in simulated MC-cells show stimulus-location independent second harmonic response and nonlinearity-indices less than 1 over a range of spatial frequencies (Figure 1 E) (White et al., 2002 ). Therefore, it is unlikely that the strength of receptive field nonlinearities and the splitting effect is exaggerated in the simulations. It should further be noted that in this model the effect strongly depends on the activation of the nested amacrine circuit (Figure 5 D), which contributes to, but is not the sole source of frequency-doubling (Hennig et al., 2002a ). This suggests that long-range interactions mediating a part of the extra-classical MC-cell receptive field (Benardete and Kaplan, 1999 ; Solomon et al., 2006 ) might additionally contribute to this effect.
Fixational eye movements
It is interesting to note that fixational eye movements, which are normally assumed to improve vision (Ditchburn and Ginsborg, 1953 ; Greschner et al., 2002 ; Hennig et al., 2002b ; Olveczky et al., 2003 ; Riggs et al., 1953 ; Hennig and Wörgötter, 2004 ; Rucci and Casile, 2005 ; Rucci and Desbordes, 2003 ; Martinez-Conde et al., 2006 ; Rucci et al., 2007 ; Funke et al., 2007 ), are in this case the source of false percepts. These effects are caused by drift movements, as the microtremor, consistent with an analysis by Barlow (1952) , fails to produce strong responses in GCs due to its small amplitude. The larger and faster microsaccades, which occur rarely during normal vision Steinman et al. (1967) , were not investigated. Recent work indicates that microsaccades can induce correlations in retinal motion on short time scales (Engbert and Kliegl, 2004 ) and their occurrence is not random, but depends on the history of drift movements (Engbert and Mergenthaler, 2006 ). It may, therefore, be possible that microsaccades additionally influence the effects described here, but psychophysical studies of related visual illusions indicate that mainly slow drift movements, not microsaccades, cause the relevant effects (Murakami et al., 2006 ; Zanker, 2004 ; Zanker and Walker, 2004 ). In line with these results, the most likely effect of microsaccades on the effects described here is that they produce strong bursts of activity that would disrupt the fading and splitting effects.
Conflict of Interest Statement
The authors declare that the research was conducted in the absence of any commercial or financial relationships that could be construed as a potential conflict of interest.
Acknowledgements
We wish to thank Peter Hancock for advice on psychophysical studies, Hans Ekkehard Plesser for the Matlab code to plot the population activity and Adam Barrett for improving the English. This work was supported by the European Commission grant ‘ECOVISION’ and the Scottish higher education grant to the ‘Institute for Neural Computational Intelligence’.
References
Appelle, S. (1972). Perception and discrimination as a function of stimulus orientation: the “oblique effect” in man and animals. Psychol. Bull. 78, 266–278.
Awatramani, G. B., and Slaughter, M. M. (2000). Origin of transient and sustained responses in ganglion cells of the retina. J. Neurosci. 20, 7087–7095.
Bader, C. R., and Bertrand, D. (1984). Effect of changes in intra- and extracellular sodium on the inward (anomalous) rectification in salamander photoreceptors. J. Physiol. 347, 611–31.
Beaudoin, D. L., Borghuis, B. G., and Demb, J. B. (2007). Cellular basis for contrast gain control over the receptive field center of mammalian retinal ganglion cells. J. Neurosci. 27, 2636–2645.
Benardete, E. A., and Kaplan, E. (1999). The dynamics of primate m retinal ganglion cells. Vis. Neurosci. 16, 355–368.
Benardete, E. A., Kaplan, E., and Knight, B. W. (1992). Contrast gain control in the primate retina: P cells are not X-like, some M cells are. Vis. Neurosci. 8, 483–486.
Blakemore, C., Muncey, J. P., and Ridley, R. M. (1971). Perceptual fading of a stabilized cortical image. Nature 233, 204–205.
Bolger, C., Bojanic, S., Sheahan, N. F., Coakley, D., and Malone, J. F. (1999). Dominant frequency content of ocular microtremor from normal subjects. Vision Res. 39, 1911–1915.
Coppola, D., and Purves, D. (1996). The extraordinarily rapid disappearance of entopic images. Proc. Natl. Acad. Sci. USA 93, 8001–8004.
Croner, L., and Kaplan, E. (1995). Receptive fields of P and M ganglion cells across the primate retina. Vision Res. 35, 7–24.
Dacey, D., Packer, O. S., Diller, L., Brainard, D., Peterson, B., and Lee, B. B. (2000). Center surround receptive field structure of cone bipolar cells in primate retina. Vision Res. 40, 1801–1811.
Dacey, D., and Petersen, M. (1992). Dendritic field size and morphology of midget and parasol ganglion cells in the human retina. Proc. Natl. Acad. Sci. USA 89, 9666–9670.
Dacey, D. M. (1993). The mosaic of midget ganglion cells in the human retina. J. Neurosci. 13, 5334–5355.
Demb, J. B., Haarsma, L., Freed, M. A., and Sterling, P. (1999). Functional circuitry of the retinal ganglion cell's nonlinear receptive field. J. Neurosci. 19, 9756–9767.
Demb, J. B., Zaghloul, K., Haarsma, L., and Sterling, P. (2001a). Bipolar cells contribute to nonlinear spatial summation in the brisk-transient (Y) ganglion cell in mammalian retina. J. Neurosci. 21, 7447–7454.
Demb, J. B., Zaghloul, K., and Sterling, P. (2001b). Cellular basis for the response to second-order motion cues in Y retinal ganglion cells. Neuron 32, 711–721.
Demontis, G. C., Longoni, B., Barcaro, U., and Cervetto, L. (1999). Properties and functional roles of hyperpolarization-gated currents in guinea-pig retinal rods. J. Physiol. 515, 813–828.
Derrington, A. M., and Lennie, P. (1984). Spatial and temporal contrast sensitivities of neurones in lateral geniculate nucleus of macaque. J. Physiol. 357, 219–240.
Ditchburn, R. W., and Ginsborg, B. L. (1952). Vision with a stabilized retinal image. Nature 170, 36–37.
Ditchburn, R. W., and Ginsborg, B. L. (1953). Involuntary eye movements during fixation. J. Physiol. 119, 1–17.
Eizenman, M., Hallett, P. E., and Frecker, R. C. (1985). Power spectra for ocular drift and tremor. Vision Res. 25, 1635–1640.
Engbert, R., and Kliegl, R. (2004). Microsaccades keep the eyes' balance during fixation. Psychol Sci. 15, 431–436.
Engbert, R., and Mergenthaler, K. (2006). Microsaccades are triggered by low retinal image slip. Proc. Natl. Acad. Sci. USA 103, 7192–7197.
Enroth-Cugell, C., and Robson, J. G. (1966). The contrast sensitivity of retinal ganglion cells of the cat. J. Physiol. 187, 517–552.
Feigenspan, A., Wässle, H., and Bormann, J. (1993). Pharmacology of GABA receptor Cl channels in rat retinal bipolar cells. Nature 361, 159–161.
Fermüller, C., Pless, R., and Aloimonos, Y. (1997). Families of stationary patterns producing illusory movement: insights into the visual system. Proc. Biol. Sci. 264, 795–806.
Fermüller, C., Pless, R., and Aloimonos, Y. (2000). The Ouchi illusion as an artifact of biased flow estimation. Vision Res. 40, 77–96.
Flores-Herr, N., Protti, D. A., Wässle, H. (2001). Synaptic currents generating the inhibitory surround of ganglion cells in the mammalian retina. J. Neurosci. 21, 4852–4863.
Funke, K., Kerscher, N., Wörgötter, F. (2007). Noise-improved signal detection in cat primary visual cortex via a well balanced stochastic resonance like process. Eur. J. Neurosci. 26, 1322–1332.
Goodchild, A. K., Ghosh, K. K., and Martin, P. R. (1996). Comparison of photoreceptor spatial density and ganglion cell morphology in the retina of human, macaque monkey, cat, and the marmoset callithrix jacchus. J. Comp. Neurol. 366, 55–75.
Greschner, M., Bongard, M., Rujan, P., Ammermüller, J. (2002). Retinal ganglion cell synchronization by fixational eye movements improves feature estimation. Nat. Neurosci. 5, 341–347.
Hennig, M. H., Funke, K., Wörgötter, F. (2002a). The influence of different retinal subcircuits on the nonlinearity of ganglion cell behavior. J. Neurosci. 22, 8726–8738.
Hennig, M. H., Kerscher, N. J., Funke, K., Wörgötter, F. (2002b). Stochastic resonance in visual cortical neurons: does the eye-tremor actually improve visual acuity?. Neurocomputing 44, 115–120.
Hennig, M. H., Wörgötter, F. (2004). Eye micro-movements improve stimulus detection beyond the Nyquist limit in the peripheral retina. In Advances in Neural Information Processing Systems 16, S. Thrun, L. Saul, and B. Schölkopf , eds. (Cambridge, MA: MIT Press).
Hildreth, E. C., and Koch, C. (1987). The analysis of visual motion: from computational theory to neuronal mechanisms. Annu. Rev. Neurosci. 10, 477–533.
Hochstein, S., and Shapley, R. M. (1976). Linear and nonlinear spatial subunits in Y cat retinal ganglion cells. J. Physiol. 262, 265–284.
Kamermans, M., and Spekreijse, H. (1999). The feedback pathway from horizontal cells to cones. A mini review with a look ahead. Vision Res. 39, 2449–2468.
Kaplan, E., and Shapley, R. (1986). The primate retina contains two types of ganglion cells, with high and low contrast sensitivity. Proc. Natl. Acad. Sci. USA 83, 2755–2757.
Kaplan, E., and Shapley, R. M. (1982). X and Y cells in the lateral geniculate nucleus of macaque monkeys. J. Physiol. 330, 125–143.
Lee, B. B., Pokorny, J., Smith, V. C., Martin, P. R., and Valberg, A. (1990). Luminance and chromatic modulation sensitivity of macaque ganglion cells and human observers. J. Opt. Soc. Am. A 7, 2223–2236.
Lee, B. B., Wehrhahn, C., Westheimer, G., and Kremers, J. (1993). Macaque ganglion cell responses to stimuli that elicit hyperacuity in man: detection of small displacements. J. Neurosci. 13, 1001–1009.
Lee, B. B., Wehrhahn, C., Westheimer, G., and Kremers, J. (1995). The spatial precision of macaque ganglion cell responses in relation to vernier acuity of human observers. Vision Res. 35, 2743–2758.
Leventhal, A. G., Rodieck, R. W., and Dreher, B. (1981). Retinal ganglion cell classes in the old world monkey: morphology and central projections. Science 213, 1139–1142.
Martinez-Conde, S., Macknik, S. L., Troncoso, X. G., and Dyar, T. A. (2006). Microsaccades counteract visual fading during fixation. Neuron 49, 297–305.
Mather, G. (2000). Integration biases in the Ouchi and other visual illusions. Perception 29, 721–727.
McMahon, M. J., Packer, O. S., and Dacey, D. M. (2004). The classical receptive field surround of primate parasol ganglion cells is mediated primarily by a non-GABAergic pathway. J. Neurosci. 24, 3736–3745.
Merigan, W. H., and Maunsell, J. H. (1993). How parallel are the primate visual pathways?. Annu Rev. Neurosci. 16, 369–402.
Milam, A. H., Dacey, D. M., and Dizhoor, A. M. (1993). Recoverin immunoreactivity in mammalian cone bipolar cells. Vis Neurosci. 10, 1–12.
Murakami, I. (2004). Correlations between fixation stability and visual motion sensitivity. Vision Res. 44, 751–761.
Murakami, I., and Cavanagh, P. (2001). Visual jitter: evidence for visual-motion-based compensation of retinal slip due to small eye movements. Vision Res. 41, 173–186.
Murakami, I., Kitaoka, A., and Ashida, H. (2006). A positive correlation between fixation instability and the strength of illusory motion in a static display. Vision Res. 46, 2421–2431.
Nelson, R. (1977). Cat cones have rod input: a comparison of the response properties of cones and horizontal cell bodies in the retina of the cat. J. Comp. Neurol. 172, 109–136.
Nirenberg, S., and Meister, M. (1997). The light response of retinal ganglion cells is truncated by a displaced amacrine circuit. Neuron 18, 637–650.
O'Brien, B. J., Richardson, R. C., and Berson, D. M. (2003). Inhibitory network properties shaping the light evoked responses of cat alpha retinal ganglion cells. Vis. Neurosci. 20, 351–361.
Olveczky, B. P., Baccus, S. A., and Meister, M. (2003). Segregation of object and background motion in the retina. Nature 423, 401–408.
Pack, C. C., and Born, R. T. (2001). Temporal dynamics of a neural solution to the aperture problem in visual area MT of macaque brain. Nature 409, 1040–1042.
Pirenne, M. H., Compbell, F. W., Robson, J. G., and MacKay, D. M. (1958). Moving visual images produced by regular stationary patterns. Nature 181, 362–363.
Riggs, L. A., and Ratliff, F. (1951). Visual acuity and the normal tremor of the eyes. Science 114, 17–18.
Riggs, L. A., Ratliff, F., Cornsweet, J. C., and Cornsweet, T. N. (1953). The disappearance of steadily fixated visual test objects. J. Opt. Soc. Am. 43, 495–501.
Roska, B., Nemeth, E., and Werblin, F. S. (1998). Response to change is facilitated by a three-neuron disinhibitory pathway in the tiger salamander. J. Neurosci. 18, 3451–3459.
Rucci, M., and Casile, A. (2005). Fixational instability and natural image statistics: implications for early visual representations. Network 16, 121–138.
Rucci, M., and Desbordes, G. (2003). Contributions of fixational eye movements to the discrimination of briefly presented stimuli. J. Vis. 3, 852–864.
Rucci, M., Iovin, R., Poletti, M., and Santini, F. (2007). Miniature eye movements enhance fine spatial detail. Nature 447, 851–854.
Rüttiger, L., Lee, B. B., and Sun, H. (2002). Transient cells can be neurometrically sustained: the positional accuracy or retinal signals to moving targets. J. Vis. 2, 232–242.
Schiller, P. H., and Logothetis, N. K. (1990). The color-opponent and broad-band channels of the primate visual system. Trends Neurosci. 13, 392–398.
Schnapf, J. L., Nunn, B. J., Meister, M., and Baylor, D. A. (1990). Visual transduction in cones of the monkey macaca fascicularis. J. Physiol. 427, 681–713.
Sharpe, C. R. (1972). The visibility and fading of thin lines visualized by their controlled movement across the retina. J. Physiol. 222, 113–134.
Sinclair, J. R., Jacobs, A. L., and Nirenberg, S. (2004). Selective ablation of a class of amacrine cells alters spatial processing in the retina. J. Neurosci. 24, 1459–1467.
Solomon, S. G., Lee, B. B., and Sun, H. (2006). Suppressive surrounds and contrast gain in magnocellular-pathway retinal ganglion cells of macaque. J. Neurosci. 26, 8715–8726.
Spauschus, A., Marsden, J., Halliday, D. M., Rosenberg, J. R., and Brown, P. (1999). The origin of ocular microtremor in man. Exp. Brain Res. 126.
Spillmann, L., and Werner, J. S. eds. (1990). Visual perception: the neurophisiological foundations (San Diego, Academic Press).
Steinman, R. M., Cunitz, R. J., Timberlake, G., and Herman, M. (1967). Voluntary control of microsaccades during maintained monocular fixation. Science 155, 1577–1579.
Steinman, R. M., Haddad, G. M., Skavenski, A. A., and Wyman, D. (1973). Miniature eye movement. Science 181, 810–819.
Thiel, A., Greschner, M., Ammermüller, J. (2006). The temporal structure of transient on∕off ganglion cell responses and its relation to intra-retinal processing. J. Comput. Neurosci. 21, 131–151.
van Hateren, H. (2005). A cellular and molecular model of response kinetics and adaptation in primate cones and horizontal cells. J. Vis. 5, 331–347.
van Hateren, J. H. (2007). A model of spatiotemporal signal processing by primate cones and horizontal cells. J. Vis. 7, 3–3.
Vardi, N., Zhang, L.-L., Payne, J. A., and Sterling, P. (2000). Evidence that different cation chloride cotransporters in retinal neurons allow opposite responses to GABA. J. Neurosci. 20, 7657–7663.
Wachtler, T., Wehrhahn, C., and Lee, B. B. (1996). A simple model of human foveal ganglion cell responses to hyperacuity stimuli. J. Comput. Neurosci. 3, 73–82.
Wässle, H., and Boycott, B. B. (1991). Functional architecture of the mammalian retina. Physiol. Rev. 71, 447–479.
Wässle, H., Boycott, B. B., Röhrenbeck, J. (1989). Horizontal cells in the monkey retina: cone connections and dendritic network. Eur. J. Neurosci. 1, 421–435.
Westheimer, G. (1986). Handbook of Perception and Human Performance, vol. 1, chap. The eye as an optical instrument (New York, John Wiley & Sons).
White, A. J., Sun, H., Swanson, W. H., and Lee, B. B. (2002). An examination of physiological mechanisms underlying the frequency-doubling illusion. Invest. Ophthalmol. Vis. Sci. 43, 3590–3599.
Keywords: motion perception, eye movements, fixation, model, retina, nonlinearities, magnocellular pathway
Citation: Matthias H. Hennig and Florentin Wörgötter (2007). Effects of fixational eye movements on retinal ganglion cell responses: A modelling study. Front. Comput. Neurosci. 1:2. doi: 10.3389/neuro.10/002.2007
Received: 25 August 2007;
Paper pending published: 15 October 2007;
Accepted: 15 October 2007;
Published online: 2 November 2007
Edited by:
Misha Tsodyks, Weizmann Institute of Science, IsraelReviewed by:
Klaus R. Pawelzik, University of Bremen, Germany; Peter Konig, University of Osnabrück, GermanyCopyright: © 2007 Hennig and Wörgötter. This is an open-access article subject to an exclusive license agreement between the authors and the Frontiers Research Foundation, which permits unrestricted use, distribution, and reproduction in any medium, provided the original authors and source are credited.
*Correspondence: Matthias H. Hennig, Institute for Adaptive and Neural Computation, School of Informatics, University of Edinburgh, Edinburgh EH1 2QL, UK. e-mail: mhhennig@gmail.com