A Comparison of Springtime Pollen and Nectar Foraging in Honey Bees Kept in Urban and Agricultural Environments
 Harper McMinn-Sauder
 Chia-Hua Lin
 Tyler Eaton
  Reed Johnson
- Department of Entomology, The Ohio State University, Columbus, OH, United States
Spring is an essential time for honey bee foraging in temperate climates. This is a period of increased brood rearing supporting colony growth and demands access to high-quality pollen and nectar resources. With the expansion of urban and agricultural landscapes, the availability of pollen and nectar producing flowers is declining in many areas. We aim to determine how patterns of spring pollen and nectar foraging differ between colonies surrounded by varying degrees of urban and agricultural intensity, as well as to assess the potential for nectar sampling to serve as a proxy for pollen collection. Thirteen apiaries in Central Ohio, along a gradient of urban and agricultural intensity, were monitored in spring of 2019 through the periodic collection of pollen and nectar samples and continuous colony weight monitoring. We found that spring honey bees in urban and agricultural areas gain comparable amounts of weight and use similar spring resources. Foraging was heavily focused on flowering trees and shrubs including Malus (apple), Salix (willow), and Prunus (cherry), until the beginning of clover bloom (Trifolium spp.). We also identified differences in pollen and nectar foraging within colonies, with nectar containing fewer species collected more evenly than matched pollen samples. These results demonstrate that honey bees in both agricultural and urban environments exhibit similar foraging patterns during the spring, and that plant species important for nectar collection are substantially different from plants important for pollen foraging, though limitations in nectar collection hinder our ability to draw definitive comparisons of pollen and nectar foraging in this region.
Introduction
Spring is an important time for honey bee foraging in temperate climates, as colonies rebuild food stores following winter to support brood production and increase the colony population. Large quantities of pollen are required to support the heightened brood rearing in spring [Free (1967); Crailsheim et al. (1992)], and activities including flight, wax production, and thermoregulation are fueled by the consumption of nectar (Haydak, 1970). Foragers' ability to exploit spring resources sets the colony up for success or failure later in the season (Mattila and Otis, 2006; Jevtić et al., 2009). Therefore, abundant flowers producing pollen and nectar must be available in the surrounding landscape to fulfill these needs.
Pollen and nectar quality vary with floral origin (Waller, 1972; Sommerville, 2001; Nicolson and Thornburg, 2007; Liolios et al., 2015). Pollen protein content ranges from 2 to 60% (T'ai and Cane, 2000), and the quantity of protein consumed impacts colony growth, performance, and worker physiological development (McCaughey et al., 1980; Amdam and Omholt, 2002; Zheng et al., 2014; Liolios et al., 2015). While protein is an important measure of pollen quality, other pollen constituents, including lipids, sterols, and micronutrients, also play a role in foraging choice and honey bee physiology (Requier et al., 2015; Filipiak et al., 2017; Bonoan et al., 2018; Chakrabarti et al., 2020; Crone and Grozinger, 2021). Consumption of high diversity pollen has also been shown to positively impact colony health (Alaux et al., 2010; Di Pasquale et al., 2013), and access to in-season pollen supports physiological development of spring workers (DeGrandi-Hoffman et al., 2018). The sugar content of nectar also varies with floral source, ranging from 10 to 70% by weight, though a concentration of 30–50% is preferred (Waller, 1972; Nicolson and Thornburg, 2007). Nectar foragers make decisions based on nectar sugar content and floral nectar volume (Corbet, 2003; Cnaani et al., 2006; Nicolson, 2011).
In temperate regions, pollen and nectar availability for a honey bee colony depends on the landscape in which it is located. Due to human population growth, urban and agricultural landscapes continue to expand (Veach et al., 2017), reducing natural pollinator forage. This is particularly relevant in the Midwestern United States, as the region undergoes agricultural intensification and reduction in critical natural habitat for pollinators (Otto et al., 2016; Dolezal et al., 2019). As generalist pollinators, honey bees can exploit floral resources within a foraging range as large as 6 km (Visscher and Seeley, 1982). In the spring, high quality forage is more abundant than later in the season in both urban and agricultural landscapes (Couvillon et al., 2014; Garbuzov et al., 2015; Danner et al., 2016).
In the springtime, honey bees in agricultural landscapes forage on wind-pollinated trees for pollen, including Quercus and Acer, trees and shrubs in the Rosaceae which provide both pollen and nectar, and herbaceous plants including Trifolium and Taraxacum (Richardson et al., 2015, 2020). Urban landscapes have markedly greater diversity in potential sources of spring forage, though there is substantial variability (Baldock et al., 2019; Fournier et al., 2020). Flowering trees including Acer, Aesculus, and Tilia provide abundant nectar and high-quality pollen resources to bees in urban landscapes (Somme et al., 2015). Cultivated flowers in gardens and yards also supply resources for urban pollinators (Baldock et al., 2019; Fournier et al., 2020; Tew et al., 2021), as well as common weeds, including Trifolium and Taraxacum (Larson et al., 2014), and flowering plants present in parks and cemeteries, among others (Baldock et al., 2019; Tew et al., 2021).
The aim of this study was to identify the differences in honey bee foraging during the spring in urban and agricultural landscapes around Central Ohio. This agricultural landscape is dominated by row crop agriculture, largely composed of corn and soybeans. Specifically, we aim to identify (1) how spring pollen and nectar foraging changes with increased agricultural intensity and (2) to assess the similarity in matched pollen and nectar samples taken from the same apiaries at the same time. This study also seeks to assess the potential for nectar or honey sampling to serve as a proxy for pollen collection. The possibility of using honey sampling to assess the foraging resources available for honey bees would enable greater participation by volunteer beekeepers, as most beekeepers harvest honey but few engage in pollen trapping. Pollen was collected from apiaries located along a gradient of urban and agricultural intensity in spring 2019 and pollen metabarcoding was used to determine the floral origin of both nectar and pollen. Additionally, continuous colony weight monitoring was used to assess colony growth. As a non-invasive method of data collection, remote weight monitoring allows the observation of within-colony dynamics and provides a view of the phenology of floral availability. We demonstrate that honey bees exhibit similar patterns of floral utilization in both urban and agricultural landscapes, but observed very different patterns in pollen and nectar collection, indicating that nectar sampling cannot be used as a proxy for pollen collection.
Methods
Study Setup
Thirteen apiaries in central Ohio were studied in 2019 (Figure 1). Agricultural land use for row crops (predominantly corn and soybean) surrounding each study apiary was estimated at a 2 km radius using ArcGIS Pro 2.2.0 (Environmental Systems Research Institute, Redlands, WA, USA), and the USDA Cropland Data Layer (USDA National Agricultural Statistics Service, 2020) (Figure 2). Five apiaries (WB, HR, FSR, EG, LO) were categorized as high agriculture, with >60% crop land within 2 km. Four apiaries (IB, MB, LL, CM) had medium levels of surrounding agriculture, with 30–60%, and four apiaries (MTSO, GA, DS, RB) had low levels of surrounding agriculture, with <30% crop land within 2 km. All apiaries were at least 3 km apart. Five study colonies were placed in each apiary, either overwintered colonies or colonies established from nucleus colonies. Colony management, including varroa mite control (Varroa destructor) and winter feeding followed standard practices for beekeepers in Ohio and was consistent across apiaries.
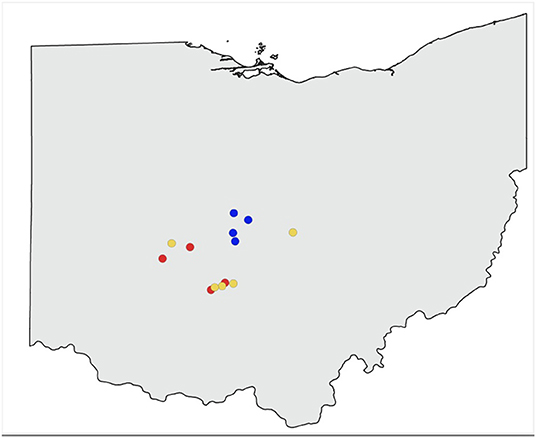
Figure 1. Study apiaries included in sampling. Red represents apiaries with high surrounding agricultural intensity (>60% within 2 km), yellow indicates apiaries with medium surrounding agriculture (30–60% within 2 km), blue indicates apiaries with low surrounding agriculture (<30% within 2 km).
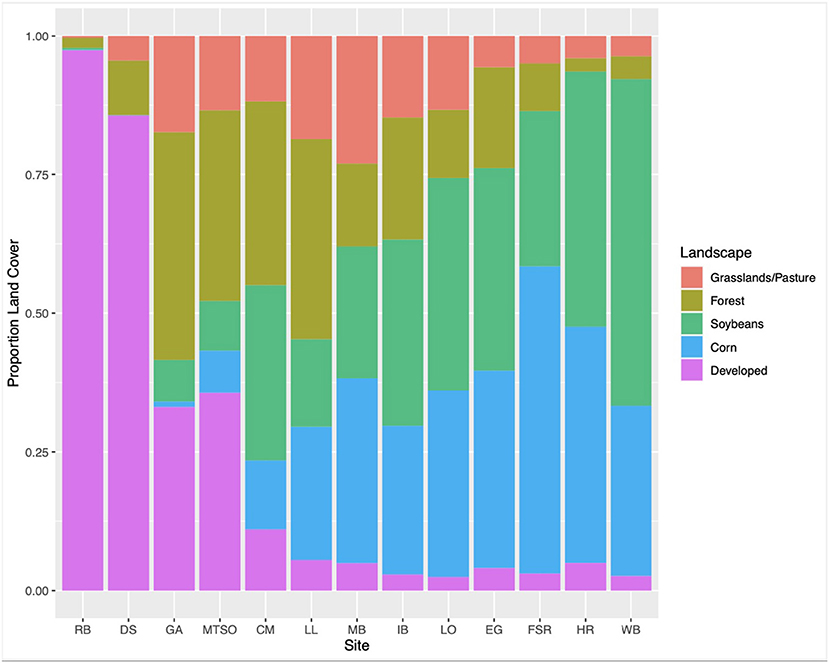
Figure 2. Proportion of land use types surrounding each apiary at a 2 km radius.
Identification of Floral Resources in Pollen and Nectar Samples
Incoming pollen was trapped from two colonies at each apiary using bottom mounted Sundance pollen traps (Ross Rounds, Albany, NY, USA). Traps were set to collect pollen continuously and pollen was harvested twice per week in April–May of 2019. A total of 167 pollen samples were collected, with thirteen pollen samples collected over this period from each of the thirteen apiaries, except for CM and MTSO, from which twelve samples were collected. Nectar was collected from three colonies at each apiary in May of 2019 by moving a 50 ml conical centrifuge tube across uncapped nectar cells until 30 ml had been collected. Uncapped cells were targeted to increase the likelihood of sampling freshly collected nectar. A total of 37 nectar samples were collected, three from each apiary except for RB and CM, from which two samples were collected. Pollen and nectar samples were stored at −18°C.
Residual pollen was extracted from nectar samples for identification using metabarcoding. First, nectar was warmed and dissolved in water at a 1:1 ratio, which then further diluted in 90% EtOH to create a 1:1:2 ratio of nectar to water to ethanol (Jones and Bryant, 2004). Approximately 19,000 lycopodium spores were added to each tube through a spiked glycerol emulsion, serving as an internal standard (Bryant and Jones, 2001). As a clubmoss, Lycopodium spp. is a plant taxon that would not typically be found in honey bee collected nectar. This method increases the potential quantifiability of pollen metabarcoding analysis. Samples underwent two rounds of centrifugation to create a pellet containing pollen. Each pellet was transferred to a 0.5 mL screw-cap microcentrifuge tube (Fisher Scientific, Hampton, NH, USA) and filled with 0.7 mm zirconia beads (Fisher Scientific, Hampton, NH, USA) and DI water in preparation for bead beating.
Bulk pollen samples were homogenized by adding either 5 g of pollen or the total pollen sample if <5 g to distilled water, achieving a final concentration of 0.25 g/mL pollen. The sample was then agitated with a Burrell Wrist-Action laboratory shaker (Burrell Scientific, LLC, Pittsburgh, PA, USA) to dissolve the pollen balls. An 0.8 mL aliquot of the blended solution was added to a 2 mL screw-cap microcentrifuge tube (Fisher Scientific, Hampton, NH, USA) filled with 0.7 mm zirconia beads (Fisher Scientific, Hampton, NH, USA).
Pollen isolated from nectar and corbicular pollen were then placed in a beadbeater (Mini-BeadBeater-16; BioSpec Products, Bartlesville, OK, USA) and run for 3 min to disrupt the pollen coat and release the DNA. A 3-step method of PCR amplification was used to amplify the two barcoding loci in pollen and nectar samples (Richardson et al., 2015, 2019). Two plant metabarcoding loci, rbcL and ITS2, were used for PCR step 1, with 1 μL of the crude pollen extract serving as the template. In PCR step 2, 1 μL of the PCR1 reaction product was used as the template. This step appended template priming oligos to the first step amplicons. The template for PCR step 3 was 1 μL of the product from PCR2. Primers in this step were modified such that sample indexing and lane hybridization oligos were appended to the PCR2 amplicons. Library quality was verified using gel electrophoresis and an Agilent 4200 TapeStation. Libraries were purified using a SequalPrep Normalization Plate kit (Thermo Fisher Scientific, Waltham, MA, USA) and sequenced on a 15 million reads, 300 base-pair standard Illumina MiSeq Flow Cell at the Molecular and Cellular Imaging Center in Wooster, Ohio.
Each DNA sequence was compared to the NCBI plant reference database for each locus. Sequences were identified to the genus level using the MetaClassifier (Sponsler et al., 2020) pipeline implemented on the Owens cluster at the Ohio Supercomputer Center. Reference databases for rbcL and ITS2, containing plant species known to be present in Ohio or surrounding states (https://plants.sc.egov.usda.gov/) were downloaded from NCBI (retrieved on August 17, 2021) and curated using MetaCurator (Richardson et al., 2020) and Taxonomizr (https://CRAN.R-project.org/package=taxonomizr) to obtain taxonomic information for each plant species. First, paired-end reads were merged and converted to FASTA format. Genus-level taxonomy proportions were then determined for each metabarcoding locus using VSEARCH and median proportions were calculated for each marker. Metabarcoding parameters for alignment were 80% sample coverage and 92.5% sequence identity for ITS2 and 96% sequence identity for rbcL. Only genera detected at 0.01 percent sample proportional abundance were retained for further analysis. Data were visualized using the ggplot2 package in Rstudio (Wickham et al., 2016). Species richness of collected pollen and nectar samples was assessed at the genus level. A Shannon-Wiener diversity analysis of samples collected from each apiary was performed to identify apiary-level differences in pollen and nectar diversity. One-way ANOVA models were fit to identify significant relationships between categorical agricultural intensity around each apiary and genus richness, evenness, and diversity in nectar samples. Two-way ANOVA models were fit to identify significant relationships between pollen sample collection date and genus richness, evenness, and diversity.
Colony Weight Monitoring
Honey bee colony weight was continuously monitored for three colonies in each study apiary over the duration of the foraging season. Broodminder-W multi-load hive scales (Broodminder, Stoughton, Wisconsin, USA) were placed beneath the study colonies in May and remained in place through the spring of 2020. Broodminder scales were aligned with the hive entrance and balanced with an angle iron on the back of the colony. Weight was not tracked in any colony fitted with a pollen trap. Colony weight data were recorded once per hour and stored on the device until downloaded through Bluetooth using the Broodminder app.
Raw hive weight data were downloaded from the Broodminder website and analyzed using the hivescaler package in RStudio (https://github.com/sponslerdb/hivescaler). A detrending method was used to analyze running weight data to visualize weight changes between days. Daily midnight values were first extracted from the data set and used to calculate the weight difference between values of consecutive days. Midnight values were used as foraging has ceased for the day and resources are not entering the hive. Data were cleaned to remove artifacts from the differenced weight values. An artifact, indicating colony manipulation by a beekeeper, is defined in this study as any change in weight larger than 2.3 kg between consecutive midnight readings as it is very rare in this region for colonies to gain this much weight over the course of a day. The cumulative sum of the cleaned differenced weight was calculated to indicate running weight change. The reconstructed weight was then normalized to remove colony-level performance differences to better observe landscape-level trends driving colony weight change. A GAM smoother was fit to the normalized and non-normalized weight curves to visualize colony weight change and global smoothers were fit to the normalized data. One-way ANOVA models were fit to evaluate significant relationships between agricultural intensity around each apiary and normalized and non-normalized weight change.
Results
Sequencing resulted in an average of 164,694 raw reads per pollen sample and an average of 259,780 raw reads per nectar sample. Following sequence alignment, all taxa detected at 1% proportional abundance or greater were included in analyses. Proportional abundance reflects the quantity of a given taxa present within a sample, relative to other detected sample taxa. Sixty-nine genera were detected in pollen samples and 26 genera were detected in nectar samples. Only taxa detected at 5% proportional abundance or greater were included in data visualization to exclude taxa detected in very small quantities.
Nectar
Genus-level richness was highest for nectar samples collected from apiaries in low agricultural landscapes, with 17 genera, and lowest in samples collected from apiaries in medium agricultural intensity, with 15 genera detected. Genus-level sample diversity was highest in samples collected from medium agriculture apiaries and lowest in samples collected from high agriculture apiaries (mean = 2.11, mean = 1.78, STDEV = 0.17). Sample evenness was highest in samples collected from medium agriculture apiaries, and lowest in samples collected from apiaries with high surrounding agriculture (mean = 0.78, mean = 0.64, STDEV = 0.07). Results from a one-way ANOVA indicate that nectar sample richness, evenness, and diversity at the genus-level were not significantly (P > 0.01) associated with percentage agriculture surrounding each apiary. However, Salix (willow), Gleditsia (honey locust), and Trifolium (clover) pollens were detected at >10% proportional abundance in May nectar samples collected from all apiaries. In addition, Pyrus (pear) pollen was a major component of samples collected from apiaries with low surrounding agricultural intensity (Figure 3D).
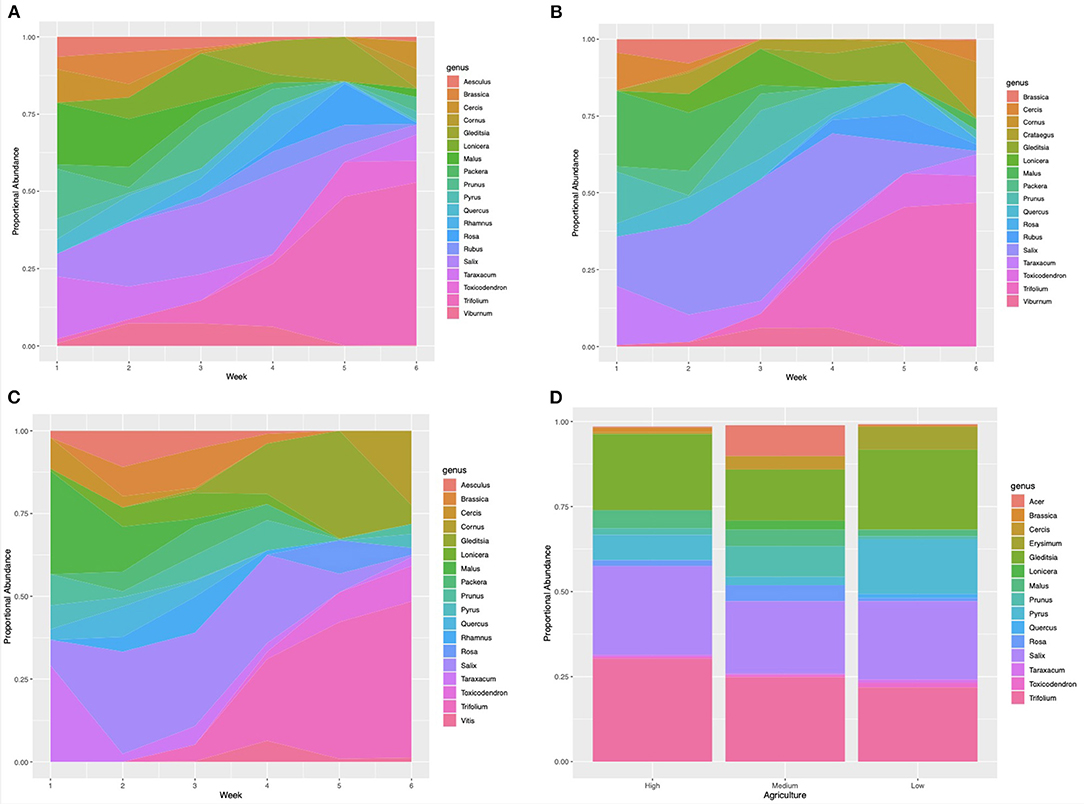
Figure 3. Proportional abundance of plant taxa detected in samples collected in the spring of 2019. (A) Pollen samples collected weekly from apiaries with a low proportion of surrounding agriculture (RB, DS, GA, MTSO) (>60%) within the surrounding 2 km radius (WB, HR, LO, FSR, EG). (B) Pollen samples collected weekly from apiaries with a medium proportion of surrounding agriculture (30–60%) (MB, IB, CM, LL). (C) Pollen samples collected weekly from apiaries with low surrounding agriculture (<30%) (RB, DS, GA, MTSO). (D) Nectar samples collected in May of 2019 from all study apiaries.
Pollen
Genus-level richness of pollen samples ranged from 15 to 35 genera, with a mean richness of 25.17 (STDEV = 5.78). Genus-level richness was highest in samples collected from May 29 to June 7 and lowest in samples collected from May 22 to 28 (Table 1). Genus-level sample evenness ranged from 0.58 to 0.85, with a mean value of 0.75 (STDEV = 0.08). Genus-level evenness was highest in samples collected from May 1 to 7 and lowest in samples collected from May 29 to June 7. Genus-level diversity ranged from 1.85 to 2.77 with a mean value of 2.41 (STDEV = 0.31). Sample diversity was highest in samples collected from May 8 to 14 and lowest in samples collected from May 22 to 28. May sample richness and diversity were highest in samples collected from high agriculture apiaries and sample evenness was highest in samples collected from apiaries with medium agriculture. Pollen sample evenness and diversity were lowest in samples collected from low agriculture apiaries, and sample richness was equal in samples collected from apiaries with medium and low levels of agriculture. Pollen sample richness, diversity, and evenness at the genus-level were significantly (P < 0.001) associated with week of sample collection.
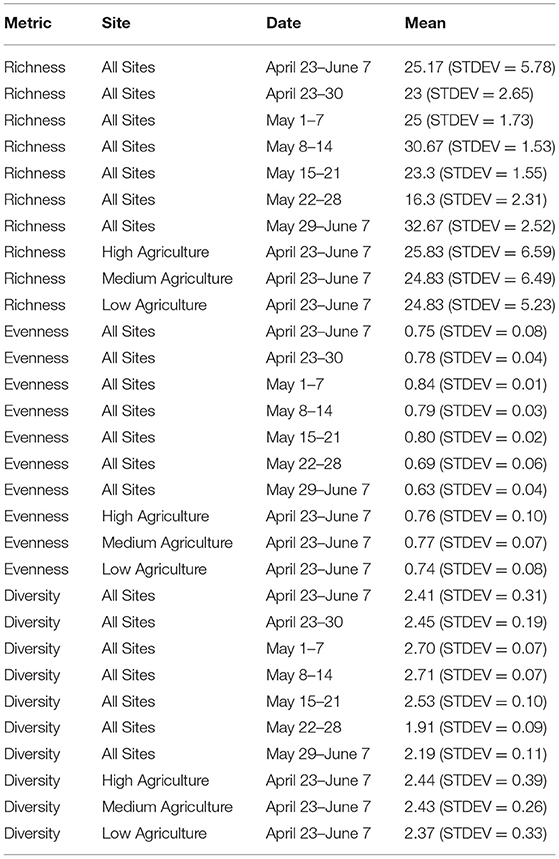
Table 1. Pollen sample richness, evenness and diversity calculated at the genus-level for different weeks and levels of agricultural intensity.
Pollen samples collected from all apiaries were composed of Malus (apple) at 10% or greater proportional abundance from April 23 to May 7. Samples collected from April 23–30 also included Taraxacum (dandelion) pollen in samples collected from all apiaries, as well as Prunus (cherry) pollen from high and medium agriculture apiaries, and Salix (willow) pollen in samples collected from medium agriculture apiaries. Composition of samples collected from all apiaries shifted to include Salix (willow) as a major component from May 1 to 27. In the week of May 8 to 14 Lonicera (honeysuckle) pollen was detected as a major component of samples collected from apiaries with high surrounding agriculture, and Prunus (cherry) pollen in samples from high and medium agriculture apiaries. Samples collected from May 15 to 21 from apiaries with low surrounding agriculture were largely composed on Gleditsia (honey locust) pollen. Trifolium (clover) pollen became a major component of samples collected from all apiaries from May 15 to the end of the sampling period on June 7. Samples collected from May 22 to 28 included Gleditsia (honey locust) pollen as a major component of samples collected from all apiaries, as well as Rosa (rose) and Toxicodendron (poison ivy) pollen from samples collected from apiaries with high surrounding agriculture. Samples collected from May 29 to June 7 had high abundance of Cornus (dogwood) pollen in apiaries with medium and low surrounding agriculture (Figures 3A–C).
May pollen samples collected from all apiaries had overall higher richness (mean = 25.17, STDEV = 5.78), evenness (mean = 0.75, STDEV = 0.08), and diversity (mean = 2.41, STDEV = 0.31), than May nectar samples (mean = 16, STDEV = 1; mean = 0.7, STDEV = 0.07; mean = 1.93, STDEV = 0.17).
Colony Weight Change
Colonies at all apiaries gained weight consistently from May 1 to June 1 (Figure 4). Percentage agriculture on the landscape surrounding each apiary was not significantly (P > 0.01) associated with normalized or non-normalized colony weight change. An AIC model fit analysis was conducted to compare the fit of models with global smoothers, colony-level smoothers, and global + colony smoothers to normalized weight data from colonies located at all apiaries. Results of this analysis indicate the best fit of a global model to normalized colony weight (Figure 5). Models fit to colonies categorized by agricultural intensity (high, medium, low) indicate best fit of a global model in all cases (Supplementary Table 1).
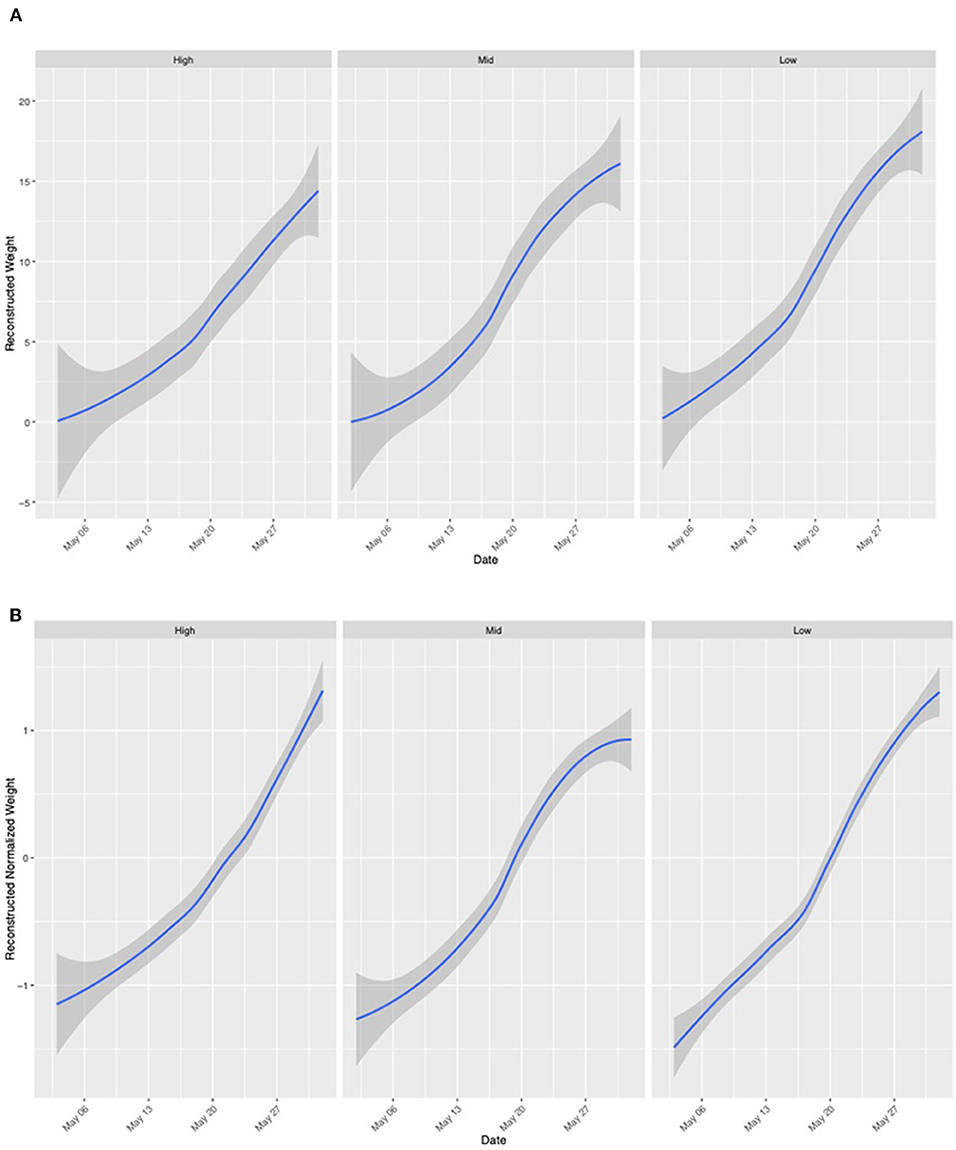
Figure 4. Colony weight change in May of 2019. Data frames are ordered by degree of agricultural intensity within a 2 km radius [right: High (WB, HR, LO, FSR, EG), center: Medium (MB, IB, CM, LL), left: Low (RB, DS, GA, MTSO)]. Weight is pooled for colonies at apiaries in each category of agricultural intensity. (A) Non-normalized colony weight change indicates colony-level performance differences and influence on colony weight change. (B) Normalized colony weight change allows visualization of landscape-level trends in colony weight.
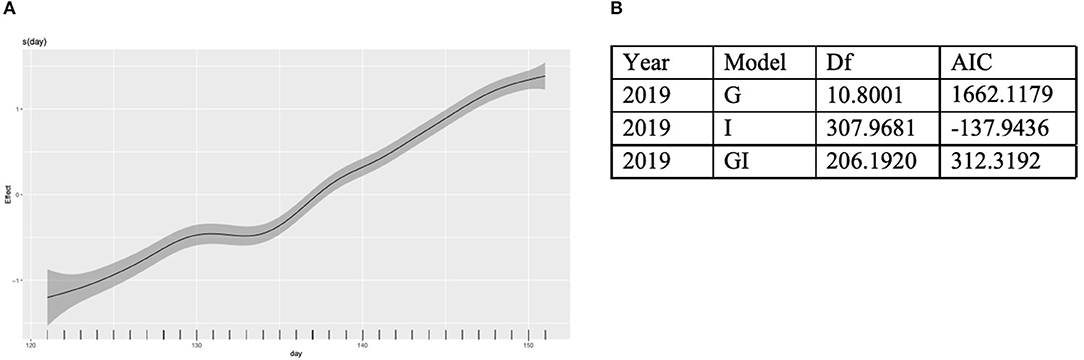
Figure 5. Global, local, and global + local models were fit to normalized weight data collected from all colonies in May of 2019. (A) A global best fit model of colony weight change per day from May 1 to June 1. (B) Results from an AIC analysis to identify the best fit model.
Discussion
In this study, honey bee colonies in both agricultural and urban environments showed similar colony weight dynamics and foraged on similar flowers for pollen and nectar. This suggests that there may not be an advantage for colonies in either landscape in spring conditions. The weight gain detected in colonies at all apiaries indicates access to sufficient food resources to facilitate springtime colony population growth. Pollen samples collected from all apiaries were composed primarily of woody flowering species including Malus (apple), Salix (willow), and Prunus (cherry) until Trifolium (clover) entered bloom when pollen composition shifted. Similar plant species contributed to collected nectar, though nectar samples contained pollen from a few major taxa represented in relatively even proportions, suggesting that few plants were suitable for nectar foraging.
Woody species, Malus, Prunus, and Salix were detected in pollen samples from agricultural areas and were likely coming from forested woodlots near apiaries and from plant species included in hedgerows (Long and Anderson, 2010; Wratten et al., 2012). These taxa are often found in urban spaces, in addition to agricultural landscapes, explaining their detection in pollen samples collected from apiaries with variable landscape composition. Trifolium, detected heavily in pollen and nectar samples, and Taraxacum, detected in pollen samples, are common forbs often found on roadsides and in ditches, as well as along crop edges. As some areas of the Midwest are undergoing agricultural intensification through the removal of non-crop habitat, the elimination of areas supporting these plants has high potential for negative impacts on insect pollinators, as they serve as important floral resources through the summer and fall (Bretagnolle and Gaba, 2015; Requier et al., 2015; McMinn-Sauder et al., 2020). A similar pattern of eradication exists in urban spaces where Trifolium and Taraxacum are often unwelcome components in lawns (Robbins and Sharp, 2003). Removal of these plants could have detrimental impacts on honey bees in the springtime.
While we found similarities in the composition of pollen and nectar collected by bees in different landscapes, these samples reflect very different foraging patterns for pollen and nectar. Pollen sample richness was greater than that of matched nectar samples. This demonstrates that honey bees are foraging on a greater number of taxa for pollen than nectar in May in this study system, though we must consider that this result may be due in part to the large difference in the number of collected pollen and nectar samples. It is also important to consider that taxonomic biases may be present in nectar samples due to variable pollen quantities that may be collected during nectar foraging (Bryant and Jones, 2001). In addition, taxa detected in nectar samples were found in more even proportions than taxa detected in pollen samples. These results support observations by Coffey and Breen (1997) and Requier et al. (2015), who found that honey bees forage on fewer species for nectar than for pollen.
This result suggests that a few high-quality sources provide much of the nectar for foraging honey bees in the spring in this region. While pollen plays a crucial role in plant reproduction, nectar is an energetically expensive pollination reward (Pyke, 1991; Pacini et al., 2003). It is likely that many plant species with high quality pollen have low quality nectar, either in low volume or low sugar concentration, making these taxa less attractive (Nicolson, 2011; Somme et al., 2015; Tew et al., 2021). In addition, plants that honey bees regularly visit for pollen, including Salix (willow) and Quercus (oak), are wind pollinated and do not produce nectar (Severson and Parry, 1981). The low quality of many nectar sources may cause them to be overlooked in a diverse floral landscape.
In addition, differences in foragers' ability to perceive resource quality may be a factor driving patterns of pollen and nectar foraging. Nectar is collected to fulfill the colony's need for carbohydrates and quality is evaluated by volume and sugar concentration (Corbet, 2003; Cnaani et al., 2006; Nicolson, 2011), with preferences shown to nectars with high quantities of sugar (Roubik and Buchmann, 1984; Nicolson and Thornburg, 2007). This straightforward assessment may result in bees collecting predominantly high-quality nectar. In contrast, pollen, as the source of protein, lipids, amino acids, sterols, and micronutrients, provides an opportunity for foraging honey bees to balance colony needs for these nutrients. Ruedenauer et al. (2021) demonstrated that honey bee foragers have the ability to assess amino acid and fatty acid content in pollens, though they lack the ability to distinguish between pollens with variable sterol composition. In addition, Bonoan et al. (2018) found that honey bees forage to balance the micronutrient content in the colony. These results suggest that honey bees may use pollen foraging decisions to maintain dietary balance, potentially make it advantageous for foragers to collect pollen from many species in lower abundances to maintain balance in the colony.
This difference in pollen and nectar foraging suggests that nectar sampling cannot serve as a representative for honey bee pollen collection. While nectar sampling would likely detect major floral sources that honey bees forage for both pollen and nectar, it is unlikely that many of the lesser pollen components would be detected. In addition, due to the balanced proportions of taxa present in nectar samples, taxa that are foraged for pollen and nectar may be overrepresented in their importance when only analyzing nectar samples. However, it must be noted that our limited nectar sampling hinders the conclusions that can be drawn with these data. Due to the uneven sampling of pollen and nectar, they cannot be definitively compared. Further studies with more extensive nectar sampling are required to draw more concrete comparisons between pollen and nectar foraging habits.
This study demonstrates that bees in urban and agricultural landscapes have similar spring diets. This suggests that the needs of spring bees are similar in Central Ohio, regardless of habitat type and reinforces the importance of ensuring that sufficient floral resources are present in all landscapes to support honey bee colony growth. In addition, we demonstrate that honey bee foraging patterns for spring pollen and nectar are very different, though this conclusion may be due in part to uneven pollen and nectar sampling. The small number of taxa used by honey bees for spring nectar collection highlights the importance of considering floral nectar production when planting for pollinators. Inclusion of high nectar producing taxa, such as flowering trees and weedy herbaceous plants, on all landscapes can ensure that the spring carbohydrate needs of foraging honey bees are being met.
Data Availability Statement
The datasets presented in this study can be found in online repositories. The names of the repository/repositories and accession number(s) can be found below: https://github.com/HarperMcMinnSauder/SpringPollen, doi: 10.5281/zenodo.5736314.
Author Contributions
HM-S, C-HL, and RJ: conceptualization and investigation. HM-S, C-HL, TE, and RJ: methodology and writing—review and editing. HM-S: software, formal analysis, data curation, writing—original draft preparation, and visualization. RJ: resources, supervision, project administration, and funding acquisition. All authors have read and agreed to the published version of the manuscript.
Funding
This work was supported by USDA-NIFA-AFRI (#2019-67013-29297), and state and federal funds appropriated to The Ohio State University, Ohio Agricultural Research and Development Center (OHO01277 and OHO01355-MRF).
Conflict of Interest
The authors declare that the research was conducted in the absence of any commercial or financial relationships that could be construed as a potential conflict of interest.
Publisher's Note
All claims expressed in this article are solely those of the authors and do not necessarily represent those of their affiliated organizations, or those of the publisher, the editors and the reviewers. Any product that may be evaluated in this article, or claim that may be made by its manufacturer, is not guaranteed or endorsed by the publisher.
Acknowledgments
The authors would like to thank Isabel Nazarian, Nicole Sammons, and Adrianna Pollee for their help in sample collection and nectar sample processing. We would also like to thank Isaac Barnes, Phil Young, Nate Douridas, and Dave Noble for access to apiary sites and honey bee colonies, and the Ohio Supercomputer Center for access to computing resources that contributed to the completion of this research.
Supplementary Material
The Supplementary Material for this article can be found online at: https://www.frontiersin.org/articles/10.3389/fsufs.2022.825137/full#supplementary-material
References
Alaux, C., Ducloz, F., Crauser, D., and Le Conte, Y. (2010). Diet effects on honeybee immunocompetence. Biol. Lett. 6, 562–565. doi: 10.1098/rsbl.2009.0986
Amdam, G. V., and Omholt, S. W. (2002). The regulatory anatomy of honeybee lifespan. J. Theor. Biol. 216, 209–228. doi: 10.1006/jtbi.2002.2545
Baldock, K. C., Goddard, M. A., Hicks, D. M., Kunin, W. E., Mitschunas, N., Morse, H., et al. (2019). A systems approach reveals urban pollinator hotspots and conservation opportunities. Nat. Ecol. Evol. 3, 363–373. doi: 10.1038/s41559-018-0769-y
Bonoan, R. E., O'Connor, L. D., and Starks, P. T. (2018). Seasonality of honey bee (Apis mellifera) micronutrient supplementation and environmental limitation. J. Insect Physiol. 107, 23–28. doi: 10.1016/j.jinsphys.2018.02.002
Bretagnolle, V., and Gaba, S. (2015). Weeds for bees? A review. Agron. Sustain. Dev. 35, 891–909. doi: 10.1007/s13593-015-0302-5
Bryant, V. M. Jr., and Jones, G. D. (2001). The r-values of honey: pollen coefficients. Palynology 25, 11–28. doi: 10.1080/01916122.2001.9989554
Chakrabarti, P., Lucas, H. M., and Sagili, R. R. (2020). Evaluating effects of a critical micronutrient (24-methylenecholesterol) on honey bee physiology. Ann. Entomol. Soc. Am. 113, 176–182. doi: 10.1093/aesa/saz067
Cnaani, J., Thomson, J. D., and Papaj, D. R. (2006). Flower choice and learning in foraging bumblebees: effects of variation in nectar volume and concentration. Ethology 112, 278–285. doi: 10.1111/j.1439-0310.2006.01174.x
Coffey, M. F., and Breen, J. (1997). Seasonal variation in pollen and nectar sources of honey bees in Ireland. J. Apic. Res. 36, 63–76. doi: 10.1080/00218839.1997.11100932
Corbet, S. A. (2003). Nectar sugar content: estimating standing crop and secretion rate in the field. Apidologie 34, 1–10. doi: 10.1051/apido:2002049
Couvillon, M. J., Schürch, R., and Ratnieks, F. L. (2014). Waggle dance distances as integrative indicators of seasonal foraging challenges. PLoS ONE 9, e93495. doi: 10.1371/journal.pone.0093495
Crailsheim, K., Schneider, L. H. W., Hrassnigg, N., Bãhlmann, G., Brosch, U., Gmeinbauer, R., et al. (1992). Pollen consumption and utilization in worker honeybees (Apis mellifera carnica): dependence on individual age and function. J. Insect Physiol. 38, 409–419. doi: 10.1016/0022-1910(92)90117-V
Crone, M. K., and Grozinger, C. M. (2021). Pollen protein and lipid content influence resilience to insecticides in honey bees (Apis mellifera). J. Exp. Biol. 224, jeb242040. doi: 10.1242/jeb.242040
Danner, N., Molitor, A. M., Schiele, S., Härtel, S., and Steffan-Dewenter, I. (2016). Season and landscape composition affect pollen foraging distances and habitat use of honey bees. Ecol. Appl. 26, 1920–1929. doi: 10.1890/15-1840.1
DeGrandi-Hoffman, G., Gage, S. L., Corby-Harris, V., Carroll, M., Chambers, M., Graham, H., et al. (2018). Connecting the nutrient composition of seasonal pollens with changing nutritional needs of honey bee (Apis mellifera L.) colonies. J. Insect Physiol. 109, 114–124. doi: 10.1016/j.jinsphys.2018.07.002
Di Pasquale, G., Salignon, M., Le Conte, Y., Belzunces, L. P., Decourtye, A., Kretzschmar, A., et al. (2013). Influence of pollen nutrition on honey bee health: do pollen quality and diversity matter? PLoS ONE 8, e72016. doi: 10.1371/journal.pone.0072016
Dolezal, A. G., Clair, A. L. S., Zhang, G., Toth, A. L., and O'Neal, M. E. (2019). Native habitat mitigates feast–famine conditions faced by honey bees in an agricultural landscape. Proc. Nat. Acad. Sci. U. S. A. 116, 25147–25155. doi: 10.1073/pnas.1912801116
Filipiak, M., Kuszewska, K., Asselman, M., Denisow, B., Stawiarz, E., Woyciechowski, M., et al. (2017). Ecological stoichiometry of the honeybee: pollen diversity and adequate species composition are needed to mitigate limitations imposed on the growth and development of bees by pollen quality. PLoS ONE 12, e0183236. doi: 10.1371/journal.pone.0183236
Fournier, B., Frey, D., and Moretti, M. (2020). The origin of urban communities: from the regional species pool to community assemblages in city. J. Biogeogr. 47, 615–629. doi: 10.1111/jbi.13772
Free, J. B. (1967). Factors determining the collection of pollen by honeybee foragers. Anim. Behav. 15, 134–144. doi: 10.1016/S0003-3472(67)80024-1
Garbuzov, M., Schürch, R., and Ratnieks, F. L. (2015). Eating locally: dance decoding demonstrates that urban honey bees in Brighton, UK, forage mainly in the surrounding urban area. Urban Ecosyst. 18, 411–418. doi: 10.1007/s11252-014-0403-y
Haydak, M. H. (1970). Honey bee nutrition. Annu. Rev. Entomol. 15, 143156. doi: 10.1146/annurev.en.15.010170.001043
Jevtić, G., Mladenović, M., Andjelković, B., Nedić, N., Sokolović, D., and Štrbanović, R. (2009). The correlation between colony strength, food supply and honey yield in honey bee colonies. Biotechnol. Anim. Husband. 25, 1141–1147.
Jones, G. D., and Bryant, V. M. Jr. (2004). The use of ETOH for the dilution of honey. Grana 43, 174–182. doi: 10.1080/00173130410019497
Larson, J. L., Kesheimer, A. J., and Potter, D. A. (2014). Pollinator assemblages on dandelions and white clover in urban and suburban lawns. J. Insect Conserv. 18, 863–873. doi: 10.1007/s10841-014-9694-9
Liolios, V., Tananaki, C., Dimou, M., Kanelis, D., Goras, G., Karazafiris, E., et al. (2015). Ranking pollen from bee plants according to their protein contribution to honey bees. J. Apic. Res. 54, 582–592. doi: 10.1080/00218839.2016.1173353
Long, R., and Anderson, J. (2010). Establishing Hedgerows on Farms in California. Richmond, CA: University of California Agriculture and Natural Resources.
Mattila, H. R., and Otis, G. W. (2006). Influence of pollen diet in spring on development of honey bee (Hymenoptera: Apidae) colonies. J. Econ. Entomol. 99, 604–613. doi: 10.1093/jee/99.3.604
McCaughey, W. F., Gilliam, M., and Standifer, L. N. (1980). Amino acids and protein adequacy for honey bees of pollens from desert plants and other floral sources. Apidologie 11, 75–86. doi: 10.1051/apido:19800109
McMinn-Sauder, H., Richardson, R., Eaton, T., Smith, M., and Johnson, R. (2020). Flowers in Conservation Reserve Program (CRP) pollinator plantings and the upper Midwest agricultural landscape supporting honey bees. Insects 11, 405. doi: 10.3390/insects11070405
Nicolson, S. W. (2011). Bee food: the chemistry and nutritional value of nectar, pollen and mixtures of the two. Afr. Zool. 46, 197–204. doi: 10.1080/15627020.2011.11407495
Nicolson, S. W., and Thornburg, R. W. (2007). “Nectar chemistry,” in Nectaries and Nectar, eds S. W. Nicolson, M. Nepi, and E. Pacini (Dordrecht: Springer), 215–264.
Otto, C. R., Roth, C. L., Carlson, B. L., and Smart, M. D. (2016). Land-use change reduces habitat suitability for supporting managed honey bee colonies in the Northern Great Plains. Proc. Nat. Acad. Sci. U. S. A. 113, 10430–10435. doi: 10.1073/pnas.1603481113
Pacini, E. N. M. V. J., Nepi, M., and Vesprini, J. L. (2003). Nectar biodiversity: a short review. Plant Syst. Evol. 238, 7–21. doi: 10.1007/s00606-002-0277-y
Pyke, G. H. (1991). What does it cost a plant to produce floral nectar? Nature 350, 58–59. doi: 10.1038/350058a0
Requier, F., Odoux, J. F., Tamic, T., Moreau, N., Henry, M., Decourtye, A., et al. (2015). Honey bee diet in intensive farmland habitats reveals an unexpectedly high flower richness and a major role of weeds. Ecol. Appl. 25, 881–890. doi: 10.1890/14-1011.1
Richardson, R. T., Curtis, H. R., Matcham, E. G., Lin, C. H., Suresh, S., Sponsler, D. B., et al. (2019). Quantitative multi-locus metabarcoding and waggle dance interpretation reveal honey bee spring foraging patterns in Midwest agroecosystems. Mol. Ecol. 28, 686–697. doi: 10.1111/mec.14975
Richardson, R. T., Lin, C. H., Sponsler, D. B., Quijia, J. O., Goodell, K., and Johnson, R. M. (2015). Application of ITS2 metabarcoding to determine the provenance of pollen collected by honey bees in an agroecosystem. Appl. Plant Sci. 3, 1400066. doi: 10.3732/apps.1400066
Richardson, R. T., Sponsler, D. B., McMinn-Sauder, H., and Johnson, R. M. (2020). MetaCurator: a hidden Markov model-based toolkit for extracting and curating sequences from taxonomically-informative genetic markers. Methods Ecol. Evol. 11, 181–186. doi: 10.1111/2041-210X.13314
Robbins, P., and Sharp, J. T. (2003). Producing and consuming chemicals: the moral economy of the American lawn. Econ. Geogr. 79, 425–451. doi: 10.1111/j.1944-8287.2003.tb00222.x
Roubik, D. W., and Buchmann, S. L. (1984). Nectar selection by Melipona and Apis mellifera (Hymenoptera: Apidae) and the ecology of nectar intake by bee colonies in a tropical forest. Oecologia 61, 1–10. doi: 10.1007/BF00379082
Ruedenauer, F. A., Biewer, N. W., Nebauer, C. A., Scheiner, M., Spaethe, J., and Leonhardt, S. D. (2021). Honey bees can taste amino and fatty acids in pollen, but not sterols. Front. Ecol. Evol. 9, 404. doi: 10.3389/fevo.2021.684175
Severson, D. W., and Parry, J. E. (1981). A chronology of pollen collection by honeybees. J. Apic. Res. 20, 97–103. doi: 10.1080/00218839.1981.11100480
Somme, L., Vanderplanck, M., Michez, D., Lombaerde, I., Moerman, R., Wathelet, B., et al. (2015). Pollen and nectar quality drive the major and minor floral choices of bumble bees. Apidologie 46, 92–106. doi: 10.1007/s13592-014-0307-0
Sommerville, D. C. (2001). Nutritional Value of Bee Collected Pollens. A Report for the Rural Industries Research and Development Corporation, Publication No. 01/047; Project No. DAN-134A. NSW Agriculture Goulburn, NSW Kustry, 57–58.
Sponsler, D. B., Shump, D., Richardson, R. T., and Grozinger, C. M. (2020). Characterizing the floral resources of a North American metropolis using a honey bee foraging assay. Ecosphere 11, e03102. doi: 10.1002/ecs2.3102
T'ai, H. R., and Cane, J. H. (2000). Pollen nutritional content and digestibility for animals. Pollen Pollin. 187–209. doi: 10.1007/978-3-7091-6306-1_10
Tew, N. E., Memmott, J., Vaughan, I. P., Bird, S., Stone, G. N., Potts, S. G., et al. (2021). Quantifying nectar production by flowering plants in urban and rural landscapes. J. Ecol. 109, 1747–1757. doi: 10.1111/1365-2745.13598
USDA National Agricultural Statistics Service (2020). CropScape - Cropland Data Layer. Available online at: https://nassgeodata.gmu.edu/CropScape/ (accessed March 06, 2020).
Veach, V., Moilanen, A., and Di Minin, E. (2017). Threats from urban expansion, agricultural transformation and forest loss on global conservation priority areas. PLoS ONE 12, e0188397. doi: 10.1371/journal.pone.0188397
Visscher, P. K., and Seeley, T. D. (1982). Foraging strategy of honeybee colonies in a temperate deciduous forest. Ecology 63, 1790–1801. doi: 10.2307/1940121
Waller, G. D. (1972). Evaluating responses of honey bees to sugar solutions using an artificial-flower feeder. Ann. Entomol. Soc. Am. 65, 857–862. doi: 10.1093/aesa/65.4.857
Wickham, H., Chang, W., and Wickham, M. H. (2016). Package ‘ggplot2'. Create Elegant Data Visualisations Using the Grammar of Graphics. Version 2, 1–189. Available online at: https://github.com/tidyverse/ggplot2
Wratten, S. D., Gillespie, M., Decourtye, A., Mader, E., and Desneux, N. (2012). Pollinator habitat enhancement: benefits to other ecosystem services. Agric. Ecosyst. Environ. 159, 112–122. doi: 10.1016/j.agee.2012.06.020
Keywords: Apis mellifera, DNA metabarcoding, weight monitoring, spring, pollen, nectar
Citation: McMinn-Sauder H, Lin C-H, Eaton T and Johnson R (2022) A Comparison of Springtime Pollen and Nectar Foraging in Honey Bees Kept in Urban and Agricultural Environments. Front. Sustain. Food Syst. 6:825137. doi: 10.3389/fsufs.2022.825137
Received: 30 November 2021; Accepted: 11 February 2022;
Published: 10 March 2022.
Edited by:
Kimberly Ann Stoner, Connecticut Agricultural Experiment Station, United StatesReviewed by:
Karen Leanne Bell, University of Western Australia, AustraliaMark J. Carroll, USDA-ARS, United States
Copyright © 2022 McMinn-Sauder, Lin, Eaton and Johnson. This is an open-access article distributed under the terms of the Creative Commons Attribution License (CC BY). The use, distribution or reproduction in other forums is permitted, provided the original author(s) and the copyright owner(s) are credited and that the original publication in this journal is cited, in accordance with accepted academic practice. No use, distribution or reproduction is permitted which does not comply with these terms.
*Correspondence: Harper McMinn-Sauder, mcminn-sauder.1@osu.edu