Concentration and Release of Phosphorus and Potassium From Lignocellulosic- and Manure-Based Biochars for Fertilizer Reuse
 Jeffrey M. Novak
 Mark G. Johnson2
  Kurt A. Spokas
- 1Coastal Plains Research Center, Agricultural Research Service, United States Department of Agriculture, Florence, SC, United States
- 2National Health and Environmental Effects Research Laboratory, United States Environmental Protection Agency, Corvallis, OR, United States
- 3Soil & Water Management Research Unit, Agriculture Research Service, United States Department of Agriculture, St. Paul, MN, United States
Biochars pyrolyzed from plant residues and animal manure feedstocks may contain disproportionate amounts of phosphorus (P) and potassium (K). Unequal nutrient characteristics can impact the biochars ability to properly supply as well as improve soil P and K fertility levels. A soil incubation study was performed to test the hypotheses that biochar produced from poultry litter will release more water soluble dissolved P (DP) and K (DK) concentrations and would also increase soil plant available P and K concentrations as compared to lignocellulosic-based biochars. Biochar was pyrolyzed at 500°C from hardwood waste products (HW), pine chips (PC; Pinus taeda), poultry litter (PL; Gallus domestics), and an 80:20 pine chip/poultry litter blend, which were then added at 20 g kg−1 to a sandy Norfolk E soil (Typic Kandiudult). Un-amended (no biochar) Norfolk E soil served as a control. During the incubation, all treatments were leached four times with deionized water and the leachate analyzed for DP and DK; their concentration and mass released as a function of total amounts present were then calculated. At the conclusion of the study, soils were extracted using Mehlich-1 reagent for determination of plant-available P and K contents. Leachates from soil amended with 100% PL biochar and the 80:20 blend had significantly more DP and DK mass (59 and 1,018 mg, respectively) released compared to PC and hardwood biochars (0.07 and 23 mg). Significant amounts of DP were released from PL biochar with additional water leaching, but DK release results were mixed. Soil Mehlich-1 P and K contents were significantly increased using PL biochar compared to lignocellulosic-based biochars. Blending PC with PL feedstocks at 80:20 weight ratio reduced Mehlich-1 soil P concentrations to 35 mg kg−1, which was more aligned with soil test P levels (30–50 mg kg−1) recommended for a corn (Zea mays) production in southeastern USA Coastal Plain sandy soils. These results reveal that 100% PL biochar offers a higher potential to provide more P and K to soils than lignocellulosic based biochars, and that feedstock blends can be used to create designer biochars that align soil test fertilizer values with plant nutrient requirements.
Introduction
Pyrolysis of organic feedstocks produces thermal energy, bio-oil, and a solid-product called biochar (Antal and Gronli, 2003). Many types of organic feedstocks are suitable materials to produce biochars, including-animal manures, wood waste compounds, green-wastes, and other plant-based materials (Bridgewater, 2003; Laird et al., 2009; Sohi et al., 2009; Boateng et al., 2015). The structural components of biochar have been well-characterized and are reported to consist of aromatic and non-aromatic organic compounds (Antal and Gronli, 2003; Jindo et al., 2014), and an ash fraction containing an assemblage of inorganic elements (e.g., Ca, Mg, P, K etc.; Novak et al., 2009; Cantrell et al., 2012; Ippolito et al., 2015). Consequently, they are acknowledged as viable soil amendments to increase C sequestration (Day et al., 2004; Brassard et al., 2016; Smith, 2016; Lamb et al., 2018), crop yields (Jeffery et al., 2011), and fertility characteristics (Novak et al., 2009; Spokas et al., 2012; Bargmann et al., 2013).
A concern with the use of biochar as a soil fertility amendment, however, are vast differences in their plant nutrient composition (Cantrell et al., 2012; Novak et al., 2013; Domingues et al., 2017). For example, biochars produced from hardwoods (HW) and softwoods generally have lower concentrations of total P (TP) and total K (TK) as compared to animal-manure based biochars, such as poultry litter (PL, Cantrell et al., 2012; Novak et al., 2013). In these reports, PL biochar pyrolyzed at 700°C had 42.8 and 86.6 g kg−1 of TP and TK contents, respectively, as compared to 0.28 and 2.7 g kg−1 contained in pine chip (PC) biochar. The greater TP and TK concentrations in PL biochar was attributed to un-assimilated nutrients in the excreted animal manure (Novak and Busscher, 2012).
Besides examining TP and TK contents among biochar types, plant available P and K concentrations have also been reported (Ippolito et al., 2015). In this reference, the authors reported that available P contents in biochars produced from hardwoods and softwoods ranged from 25 to 200 mg kg−1 respectively, and 240–1,400 mg kg−1 for animal manure biochars. Additionally, available K was much higher in biochar produced from animal manures (>13,000 mg kg−1) compared to lignocellulosic-based biochars (10–1,620 mg kg−1). Thus, the capability of biochar to recycle P and K back into soil is partially dependent on feedstock selection.
For biochar to make a viable contribution to the soil P and K nutrient pools, these nutrients need to be released into soil solution for plant uptake, and should bolster extractable soil P and K concentrations in ranges suitable for crop production. In this regard, several studies have investigated P release dynamics from biochar itself (Angst and Sohi, 2013; Morales et al., 2013; Domingues et al., 2017) and from biochar mixed with soil (Morales et al., 2013; Parvage et al., 2013; Wang et al., 2015; Zhai et al., 2015; Li et al., 2017). In these studies, variable amounts of water soluble P were released from biochars or from soil + biochars mixtures.
Plant available P concentrations after applying biochar to soils have been reported. Zhai et al. (2015) reported an increase in Olsen extractable P from 3 to 46 and 13 to 137 mg kg−1 after a straw-derived biochar was applied (at 8% w w−1) into two soils from China. Li et al. (2017) recently reported a recovery of between 21 and 29% of the applied P content using resin (plant available) placed into three Danish soils after mixing with PL biochar.
There are a few recent reports of K released from biochars and from biochar-treated soils. Angst and Sohi (2013) sequentially extracted a wood-based biochar using deionized water, reporting an initial large concentration release followed by a decline (cumulative extraction of 3,500–4,000 mg kg−1) after 6 sequential extractions. Widowati and Asnah (2014) applied 30 t ha−1 of biochar produced from plant material wastes to soil. They reported an increase of 69–89% in (NH4OAc extractable) K which contributed to a 14% increase in maize production relative to a KCl control. Limwikran et al. (2018) assessed K releases from Thailand soils after incubation with 9 biochar types that were produced from shells, food-processing wastes and wood wastes. They reported dramatic differences in water-soluble K (8–64%) amounts released into soil following biochar applications. Unfortunately, these researchers did not include manure-based biochars to compare K release dynamics against the lignocellulosic-based biochars.
While the above reports are promising, the overall release dynamics of DP and DK from lignocellulosic- and manure-based biochars alone and after biochars are mixed with soil is still under question (Angst and Sohi, 2013; Gul and Whalen, 2016; Zhang et al., 2016). This lack of clear information confounds biochar selection, production, and application conditions for their predictable use as a soil fertility amendment and further raises doubt if the added biochar can improve crop yields in all soils (Jeffery et al., 2011; Spokas et al., 2012; Bierderman and Harpole, 2013; Laird et al., 2017). Moreover, the initial feedstock concentration used to produce the biochar does not provide a reliable measure of a biochar's nutrient value in crop production because DP and DK releases are also depended on soil biotic and abiotic processes that influence nutrient solubilization, precipitation, and other sequestration reaction (Joseph et al., 2010; Angst and Sohi, 2013).
We assert that a more direct assessment of a biochars potential to increase P and K releases into the soil nutrient pool would be to expose biochar to soil for a long period of time (>100 d), periodically leach the system with water, and assess their concentrations in the leachates. In turn, P and K associated with the biochars are exposed to mineral weathering reactions at the surface and in pore spaces potentially resulting in their dissolution and release. Moreover, the additional incubation time would influence P and K release equilibrium reactions because of exposure to other microbial (e.g., nutrient mineralization, assimilation, etc.) as well as other chemical mechanisms (i.e., precipitation, binding by organic ligands, etc.) that can counter their bioavailability. Finally, the soil + biochar mixture can be extracted to assess if the biochar has raised soil nutrient concentrations to approach agronomic plant sufficiency levels (Jones, 2003).
Review of the literature exposes the dearth in reports concerning a comparison of DP and DK releases between biochar types (manure- vs. lignocellulosic-based feedstocks) and then quantifying the potential changes in plant extractable P and K concentrations. For this study, our hypotheses were that poultry litter-based biochar after incubation in an acidic, sandy-textured soil would release more DP and DK into water leachates, which concomitantly would also increase soil plant available P and K concentrations relative to soil treated with lignocellulosic-based biochars. Therefore, our objectives were to: (i) determine the quantity of DK and DP released in water leachates from several biochar types after incubation in a highly weathered, sandy-textured soil; and (ii) extract the biochar treated and untreated soils for plant available P and K to determine their impact on supplying nutrients for typical corn production in Southeastern USA Coastal Plain soils.
Materials and Methods
Site Description and Soil Characterization
Soil from a Norfolk E horizon was collected from a farm field located in the Middle Coastal Plain region in South Carolina, USA. The USDA Taxonomic classification for the Norfolk soil series is a Fine-loamy, kaolinitic, thermic Typic Kandiudult. Background soil chemical characteristics are presented in Table 1. Soil collection details, site location, past crop and tillage management, along with chemical and physical characteristics are given elsewhere (Novak et al., 2016). Briefly, the parent material of the Norfolk soil series is extremely weathered marine sediment following several millions of years of pedogenesis (Daniels et al., 1999). Particle size determination on this E horizon revealed that it is a sandy loam texture consisting of 71% sand, 24% silt and 5% clay. The site where the soil was collected has a mean annual precipitation of 1200-mm and a mean annual air temperature of 17.4C. This extreme weathering environment has resulted in low soil organic carbon contents (<<1 g kg−1), loss of base cations resulting in an acidic soil pH (5.4), and low fertility characteristics (Novak et al., 2016).
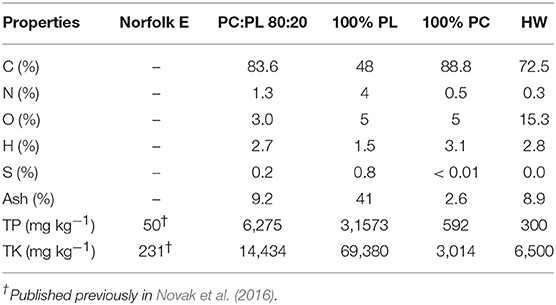
Table 1. Selected chemical properties of Norfolk E soil and biochars (% on a dry weight basis; PC, pine chip; PL, poultry litter; HW, hardwood; TP, total phosphorus; and TK, total potassium).
Biochar Preparation and Characterization
Biochar pellets were produced from 100% PC (Pinus taeda) and 100% ground PL (Gallus domestics) using a 6.4-mm dye plate, and then sieved to acquire > 2-mm sized material. The pellets were then pyrolyzed at 500°C as described in Novak et al. (2016). The pyrolyzed pellets were re-sieved, using a 2-mm sieve, to ensure that any pellets broken down during pyrolysis were removed. Because the 100% PL biochar contained a high TP content (Table 1), a blended pellet was made consisting of an 80:20 w w−1 ratio of PC:PL feedstock. This blending ratio was found to better align the expected Mehlich P released into soil after biochar application with the recommended agronomic Mehlich extractable P contents for row crops in southeastern USA coastal plain soils (30–50 mg kg−1, Novak et al., 2014). Pellet production for the HW biochar was poor because of the predominance of “dust-like size” material (75% by weight of material < 0.25 mm in diameter) that did not bind together when pressed. Thus, it was used “as received” in this experiment.
The biochars ash, C, N, O, H, and S contents were measured on an oven-dried basis by Hazen Research, Inc. (Golden, Colorado) following ASTM D 3172 and 3176 standard methods (ASTM American Society for testing and materials, 2006). The TP and TK contents of each biochar were determined using the USEPA 3052 digestion method (US EPA, 1996), and then quantified with inductively coupled plasma optical emission spectroscopy (ICP-OES; Novak et al., 2009).
Scanning electron microscopy (SEM) images of two biochar samples (the blend and HW) were collected to show differences in surface morphology. The images were taken using a SEM (JEOL 6500; Tokyo, Japan) at the University of Minnesota-Surface Characterization Laboratory (Figures 1A,B). Meanwhile, SEM images from a 100% PL biochar pellet (Cantrell et al., 2014; Sigua et al., 2016), and for a 100% PC biochar pellet (Novak et al., 2015) were reported previously. Furthermore, P and K associated with both the 100% PL and 100% PC biochars were confirmed using energy dispersive spectroscopy analysis (see EDS scans in Novak et al., 2015; Sigua et al., 2016). After characterization, all biochars were stored in vacuum-sealed plastic bags to prevent exposure to atmospheric conditions until used in the soil column leaching experiment.
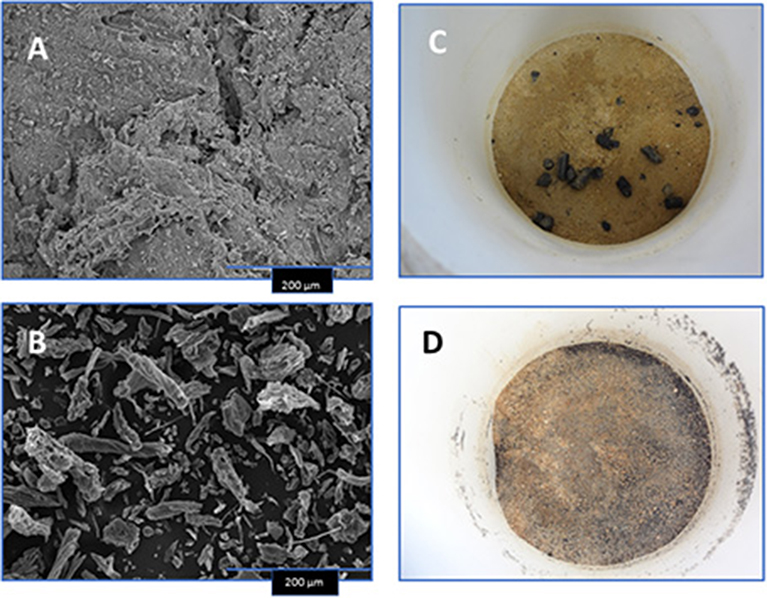
Figure 1. Scanning electron microscopic images of select biochars [80:20 pine chip:poultry litter blend (A) and hardwood (B)], and photos depicting their placement into Norfolk E soil and settlement for water leaching (C,D).
Soil Column Leaching for DP and DK Releases
The treatments (n = 5) for the DP and DK release study consisted of 2-mm sieved Norfolk E horizon soil mixed with: (a) no biochar (control); (b) 100% PC biochar pellets; (c) 100% PL biochar pellets; (d) the 80:20 PC:PL blend biochar pellet, and (e) mixed with the HW biochar. Twenty g kg−1 (w w−1) of biochar were added to the Norfolk E soil and sufficient deionized water was added to bring their soil moisture contents to 10% (w w−1) on a soil-dry basis. These treatments were mixed into soil and the placed into plastic PVC columns (16 cm height x 10 cm diameter (Figures 1C,D). Plastic mesh screening was placed on the bottom of each column to retain soil. Each column was then mildly tapped to obtain a bulk density of about 1.5 g cm−1. The % pore space for each column was determined using Equation 1 (Troeh and Thompson, 2005)
The total soil volume in each column was then calculated and multiplied by the % pore space to determine each columns pore volume (PV). The pore volume was used to fix the volume of leaching water needed to ensure that pores were flushed thoroughly. A value of 1.3 PV (≈ 285 mL) was assumed to adequately solubilize P and K salts, while also dislodging any entrapped DP and DK from surfaces, crevices, and pore spaces. In comparison, 1.3 PV of leaching water represented a rainfall event of approximately 40-mm.
The columns were arranged in a randomized design consisting of n = 4 replicates per treatment on a laboratory bench and were incubated for a total of 150 d. Their soil moisture contents were maintained at 10% which is the upper moisture content range for this soil at field capacity (Novak et al., 2009). Thus, the total column weights were monitored and sufficient deionized water was added when needed. On incubation days 32, 67, 95, and 128, the columns were placed on a wooden rack and leached with 1.3-PV of deionized water. Column leachate was collected until free drainage had ceased and their total volume measured. Afterwards, the bottle was shaken, and a 100-mL aliquot was removed for initial filtration using 0.7 μm GF/G Whatman™, (Buckinghamshire, UK) filter paper to remove sediments. Next, a 5-mL aliquot from the 0.7 μm filtered sample was re-filtered using 0.45 μm nylon syringe filter (Environmental Express, Charleston, SC, USA) and their DP and DK concentrations quantified using ICP-OES as described in Novak et al. (2016).
After the final leaching event on day 128, the columns were air-dried for a few weeks. On day 150, the soil was physically removed by gently tapping the column. Next, subsamples of each soil were oven-dried (105C), and samples extracted using the double-acid Mehlich 1 reagent (HCl + H2SO4; Jones, 2001), and plant available P and K concentrations quantified using ICP-OES. The plant available P and K concentrations were then calculated on a mg kg−1 soil basis.
Statistics
The mass weights for DP and DK per leaching event was calculated by multiplying the total leachate volume with their respective concentrations. Next, the corrected cumulative mass of DP and DK was summed for each biochar treatment after correcting for DP and DK in soil alone and significant mean differences between treatments and by individual leaching events were determined using a 2-way ANOVA. In this 2-way ANOVA, the statistical factors were leaching number (L), biochar treatment, and their interaction. To distinguish the magnitude of DP and DK mass losses from sources, the % DP released was calculated on a TP content in the Norfolk E soil + biochar system, and then based on the TP content on a biochar alone basis. A 1-way ANOVA was used to compare the mean cumulative DP and DK released on both bases. A 1-way ANOVA was also used to compare plant extractable M1 P and M1 K contents between the Norfolk E soil treated with the different biochars. All statistical analyses were determined using Sigma Stat v. 11 (SSPS Corp., Chicago, IL, USA) at a P < 0.05 level of significance.
Results
Chemical Characteristics of Biochars and Soil
The two SEM images demonstrate differences in the size of biochar material and surface roughness of the 80:20 PC:PL blend and the HW biochar (Figures 1A,B). The blended biochar appears to have polygonal-shaped material on surfaces, while the HW biochar is smaller in diameter and lacking polygonal-shaped material. After the pelleted and dust size biochars were mixed into the Norfolk E soil they were then incubated in the soil columns (Figures 1C,D).
As shown in Table 1, the untreated Norfolk E soil has TP and TK contents of 50 and 231 mg/kg, respectively. In contrast, all biochars had greater TP and TK contents relative to the Norfolk E soil. In fact, the highest TP and TK contents occurred in the 100% PL biochar followed by the PC:PL 80:20 blend. The TP and TK contents in the 100% PC and hardwood biochar were much lower relative to the other two biochars. The quantity of C, H, O, N, and S varied greatly among these four biochars. The highest ash contents occurred in the 100% PL biochar (41%; Table 1) with the remaining biochar having values < 10%.
P and K Mass Release
Dissolved P
Relatively little DP was solubilized from the control soil (no biochar added) with each leaching event (L1 to L4; Table 2); only a cumulative mean mass of 0.06 mg DP was released. In contrast, significant amounts of DP were released per leaching event from the soil treated with 100% PL biochar; this treatment produced the highest cumulative DP released (59.32 mg). For each leaching event, this treatment also had the most significant DP mass releases among the four treatments. Blending the PL with PC feedstock resulted in almost an 80% reduction in DP released relative to samples from the 100% PL treatment. It is interesting that the cumulative DP loss (8.55 mg) from the 80:20 PC:PL blend is close to the theoretical 11.86 mg (20% of 59.32 mg) released from the 100% PL biochar. Meanwhile, DP masses released from soil treated with 100% PC and the HW biochar were similar to the control. Overall, the 2-way ANOVA for DP released revealed highly significant (P < 0.01; Table 2) impacts of leaching event, biochar treatment, and their interaction as well.
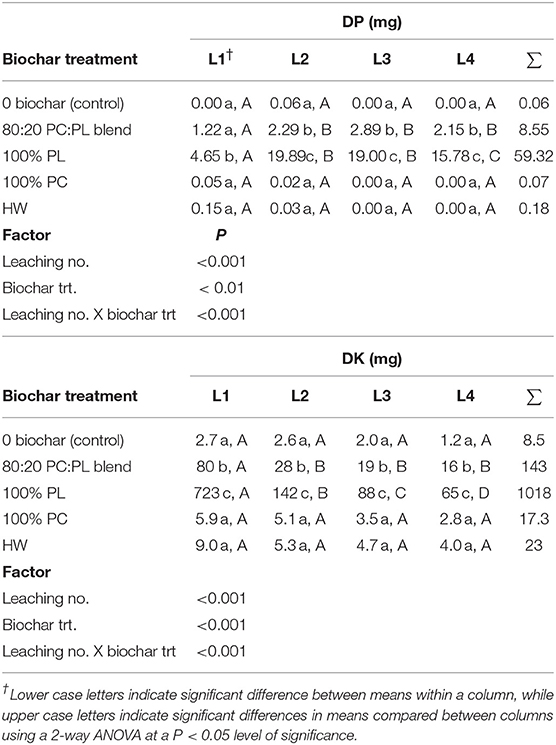
Table 2. Mean dissolved phosphorus (DP) and potassium (DK) masses released after four water leaching events (L) from Norfolk E soil treated with 20 g kg−1 biochar (n = 4; PC, pine chip; PL, poultry litter; and HW, hardwood).
Dissolved K
The control soil, 100% PC and the HW biochar treated soils all released similar DK masses between the 4 leaching events (Table 2). Among the treatments, the greatest DK releases occurred from soil treated with 100% PL resulting in the greatest cumulative total release (1,018 mg). In this treatment, the greatest DK mass was released after L1 (723 mg) followed by a significant decline in mass values between L2 and L4. The next highest cumulative DK release occurred from soil treated with the 80:20 PC:PL blend. Here, there was an initial rapid release (L1, 80 mg), subsequently followed by statistically similar mass releases thereafter (L2 to L4). In the PL:PC blended biochar, there was a significant reduction in the mean DK mass released when leaching events were compared to the 100% PL biochar. In fact, blending of PC into the PL resulted in a 7-fold reduction in cumulative DK released. For DK released, leaching number, biochar treatment, and their interaction were also highly significant (P < 0.001).
Estimated DP and DK Losses on a System and Biochar Alone Basis
Calculating cumulative DP and DK mass balance releases on a system (soil + biochar) and biochar alone basis provides testimony for the large differences in their P and K recycling capabilities (Table 3). On a soil + biochar basis, there were no significant differences in DP released between the control soil and when the soil was treated with 100% PC or HW biochar. In these three treatments, there was approximately 0.0001% of the TP mass released as DP. Whereas, mixing in 100% PL biochar into the Norfolk E soil resulted in a significant increase to 0.11% of the total P released as DP.
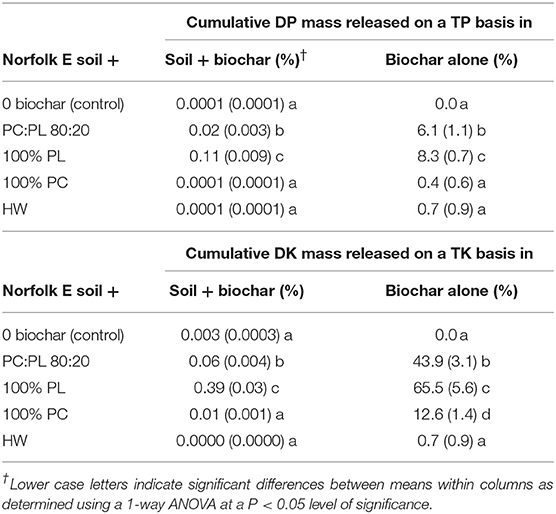
Table 3. Means of cumulative masses of dissolved phosphorus (DP) and potassium (DK) released in leachates calculated on a percentage of Total P (TP) and Total K (TK) in a soil + biochar system and on a biochar alone basis (n = 4; standard deviation in parentheses; PC, pine chip; PL, poultry litter; and HW, hardwood).
On a biochar alone basis, a significantly higher percentage of DP was released from the 100% PL biochar and the 80:20 PC:PL blend (Table 3; 8.3 and 6.1%, respectively) compared to the other three treatments. Cumulative DP mass releases on a biochar alone basis were <1% of the TP content from the 100% PC and HW biochar treated soil.
On a soil + biochar system basis, a significant mass of DK was released from soil treated with 100% PL (0.39% of the TK pool; Table 3). After adding in the 80:20 PC:PL blend, there was a significant reduction in % DK on a soil + biochar basis. In comparison, there were no significant differences in % DK released on a soil + biochar basis between soil treated the control, with 100% PC, and with HW biochar.
On a biochar alone basis, the 100% PL released 65% of DK from the TK pool (Table 3). Blending the PL with PC caused a significant reduction in cumulative % DK released, but still almost 44% by weight of DK was released from the TK pool. A lower % of DK was released from the 100% PC biochar, but the cumulative percentage released was significantly different than the control and the HW biochar.
Plant Extractable P and K in Biochar-Treated Soils
The control Norfolk E soil has Mehlich 1 P and K concentrations that were < 4 and 19 mg kg−1, respectively (Table 4). However, supplementing the Norfolk E soil with 20 g kg−1 of 100% PL and 80:20 PC:PL blended biochars caused significant increases in the M1 P and M1 K concentrations. Adding 100% PC and hardwood biochar to soil at the same application rate produced no significant improvement in M1 P concentrations. In fact, the mean M1 P concentrations in these two treatments were similar to the mean value in the control soil. Treating soil with 100% PC biochar did not significantly increase the M1 K concentration, however, treatment with the hardwood biochar did cause a significant M1 K concentration increase. Adding the hardwood biochar to the Norfolk E soil at 20 g kg−1 resulted in a tripling of the M1 K concentration relative to the control.
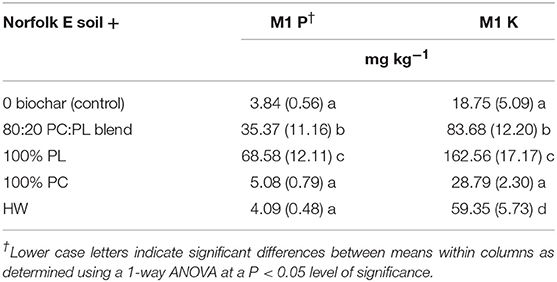
Table 4. Mean Mehlich 1 (M1) extractable phosphorus (P) and potassium (K) contents measured at end of study in Norfolk E soil after treatment with 2% biochar (n = 4; standard deviation in parentheses; PC, pine chip; PL, poultry litter; and HW, hardwood).
Discussion
Composition of the Biochars
The biochars employed in this study corroborate other reports concerning the vast P and K compositional differences between manure- and lignocellulosic-based biochars (Spokas et al., 2012; Ippolito et al., 2015). Here we report that a manure-based biochar (100% PL) had higher TP and TK contents than lignocellulosic-based biochars. In terms of using these biochars to recycle P and K, the 100% PL biochar contains between 10 and 23 times the TK content and 53–105 times the TP content of the lignocellulosic-based biochars (Table 1). Their TP and TK content differences clearly show the recycling gains and losses of using either a manure-based biochar against lignocellulosic-based biochar-types in a nutrient recycling program.
From an agronomic perspective, blending the 100% PL feedstock with 100% PC material, a ratio of 80:20 illustrates the utility of producing designer biochars that have lower total TP and TK contents. In fact, as shown in Table 1, this blended biochar had its TP and TK contents reduced by 1/5 relative to the 100% PL feedstock. Blending feedstocks offers the utility of designing a biochar that can theoretically supply different amounts of nutrients to soils (Novak et al., 2014). This approach was subsequently reported to have a positive impact on wheat yields grown on poor quality soils (Sigua et al., 2016). Moreover, blending feedstocks with different moisture contents is reported to reduce thermal energy requirements for dewatering feedstocks during the pyrolysis process (Ro et al., 2010).
Release of Dissolved P and K
As reported by Angst and Sohi (2013), just because a feedstock contains a high content of a critical plant nutrients doesn't guarantee that these nutrients will be available to plants. The authors reported that nutrient releases from biochars may be limited due to binding with insoluble salts, inaccessibility of nutrients to water, microbial processes, and pore hindrances from physical microstructural properties (i.e., pore size, pore connectivity, etc.). As a test to these conditions, we incubated different biochar types in soil with anticipation that P and K release dynamics may be impacted by exposure to weathering reactions, and after leaching with water, would impact their chemical form and physical location. These conditions should create the potential to better assess each biochars DP and DK release capability.
The biggest take away from the results characteristic is the magnitude of DP and DK released from 100% PL biochar. Moreover, soil treated with 100% PL biochar continued to release DP and DK with successive water leaching. Although the amount of release significantly declined by L4, there was still significant DP and DK mass releases relative to the other four treatments. This can be explained considering that the P and K in the 100% PL biochar was associated with salts that differed in their water solubility (Ksp). This is consistent with reports using EDS characterization of the polygonal-shaped material on 100% PL biochar that showed it possessed soluble salts composed of KNO3, KCl, and Ca3(PO4)2 (Novak et al., 2015; Sigua et al., 2016). Both KNO3 and KCl are highly water-soluble salts, so K ion would be readily released into the water leachate. In contrast, release of P from Ca3(PO4)2 would be much slower since it has a lower water solubility constant (Ksp = 1 x10⁻²⁵ mol L−1; Handbook of Chemistry Physics, 1981). Water solubility differences between materials holding P and K would account for the noted mass release differences per leaching event (Table 2). This is a credible explanation considering that the 100% PL feedstock used to produce the 80:20 PC:PL blend is similar to the PL characterized in the Novak et al. (2015) and Sigua et al. (2016) studies.
The presence of water soluble salts would explain the ability of 100% PL and the 80:20 PC:PL blend to release such significantly greater amounts of DP and DK on a biochar alone basis (Table 3). Minimal releases of DP and DK occurred from soil treated with the lignocellulosic-based biochars probably because of their relatively lower TP and TK contents (Table 1) and that the P and K are likely bound in structural forms that are not accessible to solubilization reaction with water.
Improvements in Soil Nutrient Levels Using These Biochars
A convenient method to determine the impact of biochar on soil fertility levels is to extract the biochar treated soil using an extractant solution specific for plant macro- or micro-nutrients held in soils. For Southeastern USA coastal plain soils, the common extractants for P and K are either Mehlich 1 or Mehlich 3 reagent (Sims, 1989). The double acid Mehlich 1 reagent was selected for this experiment because Mehlich 3's chemical formulation is more specific for plant micro-nutrient extraction (Mylavarapu et al., 2002). After soil is extracted and the P and K quantified, the next step involves comparing the extractable P and K concentrations to indices that have been calibrated against actual crop yields in field agronomic trials. These indices define whether Mehlich 1 extractable nutrient levels are satisfactory or unsatisfactory for optimal crop yields for soils in that geographic region. For corn grown in sandy soils in the Southeastern USA, medium and high indice values established for Mehlich 1 extractable P are 16 to 30 and 31 to 60 mg kg−1, respectively (Mitchell and Mylavarapu, 2014). From the same reference, the medium and high critical indices for Mehlich 1 K are 36–78 and 79–117 mg kg−1, respectively.
Extracting the control soil for plant available M1 P and K concentrations (Table 4, 2.84 and 18.75 mg kg−1, respectively) showed that their values are far below the medium indices. This is a typical subsoil fertility characteristic of extensively weathered sandy-textured Ultisols in the Southeastern USA coastal plain region (Davis et al., 1996; Mitchell and Huluka, 2016). A soil fertility goal for row crop production in these sandy soils is to increase M1 P and M1 K contents to be in the medium to high range using either biochar or commercial fertilizer. Here additions of 20 g kg−1 (equivalent to 40 t ha−1) of the lignocellulosic-based biochars failed to significantly increase M1 P concentrations, which attests to their poor ability to supply plant available P to the Norfolk E soil. While the HW biochar increased M1 K levels to be in the medium index level, the 100% PC biochar failed to meet this fertility goal. It can be argued that these are poor biochar types for improving plant nutrient fertility levels, but would better serve at increasing soil C sequestration (Novak et al., 2009). In contrast, the 100% PL and the blend were shown to have a significant impact with raising the M1 P and M 1 K fertility levels. In fact, applying these two biochar types elevated the M1 K and M1 P concentrations to rank in the high index category.
In this study, we tested the hypotheses that biochar produced from PL will release more DP and DK amounts, which would subsequently increase soil plant available P and K concentrations as compared to lignocellulosic-based biochars. Our results support these hypotheses because biochars were shown to have different abilities to release DP and DK amounts which consequently impacted their ability to improve plant available P and K contents. While no plants were grown in this experiment, using 100% PL biochar served as a better soil fertility amendment to increase plant available P and K as compared to lignocellulosic biochar types. If blanket applied across a field, biochars at this high application rate (20 g kg−1 basis or 40 t ha−1) would be too expensive for practical financial management. However, if biochars are locally applied near plant stems (i.e., side dressing, banding, etc.) the more prudent biochar selection would be a 100% manure-based or a manure + lignocellulosic-based biochar to supplement plant available P and K soil levels. This also assumes that commercial fertilizer would serve as the main source of P and K for crop production.
Author Contributions
JN, MJ, and KS designed, performed the experiments, and composed the manuscript.
Funding
This work was completed through an Interagency Agreement between the United States Department of Agriculture-Agricultural Research Service (Mode code/log number 6657-15-00 0045161) and the US EPA (DW-12-92342301-2). It has been subject to peer review by scientists of the United States Department of Agriculture-Agricultural Research Service (USDA-ARS) at multiple locations and by the National Health and Environment Effects Research Laboratory's Western Ecology Division and approved for journal submission. Approval does not signify that the contents reflect the views of the USDA-ARS or the US EPA, nor does mention of trade names or commercial products constitute endorsement or recommendation for their use. The USDA is an equal opportunity employer.
Conflict of Interest Statement
The authors declare that the research was conducted in the absence of any commercial or financial relationships that could be construed as a potential conflict of interest.
Acknowledgments
Gratitude is expressed to the ARS-support staff for their diligent laboratory work.
References
Angst, T. E., and Sohi, S. P. (2013). Establishing release dynamics for plant nutrients from biochar. GCB Bioenergy 5, 221–226. doi: 10.1111/gcbb.12023
Antal, M. J., and Gronli, M. (2003). The Art, science, and technology of charcoal production. Ind. Eng. Chem. Res. 42, 1619–1640. doi: 10.1021/ie0207919
ASTM American Society for testing and materials. (2006). Petroleum Products, Lubricants and Fossil Fuels: Coal and Coke. ASTM International, West Conshohocken, PA.
Bargmann, R., Rillig, M. C., Kruse, A., and Kuecke, M. (2013). Hydrochar and biochar effects on germination of spring barley. J. Agron. Crop Sci. 199, 360–737. doi: 10.1111/jac.12024
Bierderman, L. A., and Harpole, W. S. (2013). Biochar and its effects on plant productivity and nutrient cycling: a meta-analysis. GCB Bioenergy 5, 2002–2014. doi: 10.1111/gcbb.12037
Boateng, A. A., Garcia-Perez, M., Masek, M., Brown, R., and del Campo, B. (2015). “Biochar production technology,” in Biochar for Environmental Management: Science, Technology, and Implementation, 2nd Edn, eds J. Lehmann and S. Joseph (London; New York, NY: Routledge), 64–87.
Brassard, P., Godbout, S., and Raghavan, V. (2016). Soil biochar amendment as a climate change mitigation tool: Key parameters and mechanisms involved. J. Environ. Manage. 181, 484–497. doi: 10.1016/j.jenvman.2016.06.063
Bridgewater, A. V. (2003). Renewable fuels and chemicals by thermal processing of biomass. Chem. Eng. J. 91, 87–102. doi: 10.1016/s1385-8947(02)00142-0
Cantrell, K. B., Hunt, P. G., Uchimiya, M., Novak, J. M., and Ro, K. S. (2012). Impact of pyrolysis temperature and manure source on physicochemical characteristics of biochar. Bioresour. Technol. 107, 419–428. doi: 10.1016/j.biortech.2011.11.084
Cantrell, K. B., Martin, J. H. II., and Novak, J. M. (2014). Poultry litter and switchgrass blending for biochar production. Trans. ASABE 57, 543–553. doi: 10.13031/trans.57.10284
Daniels, R. B., Buol, S. W., Kleiss, H. J., and Ditzler, C. A. (1999). Soil systems in North Carolina. North Carolina State University, Raleigh, NC.
Davis, J. G., Walker, M. E., Parker, M. B., and Mullinix, B. (1996). Long-term phosphorus and potassium application to corn on coastal plain soils. J. Prod. Agric. 9, 88–84.
Day, D., Evans, R. J., Lee, J. W., and Reicosky, D. (2004). Valuable and stable coproducts from fossil fuel exhaust scrubbing. Amer. Chem. Soc. Div. Fuel Chem. 49, 352−355.
Domingues, R. R., Trugilho, P. F., Silva, C. A., del Melo, I. C., Melo, L. C., Magriotis, Z. M., et al. (2017). Properties of biochar derived from wood and high-nutrient biomass with the aim of agronomic and environmental benefits. PLoS ONE 12:e0176884. doi: 10.1371/journal.pone.0176884
Gul, S., and Whalen, J. K. (2016). Biochemical cycling of nitrogen and phosphorus in biochar-amended sols. Soil Biol. Biochem. 103, 1–15. doi: 10.1016/j.soilbio.2016.08.001
Handbook of Chemistry and Physics. (1981). Handbook of Chemistry and Physics, 62nd Edn. Boca Raton, FL: CRC Press.
Ippolito, J. A., Spokas, K. A., Novak, J. M., Lentz, R. D., and Cantrell, K. B. (2015). “Biochar elemental composition and factors influencing nutrient retention,” in Biochar for Environmental Management: Science, Technology, and Implementation, 2nd Edn., eds J. Lehmann, and S. Joseph (London; New York, NY: Routledge), 139–163.
Jeffery, S., Verheijen, F. A., van der Velde, M., and Bastos, A. C. (2011). A quantitative review of the effects of biochar application to soils on crop productivity using meta analysis. Agric. Ecosyst. Environ. 144, 175–187. doi: 10.1016/j.agee.2011.08.015
Jindo, K., Mizumoto, H., Sawada, Y., Sanchez-Monedero, M. A., and Sonoki, T. (2014). Physical and chemical characterization of biochars derived from different agricultural residues. Biogeosciences 11, 6613–6621. doi: 10.5194/bg-11-6613-2014
Jones, J. B. Jr. (2001). Laboratory Guide for Conducting Soil Tests and Plant Analysis. Boca Raton, FL: CRC Press, 1–363.
Joseph, S. D., Camps-Arbestain, M., Lin, Y., Munroe, P., Chia, C. H., Hook, J., et al. (2010). An investigation into the reactions of biochar in soils. Aust. J. Soil Res. 48, 501–515. doi: 10.1071/SR10009
Laird, D. A., Brown, R. C., Amonette, J. E., and Lehmann, J. (2009). Review of the pyrolysis platform for coproducing bio-oil and biochar. Biofuels Bioprod. Bioref. 3, 547–562. doi: 10.1002/bbb.169
Laird, D. A., Novak, J. M., Collins, H. P., Ippolito, J. A., Karlen, D. L., Lentz, R. D., et al. (2017). Multi-year and multi-location soil quality and crop biomass yield responses to hardwood fast pyrolysis biochar. Geoderma 289, 46–53. doi: 10.1016/j.geoderma.2016.11.025
Lamb, M. C., Sorensen, R. B., and Butts, C. L. (2018). Crop response to biochar under differing irrigation levels in the southeastern USA. J. Crop Improv. 21, 1–13. doi: 10.1080/15427528.2018.1425791
Li, X., Rubæk, G. H., Müller-Stöver, D. S., Thomsen, T. P., Ahrenfeldt, J., and Sorensen, P. (2017). Plant availability of phosphorus in five five gasification biochars. Front. Sustain. Food Syst. 1, 1–12. doi: 10.3389/fsufs.2017.00002
Limwikran, T., Kheoruenromne, I., Suddhiprakarn, A., Prakongkep, N., and Gilkes, R. J. (2018). Dissolution of K, Ca, and P from biochars in tropical soils. Geoderma 312, 139–150. doi: 10.1016/j.geoderma.2017.10.022
Mitchell, C. C., and Mylavarapu, R. (2014). “Soil test correlation and calibration for recommendations,” in Soil Test Methods from the Southeastern United States, eds F. J. Sikora, and K. P. Moore (Lexington, KY: Southern Cooperative Series Bulletin), 11–18.
Mitchell, G. C., and Huluka, G. (2016). Potassium dynamics in US Coastal plain soils. Comm. Soil Sci. Plant Anal. 47, 54–63. doi: 10.1080/00103624.2016.1232096
Morales, M. M., Comerford, N., Guerrini, I. A., Falcao, N. P., and Reeves, J. B. (2013). Sorption and desorption of phosphate on biochar and biochar-soil mixtures. Soil Use Manage. 29, 1–9. doi: 10.1111/sum.12047
Mylavarapu, R. S., Sanchez, J. F., Nguyen, J. H., and Bartos, J. M. (2002). Evaluation of Mehlich-1 and Mehlich-3 extraction procedures for plant nutrients in acid mineral soils of Florida. Comm. Soil Sci. Plant Anal. 33, 807–820. doi: 10.1081/CSS-120003067
Novak, J. M., and Busscher, W. J. (2012). “Selection and use of designer biochars to improve characteristics of southeastern USA coastal plain degraded soil,” in Advanced Biofuels and Bioproducts, Vol. 1, ed J. W. Lee (New York, NY: Springer), 69–96.
Novak, J. M., Busscher, W. J., Laird, D. L., Ahmedna, M., Watts, D. W., and Niandou, M. A. S. (2009). Impact of biochar on fertility of a southeastern coastal plain soil. Soil Sci. 174, 105–112. doi: 10.1097/ss.0b013e3181981d9a
Novak, J. M., Cantrell, K. B., and Watts, D. W. (2013). Compositional and thermal evaluation of lignocellulosic and poultry litter chars via high and low temperature pyrolysis. Bioenerg. Res. 6, 114–130. doi: 10.1007/s12155-012-9228-9
Novak, J. M., Cantrell, K. B., Watts, D. W., Busscher, W. J., and Johnson, M. G. (2014). Designing relevant biochars as soil amendments using lignocellulosic-based and manure-based feedstocks. J. Soil Sed. 14, 330–343. doi: 10.1007/s11368-013-0680-8
Novak, J. M., Sigua, G., Watts, D., Cantrell, K., Shumaker, P., Szogi, A., et al. (2016). Biochars impact on water infiltration and water quality through a compacted subsoil layer. Chemosphere 142, 160–167. doi: 10.1016/j.chemosphere.2015.06.038
Novak, J. M., Sigua, G. C., Spokas, K. A., Busscher, W. J., Cantrell, K. B., Watts, D. W., et al. (2015). Plant macro- and micronutrients dynamics in a biochar-amended wetland muck. Water Air Soil Pollut. 226:2228. doi: 10.1007/s11270-014-2228-y
Parvage, M. M., Ulén, B., Eriksson, J., Strock, J., and Kirchmann, H. (2013). Phosphorus availability in soils amended with wheat residue char. Biol. Fert. Soils 49, 245–250. doi: 10.1007/s00374-012-0746-6
Ro, K. S., Cantrell, K. B., and Hunt, P. G. (2010). High-temperature pyrolysis of blended animal manures for producing renewable energy and value-added biochar. Ind. Eng. Chem. Res. 49, 10125–10131. doi: 10.1021/ie101155m
Sigua, G. C., Novak, J. M., Watts, D. W., Johnson, M. G., and Spokas, K. (2016). Efficacies of designer biochars in improving biomass and nutrient uptake of winter wheat grown in a hard setting subsoil layer. Chemosphere 142, 176–183. doi: 10.1016/j.chemosphere.2015.06.015
Sims, J. T. (1989). Comparison of Mehlich 1 and Mehlich 3 extractants for P, K, Ca, Mg, Mn, and Zn in atlantic coastal plain soils. Comm. Soil Sci. Plant Anal. 20, 1707–1726. doi: 10.1080/00103628909368178
Smith, P. (2016). Soil carbon sequestration and biochar as negative emission technologies. GCB Bioenerg. 22, 1315–1324. doi: 10.1111/gcb.13178
Sohi, S., Loez-Capel, E., Krull, E., and Bol, R. (2009). Biochar's Roles in Soil and Climate Change; A Review of Research Needs. CSIRO Land and Water Science Report. Glen Osmond, SA.
Spokas, K. A., Cantrell, K. B., Novak, J. M., Archer, D. W., Ippolito, J. A., Collins, H. P., et al. (2012). Biochar: a synthesis of its agronomic impact beyond carbon sequestration. J. Environ. Qual. 41, 973–989. doi: 10.2134/jeq2011.0069
Troeh, F. R., and Thompson, L. M. (2005). Soils and Soil Fertility, 6th Edn. Ames, IA: Blackwell Publishing.
US EPA, (1996). SW-846 Test Method 3052: Microwave Assisted Acid Digestion of Siliceous and Organically Based Matrices. Available online at: http://www.epa.gov/osw/hazard/testmethods/sw846/pdfs/3052.pdf)
Wang, Y., Lin, Y., Chiu, P. C., Imhoff, P. T., and Guo, M. (2015). Phosphorus release behaviors of poultry litter biochar as a soil amendment. Sci. Total Environ. 512–513, 454–463. doi: 10.1016/j.scitotenv.2015.01.093
Widowati, W., and Asnah, A. (2014). Biochar can enhance potassium fertilization efficiency and economic feasibility of maize cultivation. J. Agric. Sci. 6, 24–32. doi: 10.5539/jas.v6n2p24
Zhai, L., Caiji, Z., Liu, J., Wang, H. Y., Ren, T., Gai, X., et al. (2015). Short-term effects of maize residue biochar on phosphorus availability on two two soils with different phosphorus sorption capacities. Biol. Fert. Soils 51, 113–122. doi: 10.1007/s00374-014-0954-3
Keywords: biochar, fertilizer, manure, phosphorus, plant, potassium
Citation: Novak JM, Johnson MG and Spokas KA (2018) Concentration and Release of Phosphorus and Potassium From Lignocellulosic- and Manure-Based Biochars for Fertilizer Reuse. Front. Sustain. Food Syst. 2:54. doi: 10.3389/fsufs.2018.00054
Received: 18 May 2018; Accepted: 10 August 2018;
Published: 11 September 2018.
Edited by:
Airton Kunz, Embrapa Suínos e Aves, BrazilReviewed by:
Witold Kwapinski, University of Limerick, IrelandPaolo Mantovi, Centro Ricerche Produzioni Animali, Italy
Copyright © 2018 Novak, Johnson and Spokas. This is an open-access article distributed under the terms of the Creative Commons Attribution License (CC BY). The use, distribution or reproduction in other forums is permitted, provided the original author(s) and the copyright owner(s) are credited and that the original publication in this journal is cited, in accordance with accepted academic practice. No use, distribution or reproduction is permitted which does not comply with these terms.
*Correspondence: Jeffrey M. Novak, jeff.novak@ars.usda.gov