 Niron Sukumar
 Priyadharshini Sabesan1
 Udunna Anazodo
 Lena Palaniyappan
- 1Department of Psychiatry, University of Western Ontario, London, ON, Canada
- 2Lawson Health Research Institute, London, ON, Canada
- 3Department of Medical Biophysics, Western University, London, ON, Canada
- 4Robarts Research Institute, University of Western Ontario, London, ON, Canada
The use of modern neuroimaging approaches has demonstrated resting-state regional cerebral blood flow (rCBF) to be tightly coupled to resting cerebral glucose metabolism (rCMRglu) in healthy brains. In schizophrenia, several lines of evidence point toward aberrant neurovascular coupling, especially in the prefrontal regions. To investigate this, we used Signed Differential Mapping to undertake a voxel-based bimodal meta-analysis examining the relationship between rCBF and rCMRglu in schizophrenia, as measured by arterial spin labeling (ASL) and 18Flurodeoxyglucose positron emission tomography (FDG-PET) respectively. We used 19 studies comprised of data from 557 patients and 584 controls. Our results suggest that several key regions implicated in the pathophysiology of schizophrenia such as the frontoinsular cortex, dorsal ACC, putamen, and temporal pole show conjoint metabolic and perfusion abnormalities in patients. In contrast, discordance between metabolism and perfusion were seen in superior frontal gyrus and cerebellum, indicating that factors contributing to neurovascular uncoupling (e.g. inflammation, mitochondrial dysfunction, oxidative stress) are likely operates at these loci. Studies enrolling patients on high doses of antipsychotics had showed larger rCBF/rCMRglu effects in patients in the left dorsal striatum. Hybrid ASL-PET studies focusing on these regions could confirm our proposition regarding neurovascular uncoupling at superior frontal gyrus in schizophrenia.
Introduction
Since the time of Ernst von Feuchtersleben who coined the term psychosis in 1845 (1), psychotic disorders have been suspected to be associated with disturbances in the cerebral blood supply. This has been thoroughly investigated through the use of modern neuroimaging techniques, which have uncovered abnormalities in the resting-state regional cerebral blood flow (rCBF) across various brain regions in schizophrenia. The frontal lobe, anterior cingulate cortex, temporal lobe and occipital lobe, among others, are regions that have been showed to differ with respect to rCBF in patients compared to healthy subjects (2). In healthy brains, rCBF is tightly coupled to resting cerebral glucose metabolism (rCMRglu), which increases with synaptic activity. This coupling, also known as functional hyperemia, is accomplished by the coordinated activity of a group of cells (comprised of astrocytes, endothelial cells, and neurons) called the neurovascular unit. These cells detect changes in synaptic activity, and initiate vasodilation or vasoconstriction responses to accommodate for the resultant changes in rCMRglu (3).
Two imaging modalities that have been very useful in studies investigating rCBF and rCMRglu in patients are arterial spin labeling (ASL), and positron emission tomography (PET). ASL is a relatively recent neuroimaging modality that was developed as a non-invasive analog to gadolinium contrast MRI for the measurement of rCBF. Instead of using a potentially toxic contrast to visualize blood flow, a radiofrequency pulse is applied at the neck region to magnetize blood water molecules flowing into the brain. This allows for the capturing of a “tagged” image in the area of interest by MRI. By quantitatively comparing the tagged image with a (non-RF pulse) control image, researchers can construct an accurate representation of cerebral blood flow (4). Likewise, an accurate representation of rCMRglu can be constructed using PET neuroimaging. PET is a functional imaging technique that uses a radioactive tracer to measure the regional activity of the biological molecule that the tracer is attached to. A common tracer is 18flurodeoxyglucose (FDG), and it is often employed in neuroimaging studies to measure the cerebral metabolic rate of glucose (5). ASL and FDG PET imaging have been used in various case-control studies to quantify case-control differences between patients with schizophrenia and healthy controls.
The vascular hypothesis of schizophrenia suggests that one of the underlying mechanisms of schizophrenia is the disruption of the appropriate rCBF response to changes in cerebral metabolic activity (6). In healthy brains, the integrity of the neurovascular unit is essential in maintaining functional hyperemia and ensuring that changes in rCBF are tightly and congruently coupled to changes in rCMRglu. Disruption of this coupling (low rCBF with high rCMRGlu) can lead to insufficient support for synaptic activity, triggering synaptic loss or promoting glia-mediated inflammatory response that can result in a cascade of further damage to the synaptic and neuronal homeostasis required for intact cerebral function (7). Neurovascular uncoupling can also impair oxygen metabolism, induce mitochondrial dysfunction and oxidative stress leading to neuronal death, and brain tissue atrophy (8).
Identifying regions where this uncoupling occurs is extremely important as the underlying mechanism and its pathophysiological relationship to schizophrenia can be studied in more detail. This has been done to some degree; uncoupling has been demonstrated to occur in patients with schizophrenia, especially in the prefrontal regions during task-related activities (9). However, no simultaneous ASL-PET studies identifying regions with concordance or discordance between metabolism and perfusion have been reported to our knowledge. To address this gap, we undertook a voxel-based bimodal meta-analysis to examine the relationship between rCBF and rCMRglu in schizophrenia. We hypothesized that several brain regions would show combined abnormalities of perfusion and metabolism, while uncoupling of these two parameters would be observed in prefrontal regions. The meta-analysis was performed using the anisotropic effect size version of seed-based d mapping (AES-SDM). AES-SDM is a software used to create meta-analytic maps of studies that use MNI or Talairach coordinates to denote brain regions of significant group differences, weighted by sample size, variance, and between-study heterogeneity. AES-SDM was also used to conduct meta-regression analyses to quantify the effect of nuisance variables such as age, gender, duration of illness, antipsychotic dosage, and illness severity on the heterogeneity of the findings. It is important to note that the absolute values of the outcome measures in various studies differ based on the quantification procedures employed in both ASL and PET studies. Our meta-analysis is based on effect-sizes of differences between two groups, rather than the absolute measurement metrics. As such, this study is an early probe to assess the likelihood of regions with neurovascular uncoupling in schizophrenia.
Methods
Search
Two literature searches were conducted across four databases (PubMed, PsycInfo, Scopus and Web of Science). The search terms “arterial,” “spin,” “labeling,” and “schizophrenia” yielded 83 results, and the terms “FDG,” “PET” and ‘schizophrenia’ yielded 201 results (after duplicates were removed). The following inclusion criteria was applied: Case control studies reporting voxelwise ASL or FDG-PET changes in patients with schizophrenia compared to healthy controls, using MNI or Talairach coordinates. Studies that met the inclusion criteria, but did not report all of the data required for the meta-analysis were not immediately excluded in the hope that a correspondence with the authors of these studies could be initiated to obtain the missing data. Studies that did not use ICD 10 or DSM IV/5 diagnostic criteria for schizophrenia or did not investigate the whole brain were excluded. Twenty-one ASL and eight PET papers remained after inclusion and exclusion criteria were applied to the search results. Of these, 12 papers did not report their data in a format that was compatible with our meta-analysis. We contacted the authors of these papers and were only able to obtain additional data from two studies (2, 10). Three of the papers we finally included in our meta-analyses (11–13), investigated schizophrenia binary subgroups (for example, catatonic and non-catatonic schizophrenia patients) compared to controls. The final meta-analyses thus used 16 datasets from 14 ASL papers (2, 10–12, 14–23) and 6 datasets from 5 PET papers (13, 24–27) to generate results. The literature search is summarized in the flowchart in Figure 1.
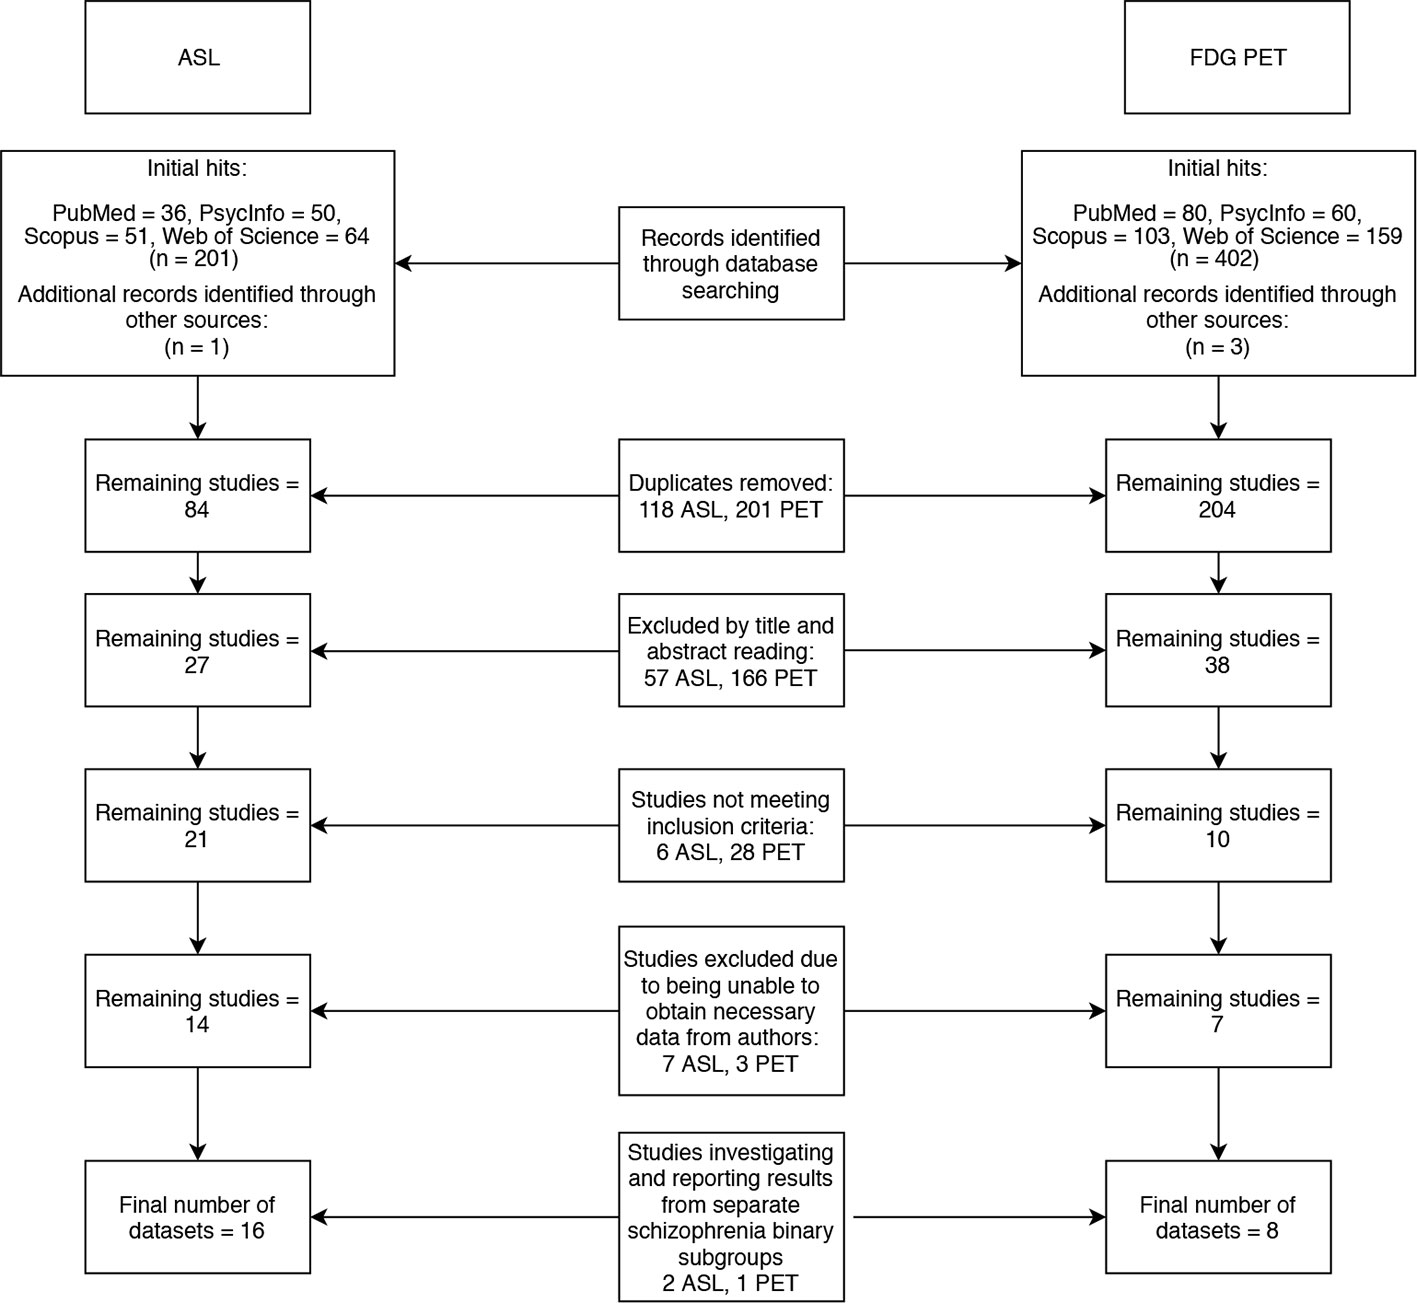
Figure 1 Flowchart of literature search.
ASL Study Quality
The methodological quality of the included studies was assessed by scoring four criteria encompassing all aspects of data collection and analysis which can confound the quality of the ASL data and subsequently bias the validity and reliability of the study inferences. The four criteria are: (1) participant selection, (2) image acquisition, (4) image preprocessing and analysis, and (5) statistical analysis techniques. The criteria for appropriate quality standards for image acquisition were based on the recommended implementations of ASL by the ISMRM Perfusion Group and the European ASL in Dementia (28). The minimum standard requirement for image acquisition were modified since 36% of the included ASL studies were completed 2–3 years after the recommended guidelines. Emphasis was placed on determining whether the included studies specified imaging parameters that impact the signal-to-noise in ASL images. ASL image quality increases as the signal-to-noise increases. The criteria were scored as either “adequate,” if all aspects of the criteria were reported and met minimum standard, or “inadequate,” if aspects of the criteria were missing or did not meet minimum standard, or “unclear,” if no clear conclusion could be drawn from the information provided. These criteria are further detailed in Table 1.
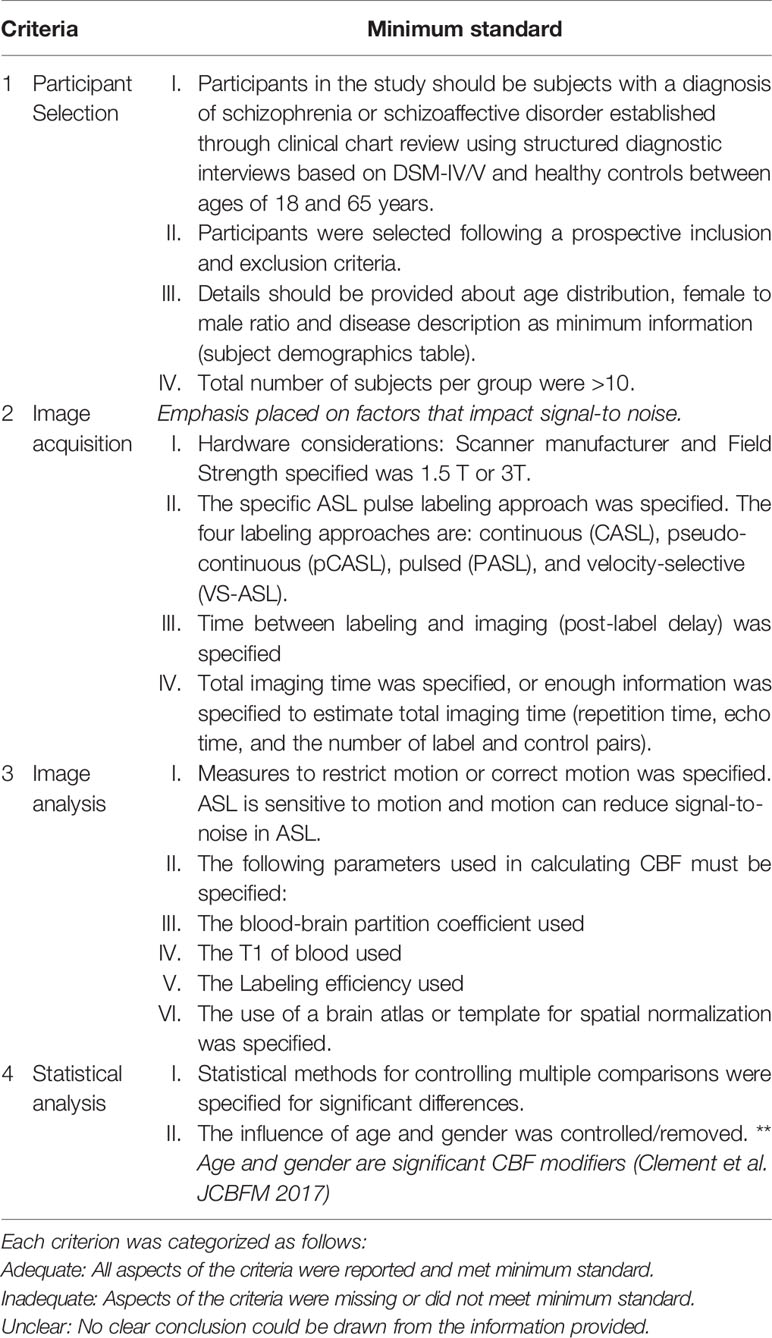
Table 1 Quality analysis tool for included arterial spin labeling (ASL) studies.
PET Study Quality
The methodological quality of the included studies was assessed by scoring five criteria encompassing all aspects of data collection and analysis which can confound the quality of the PET data and subsequently bias the validity and reliability of the study inferences. The five criteria are (1) participant selection, (2) participant preparation, (3) image acquisition, (4) image preprocessing and analysis, and (5) statistical analysis techniques. The criteria for appropriate quality standards for participant preparation and image acquisition were based on the SNMMI Procedure guideline for FDG PET Brain Imaging Version 1.0 (29). The criteria were scored as either “adequate,” if all aspects of the criteria were reported and met minimum standard, or “inadequate,” if aspects of the criteria were missing or did not meet minimum standard, or “unclear,” if no clear conclusion could be drawn from the information provided. These criteria are further detailed in Table 2.
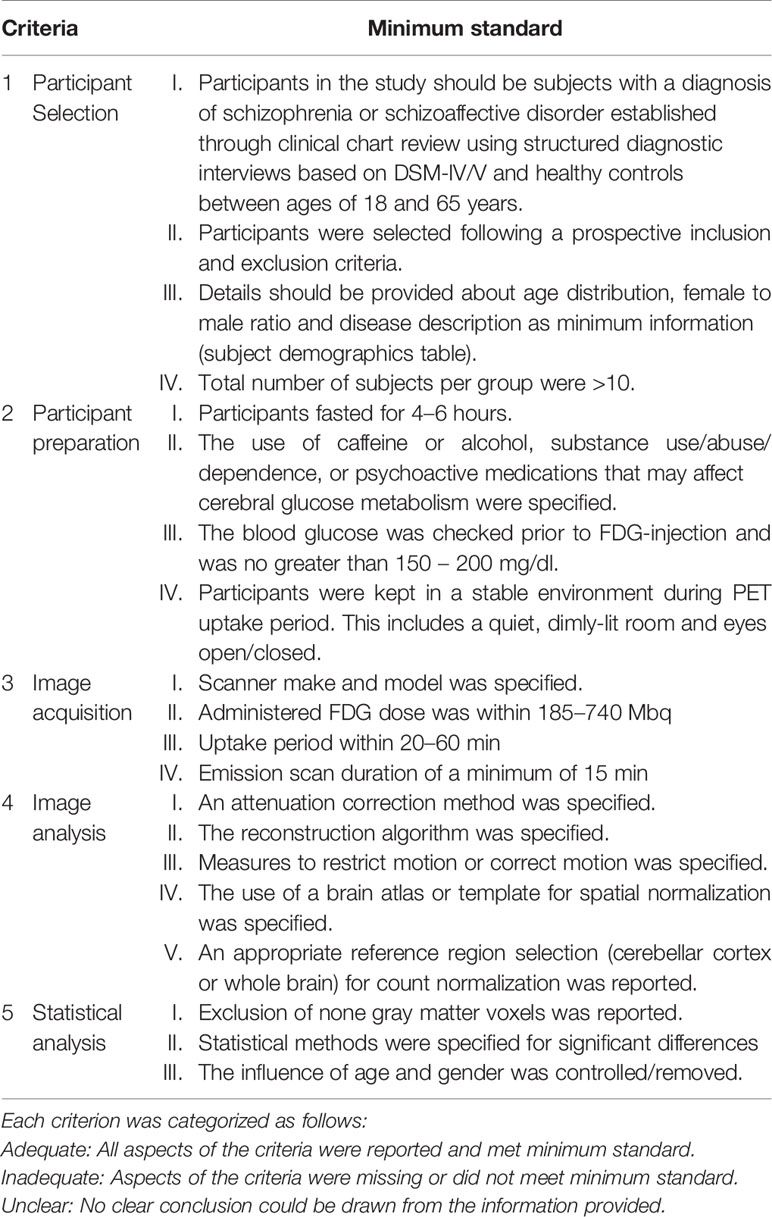
Table 2 Quality assessment tool for included positron emission tomography (PET) studies.
Mean Analysis
AES-SDM was used to generate a meta-analytic map for the compiled datasets, using permutation tests to determine statistical significance of results. As recommended by Radua et al., default SDM parameters were used (FWMH = 20mm, cluster extent = 10 voxels), but with a more conservative uncorrected p-value (P < 0.001 compared to P < 0.005) (30). We assessed the robustness of the results by assessing the residual heterogeneity, and by using a sensitivity analysis (jack-knife approach). This was done by repeating the meta-analysis multiple times, each time leaving out one of the studies that was originally included it. A score was given to each reported brain region corresponding to the number of times it was reported in the meta-analyses. In addition, we examined the peaks of maximum heterogeneity to check if they are driven by a small number of “outliers.” We also drew funnel plots for each peak voxel reported in the main analysis using the Bias Analysis option of the SDM (version 6.21) and statistically assessed for asymmetry in the funnel plot (using ‘metabias’ function of R (31)) and a test for publication bias favoring small studies with large effect sizes (based on (32), implemented via ‘MetaNSUE’ function of R (33)).
Conjunction Analysis of rCBF and rCMRglu Changes
We used multimodal analysis to identify which of the brain regions identified in our meta-analysis showed significant changes in both rCBF and rCMRglu. Our goal was not necessarily to demonstrate a physiological correlation between these measures, but rather to identify which of our results were supported by data from both ASL and PET imaging studies. As this was a four-tailed test (allowing for positive and negative results across two modalities), we used a conservative threshold of p<0.0025 for cluster inclusion and p<0.00025 (10-times more stringent) for peak identification, based on the minimum acceptable threshold for conjunction in each individual modality map as p<0.05. This method, described in detail by Radua et al. (34), has been used in various studies for bimodal conjunction meta-analysis (35–37). We used MRIcron software to generate visual representations of the findings.
Disjunction Analysis of rCBF and rCMRglu Changes
We used the meta-regression tool to identify which of the brain regions identified in our meta-analysis showed significant disjoint or “uncoupled” changes in rCBF and rCMRglu. We assigned a binary value to each study corresponding to the measure being investigated (rCBF - 0; rCMRglu - 1) and tested the slope (1m0) of the effect of the measure (ASL vs PET) on effect-sizes reported in the SDM. A significant positive regression value for a given brain region indicates an uncoupled increase in rCMRglu or an uncoupled decrease in rCBF, and a significant negative regression value indicates an uncoupled decrease in rCMRglu or an uncoupled increase in rCBF. In order to determine the appropriate case, each of the results of the regression analysis were cross-referenced to the brain regions identified by the primary meta-analysis. We used MRIcron software to generate visual representations of the findings.
Meta-Regression Analysis
We explored the influence of age, gender, duration of illness, PANSS positive, and negative symptom severity, and overall dose of antipsychotic medications (in chlorpromazine equivalents) on the reported effect-sizes. To reduce spurious relationships, in line with prior studies (36) we used a probability threshold of 0.0005, and tested the slope (1m0) (e.g. comparing effect sizes in studies with lowest vs. highest values of the predictor variable of interest), and restricted meta-regression to findings detected in the main analyses (38). We performed a separate meta-regression for each of the variables being investigated. We also visually inspected the regression plots from peak coordinates and discarded slopes driven by <5 studies (30).
Querying Functional Connectivity Differences
The peak coordinates of various regions of interest identified by the conjunction and disjunction analysis were used to determine the brain network connectivity of these regions. This was done using the Neurosynth functional connectivity meta-analytical database.
Results
Study Demographics
Our meta-analysis drew data from 22 datasets from 19 studies. In total, 557 patients with schizophrenia were compared to 584 healthy controls. Table 3 lists the demographic data for the participants in each study. Most studies published information regarding number of patients and healthy controls, patient gender distribution, patient age, duration of illness, antipsychotic dosage, syndrome severity, type of scan, and study quality. Almost all of the studies matched healthy controls to patients for at least age and gender, with some studies matching controls for other variables such as level of education. Duration of illness, antipsychotic dosage and PANSS scores ranged from 25.2 (SD 5.58) to 92.0 (SD 22) for ASL studies and from 33.8 (SD 5.3) to 84.7 (SD 23.6) for PET studies. With a few exceptions, all included ASL studies used a 3T scanner with a pCASL technique to obtain results and only included patients diagnosed with schizophrenia specifically. One study (14) used a pASL technique, one study (15) used a 1.5T MRI scanner and three studies (10, 16, 17), included individuals with schizoaffective disorder in their patient groups. All PET studies only included patients diagnosed with schizophrenia disorder specifically. The authors from studies with missing clinical information were contacted, and some of the unpublished data was retrieved for this review.
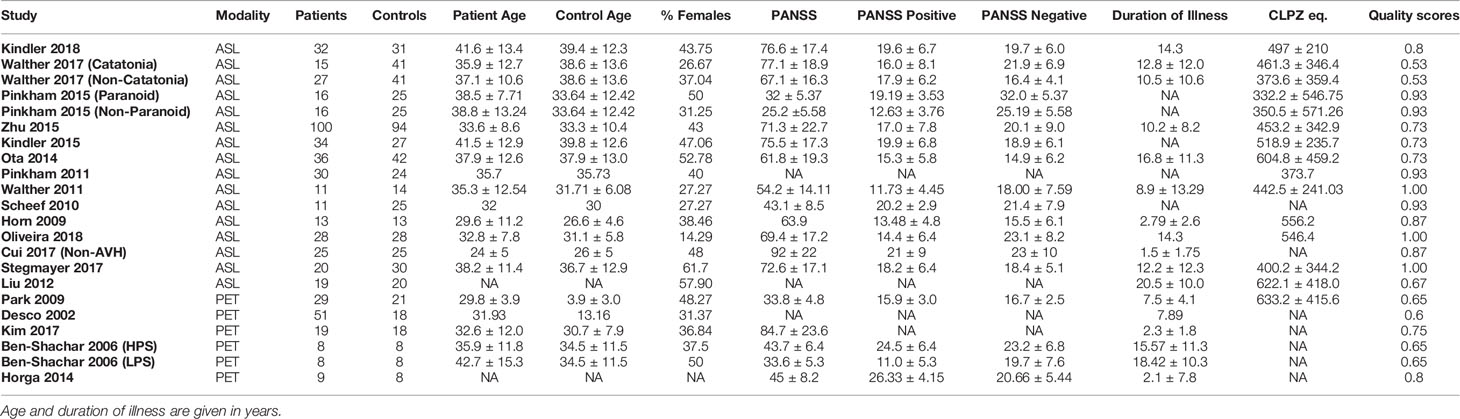
Table 3 Demographic table for datasets included in meta-analysis, as well as the quality scores for each study.
Study Quality
The average quality scores for the ASL and PET studies used in the meta-analysis were 0.84 and 0.69 respectively. Among the ASL studies, the lowest quality score was 0.53 (11) and among the PET studies the lowest quality score was 0.6 (13). The Quality Index Scores for these studies are visually represented in Figure 2.
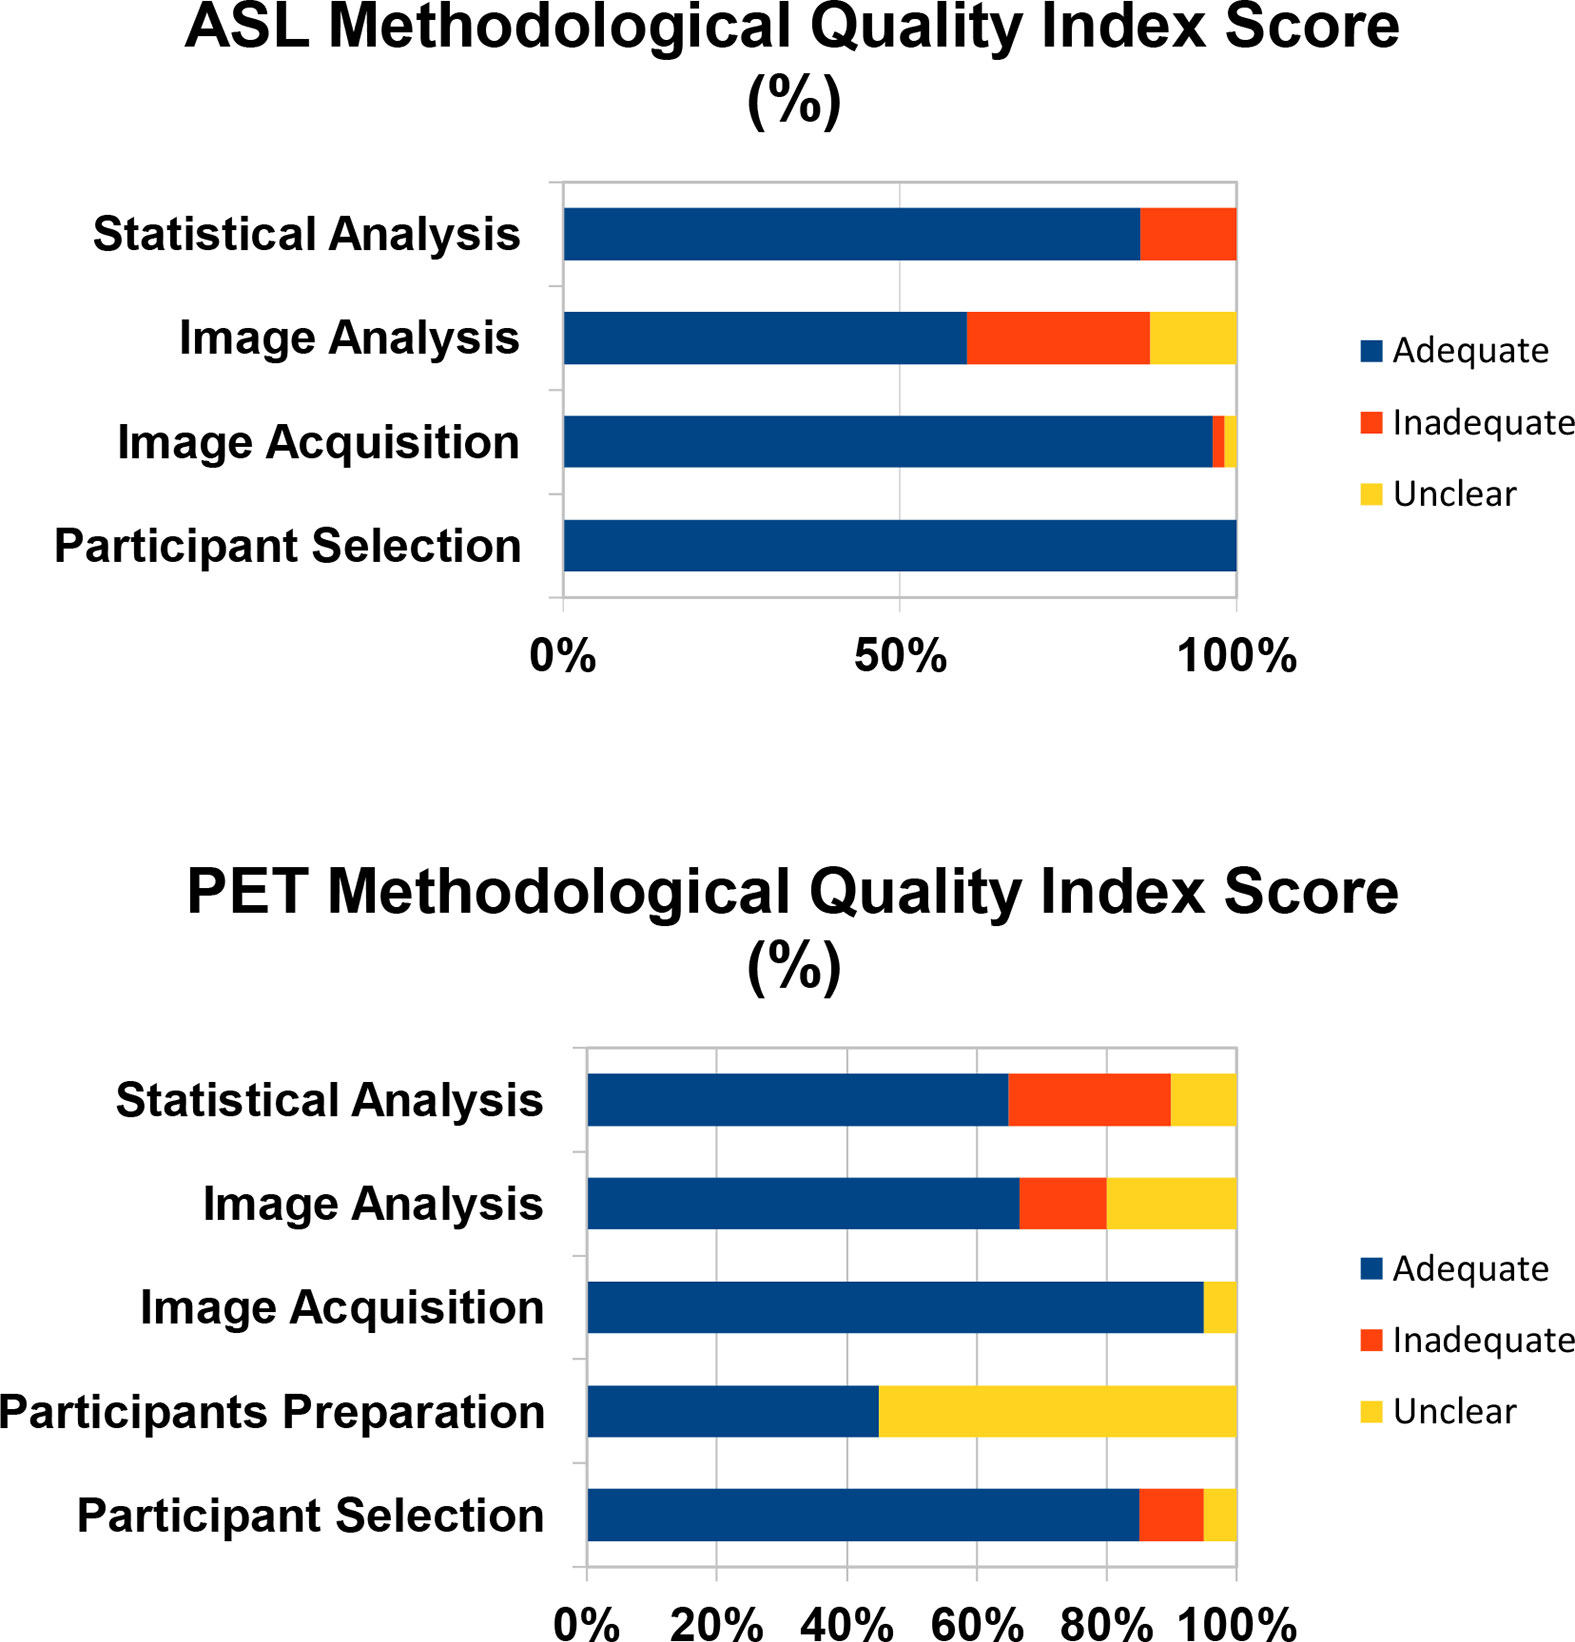
Figure 2 The Quality Index Score is the proportion of studies that are scored as adequate, inadequate, or unclear.
Mean Analysis
The SDM analysis showed several brain regions of significant difference in rCBF or rCMRglu between patients and healthy controls. These results are listed in Table 4. Patients had significantly increased neurological activity in the right lenticular nucleus, left striatum, right inferior temporal gyrus, left temporal pole, right thalamus, and corpus callosum. Patients had significantly reduced neurological activity in the right median cingulate, right middle occipital gyrus, left inferior frontal gyrus, left superior occipital gyrus, and right superior frontal gyrus. Other than the right superior frontal gyrus, which only survived 17 cross-validations, each of the other regions survived at least 21 cross-validations. None of the reported peaks had asymmetric funnel plot, or excess significance bias (Table 5). Moderate heterogeneity (I2>40%) was noted for left striatum, left temporal pole, right anterior thalamic projections, and left inferior frontal gyrus, while all other regions had low levels of heterogeneity.
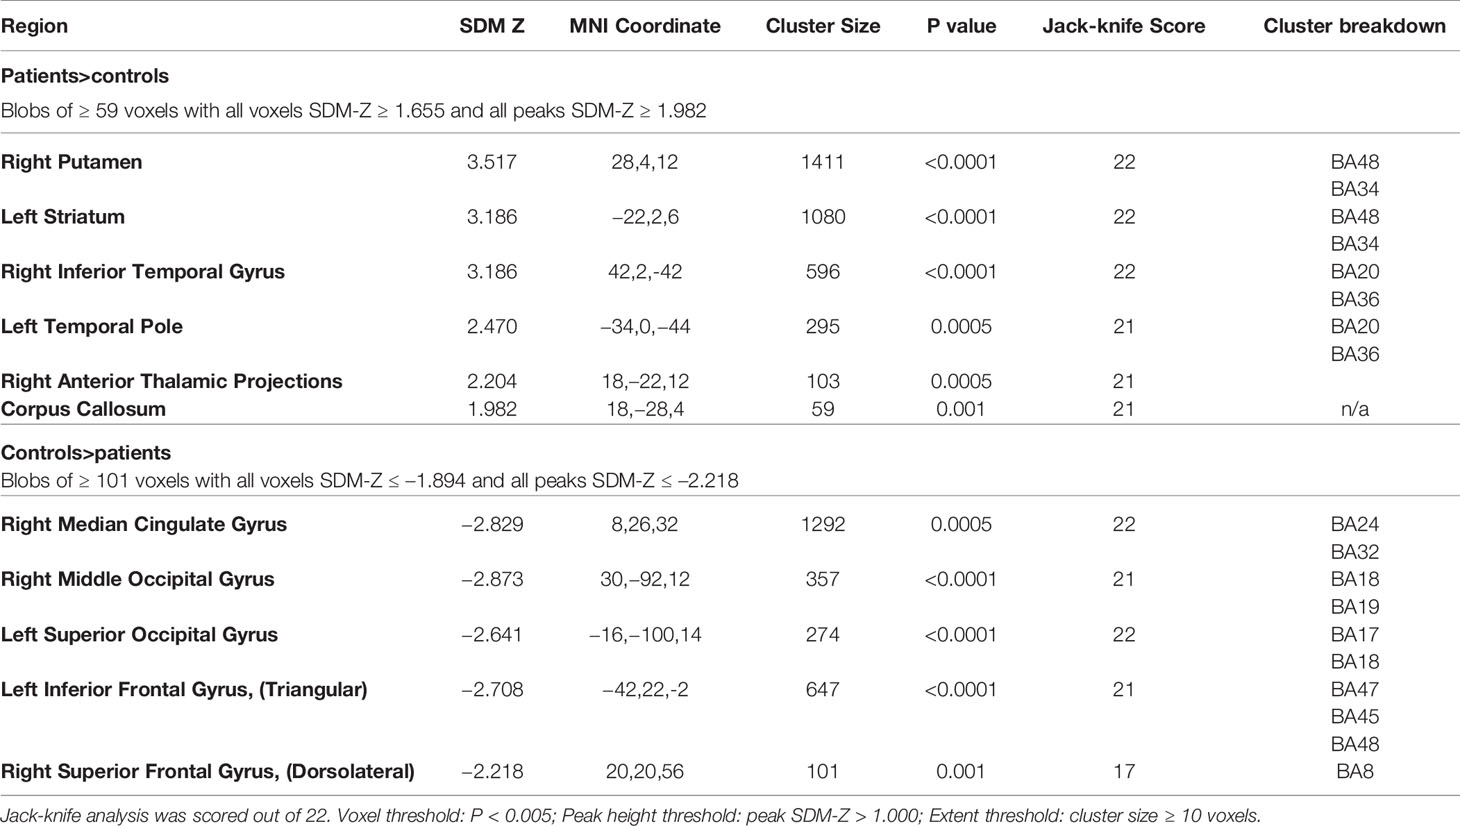
Table 4 Brain regions of significant difference in regional cerebral blood flow (rCBF) or resting cerebral glucose metabolism (rCMRglu) between patients with schizophrenia and controls.
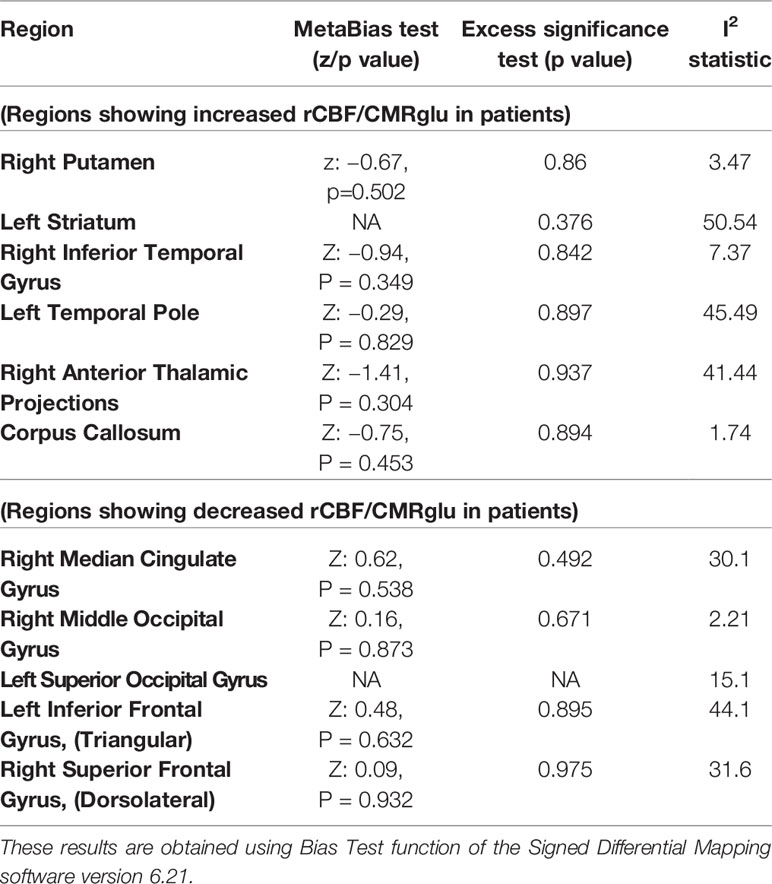
Table 5 Estimates of between-study heterogeneity and publication bias from peak regions of significant difference in regional cerebral blood flow (rCBF) or resting cerebral glucose metabolism (rCMRglu) between patients with schizophrenia and controls.
Conjunction and Disjunction Analyses of rCBF and rCMRglu Changes
Among patients with schizophrenia, we observed a conjoint reduction in rCBF and rCMRglu in the right median cingulate gyrus and left inferior frontal gyrus. A conjoint increase in rCBF and rCMRglu was noted in the right putamen and right inferior temporal gyrus. (Voxel probability threshold: p=0.0025, Peak height threshold: p=0.00025, Cluster extent threshold: 10 voxels). Regional neurovascular uncoupling was notable in the superior frontal gyrus (reduced rCMRglu, normal rCBF) and cerebellum (increased rCMRglu, normal rCBF). These regions are visually represented in Figure 3.
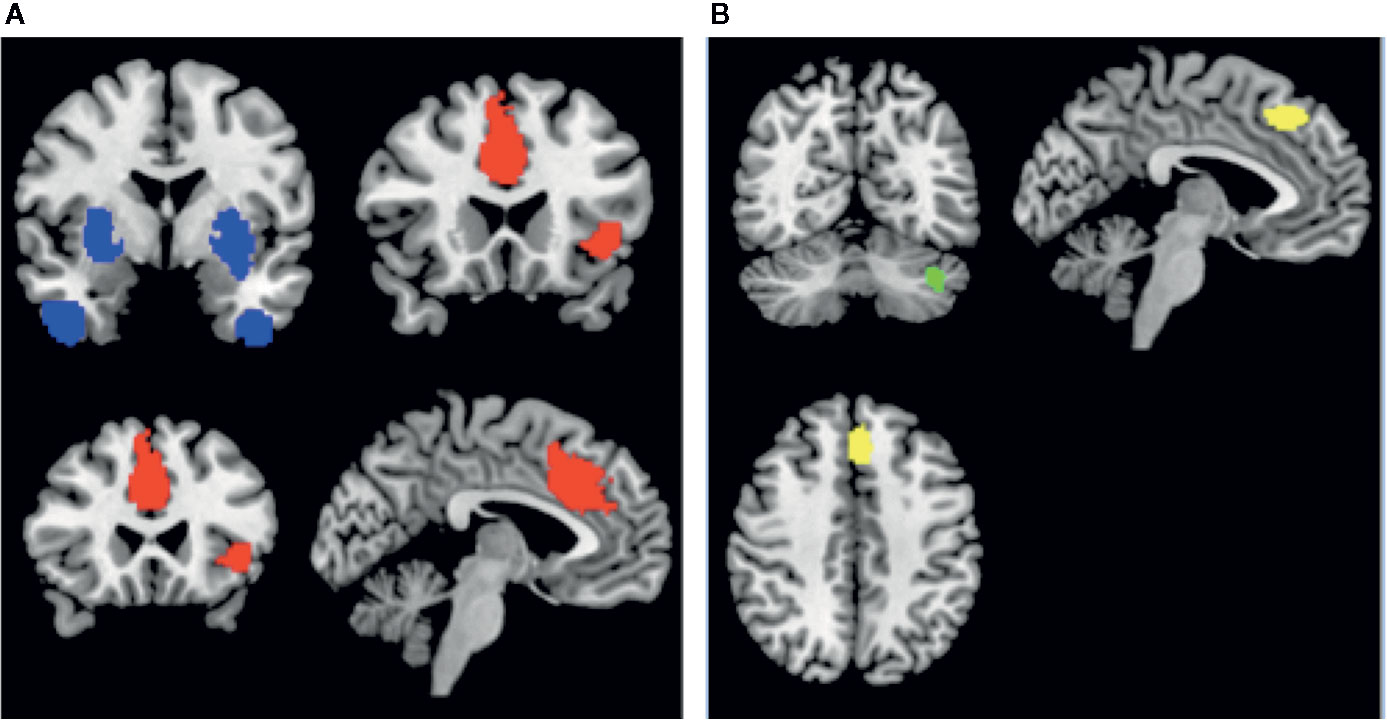
Figure 3 Regions of conjoint findings are shown on the left (A), and regions with disjoint findings are shown on the right (B). Bilateral striatum and temporal pole were found to have conjoint increases in regional cerebral blood flow (rCBF) and resting cerebral glucose metabolism (rCMRglu) (shown in blue). Left frontoinsular cortex and bilateral dorsal anterior cingulate cortex were found to have conjoint reductions in rCBF and rCMRglu. Regional neurovascular uncoupling was notable in the left superior frontal gyrus (−6,30,44; Left BA 8; SDM-z = −2.001, p=0.00033, reduced rCMRglu, normal rCBF – shown in yellow) and left cerebellum (−38,−66,−34; crus I and II; SDM-Z=2.27, p=0.00026, no. of voxels = 129; increased rCMRglu, normal rCBF – shown in green).
Meta-Regression Analysis
Meta-regression analysis was conducted to investigate the relationship between the change in rCBF or rCMRglu in the regions identified by the meta-analysis and various nuisance variables of interest. Illness duration was found to be negatively correlated to rCBF/rCMRglu changes in the left inferior frontal gyrus. In addition, we found that higher antipsychotic dose exposure attenuated the effect size of the patient-control differences in right middle occipital and left striatal rCBF or rCMRglu. We also noted that lower negative symptom burden also related to attenuated effect size of the patient-control differences in medial occipital rCBF or rCMRglu. Interestingly, patient samples receiving lower average antipsychotic doses were reporting higher average PANSS negative symptom scores (r=−0.6, p=0.03, df=12; Supplementary Figure S3). The meta-regression findings are described in the supplementary data (Table S1).
Querying Functional Connectivity Differences
Figure 4 highlights the anterior cingulate region, which showed conjoint and disjoint findings from different brain networks. The ventral cluster had reduced rCMRglu as well as reduced rCBF and was found to be well connected to the Salience Network, while the more dorsal cluster had normal rCBF despite reduced metabolism, and seems to participate in the frontoparietal executive network.
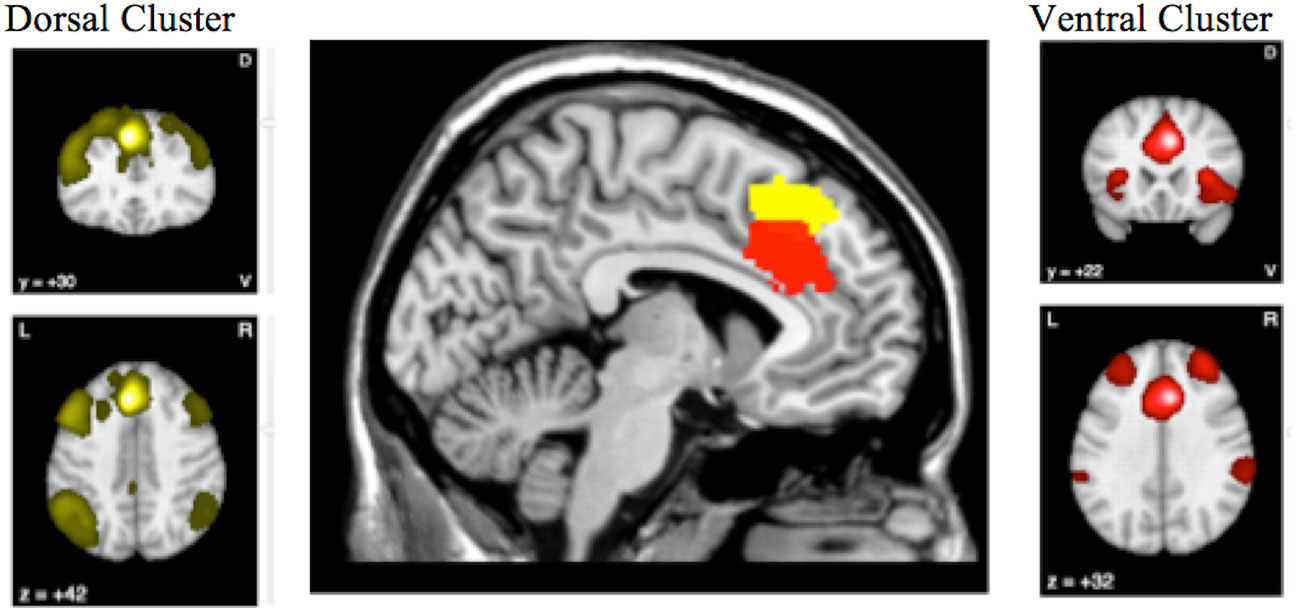
Figure 4 The conjunction and disjunction findings in the anterior cingulate region are shown. The more ventral cluster (red; 6, 22, 34) has reduced resting cerebral glucose metabolism (rCMRglu) as well as reduced regional cerebral blood flow (rCBF), while the more dorsal (yellow; −6, 30, 44) has normal rCBF despite reduced metabolism.
Discussion
To our knowledge, this is the first bimodal neuroimaging meta-analysis which combines information from whole brain FDG-PET studies investigating resting metabolic state, and ASL studies investigating the resting blood flow in schizophrenia. We report three major findings: 1. The frontoinsular cortex and the bilateral dorsal anterior cingulate cortex show reduced rCBF as well as rCMRglu in schizophrenia; 2. The bilateral dorsal striatum and the temporal pole show increased rCBF as well as rCMRglu in schizophrenia; 3. Brain regions with rCBF changes consistently show rCMRglu changes, but brain regions with rCMRglu changes are not always coupled with rCBF changes, especially in the superior frontal (dorsomedial ACC) and cerebellar cortices.
The frontoinsular cortex and bilateral dorsal anterior cingulate cortex, which showed reduced rCBF as well as rCMRglu in schizophrenia, belong to the Salience Network (SN) (39). The SN is considered to be a cognitive control network that performs the critical function of switching from introspective default-mode of brain activity to extrospective task-processing activity (40). Many prior studies have extensively investigated the connectivity within the SN and between the SN and other brain regions, and have highlighted the concentration of gray matter reduction in schizophrenia around the nodes of the SN (41). Our findings once again highlight the primary role that the SN plays in the diagnostic construct of schizophrenia (42). The neural basis of insula-related observations in fMRI studies have been considered with some caution given the vascular anatomy of this region (43). Our bimodal analysis establishes that defects in glucose utilization of SN nodes are a key aspect of the pathophysiology of schizophrenia. We also note that the frontoinsular cortex shows a trend for reduction in rCBF/rCMRglu in patients with longer duration of illness, indicating the possibility of a progressive defect in this key node.
Studies enrolling patients on higher doses of antipsychotics are associated with larger rCBF/rCMRglu effects in the left striatum. The effect of antipsychotics on striatal rCBF in schizophrenia has been studied extensively, and our results are highly consistent with the synthesis reported by Goozée et al. (44). Striatal D2 blockade seems to have a direct effect on increasing metabolism as well as blood flow of striatum, while other brain regions do not exhibit a relationship of similar magnitude. Increased rCBF/rCMRglu of temporal pole is consistent with medial temporal lobe pathology that has been reported in the literature (45–47). Given that the posited function of the temporal pole is one of emotion-perception binding (47), hypermetabolism in this region may be related to acute psychotic symptoms as shown by Crespo-Feccorro et al., though our meta-regression was not able to confirm this notion. Both lower dose exposure and higher negative symptom burden related to the exaggerated effect size of the patient-control differences in middle occipital rCBF/rCMRglu. These findings are intriguing in the context of recent observations implicating occipital hypometabolism as an early biomarker of anti–NMDA receptor encephalitis, a condition with a high propensity to present with psychotic symptoms (48, 49). Nevertheless, we did not find any regional associations for the PANSS positive symptom domain. Given the limited power of our meta-regression approach, we urge caution in interpreting these negative results.
We observed rCBF/rCMRglu uncoupling in two sites: dorsomedial prefrontal cortex and cerebellar vermis. In particular, a large body of fMRI studies indicate that the BOLD signal in the dorsomedial prefrontal cortex is reduced when control/conflict-processing tasks are performed by patients, compared to healthy subjects (50). Our current results indicate that these BOLD results are likely driven by reduced synaptic activity rather than a perfusion deficit in this region. The presence of normal rCBF in a site with reduced rCMRglu indicates a relative hyperperfusion, and resonates with the observation made by Taylor et al. (51) who demonstrated that ACC region demonstrates a relative hyperperfusion in subjects with schizophrenia.
Coupling of CMRglu and CBF appears to be linked to a vasoactive mechanism, as well as a structural factor related to capillary density (52). Postmortem studies in schizophrenia have not uncovered any notable vascular structural pathology to date, except for an increase in astrocytic end-feet in the prefrontal cortex shown by one study (53). In certain mitochondrial encephalopathies and lactic acidosis, uncoupling of rCBF and CMRglu occurs (54, 55), indicating that alterations in oxidative stress pathways may be relevant to our current observation in schizophrenia. In experimental models, neurovascular coupling is impaired in young rodents when redox imbalance is created by increasing intracellular generation of superoxide radicals (56). Glutathione, a major intracellular antioxidant that protects neuroglia from oxidative stress by disposing peroxides, is notably reduced in schizophrenia particularly in the medial prefrontal cortex (57), especially in patients with poor outcomes (58, 59). Taken together, our results support the likely existence of redox imbalance in the medial prefrontal cortex of patients with schizophrenia.
There are several limitations in this review that should be considered when interpreting results. Firstly, the cerebellar disjunction findings must be considered with caution as the quality of ASL signals from this region has been suboptimal in many studies. The lack of cerebellar coverage as well as the influence of ASL labeling site on posterior cerebral circulation may have influenced the reported disjunction. Secondly, all of the reported PET studies used CT-based anatomical registration, while ASL uses MR-based information. This might have influenced the exact location of peak coordinates, though the spatial smoothing used in SDM mitigates this to some extent. We also urge caution in interpreting the negative results from meta-regression (i.e. lack of age, gender and severity effects on metabolism) as none of the individual studies were powered to detect these relationships, and the meta-regression approach cannot deal with non-linear effects. Furthermore, we acknowledge that the meta-regression is exploratory as this analysis is likely to be underpowered. Similarly, disjunction results could also be driven by the well-known issue of false negative results from coordinates based meta-analyses (60). Only one ASL study employed 1.5T scanner (15), and our Jack-knife sensitivity analysis indicated that dropping this study did not alter the overall results. We did not use scanner strength as a marker of study quality as both patients and controls in such studies were scanned using the same instrument, obviating any measurement bias. Nevertheless, it is likely that the lower SNR might have contributed to publication bias, with only a few 1.5 T studies with positive results are reported in the literature. Finally, our results do not demonstrate that metabolic and vascular abnormalities are necessarily correlated at the subject (or group) level. Our aim was more modest, and restricted to localizing those brain regions where both abnormalities coexist in schizophrenia.
To conclude, schizophrenia related regional perfusion abnormalities capture the aberrant metabolism of underlying neuro-glial tissue. In specific brain regions, such as the dorsomedial prefrontal cortex, neurovascular uncoupling suggestive of possible inflammation (causing inappropriate hyperemia), astroglial dysfunction, or mitochondrial defects are likely to be present. This uncoupling needs further characterization, possibly using hybrid PET/MRI, to establish a mechanistic basis. These observations raise an interesting question of whether focused pharmacological restoration of blood-flow regulation could alleviate symptoms of schizophrenia.
Data Availability Statement
The individual participant datasets analyzed in this article are not publicly available as we used summary data from published studies. Requests to access the summary data used for the meta-analysis should be directed to LPALANIY@UWO.CA.
Author Contributions
LP conceived, designed, supervised data collection and statistical analysis, interpreted the results, and drafted the manuscript. NS undertook literature search, collected the data, undertook statistical analysis, and drafted the manuscript. PS supported literature search, cross-checked the clinical data, and drafted the manuscript. UA supported the literature search, oversaw study quality metrics, and drafted the manuscript.
Conflict of Interest
LP reports personal fees from Otsuka Canada, SPMM Course Limited, UK, Canadian Psychiatric Association; book royalties from Oxford University Press; investigator-initiated educational grants from Janssen Canada, Sunovion and Otsuka Canada outside the submitted work. PS reports personal fees from Otsuka Canada, SPMM Course Limited, UK, outside the submitted work.
The remaining authors declare that the research was conducted in the absence of any commercial or financial relationships that could be construed as a potential conflict of interest.
Acknowledgments
This study was supported by The Chrysalis Foundation. LP acknowledges support from the Tanna Schulich Chair of Neuroscience and Mental Health and the Opportunities Fund of the Academic Health Sciences Centre Alternative Funding Plan of the Academic Medical Organization of Southwestern Ontario (AMOSO).
Supplementary Material
The Supplementary Material for this article can be found online at: https://www.frontiersin.org/articles/10.3389/fpsyt.2020.00754/full#supplementary-material
References
1. Beer MD. Psychosis: from mental disorder to disease concept. Hist Psychiatry (1995) 6:177–200. doi: 10.1177/0957154X9500602204
2. Oliveira ÍAF, Guimarães TM, Souza RM, Dos Santos AC, Machado-de-Sousa JP, Hallak JEC, et al. Brain functional and perfusional alterations in schizophrenia: an arterial spin labeling study. Psychiatry Res Neuroimaging (2018) 272:71–8. doi: 10.1016/j.pscychresns.2017.12.001
3. Muoio V, Persson PB, Sendeski MM. The neurovascular unit - concept review. Acta Physiol Oxf Engl (2014) 210:790–8. doi: 10.1111/apha.12250
4. Telischak NA, Detre JA, Zaharchuk G. Arterial spin labeling MRI: Clinical applications in the brain. J Magn Reson Imaging (2015) 41:1165–80. doi: 10.1002/jmri.24751
5. Miele E, Spinelli GP, Tomao F, Zullo A, De Marinis F, Pasciuti G, et al. Positron Emission Tomography (PET) radiotracers in oncology – utility of 18F-Fluoro-deoxy-glucose (FDG)-PET in the management of patients with non-small-cell lung cancer (NSCLC). J Exp Clin Cancer Res CR (2008) 27:52. doi: 10.1186/1756-9966-27-52
6. Hanson DR, Gottesman II. Theories of schizophrenia: a genetic-inflammatory-vascular synthesis. BMC Med Genet (2005) 6:7. doi: 10.1186/1471-2350-6-7
7. Stanimirovic DB, Friedman A. Pathophysiology of the neurovascular unit: disease cause or consequence? J Cereb Blood Flow Metab (2012) 32:1207–21. doi: 10.1038/jcbfm.2012.25
8. Watts ME, Pocock R, Claudianos C. Brain Energy and Oxygen Metabolism: Emerging Role in Normal Function and Disease. Front Mol Neurosci (2018) 11:216. doi: 10.3389/fnmol.2018.00216
9. Bachneff SA. Regional cerebral blood flow in schizophrenia and the local circuit neurons hypothesis. Schizophr Bull (1996) 22:163–82. doi: 10.1093/schbul/22.1.163
10. Liu J, Qiu M, Constable RT, Wexler BE. Does baseline cerebral blood flow affect task-related blood oxygenation level dependent response in schizophrenia? Schizophr Res (2012) 140:143–8. doi: 10.1016/j.schres.2012.06.028
11. Walther S, Schäppi L, Federspiel A, Bohlhalter S, Wiest R, Strik W, et al. Resting-State Hyperperfusion of the Supplementary Motor Area in Catatonia. Schizophr Bull (2017) 43:972–81. doi: 10.1093/schbul/sbw140
12. Pinkham AE, Liu P, Lu H, Kriegsman M, Simpson C, Tamminga C. Amygdala Hyperactivity at Rest in Paranoid Individuals With Schizophrenia. Am J Psychiatry (2015) 172:784–92. doi: 10.1176/appi.ajp.2014.14081000
13. Ben-Shachar D, Bonne O, Chisin R, Klein E, Lester H, Aharon-Peretz J, et al. Cerebral glucose utilization and platelet mitochondrial complex I activity in schizophrenia: A FDG-PET study. Prog Neuropsychopharmacol Biol Psychiatry (2007) 31:807–13. doi: 10.1016/j.pnpbp.2006.12.025
14. Cui LB, Chen G, Xu ZL, Liu L, Wang HN, Guo L, et al. Cerebral blood flow and its connectivity features of auditory verbal hallucinations in schizophrenia: A perfusion study. Psychiatry Res Neuroimaging (2017) 260:53–61. doi: 10.1016/j.pscychresns.2016.12.006
15. Horn H, Federspiel A, Wirth M, Müller TJ, Wiest R, Wang JJ, et al. Structural and metabolic changes in language areas linked to formal thought disorder. Br J Psychiatry J Ment Sci (2009) 194:130–8. doi: 10.1192/bjp.bp.107.045633
16. Kindler J, Jann K, Homan P, Hauf M, Walther S, Strik W, et al. Static and dynamic characteristics of cerebral blood flow during the resting state in schizophrenia. Schizophr Bull (2015) 41:163–70. doi: 10.1093/schbul/sbt180
17. Kindler J, Schultze-Lutter F, Hauf M, Dierks T, Federspiel A, Walther S, et al. Increased Striatal and Reduced Prefrontal Cerebral Blood Flow in Clinical High Risk for Psychosis. Schizophr Bull (2018) 44:182–92. doi: 10.1093/schbul/sbx070
18. Ota M, Ishikawa M, Sato N, Okazaki M, Maikusa N, Hori H, et al. Pseudo-continuous arterial spin labeling MRI study of schizophrenic patients. Schizophr Res (2014) 154:113–8. doi: 10.1016/j.schres.2014.01.035
19. Pinkham A, Loughead J, Ruparel K, Wu WC, Overton E, Gur R, et al. Resting quantitative cerebral blood flow in schizophrenia measured by pulsed arterial spin labeling perfusion MRI. Psychiatry Res (2011) 194:64–72. doi: 10.1016/j.pscychresns.2011.06.013
20. Scheef L, Manka C, Daamen M, Kühn KU, Maier W, Schild HH, et al. Resting-state perfusion in nonmedicated schizophrenic patients: a continuous arterial spin-labeling 3.0-T MR study. Radiology (2010) 256:253–60. doi: 10.1148/radiol.10091224
21. Stegmayer K, Stettler M, Strik W, Federspiel A, Wiest R, Bohlhalter S, et al. Resting state perfusion in the language network is linked to formal thought disorder and poor functional outcome in schizophrenia. Acta Psychiatr Scand (2017) 136:506–16. doi: 10.1111/acps.12790
22. Walther S, Federspiel A, Horn H, Razavi N, Wiest R, Dierks T, et al. Resting state cerebral blood flow and objective motor activity reveal basal ganglia dysfunction in schizophrenia. Psychiatry Res (2011) 192:117–24. doi: 10.1016/j.pscychresns.2010.12.002
23. Zhu J, Zhuo C, Qin W, Xu Y, Xu L, Liu X, et al. Altered resting-state cerebral blood flow and its connectivity in schizophrenia. J Psychiatr Res (2015) 63:28–35. doi: 10.1016/j.jpsychires.2015.03.002
24. Desco M, Gispert JD, Reig S, Sanz J, Pascau J, Sarramea F, et al. Cerebral metabolic patterns in chronic and recent-onset schizophrenia. Psychiatry Res (2003) 122:125–35. doi: 10.1016/S0925-4927(02)00124-5
25. Horga G, Fernández-Egea E, Mané A, Font M, Schatz KC, Falcon C, et al. Brain metabolism during hallucination-like auditory stimulation in schizophrenia. PloS One (2014) 9:e84987. doi: 10.1371/journal.pone.0084987
26. Jeong-Hee K, Jong-Hoon K, YD S, YH J, SY L, HK K, et al. Altered interregional correlations between serotonin transporter availability and cerebral glucose metabolism in schizophrenia: A high-resolution PET study using [11C]DASB and [18F]FDG. Schizophr Res (2017) 182:55–65. doi: 10.1016/j.schres.2016.10.020
27. Park IH, Kim JJ, Chun J, Jung YC, Seok JH, Park HJ, et al. Medial prefrontal default-mode hypoactivity affecting trait physical anhedonia in schizophrenia. Psychiatry Res (2009) 171:155–65. doi: 10.1016/j.pscychresns.2008.03.010
28. Alsop DC, Detre JA, Golay X, Günther M, Hendrikse J, Hernandez-Garcia L, et al. Recommended Implementation of Arterial Spin Labeled Perfusion MRI for Clinical Applications: A consensus of the ISMRM Perfusion Study Group and the European Consortium for ASL in Dementia. Magn Reson Med (2015) 73:102–16. doi: 10.1002/mrm.25197
29. Waxman AD, Herholz K, Lewis DH, Herscovitch P, Minoshima S, Mountz JM, et al. Society of Nuclear Medicine Procedure Guideline for FDG PET Brain Imaging (Version 1.0). Soc Nucl Med (2009) 12.
30. Radua J, Mataix-Cols D, Phillips ML, El-Hage W, Kronhaus DM, Cardoner N, et al. A new meta-analytic method for neuroimaging studies that combines reported peak coordinates and statistical parametric maps. Eur Psychiatry (2012) 27:605–11. doi: 10.1016/j.eurpsy.2011.04.001
31. Sterne JAC, Sutton AJ, Ioannidis JPA, Terrin N, Jones DR, Lau J, et al. Recommendations for examining and interpreting funnel plot asymmetry in meta-analyses of randomised controlled trials. BMJ (2011) 343:d4002. doi: 10.1136/bmj.d4002
32. Ioannidis JPA, Trikalinos TA. An exploratory test for an excess of significant findings. Clin Trials (2007) 4:245–53. doi: 10.1177/1740774507079441
33. Albajes-Eizagirre A, Solanes A, Radua J. Meta-analysis of non-statistically significant unreported effects. Stat Methods Med Res (2019) 28:3741–54. doi: 10.1177/0962280218811349
34. Radua J, Romeo M, Mataix-Cols D, Fusar-Poli P. A general approach for combining voxel-based meta-analyses conducted in different neuroimaging modalities. Curr Med Chem (2013) 20:462–6. doi: 10.2174/0929867311320030017
35. Wise T, Radua J, Nortje G, Cleare AJ, Young AH, Arnone D. Voxel-Based Meta-Analytical Evidence of Structural Disconnectivity in Major Depression and Bipolar Disorder. Biol Psychiatry (2016) 79:293–302. doi: 10.1016/j.biopsych.2015.03.004
36. Radua J, Borgwardt S, Crescini A, Mataix-Cols D, Meyer-Lindenberg A, McGuire PK, et al. Multimodal meta-analysis of structural and functional brain changes in first episode psychosis and the effects of antipsychotic medication. Neurosci Biobehav Rev (2012) 36:2325–33. doi: 10.1016/j.neubiorev.2012.07.012
37. Radua J, Grau M, van den Heuvel OA, Thiebaut de Schotten M, Stein DJ, Canales-Rodríguez EJ, et al. Multimodal voxel-based meta-analysis of white matter abnormalities in obsessive-compulsive disorder. Neuropsychopharmacol. Off. Publ. Am. Coll. Neuropsychopharmacol (2014) 39:1547–57. doi: 10.1038/npp.2014.5
38. Radua J, Mataix-Cols D. Voxel-wise meta-analysis of grey matter changes in obsessive-compulsive disorder. Br J Psychiatry J Ment Sci (2009) 195:393–402. doi: 10.1192/bjp.bp.108.055046
39. Palaniyappan L, Liddle PF. Does the salience network play a cardinal role in psychosis? An emerging hypothesis of insular dysfunction. J Psychiatry Neurosci (2012) 37:17–27. doi: 10.1503/jpn.100176
40. Menon V, Uddin L. Saliency, switching, attention and control: a network model of insula function. Brain Struct Funct (2010) 214:655–67. doi: 10.1007/s00429-010-0262-0
41. Li M, Li X, Das TK, Deng W, Li Y, Zhao L, et al. Prognostic Utility of Multivariate Morphometry in Schizophrenia. Front Psychiatry (2019) 10:245. doi: 10.3389/fpsyt.2019.00245
42. Supekar K, Cai W, Krishnadas R, Palaniyappan L, Menon V. Dysregulated Brain Dynamics in a Triple-Network Saliency Model of Schizophrenia and Its Relation to Psychosis. Biol Psychiatry Immune Mech Psychosis (2019) 85:60–9. doi: 10.1016/j.biopsych.2018.07.020
43. Di X, Kannurpatti SS, Rypma B, Biswal BB. Calibrating BOLD fMRI Activations with Neurovascular and Anatomical Constraints. Cereb Cortex (2013) 23:255–63. doi: 10.1093/cercor/bhs001
44. Goozée R, Handley R, Kempton MJ, Dazzan P. A systematic review and meta-analysis of the effects of antipsychotic medications on regional cerebral blood flow (rCBF) in schizophrenia: association with response to treatment. Neurosci Biobehav Rev (2014) 43:118–36. doi: 10.1016/j.neubiorev.2014.03.014
45. Gur RE, Turetsky BI, Cowell PE, Finkelman C, Maany V, Grossman RI, et al. Temporolimbic Volume Reductions in Schizophrenia. Arch Gen Psychiatry (2000) 57:769–75. doi: 10.1001/archpsyc.57.8.769
46. Lee SH, Niznikiewicz M, Asami T, Otsuka T, Salisbury DF, Shenton ME, et al. Initial and Progressive Gray Matter Abnormalities in Insular Gyrus and Temporal Pole in First-Episode Schizophrenia Contrasted With First-Episode Affective Psychosis. Schizophr Bull (2016) 42:790–801. doi: 10.1093/schbul/sbv177
47. Crespo-Facorro B, Nopoulos PC, Chemerinski E, Kim JJ, Andreasen NC, Magnotta V. Temporal pole morphology and psychopathology in males with schizophrenia. Psychiatry Res (2004) 132:107–15. doi: 10.1016/j.pscychresns.2004.09.002
48. Yi-Chia W, Tseng JR, Wu C, Su FC, Weng WC, Hsu CC, et al. Different FDG-PET metabolic patterns of anti-AMPAR and anti-NMDAR encephalitis: Case report and literature review - Wei - 2020 - Brain and Behavior - Wiley Online Library. Brain Behav (2020) 10:1540. doi: 10.1002/brb3.1540
49. Probasco JC, Solnes L, Nalluri A, Cohen J, Jones KM, Zan E, et al. Decreased occipital lobe metabolism by FDG-PET/CT. Neurol Neuroimmunol Neuroinflamm (2017) 5:413. doi: 10.1212/NXI.0000000000000413
50. Minzenberg MJ, Laird AR, Thelen S, Carter CS, Glahn DC. Meta-analysis of 41 Functional Neuroimaging Studies of Executive Function in Schizophrenia. Arch Gen Psychiatry (2009) 66:811–22. doi: 10.1001/archgenpsychiatry.2009.91
51. Taylor SF, Tandon R, Koeppe RA. Global cerebral blood flow increase reveals focal hypoperfusion in schizophrenia. Neuropsychopharmacol Off Publ Am Coll Neuropsychopharmacol (1999) 21:368–71. doi: 10.1016/S0893-133X(98)00109-2
52. Kuschinsky W, Suda S, Sokoloff L. Local cerebral glucose utilization and blood flow during metabolic acidosis. Am J Physiol Heart Circ Physiol (1981) 241:H772–7. doi: 10.1152/ajpheart.1981.241.5.H772
53. Uranova NA, Zimina IS, Vikhreva OV, Krukov NO, Rachmanova VI, Orlovskaya DD. Ultrastructural damage of capillaries in the neocortex in schizophrenia. World J Biol Psychiatry Off J World Fed Soc Biol Psychiatry (2010) 11:567–78. doi: 10.3109/15622970903414188
54. Shishido F, Uemura K, Inugami A, Tomura N, Higano S, Fujita H, et al. Cerebral oxygen and glucose metabolism and blood flow in mitochondrial encephalomyopathy: a PET study. Neuroradiology (1996) 38:102–7. doi: 10.1007/BF00604789
55. Sano M, Ishii K, Momose Y, Uchigata M, Senda M. Cerebral metabolism of oxygen and glucose in a patient with MELAS syndrome. Acta Neurol Scand (1995) 92:497–502. doi: 10.1111/j.1600-0404.1995.tb00487.x
56. Lourenço CF, Ledo A, Caetano M, Barbosa RM, Laranjinha J. Age-Dependent Impairment of Neurovascular and Neurometabolic Coupling in the Hippocampus. Front Physiol (2018) 9:913. doi: 10.3389/fphys.2018.00913
57. Das TK, Javadzadeh A, Dey A, Sabesan P, Théberge J, Radua J, et al. Antioxidant defense in schizophrenia and bipolar disorder: A meta-analysis of MRS studies of anterior cingulate glutathione. Prog Neuropsychopharmacol Biol Psychiatry (2019) 91:94–102. doi: 10.1016/j.pnpbp.2018.08.006
58. Dempster K, Jeon P, MacKinley M, Williamson P, Théberge J, Palaniyappan L. Early treatment response in first episode psychosis: a 7-T magnetic resonance spectroscopic study of glutathione and glutamate. Mol Psychiatry (2020) 25:1640–50. doi: 10.1038/s41380-020-0704-x
59. Kumar J, Liddle EB, Fernandes CC, Palaniyappan L, Hall EL, Robson SE, et al. Glutathione and glutamate in schizophrenia: a 7T MRS study. Mol Psychiatry (2020) 25:873–82. doi: 10.1038/s41380-018-0104-7
Keywords: schizophrenia, arterial spin labeling, positron emission tomography, cerebral blood flow, cerebral glucose metabolism, dorsal anterior cingulate cortex
Citation: Sukumar N, Sabesan P, Anazodo U and Palaniyappan L (2020) Neurovascular Uncoupling in Schizophrenia: A Bimodal Meta-Analysis of Brain Perfusion and Glucose Metabolism. Front. Psychiatry 11:754. doi: 10.3389/fpsyt.2020.00754
Received: 31 December 2019; Accepted: 16 July 2020;
Published: 05 August 2020.
Edited by:
Vaibhav A. Diwadkar, Wayne State University, United StatesReviewed by:
Katharine Thakkar, Michigan State University, United StatesStefan Borgwardt, University of Basel, Switzerland
Copyright © 2020 Sukumar, Sabesan, Anazodo and Palaniyappan. This is an open-access article distributed under the terms of the Creative Commons Attribution License (CC BY). The use, distribution or reproduction in other forums is permitted, provided the original author(s) and the copyright owner(s) are credited and that the original publication in this journal is cited, in accordance with accepted academic practice. No use, distribution or reproduction is permitted which does not comply with these terms.
*Correspondence: Lena Palaniyappan, lpalaniy@uwo.ca