 Thomas W. Wöhner1*
 Ofere F. Emeriewen1
 Alexander H. J. Wittenberg2Koen Nijbroek2Rui Peng Wang2Evert-Jan Blom2Harrie Schneiders2
 Jens Keilwagen3
 Thomas Berner3
 Katharina J. Hoff4Lars Gabriel4Hannah Thierfeldt4Omar Almolla5
 Lorenzo Barchi5
 Mirko Schuster1
 Janne Lempe1
 Andreas Peil1
 Henryk Flachowsky1
- 1Institute for Breeding Research on Fruit Crops, Julius Kühn Institute (JKI) – Federal Research Centre for Cultivated Plants, Dresden, Saxony, Germany
- 2KeyGene N.V., Wageningen, Netherlands
- 3Institute for Biosafety in Plant Biotechnology, Julius Kühn Institute (JKI) – Federal Research Centre for Cultivated Plants, Quedlinburg, Saxony-Anhalt, Germany
- 4Institute of Mathematics and Computer Science, University of Greifswald, Greifswald, Mecklenburg-Western Pomerania, Germany
- 5Dipartimento di Scienze Agrarie, Forestali e Alimentari (DISAFA) – Plant Genetics, University of Turin, Grugliasco, Italy
Sour cherry (Prunus cerasus L.) is an important allotetraploid cherry species that evolved in the Caspian Sea and Black Sea regions from a hybridization of the tetraploid ground cherry (Prunus fruticosa Pall.) and an unreduced pollen of the diploid sweet cherry (P. avium L.) ancestor. Details of when and where the evolution of this species occurred are unclear, as well as the effect of hybridization on the genome structure. To gain insight, the genome of the sour cherry cultivar ‘Schattenmorelle’ was sequenced using Illumina NovaSeqTM and Oxford Nanopore long-read technologies, resulting in a ~629-Mbp pseudomolecule reference genome. The genome could be separated into two subgenomes, with subgenome PceS_a originating from P. avium and subgenome PceS_f originating from P. fruticosa. The genome also showed size reduction compared to ancestral species and traces of homoeologous sequence exchanges throughout. Comparative analysis confirmed that the genome of sour cherry is segmental allotetraploid and evolved very recently in the past.
1 Introduction
Cherries include several species of the genus Prunus, which belong to the sub-family Spiraeoideae in the plant family Rosaceae (Potter et al., 2007). The two economically most important cherry species worldwide are the sweet cherry (Prunus avium L.) and the sour cherry (Prunus cerasus L.). Both species are thought to have originated in the Caspian Sea and Black Sea region (Quero-García et al., 2019). Sour cherry commercial cultivation is concentrated in Eastern and Central Europe, North America, and Central and Western Asia, covering 217,960 ha. In 2021, the global production reached 1.51 million tons of fruit, with a production value of $1.2 billion in 2020 (https://www.fao.org/faostat/en/#data). Primarily grown for the production of jams, juices, and preserved or dried whole fruits, they also find use in dairy products and baked goods. Sour cherries display significant variation in morphological traits, including fruit characteristics and tree growth. This diversity is found within ecotypes and includes traits like cold tolerance and growth habits, which have been selectively bred across Europe over time (Dirlewanger et al., 2007; Hancock, 2008; Schuster et al., 2017). However, just a small number of cultivars actually dominate the cultivation of sour cherry. ‘Schattenmorelle’ is the dominant cultivar (cv) in Middle Europe (Figure 1), whereas sour cherry production in the United States is still based on Montmorency (Quero-García et al., 2019). ‘Schattenmorelle’ was first described in France and today it is known in many countries with different names. In Poland, for example, it is called Łutovka, and in France, it is called Griotte du Nord or Griotte Noir Tardive. The sour cherry is an allotetraploid with 2n=4x=32 chromosomes. It originated as a hybrid of an unreduced 2n pollen grain of P. avium (2n=2x=16) and a 1n egg cell of the tetraploid ground cherry P. fruticosa (2n=4x=32) (Kobel, 1927; Oldén and Nybom, 1968). Evidence of hybridization events between sweet and ground cherries has already been found several times in areas where both species occur simultaneously (Macková et al., 2018; Hrotkó et al., 2020). The resulting hybrids were usually triploid and were assigned to the secondary species P. ×mohacsyana Kárpáti. Natural occurrences of tetraploid sour cherries can be found in Eastern Turkey and the Caucasus region. There, they grow in forests and are used as wild forms for fruit production. The real area of origin is not known so far. Although P. cerasus can also be found in the wild in Europe, it is rather unlikely that those sour cherries are spontaneous hybrids. Since sour cherries are cultivated almost in many areas of the Northern hemisphere, they are often rather allochthonous individuals. The origin of the sour cherry thus seems to be based on a few hybridization events. The results obtained by Oldén and Nybom (1968) in experiments on the resynthesis of the species P. cerasus confirmed this hypothesis. The progeny from crosses between sweet and ground cherry showed the characteristic phenotype of the sour cherry. Studies based on chloroplast DNA markers strongly suggest that hybridization between P. avium and P. fruticosa led to the emergence of P. cerasus at least twice (Dirlewanger et al., 2007). Furthermore, the hypothesis could also be confirmed by genomic in situ hybridization (Schuster and Schreibner, 2000) and transcriptome sequencing (Bird et al., 2022).
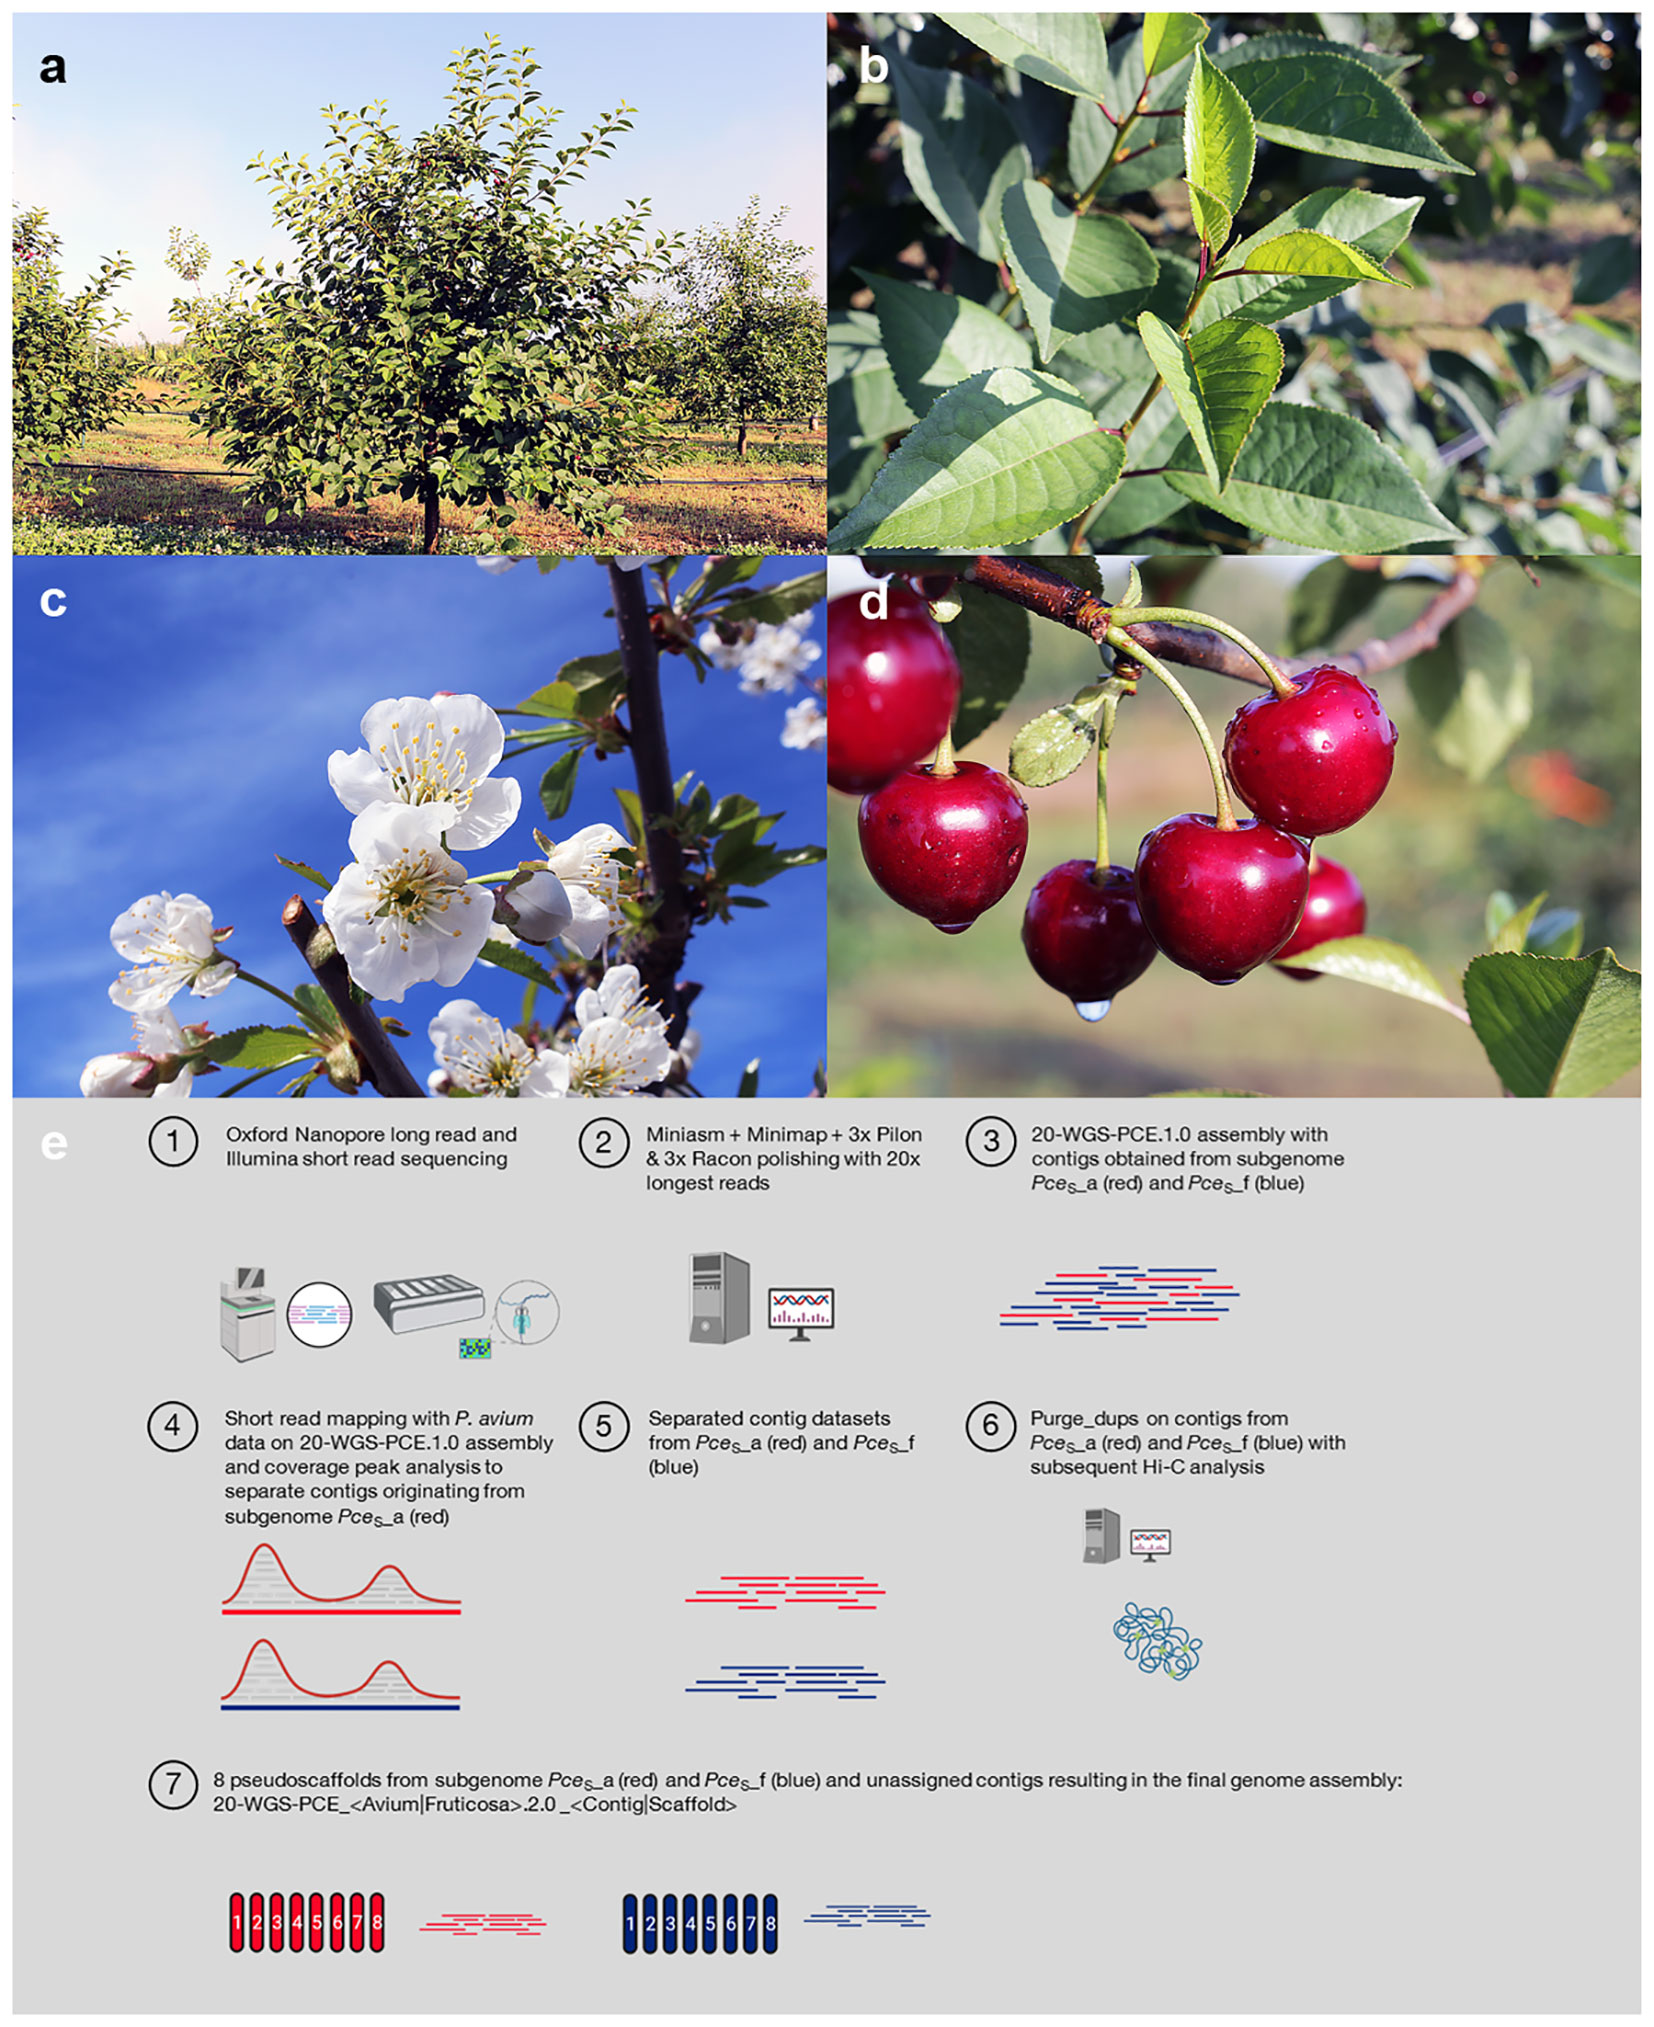
Figure 1 Morphology of P. cerasus L. ‘Schattenmorelle’. (A) Mature tree habitus, (B) leaves, (C) inflorescence, (D) fruits, (E) genome sequencing and assembly strategy (created with BioRender.com).
The sour cherry genome is estimated at 599 Mbp (Dirlewanger et al., 2007) with two subgenomes, each featuring eight chromosomes in the haploid set. One subgenome originates from sweet cherry (Pce_a), and the other from ground cherry (Pce_f). Nonetheless, the genome is not entirely allopolyploid, as there is long-standing suspicion that segments of the sour cherry genome are of different origin (Raptopoulos, 1941; Oldén and Nybom, 1968; Beaver and Iezzoni, 1993; Schuster and Wolfram, 2008). The origins and stability of hybridization and polyploidization between sweet and ground cherry remain unexplored. Cai et al. (2018) suggest that a combination of multi- and bivalent pairing may have led to chromosome segregation imbalance in sour cherry, indicating an ongoing genome stabilization process (Mason and Wendel, 2020). Recent genome sequencing advances, including studies by Zhang et al. (2021), Edger et al. (2019); Bertioli et al. (2019), Wu et al. (2021), and Wang et al. (2019), provide insight into the intricate structure and evolution of polyploid genomes. We present a high-quality pseudo-chromosome-level genome assembly of tetraploid sour cherry ‘Schattenmorelle’ (referred to as PceS), created using a combination of Illumina NovaSeq short-read and Oxford Nanopore long-read sequencing. Hi-C technology was employed to scaffold the sequences into chromosomes. Additionally, we generated a full-length transcriptome of ‘Schattenmorelle’ with PacBio Sequel II SMRT cell long-read technology. Comparative sequence and amino acid analyses were conducted across datasets of Prunus avium cv Tieton (PaT) and Prunus fruticosa ecotype Hármashatárhegy (PfeH), representing the two ancestral species, alongside the two subgenomes of ‘Schattenmorelle’ (PceS_a and PceS_f). These analyses shed light on the evolution of sour cherry and reveal homoeologous exchanges (HE) within the sub-genomic structure, explaining the segmental allopolyploidy in the sour cherry genome.
2 Materials and methods
2.1 Plant material, DNA and RNA extraction, sequencing and Iso-Seq analysis
Snap-frozen Prunus cerasus L. ‘Schattenmorelle’ (accession KIZC99-2, Figure 1, supplements 1.1) young leaf material was sent to KeyGene N.V. (Wageningen, The Netherlands). High-molecular-weight extracted DNA (Wöhner et al., 2021) was used to generate 1D ligation (SQK-LSK109) libraries that were subsequently sequenced on two Oxford Nanopore Technologies (ONT) R9.4.1 PromethION flow cells. The same material was used to generate an Illumina PCR free paired-end library (insert size of ~550 bp) that was sequenced on a Illumina NovaSeq™ platform using 150-bp and 125-bp paired-end sequencing.
Snap-frozen tissues from buds, flowers, leaves, and fruits were collected in the field, and total RNA was extracted with Maxwell® RSC Plant RNA Kit (Promega). Two pools were generated and used for PacBio Iso-Seq library preparation (Procedure & Checklist – Iso-Seq™ Express Template Preparation for Sequel® and Sequel II Systems, PN 101-763-800 Version 02). Each library pool was sequenced on a single 8M ZMW PacBio Sequel II SMRT cell (supplements 1.1). Obtained full-length reads with the 5′-end primer, the 3′-end primer, and the poly-A tail were filtered, and these sequences were trimmed off. Transcripts containing (artificial) concatemers were completely discarded. Isoforms (consensus sequence) generated by full-length read clustering (based on sequence similarity) were finally polished with non-full-length reads using Arrow (SMRT Link v7.0.0, https://www.pacb.com/wp-content/uploads/SMRT_Tools_Reference_Guide_v600.pdf).
2.2 De novo assembly and scaffolding
The aligner Minimap2 (v2.16-r922, Li, 2018) and assembler Miniasm (v0.2-r137-dirty, Li, 2016) were used for raw data assembly generation. Racon (vv1.4.10, Vaser et al., 2017) and Pilon (v1.22, Walker et al., 2014) were used for base-quality improvement with raw ONT and Illumina read data. Chromosome-scale scaffolding was performed by Phase Genomics (Seattle, Washington, USA) with Proximo Hi-C (supplements 1.2). The resulting assembly was designated as 20-WGS-PCE_<Avium|Fruticosa>.2.0 _<Contig|Scaffold> (Figure 1E).
2.3 Correctness, completeness, and contiguity of the Prunus cerasus genome sequence
The BUSCO (Benchmark Universal Single-Copy Orthologs – Galaxy Version 4.1.4) software was used for quantitative and quality assessment of the genome assemblies based on near-universal single-copy orthologs. The long terminal repeat (LTR) assembly Index (LAI) (Ou et al., 2018) was calculated with LTR_retriever 2.9.0 (https://github.com/oushujun/LTR_retriever) to evaluate the assembly continuity between the final genome sequence of P. cerasus ‘Schattenmorelle’ and Prunus fruticosa ecotype Hármashatárhegy (Wöhner et al., 2021, Pf_1.0), P. avium Tieton (Wang et al., 2020), and P. persica Lovell (Verde et al., 2017), respectively. LTR_harvest (genometools 1.6.1 implementation) was used to obtain LTR-RT candidates. The genome size was also estimated by k-mer analysis (supplements 1.3) using Illumina short read data. The merged datasets were subsequently used to generate a histogram dataset representing the k-mers from all datasets. GenomeScope (Galaxy Version 2.0, Ranallo-Benavidez et al., 2020) was used to generate a histogram plot of k-mer frequency of different coverage depths using the tetraploid ploidy level (k-mer length 19). Marker sequences and genetic positions from five available genetic sour cherry maps (M172x25-F1, US-F1, 25x25-F1, Montx25-F1, and RE-F1) and 14,644 SNP markers (9 + 6k array) were downloaded from the Genome Database for Rosaceae (GDR, https://www.rosaceae.org/). The marker sequences were mapped on the chromosome sequences using the mapping software bowtie2 (Galaxy Version 2.5.0+galaxy0, Langmead and Salzberg, 2012) implementation on the Galaxy server (https://usegalaxy.org) with standard settings.
2.4 Structural and functional annotation
For an interspecies repeat comparison, a species-specific repeat library was generated with RepeatModeler open-1.0.11, and the genome was subsequently masked with RepeatMasker open-4.0.7. For structural genome annotation, another species-specific repeat library for PCE_1.0 was generated with RepeatModeler2 (Flynn et al., 2020) version 2.0.2, and the genome was subsequently masked with RepeatMasker 4.1.2. (Further details on the repeat masking software configuration are available in supplements 1.4.1.).
To generate extrinsic evidence for structural annotation of protein coding genes, short-read RNA-Seq library SRR2290965 (Jo et al., 2015) was aligned to the genome using HiSat2 version 2.1.0 (Kim et al., 2019). The output SAM file was converted to BAM format using SAMtools (Li et al., 2009). The resulting alignment file was further used by both BRAKER1 (Hoff et al., 2016; Hoff et al., 2019) and GeMoMa (Keilwagen et al., 2016; Keilwagen et al., 2019).
Furthermore, a custom protocol was used for integrating long-read RNA-Seq data into genome annotation (supplements 1.4.2). In short, protein coding genes were called in Cupcake transcripts using GeneMarkS-T (Tang et al., 2015), and these predictions were converted to hints for BRAKER1. In addition, intron coverage information from long-read to genome-spliced alignment with Minimap2 (Li, 2018) was provided to BRAKER1.
A combination of BRAKER1 (Hoff et al., 2016; Hoff et al., 2019), BRAKER2 (Brůna et al., 2021), TSEBRA (Gabriel et al., 2021), and GeMoMa (Keilwagen et al., 2016) was used for the final annotation of protein coding genes. BRAKER pipelines use a combination of evidence-supported self-training GeneMark-ET/EP (Lomsadze et al., 2014; Brůna et al., 2020) (here version 4.68) to generate a training gene set for the gene prediction tool AUGUSTUS (Stanke et al., 2008; here version 3.3.2). BRAKER1 version 2.1.6 was here provided with BAM-files of from short- and long-read RNA-Seq to genome alignments, and with gene structure information derived from Cupcake transcripts using GeneMarkS-T. This generated a gene set that consists of ab initio and evidence-supported predictions. A separate gene set was generated with BRAKER2, which uses protein to generate a gene set. We used the OrthoDB version 10 (Kriventseva et al., 2019) partition of plants in combination with the full protein sets of Prunus fruticosa (Wöhner et al., 2021), Prunus armeniaca (GCA 903112645.1), Prunus avium (GCF_002207925.1), Prunus dulcis (GCF_902201215.1), Prunus mume (GCF_000346735.1), and Prunus persica (GCF_000346465.2) as input for BRAKER2. Both the BRAKER1 and BRAKER2 AUGUSTUS gene sets were combined with a GeneMarkS-T derived gene set using TSEBRA (Gabriel et al., 2021) from the long_reads branch on GitHub with a custom configuration file (supplements 1.4.3.) incorporating evidence from BRAKER1 and BRAKER2.
GeMoMa was run on the genome assembly of ‘Schattenmorelle’ using 14 reference species and experimental transcript evidence (supplements 1.4.4). GeMoMa gene predictions of each reference species were combined with TSEBRA predictions using the GeMoMa module GAF, and subsequently, UTRs were predicted in a two-step process based on mapped Iso-Seq and RNA-seq data using the GeMoMa module AnnotationFinalizer (supplements 1.4.5). First, UTRs were predicted based on Iso-Seq data. Second, UTRs were predicted based on RNA-seq data for gene predictions without UTR prediction from the first step. An assembly hub for visualization of the Prunus cerasus genome with structural annotation was generated using MakeHub (Hoff, 2019; supplements 2). The functional annotation was performed with the Galaxy Europe implementation of InterProScan (Galaxy Version 5.59-91.0+galaxy3, Zdobnov and Apweiler, 2001; Quevillon et al., 2005; Hunter et al., 2009; Cock et al., 2013; Jones et al., 2014). The chloroplast and mitochondria sequences were annotated with GeSeq (Tillich et al., 2017, supplements 1.4.5).
2.5 Identification of syntenic regions
Structural comparison of orthologous loci between the subgenomes PceS_a and PceS_f of Prunus cerasus and the two genotypes PaT and PfeH as representatives of the two genome donor species P. avium and P. fruticosa was calculated with the final annotations using SynMap2 (Haug-Baltzell et al., 2017) available at the CoGe platform (https://genomevolution.org/coge/). Analysis on triplication events was performed with standard settings and Last as Blast algorithm at a ratio coverage depth of 3:3 in SynMap2 (Haug-Baltzell et al., 2017).
2.6 Identification of homoeologous exchange regions
Homoeologous exchanges were identified on the amino acid, transcript, and genomic level.
2.6.1 Calculation of amino acid identity
Identity of amino acids (IAA) between all reference annotation homology-based gene prediction was calculated by GeMoMa using the default parameters. Subsequently, the PceS genome was divided into 250k windows, and the percentage of proteins showing a higher IAA between PfeH (Wöhner et al., 2021) and PaT (Wang et al., 2020) to the respective subgenome (PceS_a and PceS_f) was determined. The percentage of proteins in this window, which were more similar to PaT, was finally subtracted from the percentage of proteins that were more similar to PfeH. A proportion of transcripts with higher intraspecific amino acid identity (between PaT and PceS_a or PfeH and PceS_f) is expected compared to the proportion of transcripts with interspecific amino acid identity match (PfeH and PceS_a or PaT and PceS_f). Opposite cases indicate potential translocations between the two subgenomes PceS_a and PceS_f and were plotted into a circos plot (Figure S1).
2.6.2 Read mapping and coverage analysis
RNAseq raw data published by Bird et al. (2022) were obtained from NCBI sequence read archive (SRA) for the following species: P. cerasus (SRX14816146, SRX14816142, and SRX14816138), P. fruticosa (SRX14816141), P. avium (SRX14816143), P. canescens (SRX14816137), P. serrulata (SRX14816136), P. mahaleb (SRX14816140), P. pensylvanica (SRX14816144), P. maackii (SRX14816139), and P. subhirtella (SRX14816145). Reads were adapter and quality trimmed using the software Trim Galore (version 0.6.3, parameters –quality 30 –length 50). Trimmed reads were mapped against the P. cerasus subgenomes PceS_a and PceS_f using STAR (version 2.7.8a, parameter –twopassMode Basic). The subsequent analysis was performed in accordance to Keilwagen et al. (2022). The PceS genome was divided into 250k windows. The percentage of covered bases using RNAseq data of P. cerasus (SRX14816146, SRX14816142, and SRX14816138) was estimated at a depth of 1 for each window. The same was done with all other RNAseq datasets. The percentage of covered bases from P. avium (SRX14816143) was subtracted from the percentage of covered bases from P. cerasus (SRX14816146, SRX14816142, and SRX14816138). The same was done using the reads of P. fruticosa (SRX14816141). For subgenome PceS_a, it is expected that the intraspecific difference for transcripts of dataset P. avium (SRX14816143) is lower (close to 0) than the interspecific difference for transcripts of dataset P. fruticosa (SRX14816141) and vice versa. Opposite cases indicate potential homoeologous exchanges between the two subgenomes PceS_a and PceS_f and were plotted into a circos plot (Figure S1).
The nucleotide short reads from PceS were mapped against the genomes of the two ancestral species PaT and PfeH. Subsequently, the mapped reads were filtered using samtools for mapped reads in proper pair (-f 3) and primary alignments and not supplementary alignment (-F 2304). Those reads were divided into four groups according to the following criteria: (1) unique match to PaT, (2) unique match to PfeH, (3) match to PaT and PfeH, and (4) no match to PaT and PfeH (unique to PceS). The first two separated read sets were then re-mapped against the subgenomes PceS_a and PceS_f. The percentage of covered bases was calculated for a 100k window. For the subgenomes of Pces, the percentage of intraspecific covered bases (PceS_a to PaT, PceS_f to PfeH) should be higher compared to the percentage of interspecific covered bases (PceS_a to PfeH, PceS_f to PaT). The opposite case indicates possible translocations and were plotted into a circos plot (Figure S1). Additionally, regions of the ‘Schattenmorelle’ genome assembly were determined that are uniquely covered by PaT and PfeH filtered read sets.
2.7 LTR insertion estimation
The difference (identity) of left and right LTR was calculated using the script EDTA_raw.pl from the software EDTA version 1.9 (https://github.com/oushujun/EDTA, Ou et al., 2019). As input files, we used the genome sequences of P. cerasus (PceS_a and PceS_f), PaT (NCBI BioProject acc. no. PRJNA596862), PfeH (NCBI BioProject acc. no. PRJNA727075), and a curated library of representative transposable elements from Viridiplantae (https://www.girinst.org/repbase/). Because trees are not annual plants, the identity obtained from the resulting.pass.list file was used for the estimation of generation time after LTR insertion using the formula T=K/2µ (K is the divergence of the LTR = 1 − identity) assuming a Prunus-specific mutation frequency of µ=7.7 × 10⁻⁹ (Xie et al., 2016) per generation.
2.8 Protein clustering, multiple sequence alignment, and divergence of time estimation
The protein datasets from PceS_a and PceS_f, PaT, PfeH, Pp (Prunus persica Whole Genome Assembly v2.0, v2.0.a1), Pm (Prunus mume Tortuosa Genome v1.0), Py (Prunus yedoensis var. nudiflora Genome v1.0), Md (Malus x domestica HFTH1 Whole Genome v1.0), and At (TAIR10.1, RefSeq GCF_000001735.4) from the annotation step were uploaded to Galaxy_Europe server as.fasta. The Proteinortho (Galaxy Version 6.0.32+galaxy0) was used to find orthologous proteins within the datasets. MAFFT (Galaxy Version 7.505+galaxy0) was used to align the obtained single copy orthogroups. The final alignments were merged with the Merge.files function (Galaxy Version 1.39.5.0). Finally, the alignments were concatenated into a super protein and the final sequences were aligned with MAFFT. A phylogenetic tree was reconstructed with RAxML (maximum likelihood based inference of large phylogenetic trees, Galaxy Version 8.2.4+galaxy3) and the obtained.nhx file was reformatted as.nwk file for further processing using CLC Mainworkbench (21.0.1, QIAGEN Aarhus A/S). Evolutionary analyses were conducted in MEGA X (Kumar et al., 2018). Estimation of pairwise divergence time was performed according to Shirasawa et al. (2019) with a divergence time from the reference species peach and apple (34–67 Mya, www.timetree.org). Specific parameters for the calculation are listed in supplements.
3 Results
3.1 De novo assembly and scaffolding
A total of 68 Gb of paired-end Illumina sequencing data were obtained, corresponding to ~114× coverage of the estimated genome size of 599 Mbp. Using two PromethION flow cells, a total of 178 Gb was produced (~300× coverage). The longest ONT reads that together resulted in a 20× coverage were selected for assembly, having a minimum read length of 64,214 bp. Table S1 summarizes the properties of the 20-WGS-PCE.1.0 assembly after polishing. The Prunus avium and Prunus fruticosa contigs were then separated successfully by read mapping and contig selection that fit the hypothesis of 1 or more clear coverage peaks from the 20-WGS-PCE.1.0 assembly. The resulting two datasets, representing the subgenomes PceS_a and PceS_f, were purged and used for HI-C scaffolding. After manual curation of both datasets, the final consensus genome assembly was scaffolded from 935 and 865 contigs of the PceS_a and PceS_f subgenomes, respectively. Eight clusters ideally representing the eight chromosomes were obtained for each subgenome (Figure S2). The final genome sequence is 628.5 Mbp long and consists of eight chromosomes for each subgenome (Figure 2). A total of 269 Mbp were assigned to subgenome PceS_a (N50 of 31.5 Mbp) and 299.5 Mbp (N50 of 39.4 Mbp) to PceS_f. Eighty-six and 134 unassembled contigs were unassigned to chromosomes for PceS_a (22.7 Mbp) and PceS_f (37.3 Mbp), respectively. The longest scaffold from PceS_a is 52.8 Mbp and 53.5 Mbp from subgenome PceS_f (Table S2). Except for chromosome five, all scaffolds obtained from subgenome PceS_f are longer compared to the corresponding chromosome of subgenome PceS_a. The chloroplast sequence obtained was 158,178 bp and the mitochondrial sequence was 343,516 bp long (Figure S3).
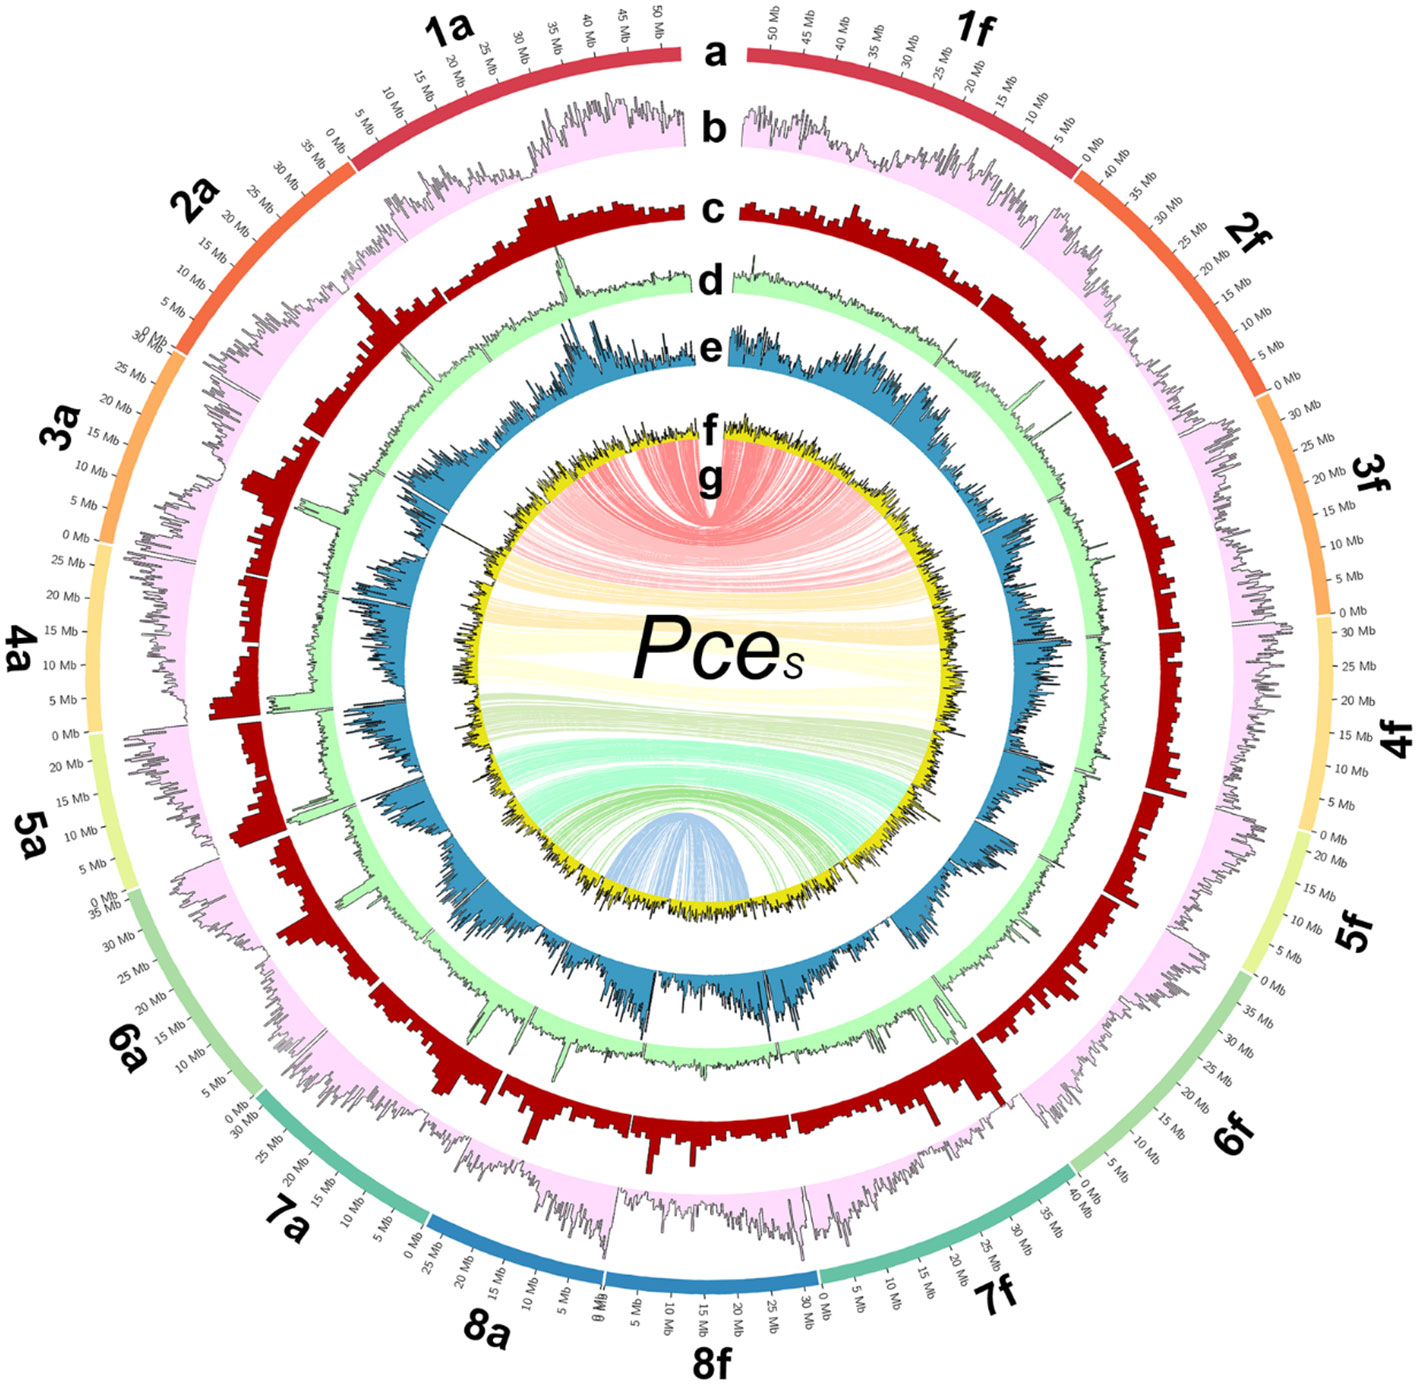
Figure 2 The genome of P. cerasus ‘Schattenmorelle’. Circos plot of 16 pseudomolecules of the subgenomes of PceS_a and PceS_f. (A) Chromosome length (Mb). (B) Gene density in blocks of 250k. (C) Distribution of repetitive sequences in blocks of 250k. (D) Gypsy elements in blocks of 250k. (E) Copia elements in block of 250k. (F) GC content in blocks of 1 Mb. (G) The inner ring shows markers from the 6 + 9k SNP array located on both subgenomes.
3.2 Transcriptome sequencing, Iso-Seq analysis, structural and functional annotation
The total repeat content of the entire PceS genome sequence was 49.7%. The total repeat content of subgenome PceS_a was 48.3% and that of subgenome PceS_f was 50.9% (Table 1). The class I elements Gypsy comprised the largest fractions of repetitive elements in the PceS genome sequence. A quantitative reduction between elements of this family was also detected in the PceS_f subgenome with a difference of 10.7%. Several elements could only be detected in one genotype of the two ancestral species. The TAD1 class I element only occurred in PfeH, while class II, order TIR - IS3EU, P, and Sola-3 were specifically detected in the genome of PaT. No element was found, which was only present in one of the two subgenomes of PceS. Several elements occurred in both subgenomes (class I, LINE – R1-LOA, RTE-X, SINE – tRNA-DEU- L2, class II, TIR – TcMar- Mariner, and DADA elements) but were not detected in PfeH and PaT. The class I elements of the order LTR (ERV1, Pao) and Academ/-2 were only detected in one of the two genomes representing the ancestral species and in PceS_a and PceS_f. Iso-Seq results are summarized in Table S3. In total, 248,218 high-quality isoforms have been identified. Both the high- and the low-quality isoforms have been used for genome annotation where each gene might be represented by multiple isoforms. A total of 107,508 transcripts (PceS_a: 53,497; PceS_f: 54,011) were predicted from the 60,123 gene models (PceS_a: 29,069; PceS_f: 31,054) obtained by structural annotation procedures (Table S4). Interproscan analysis detected 1,381,841 functional annotations (PceS_a: 649,310; PceS_f: 687,531) using 16 databases. Two-thirds (71,870) of the transcripts were assigned with GO terms and 9,114 were found to be involved in annotated pathways.
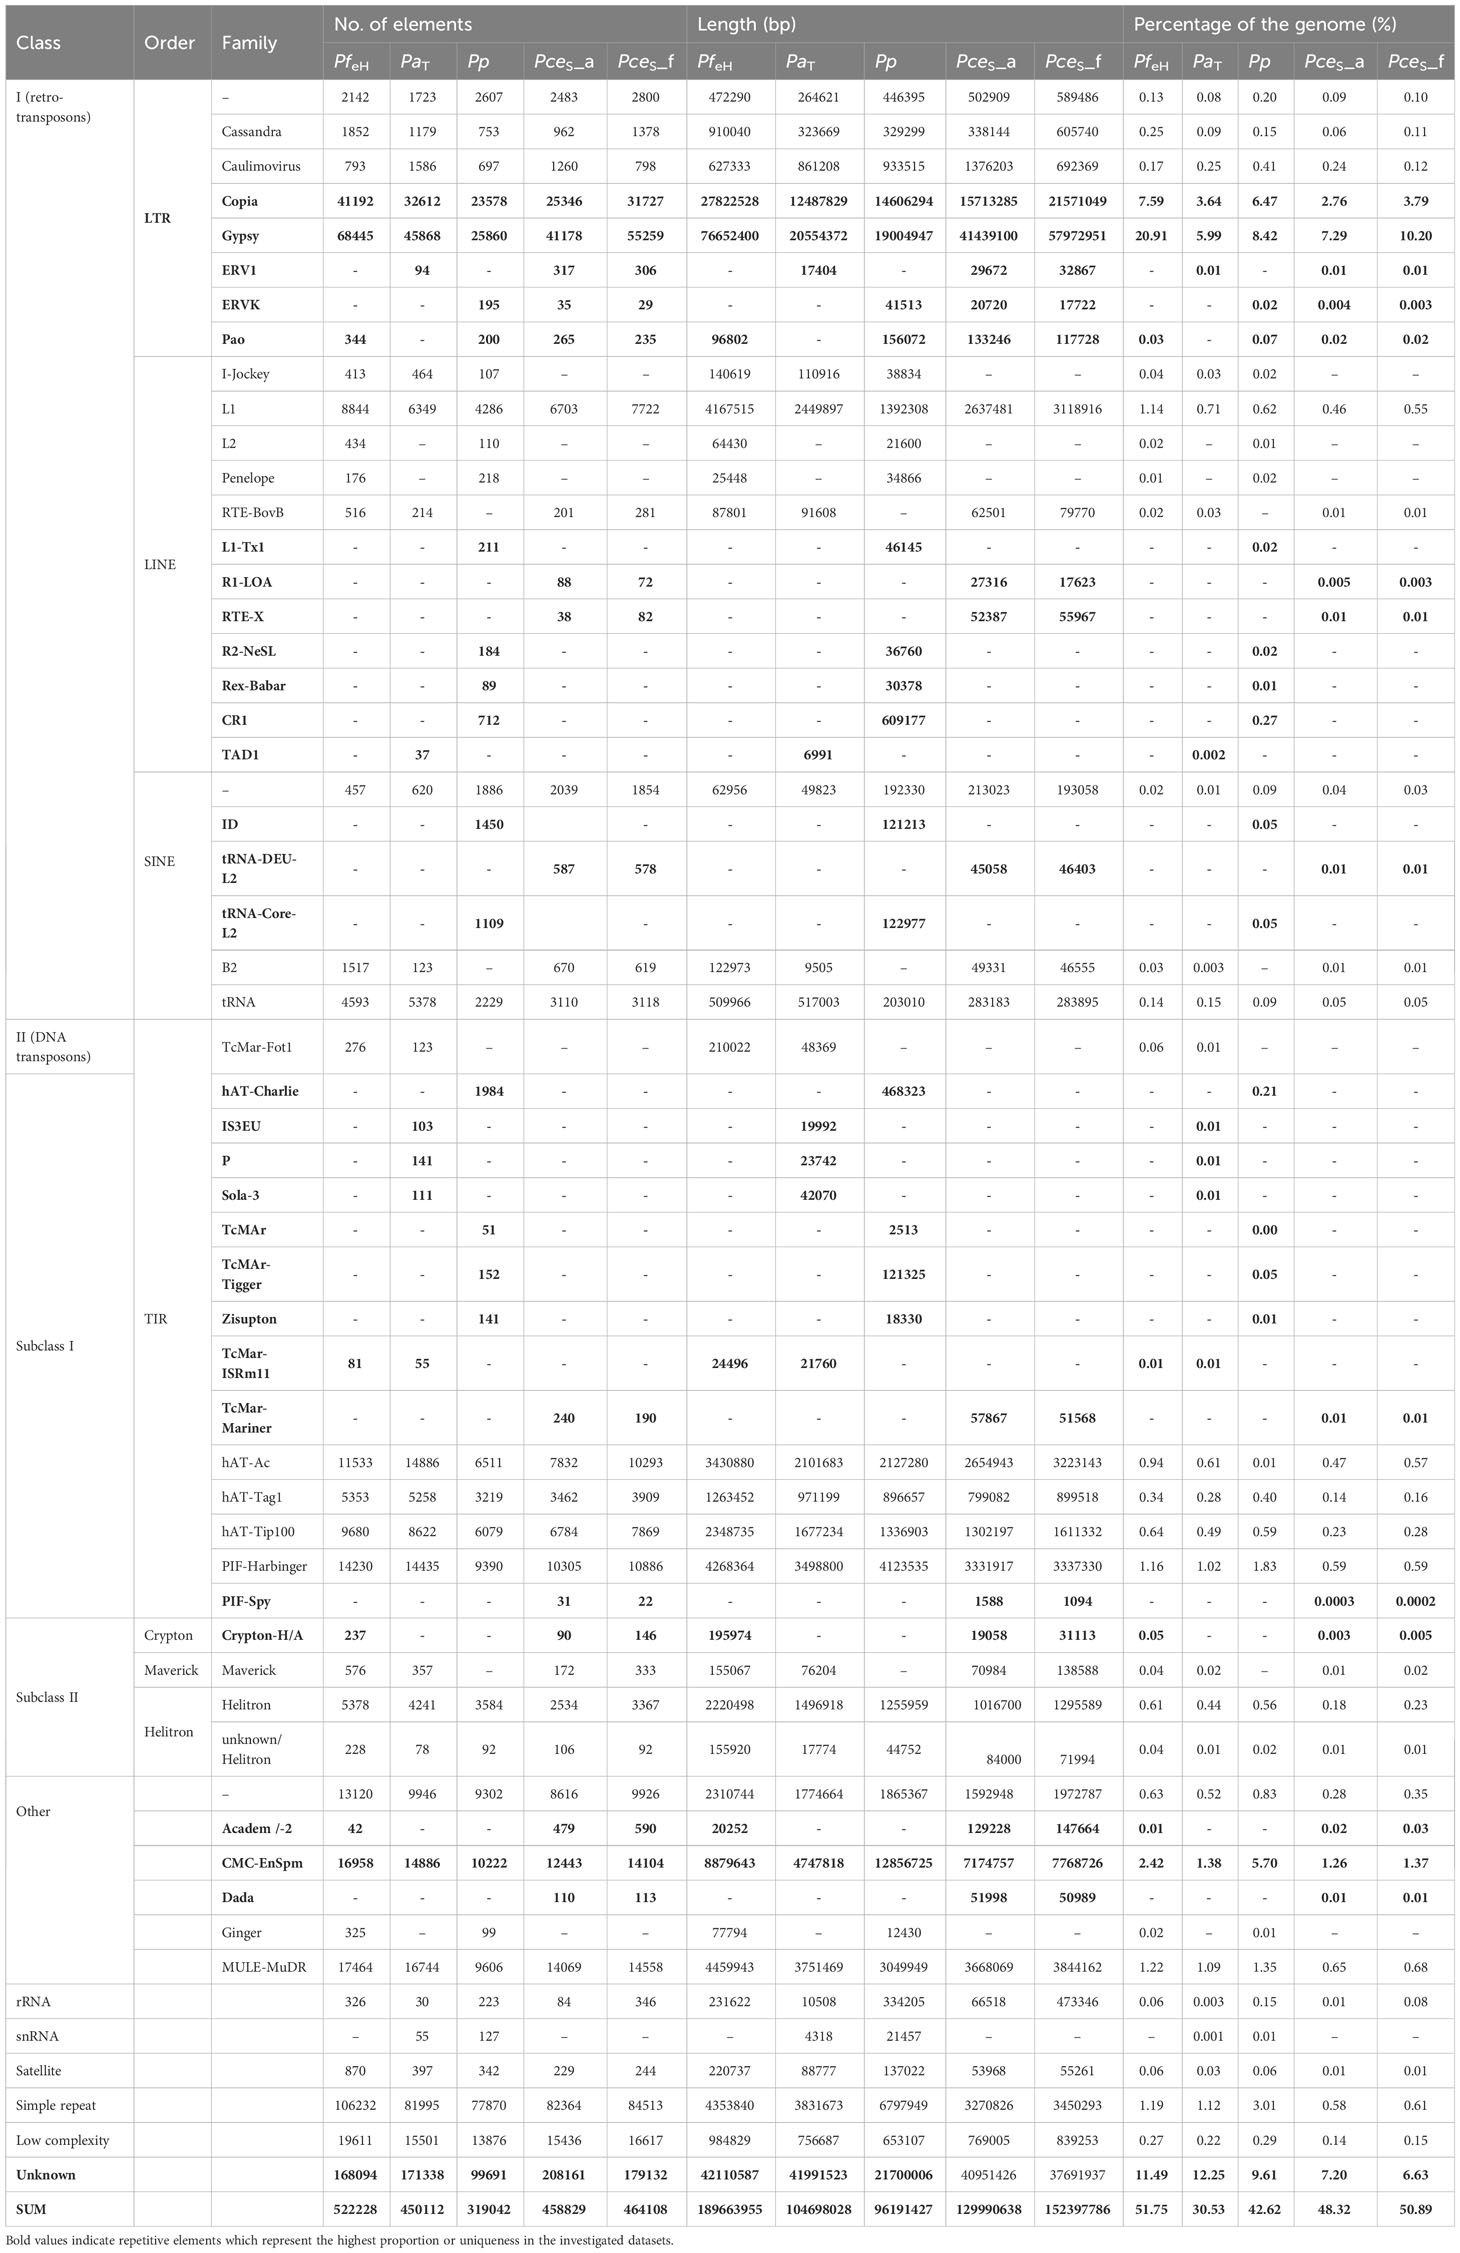
Table 1 Characterization of repetitive sequences of P. fruticosa ecotype Hármashatárhegy (PfeH) compared to P. avium Tieton (PaT), P. persica Lovell, and the two subgenomes of P. cerasus ‘Schattenmorelle’ PceS_a and PceS_f.
3.3 Completeness and quality of the genome and transcriptome
BUSCO completeness of the PceS genome was 99.0% (S: 16.7%, D: 82.3%, F: 0.4%, M: 0.6%, n: 1,614) respectively and comparable with P. persica Lovell (99.3%) and P. avium Tieton (98.3%, Figure S4). Completeness of subgenome PceS_a was higher (C: 89.4%, S: 84.8%, D: 4.6%, F: 1.5%, M: 9.1%, n: 1,614) compared to subgenome PceS_f (C: 87.1%, S: 80.9%, D: 6.2%, F: 1.2%, M: 11.7%, n: 1,614). The calculated LAI index was 6.3 and low in comparison to other genomes (PpL: 17.6, PaT: 10.3, PfeH: 13.1). The LAI index for subgenome PceS_a was 7.1. The LAI index for subgenome PceS_f was 5.6 (Figure S5). The nucleotide heterozygosity rates were 94.9% for aaaa, 2.39 for aaab, 2.4 for aabb, 0.001 for aabc, and 0.308 for abcd (Figure 3). The comparison of genetic position and physical position of up to 1,856 markers of the five genetic sour cherry maps (Table S5A) showed a good co-linearity to the genome sequence (Figure S6). BUSCO evaluation on completeness of the annotated proteins resulted in 99.2% [C: 99.2% (S: 8.4%, D: 90.8%), F: 0.4%, M: 0.4%, n: 1,614]. The chloroplast sequence obtained contained 427 genes, 21 rRNAs, and 136 tRNAs, whereas the mitochondrial sequence contained 188 genes, 3 rRNAs, and 152 tRNAs (Figure S3). An ab initio and homology-based gene prediction with 14 reference species was performed (IAA). Based on the homology prediction, 34% of the proteins showed the highest IAA towards Prunus fruticosa and 17.9% towards P. avium. Only 5.2% of the proteins showed no IAA to any of the used reference datasets used, which was due to ab initio prediction. The data are summarized in Figure S7.
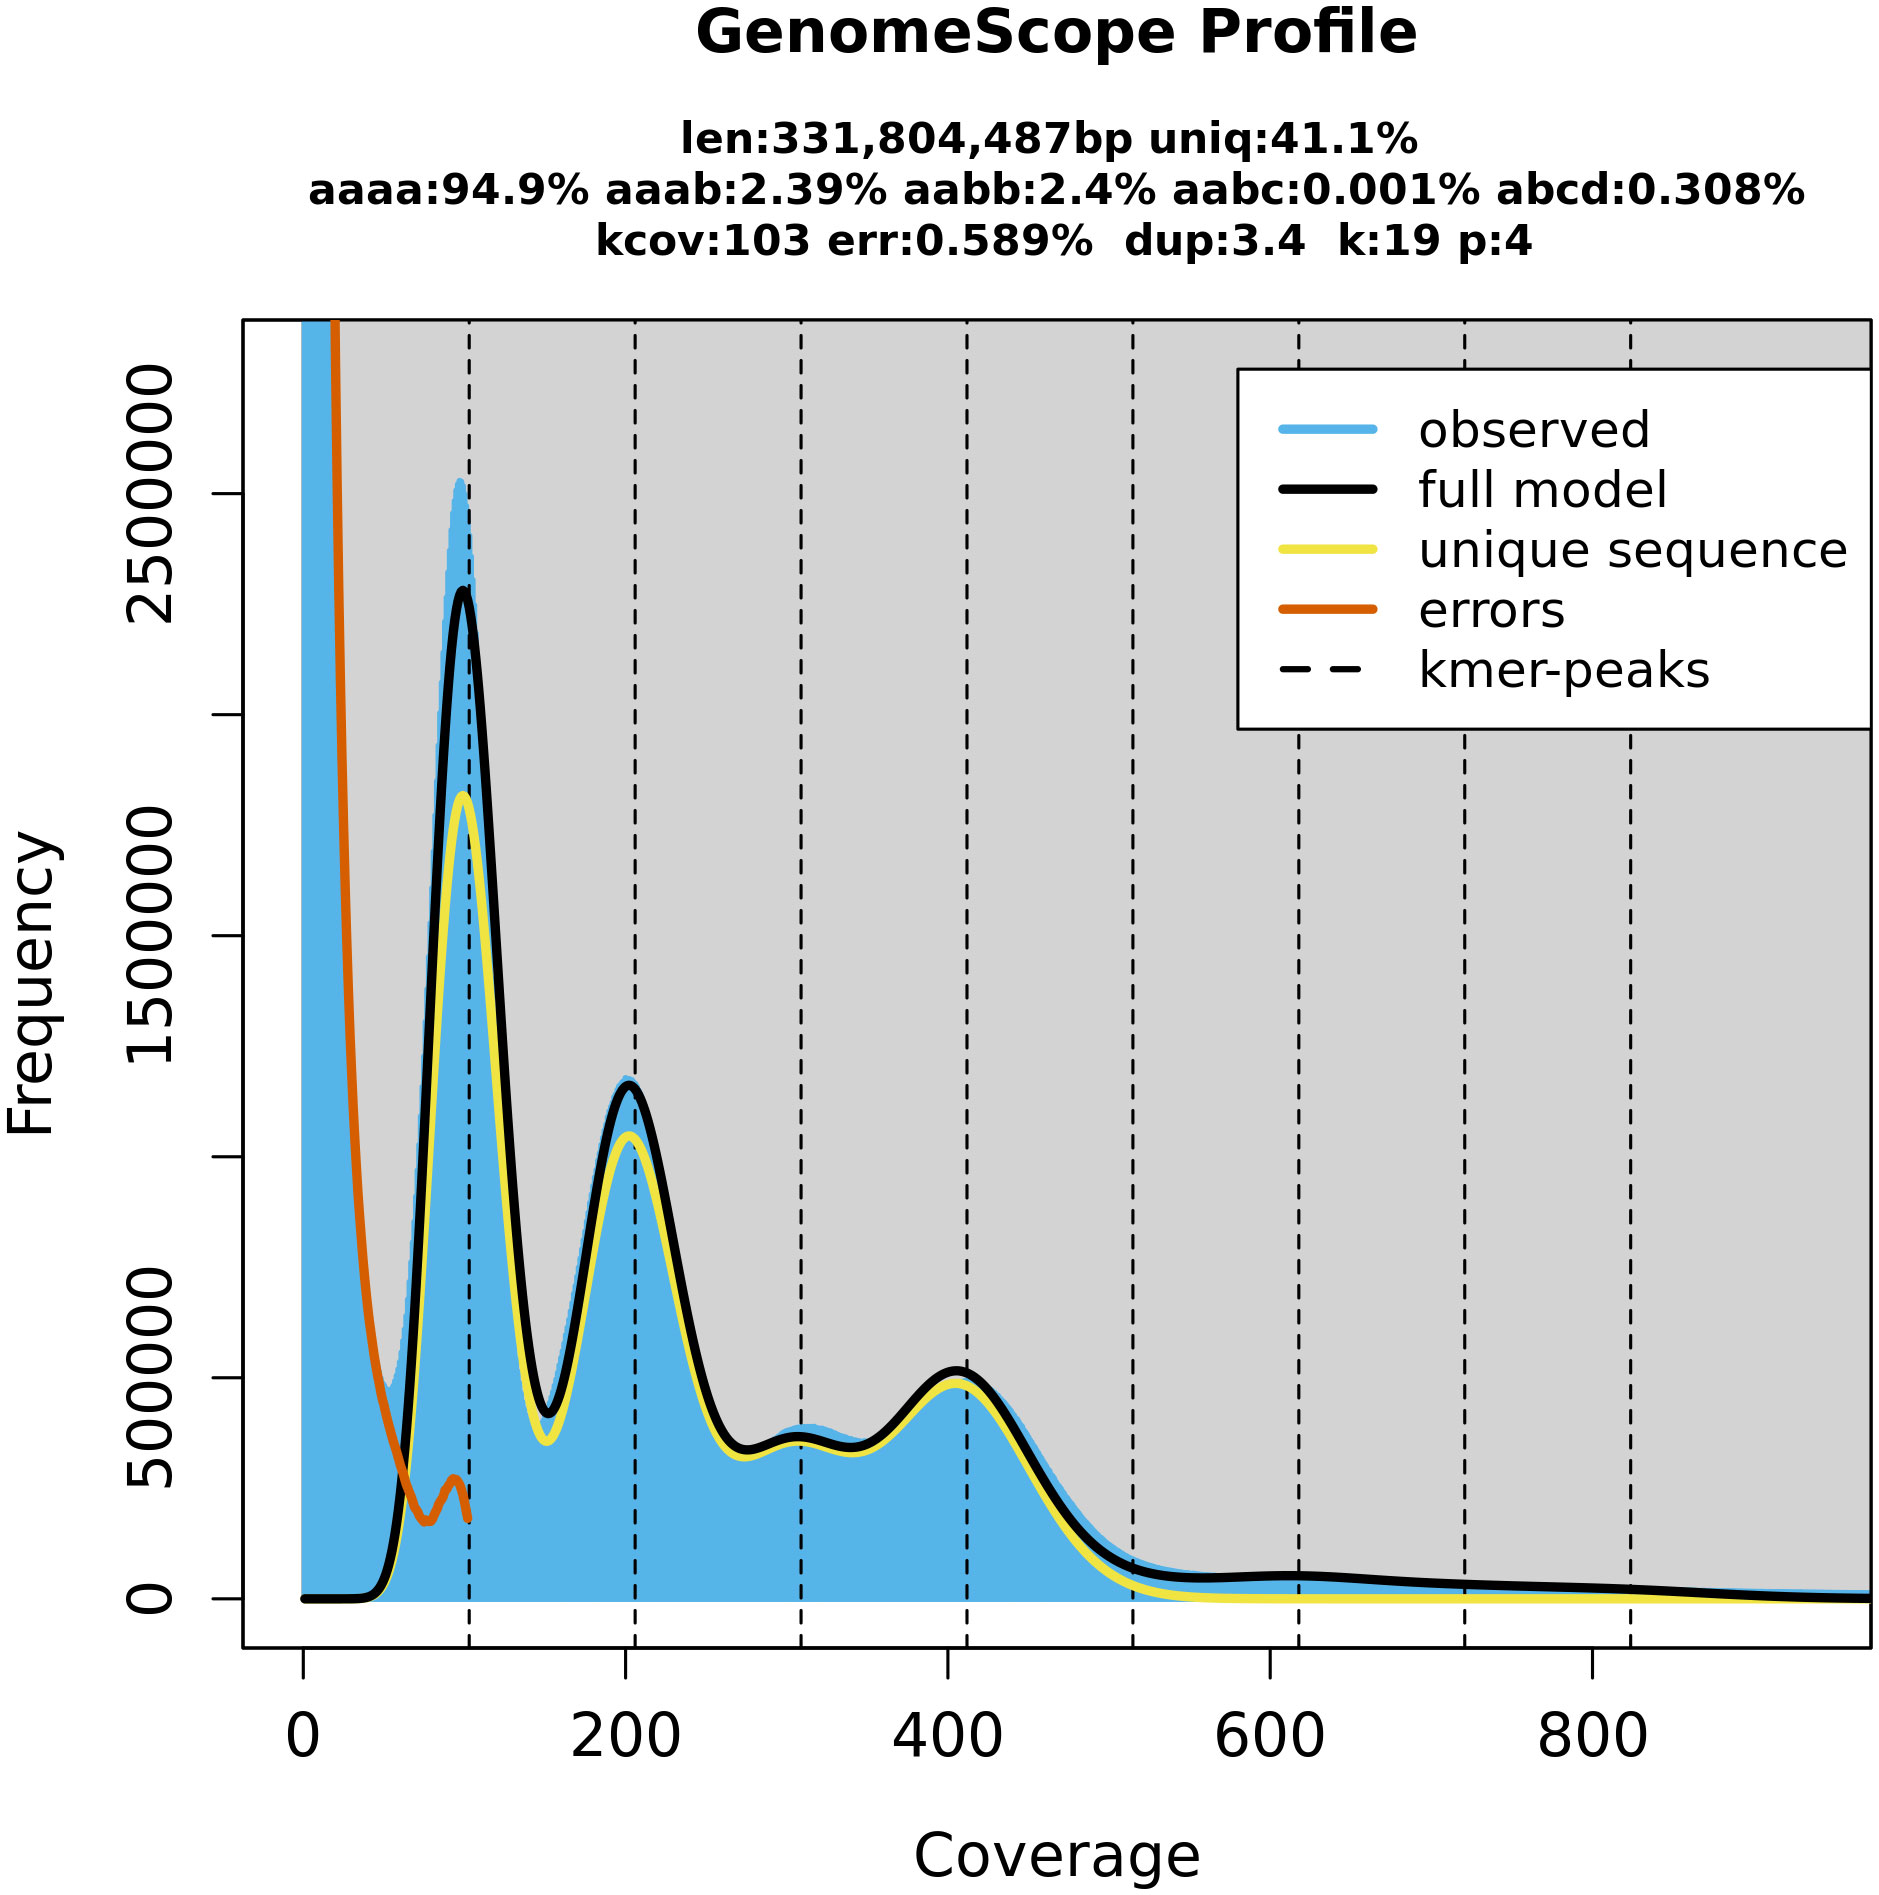
Figure 3 GenomeScope (Galaxy Version 2.0) estimation of the P. cerasus genome size by k-mer counts obtained from the software Meryl (Galaxy Version 1.3+galaxy2). Both programs are integrated on the GalaxyServerEurope. The k-mer peaks indicate that k-mers with a length of 19 bp occur in heterozygote (100× depth, 200× depth, 300× depth) and homozygote (400× depth) constitution within the genome. Coverage depth of individual k-mers is assigned as coverage.
Table 2A shows the general BUSCO statistics of transcriptomic data. A comparison of transcripts of PceS and the annotation datasets of PfeH and PaT enabled a quantitative comparison of shared transcripts within the datasets (Table 2B). A total number of 26,532 shared transcripts were found between the two subgenomes PceS_a and PceS_f and the genomes of PfeH and PaT. Thirty-eight percent of the P. cerasus proteins had a greater IAA to PfeH, whereas 54% showed a greater IAA to PaT. Eight percent showed an identical IAA to both ancestral species. A larger number of transcripts of both sour cherry subgenomes (Table 2B) were assigned to the annotation dataset of PfeH. A total of 13,425 transcripts from the PceS_a subgenome and 13,107 from the PceS_f subgenome were found in the genome sequences of PfeH and PaT. Seventy-five percent of the pool from the PceS_a subgenome showed a higher IAA to PaT and 17% to PfeH, while 59% from the pool originating from the PceS_f subgenome showed a higher IAA to PfeH and 32% to PaT.
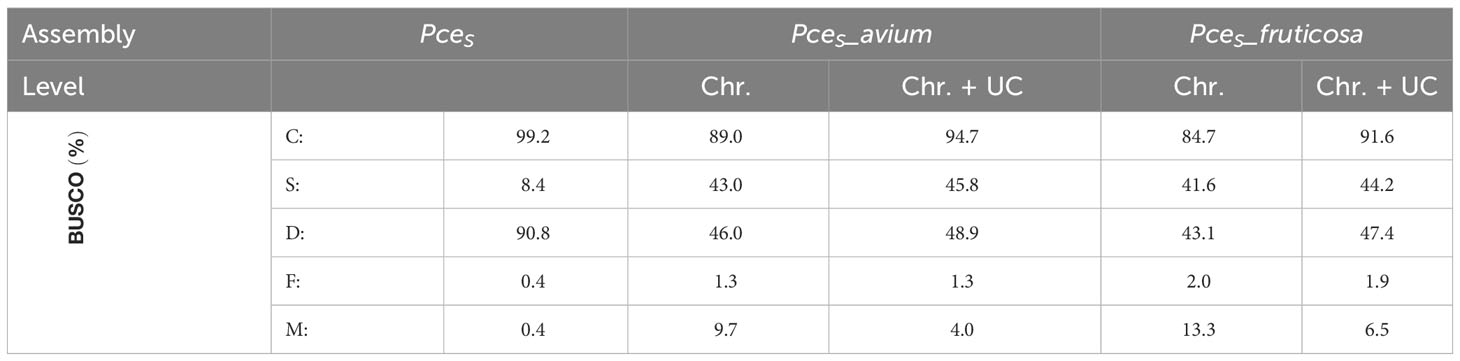
Table 2A BUSCO statistics of the transcriptomic data generated in this study (n:1614).
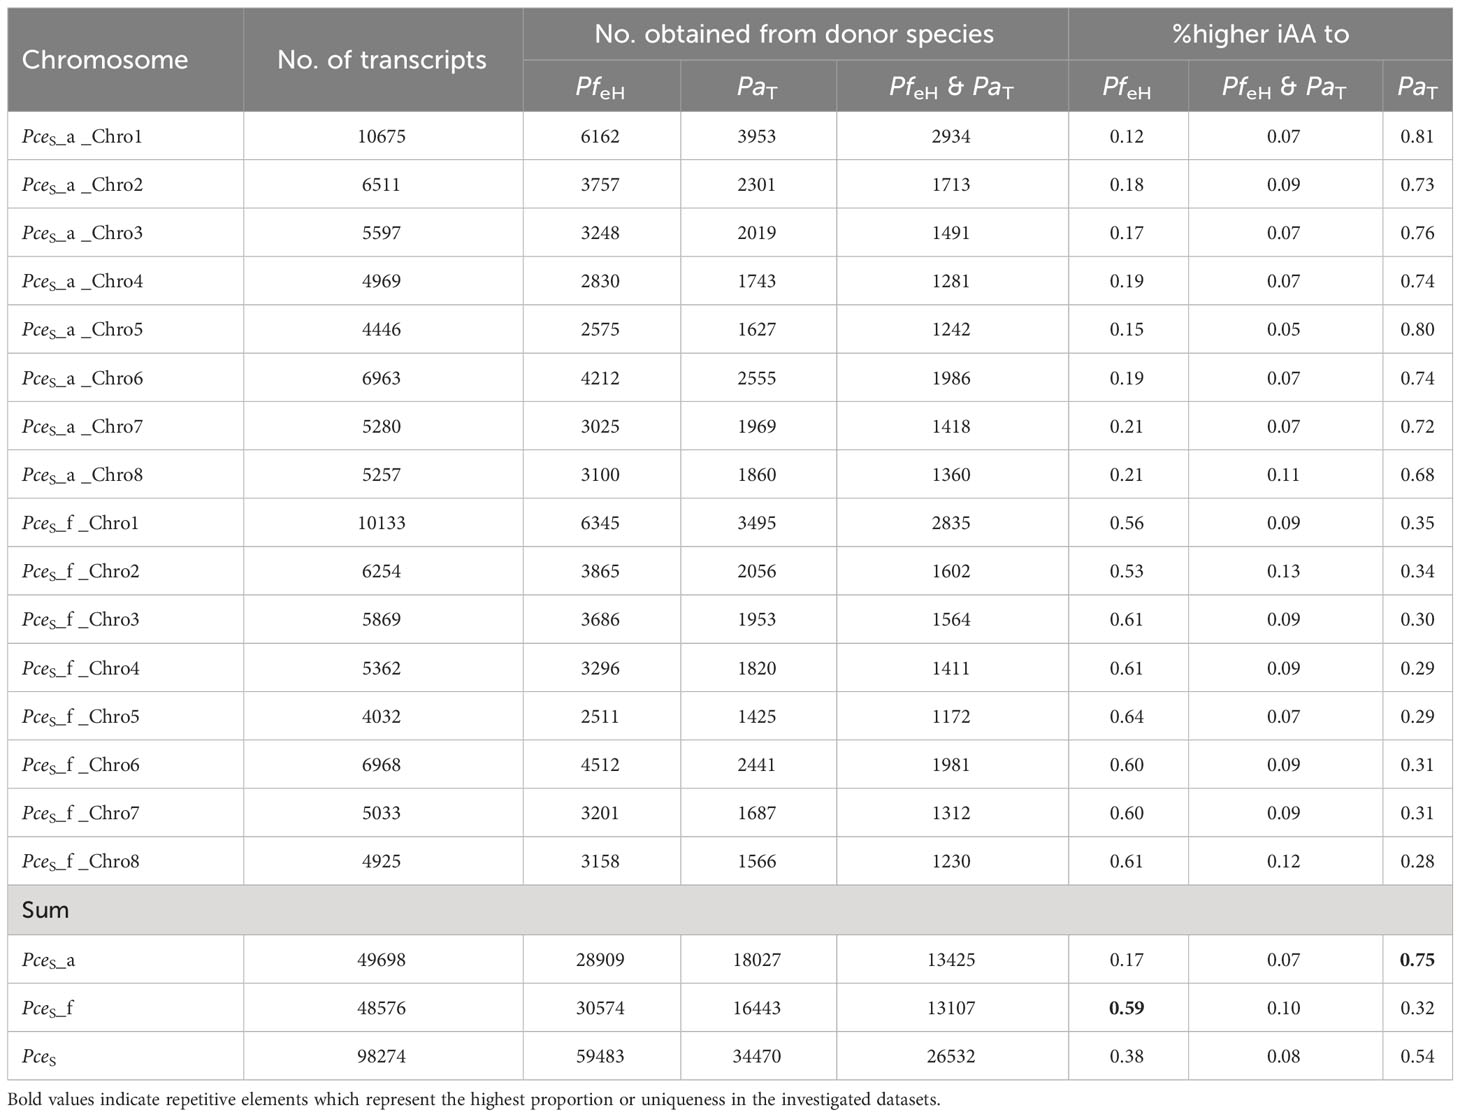
Table 2B Comparison between the number of transcripts and %-IAA obtained from P. fruticosa ecotype Hármashatárhegy PfeH and P. avium cv ‘Tieton’ PaT representing the two ancestral species of P. cerasus.
3.4 Identification of syntenic regions and inversions
The sequences of the two subgenomes PceS_a and PceS_f and the genotypes PaT and PfeH of the two ancestral species P. avium and P. fruticosa were screened for duplicated regions using DAGchainer as previously published for peach (International Peach Genome Initiative et al., 2013). The seven major triplicated regions were found nearly one to one in P. avium but not in P. fruticosa, which lacked regions 4 and 7 corresponding to International Peach Genome Initiative et al., 2013. P. avium and P. fruticosa seem to derive from the same paleohexaploid event like peach, but with a loss of the fourth and seventh paleoset of paralogs in P. fruticosa. The graphical analysis is summarized in Figure S8.
Thirteen inversions were detected through positional co-linearity comparison between the two subgenomes using the molecular markers from the 9 + 6k SNP array (Figure S9). Five inversions were found between subgenome PceS_a and the genome sequence of PaT. Eleven inversions were found between subgenome PceS_f and PfeH (Table S6). By comparing the position of amino acid sequences of orthologous proteins (synteny), we found 21 inversions when comparing PceS_f with PfeH. Only 7 were found between PceS_a and PaT and 16 were found between both subgenomes PceS_a and PceS_f (Figure S10).
3.5 Detection of de novo homoeologous exchanges
For the detection of de novo homoeologous exchanges, we used three approaches by comparing inter- and intraspecific %-covered bases (genomic and transcriptomic) and %-IAA between proteins of PceS to PaT and PfeH (Figure 4; Figure S11). PceS short reads were mapped against PaT and PfeH and only species specific reads (PaT and PfeH) were filtered into read subsets. The obtained read subsets were re-mapped against PceS_a and PceS_f and base coverage was calculated. A total of 1,024 regions (100k window) that were intraspecific %-covered bases from mapped reads (PceS_a to PaT, PceS_f to PfeH) and were less than interspecific %-covered bases from mapped reads (PceS_a to PfeH, PceS_f to PaT) were discovered. In a second approach, translocations between the two subgenomes were localized by short-read mapping analyses. Short-reads (RNAseq) from P. cerasus, P. avium, and P. fruticosa obtained from Bird et al. (2022) were mapped on PceS. A total of 148 regions whose intraspecific difference of %-covered bases from obtained RNAseq reads (Pa and PceS_a, Pf and PceS_f) was greater than the interspecific difference of %-covered bases from obtained RNAseq reads (Pf and PceS_a, Pa and PceS_f) indicated homoeologous exchanges between the two subgenomes. Finally, 367 regions in which the proportion of transcripts with intraspecific amino acid identity (PaT and PceS_a, PfeH and PceS_f) was less than the proportion of transcripts with interspecific amino acid identity (PfeH and PceS_a, PaT and PceS_f) were identified (Figure 4). Several regions were confirmed by calculating the 70% quantile of the IAA value within a window of 1-Mbp windows (Note S1). This confirms that there are transcripts in the PceS genome whose IAA to the homoeologous representative genome (PfeH) is greater than that to the homologous (PaT) representative. A total of 21 in PceS_a and 29 in PceS_f regions spanning 250k windows were finally identified that match all three criteria indicating de novo homoeologous exchanges within the subgenomes (Figure 4; Figure S11). No evidence for an introgression of other Prunus species was found (Note S1, Note S2). Using 14 reference species, 60,123 gene models were annotated. Almost the same number was assigned to the two P. cerasus subgenomes (Table 2B). No evidence was found for large introgressions from any of the reference species (Note S1, S3). By comparing the amino acid identity of the proteins of PaT and PfeH with the respective sour cherry subgenome, the identified translocations via read mapping could be confirmed. The majority of the transcripts (51%) could be assigned to the genotypes PaT and PfeH of the two ancestral species P. avium and P. fruticosa (Figure S7); 5.2% of the transcripts could not be assigned to any of the reference species. Only <1% of the transcripts could not be assigned to one of the ancestral species. They showed equivalent matches to both species and are probably a product of ab initio prediction. A total of 49,698 proteins in subgenome PceS_a and 48,576 proteins in PceS_f shared only 13,435 and 13,107 proteins with PaT and PfeH, respectively. A total of 75% of the proteins of subgenome PceS_a matched better to PaT compared to PfeH, whereas only 59% of PceS_f mapped better to PfeH than to PaT (Table 2B).
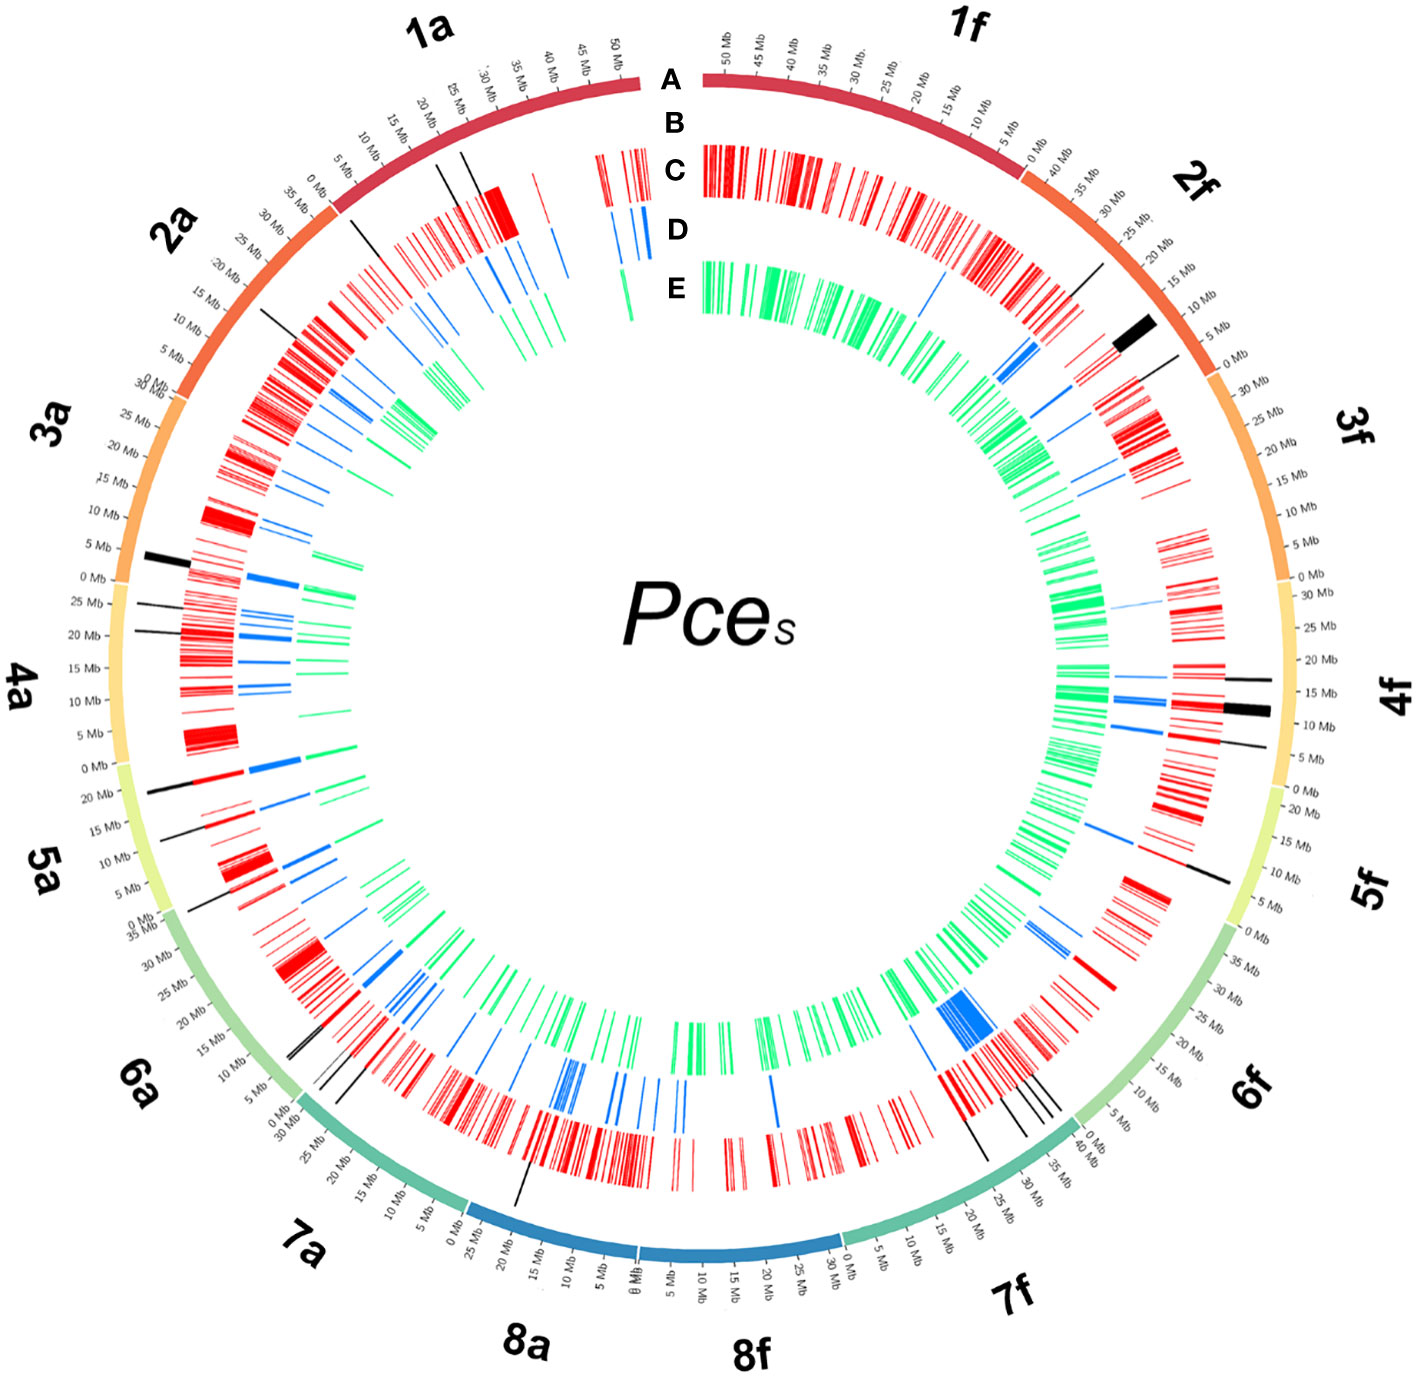
Figure 4 Detected regions of homoeologous exchanges in the genome of P. cerasus ‘Schattenmorelle’. Circos plot of 16 pseudomolecules of the subgenomes of PceS_a and PceS_f. (A) Chromosome length (Mb); (B) 16 in PceS_a and 12 in PceS_f detected regions that match all three following analysis methods: (C) 1,024 regions (100k window) were intraspecific %-covered bases from mapped reads (PceS_a to PaT, PceS_f to PfeH) was less than interspecific %-covered bases from mapped reads (PceS_a to PfeH, PceS_f to PaT); (D) 148 regions were intraspecific difference of %-covered bases from obtained RNAseq reads (Pa and PceS_a, Pf and PceS_f) greater than interspecific difference of %-covered bases from obtained RNAseq reads (Pf and PceS_a, Pa and PceS_f); (E) 367 regions were the proportion of transcripts with intraspecific amino acid identity (PaT and PceS_a, PfeH and PceS_f) less than the proportion of transcripts with interspecific amino acid identity (PfeH and PceS_a, PaT and PceS_f).
3.6 LTR dating and divergence of time estimation
The left and the right LTR identity of a subset of 2,385 (PceS_a), 3,028 (PceS_f), 3,130 (PaT), and 3,992 (PfeH) LTRs were analyzed. The homologous genomes shared 200 (PceS_a versus PaT) and 100 (PceS_f versus PfeH) LTRs whereas 12 LTRs were shared by PceS_a versus PfeH and PceS_f versus PaT. Only five common LTRs were found between PceS_a and PceS_f and 13 between PaT and PfeH. A summary of the LTRs’ insertion time is shown in Figure 5A. The youngest shared LTRs between PceS_a and PaT and between PceS_f and PfeH were calculated with 103,896.1 and 97,402.6 generations, respectively. When comparing the homoeologous chromosomes, the youngest shared LTRs between PaT and PfeH and between PceS_a and PceS_f were calculated with 116,883.1 and 194,805.2 generations, respectively. LTRs of PaT were also found in subgenome PceS_f and calculated with 207,792.2 generations. LTRs of PfeH were detected in subgenome of PceS_a and calculated with 149,350.6 generations. This indicates an exchange of LTRs between the two subgenomes. A total of 834 single-copy orthogroups among nine genomes were found and used for single protein alignments. Single alignments were concatenated and a final alignment with nine amino acid sequences representing each species with 419,586 amino acid positions was used for phylogenetic tree construction. Using the RelTime method, the estimated divergence time between the genera Malus and Prunus was 50.4 Mya. The species groups P. persica and P. mume diverged from the P. yedonensis/P. avium/P. fruticosa group 11.6 Mya. Based on this model, the divergence of the two subgenomes of P. cerasus compared to the genome sequences of PaT and PfeH was estimated with 2.93 Mya and 5.5 Mya respectively (Figure 5B).
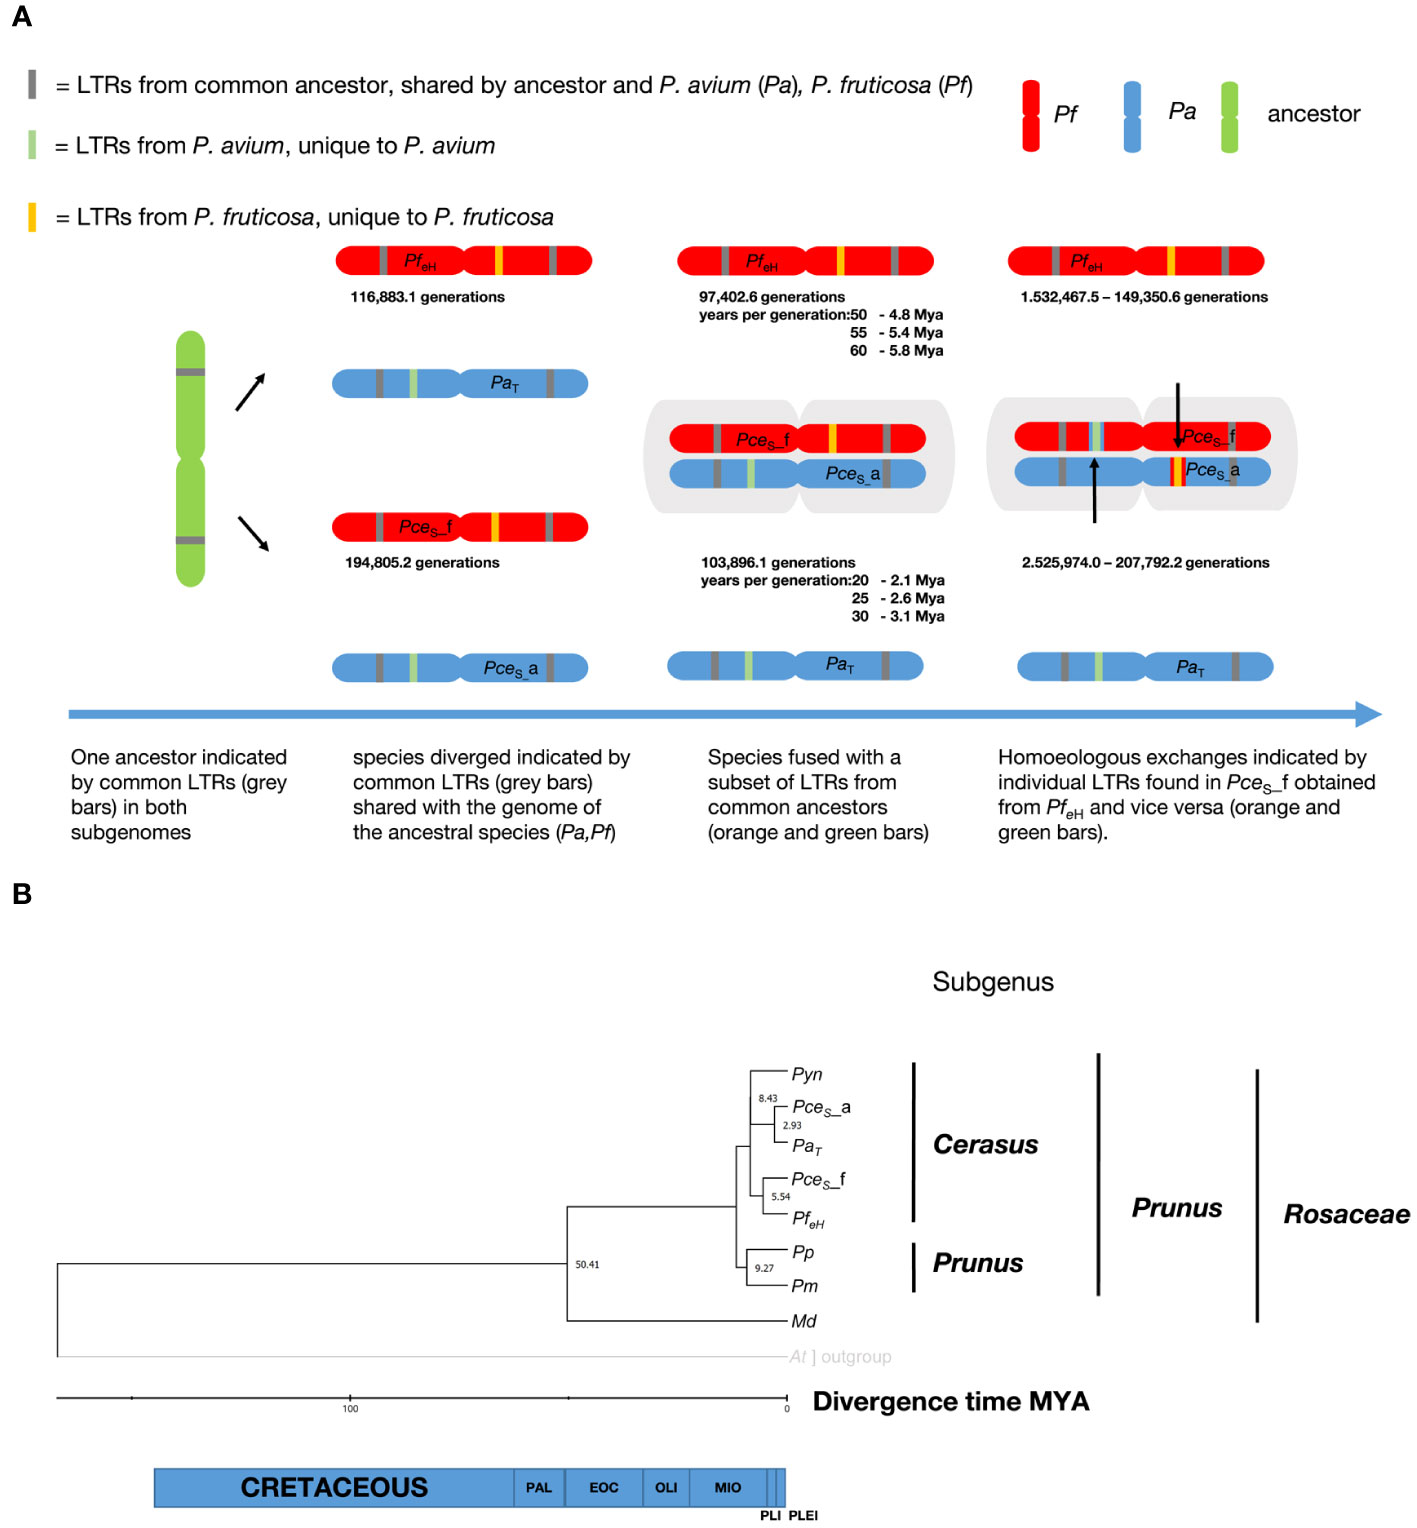
Figure 5 Investigation on the evolution of the genome of P. cerasus ‘Schattenmorelle’. (A) Determination of insertion time from shared long terminal repeats (LTRs) in P. cerasus subgenome avium (PceS_a) and P. cerasus subgenome fruticosa (PceS_f) compared to P. avium Tieton (PaT) and P. fruticosa ecotype Hármashatárhegy (PfeH). (B) Estimation of divergence of time (Mya) of P. cerasus subgenomes PceS_a and PceS_f compared to the donor species P. avium (Pa) and P. fruticosa (Pf). Prunus yedonensis (Pyn); Prunus avium (Pa); Prunus persica (Pp); Prunus mume (Pm); Malus domestica (Md); Paleocene (PAL); Eocene (EOC); Oligocene (OLI); Miocene (MIO); Pliocene (PlI); Pleistocene (PLEI).
4 Discussion
The genome of the economically most important sour cherry ‘Schattenmorelle’ in Europe was sequenced using a combination of Oxford Nanopore R9.4.1 PromethION long-read technology and Illumina NovaSeq™ short-read technology. After assignment of the long reads to the two subgenomes and Hi-C analysis, the final assembly was 629 Mbp and showed an overall acceptable contiguity of the subgenome P. avium to a recently published genome of P. cerasus Montmorency - PceM (Goeckeritz et al., 2023). Larger differences were found between the haplotypes of P. fruticosa, which was expected (Note S4). This sequence was used to study structural changes present in the allotetraploid sour cherry genome after its emergence. Therefore, the sour cherry genome sequence was compared to the published genome sequences of Prunus avium Tieton (PaT, Wang et al., 2020) and Prunus fruticosa ecotype Hármashatárhegy (PfeH, Wöhner et al., 2021) representing genotypes of the two ancestral species. The size of the subgenome PceS originating from P. avium was 269 Mbp. A similar genome size (271 Mbp) is described for the Prunus avium Big Star (Pinosio et al., 2020) and Sato Nishiki (Shirasawa et al., 2017). Larger differences were found in Regina with 279 Mbp and Tieton with 344 Mbp (Le Dantec et al., 2018; Wang et al., 2020). Differences were also found between the size of subgenome PceS_f (299 Mbp) and the genome of the ground cherry genotype P. fruticosa ecotype Hármashatárhegy (366 Mbp, Wöhner et al., 2021). These differences indicate a reduction of the subgenome PceS_a by 0.49%–21%, whereas for subgenome PceS_f, a reduction of 18.29% was found. This was further confirmed by a reduced genome size of the recently published subgenome sequences of PceM (Table 3) published by Goeckeritz et al. (2023). The reduction in genome size for allotetraploid species in comparison to their ancestral genomes was reported for Nicotiana tabacum (1.9%–14.3%) and Gossypium species (Leitch et al., 2008; Hawkins et al., 2009; Renny-Byfield et al., 2011), with an overall downsizing rate for angiosperms calculated as 0%–30% (Zenil-Ferguson et al., 2016). Genome downsizing in response to a genome hybridization event can be explained with evolutionary advantages, which give these species with smaller genomes a selection advantage in the long term (Knight et al., 2005; Zenil-Ferguson et al., 2016). Although downsizing of the P. cerasus subgenomes is most probable, enlargement and expansion of the genomes of ancestral species during evolution would be another possibility. However, an increase in genome size during the evolution of a species has only rarely been documented (Jakob et al., 2004; Leitch et al., 2008; Kim et al., 2014). BUSCO analysis provides additional evidence for the reduction of genome size. Although the number of genes does not correlate with genome size in eukaryotes (Pierce, 2012), differences between the ancestral genomes and sour cherry could be observed when looking at BUSCO completeness (Table 3). Considering both subgenomes and the genomes of PaT and PfeH, a completeness of >96.4% was obtained. However, the completeness of the single subgenomes was only 89.4% for PceS_a and 87.1% for PceS_f. This could also be observed for PceM (Table 3). Comparisons (Note S5) within the subgenomes of PceS and PceM showed a loss between 2.4% and 6.4% of BUSCOs (NoteS5, A), between 0.6% and 0.7% when comparing the subgenomes of PceS and PceM (Note S5, B), and between 3.3% and 6.9% between the subgenomes of PceS and PceM (Note S5, C) and the representing ancestral genomes (PaT and PfeH). Structural differences between the P. cerasus subgenomes and the genomes of PaT and PfeH were also found by comparing the number of repetitive elements. While the content of repetitive elements differs by only 0.86% between PfeH and PceS_f, it is 17.8% between PaT and PceS_a. Whether this is a consequence of hybridization remains speculative and would deserve further studies. An increase of class I elements Gypsy from 6% in the PaT genome to 7.3% in subgenome PceS_a indicates an expansion of this class following the formation of the sour cherry genome or a possible reduction of non-repetitive sequences in the corresponding subgenome resulting in a smaller genome size.
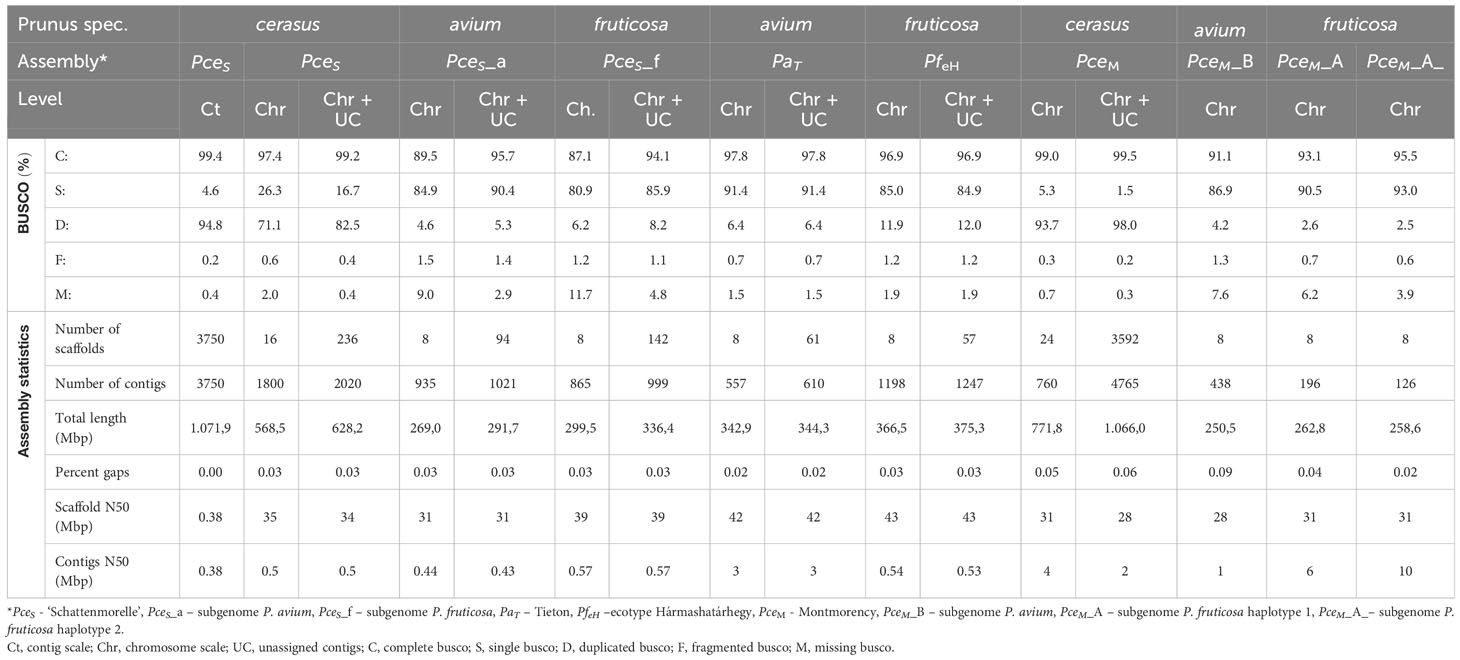
Table 3 BUSCO and assembly statistics of the genomic data generated in this study and comparative datasets (n:1614).
A comparison of syntenic regions showed a high degree of collinearity between PceS, PaT, and PfeH genomes (Figure 2; Figures S8, S9), with single inversions between the respective chromosome pairs. Using the genome of P. persica, seven triplicated regions were detected in PceS_a, confirming that these genomes descend from a palaeohexploid ancestor. However, the triplicated regions 4 and 7 in PceS_f were only detected in highly fragmented form or have been lost. Hao et al. (2022), who described a rapid loss of homoeologs immediately after polyploidy events, described a similar finding. Based on Ranallo-Benavidez et al. (2020), the results from the k-mer analysis confirm that the genome of sour cherry can be considered as highly heterozygous and segmental allotetraploid. Furthermore, genomes of segmental allopolyploids may possess a mix of auto- and allopolyploid segments through duplication–deletion events as a result of homoeologous exchanges leading to either reciprocal translocations or homoeologous non-reciprocal translocations (Mason and Wendel, 2020). Whereas autotetraploids have an aaab > aabb rate, allotetraploids are considered to have aaab < aabb. The near identical rate between aaab and aabb in PceS provides strong evidence that the sour cherry is a segmental mix of auto- and allotetraploidy.
Due to this assumption of segmental allotetraploidy, homoeologous recombination between homoeologous chromosomes is very likely. This is confirmed by the coverage and amino acid identity analyses. Homoeologous exchange events between the chromosomes of subgenome PceS_a and PceS_f were detected (Figure 4; Figure S11). These exchanges are not balanced but probably a product of a duplication/deletion event as described by Mason and Wendel (2020), generating the proposed mosaic of genomic regions representing one or the other subgenome. In this study, we found 14 homoeologous exchanges in PceS_a and 3 in PceS_f within one assembled contig obtained from the primary assembly 20-WGS-PCE.1.0 and 33 spanning multiple contigs (Note S6). Whether these regions were a result of incorrect assembly was not investigated and could be part of future studies.
Evidence that subgenome PceS_a seems to be closer to PaT than PceS_f to PfeH was found. This was confirmed by an evolutionary approach that calculated the separation of the subgenome PceS_f from P. fruticosa 5.5 Mya, while subgenome PceS_a separated from P. avium 2.93 Mya (Figure 5B).
To validate these results, the insertion events of long terminal repeats between P. avium, P. fruticosa, and the subgenomes were calculated. Assuming a Prunus-specific rate of 7.7 × 10⁻⁹ mutations per generation (Xie et al., 2016), LTRs of the same type with the same insertion time were identified in the same positional order in the different (sub)genomes. The most recent co-occurring LTRs between the genomes of PaT and PfeH could be dated at 116,883.1 generations. Exact data on the duration of the generation time of Prunus species in natural habitats do not exist. Although the juvenile phase of many Prunus species is usually completed after 5 years (Besford et al., 1996), it can be assumed that the times for a generation are considerably higher. Many fruit species are hardly or not at all able to rejuvenate by seeds under natural conditions (Coart et al., 2003), or they rejuvenate mainly by root suckers (Li et al., 2022). Other studies on Prunus therefore assume a duration of 10 years per generation (Wang et al., 2021), although even this seems rather too little.
Assuming that a generation change is to be expected after 10 to 60 years (Besford et al., 1996), this would correspond to a time period of ~1 to 6 Mya. The youngest co-occurring LTR could be estimated at 1.9 Mya. This suggests that P. fruticosa and P. avium probably shared a gene pool between ~1 Mya and 2 Mya. It should be noted that this estimate can vary greatly depending on the number of years per generation used in the calculation (Figure 5A). Based on the results of the protein dating, a generation time of 30 years is more likely for P. avium. For P. fruticosa, which occurs less frequently in natural habitats and reproduces mainly via root suckers, the generation time seems to be somewhat longer at 55 to 60 years. Some LTRs present in PaT, but absent in PfeH, were found in subgenome PceS_f only and vice versa. Other class I elements (LTR - ERV1, Pao) and Academ/-2 were specifically detected in one of the two genotypes PaT and PfeH representing the two ancestral species of sour cherry and in PceS_a and PceS_f, which indicates a transfer of these elements between the two subgenomes following the formation of the allotetraploid P. cerasus genome. This is a further indication for a segmental exchange between the two sour cherry subgenomes. Mason and Wendel (2020) speculated that unidirectional homoeologous exchange was observed in recent or synthetic allopolyploids. However, our results confirm this hypothesis by the evidence that sour cherry is a recent allopolyploid with autopolyploid segments derived from unidirectional homoeologous exchanges.
5 Conclusion
Sequencing of the genome of the European sour cherry cv. ‘Schattenmorelle’ has provided strong evidence that it is indeed a segmental allotetraploid consisting of two subgenomes, one derived from the sweet cherry P. avium and one from the ground cherry P. fruticosa. DNA sequences have been repeatedly exchanged between the two subgenomes. Our findings differ slightly from the recently sequenced genome of Montmorency—the sour cherry cultivar predominant in the US (Goeckeritz et al., 2023). Although Montmorency was shown to possess two subgenomes inherited from P. avium and P. fruticosa, it inherited two copies of the same subgenome from the former and two distinct subgenomes from the latter, making it trigenomic (Goeckeritz et al., 2023). We could not show that ‘Schattenmorelle’ is trigenomic. This discrepancy between both studies could be attributed to the sequencing technologies used. Whereas we used Illumina and Oxford Nanopore long read, Goeckeritz et al. (2023) used PacBio Sequel II. At the same time, a reduction in genome size has taken place. Other Prunus species have not contributed to the evolution of this species. No evidence was found for introgressions in the sour cherry genome derived from Prunus species other than P. avium and P. ‘Schattenmorelle’ approximately 1 Mya at the earliest.
Data availability statement
The datasets presented in this study can be found in online repositories. The names of the repository/repositories and accession number(s) can be found in the article/Supplementary Material.
Author contributions
TW: Conceptualization, Data curation, Formal Analysis, Investigation, Methodology, Project administration, Software, Supervision, Writing – original draft, Writing – review & editing. OE: Conceptualization, Validation, Writing – original draft, Writing – review & editing. AW: Conceptualization, Data curation, Investigation, Methodology, Project administration, Software, Validation, Writing – original draft. KN: Data curation, Investigation, Methodology, Software, Writing – original draft. RW: Data curation, Investigation, Methodology, Software, Writing – original draft. E-JB: Data curation, Investigation, Methodology, Software, Writing – original draft. HS: Data curation, Investigation, Methodology, Software, Writing – original draft. JK: Conceptualization, Data curation, Investigation, Methodology, Software, Writing – original draft. TB: Data curation, Investigation, Writing – review & editing. KH: Conceptualization, Investigation, Methodology, Software, Writing – original draft. LG: Data curation, Investigation, Methodology, Software, Writing – original draft. HT: Investigation, Methodology, Software, Writing – original draft. OA: Conceptualization, Methodology, Software, Writing – review & editing. LB: Conceptualization, Validation, Writing – review & editing. MS: Conceptualization, Validation, Writing – review & editing. JL: Formal Analysis, Software, Writing – original draft. AP: Conceptualization, Validation, Writing – original draft, Writing – review & editing. HF: Conceptualization, Supervision, Validation, Writing – original draft, Writing – review & editing.
Funding
The author(s) declare that no financial support was received for the research, authorship, and/or publication of this article.
Acknowledgments
We would acknowledge the Galaxy Europe, Galaxy USA server administration for support and provision of resources. Special thanks to Eric Lyon for support with Synmap2.
Conflict of interest
Authors AW, KN, RW, E-JB and HS were employed by company KeyGene N.V.
The remaining authors declare that the research was conducted in the absence of any commercial or financial relationships that could be construed as a potential conflict of interest.
Publisher’s note
All claims expressed in this article are solely those of the authors and do not necessarily represent those of their affiliated organizations, or those of the publisher, the editors and the reviewers. Any product that may be evaluated in this article, or claim that may be made by its manufacturer, is not guaranteed or endorsed by the publisher.
Supplementary material
The Supplementary Material for this article can be found online at: https://www.frontiersin.org/articles/10.3389/fpls.2023.1284478/full#supplementary-material
References
Beaver, J. A., Iezzoni, A. F. (1993). Allozyme Inheritance in Tetraploid Sour Cherry (Prunus cerasus L.), jashs. Available at: https://journals.ashs.org/jashs/view/journals/jashs/118/6/article-p873.xml.
Bertioli, D. J., Jenkins, J., Clevenger, J., Dudchenko, O., Gao, D., Seijo, G., et al. (2019). The genome sequence of segmental allotetraploid peanut Arachis hypogaea. Nat. Genet. 51, 877–884. doi: 10.1038/s41588-019-0405-z
Besford, R. T., Hand, P., Peppitt, S. D., Richardson, C. M., Thomas, B. (1996). Phase change in Prunus avium: differences between juvenile and mature shoots identified by 2-dimensional protein separation and in vitro translation of mRNA. J. Plant Physiol. 147 (5), 534–538.
Bird, K. A., Jacobs, M., Sebolt, A., Rhoades, K., Alger, E. I., Colle, M., et al. (2022). Parental origins of the cultivated tetraploid sour cherry (Prunus cerasus L.). Plants People Planet 4, 444–450. doi: 10.1002/ppp3.10267
Brůna, T., Hoff, K. J., Lomsadze, A., Stanke, M., Borodovsky, M. (2021). BRAKER2: automatic eukaryotic genome annotation with GeneMark-EP+ and AUGUSTUS supported by a protein database. NAR Genom Bioinform. 3, lqaa108. doi: 10.1093/nargab/lqaa108
Brůna, T., Lomsadze, A., Borodovsky, M. (2020). GeneMark-EP+: eukaryotic gene prediction with self-training in the space of genes and proteins. NAR Genom Bioinform. 2, lqaa026. doi: 10.1093/nargab/lqaa026
Cai, L., Stegmeir, T., Sebolt, A., Zheng, C., Marco, C. A. M., Iezzoni, A. (2018). Identification of bloom date QTLs and haplotype analysis in tetraploid sour cherry (Prunus cerasus). Tree Genet. Genomes 14, 1–11. doi: 10.1007/s11295-018-1236-2
Coart, E., Vekemans, X., Smulders, M. J. M., Wagner, I., van Huylenbroeck, J., van Bockstaele, E., et al. (2003). Genetic variation in the endangered wild apple (Malus sylvestris (L.) Mill.) in Belgium as revealed by amplified fragment length polymorphism and microsatellite markers. Mol. Ecol. 12, 845–857. doi: 10.1046/j.1365-294X.2003.01778.x
Cock, P. J. A., Grüning, B. A., Paszkiewicz, K., Pritchard, L. (2013). Galaxy tools and workflows for sequence analysis with applications in molecular plant pathology. PeerJ 1, e167. doi: 10.7717/peerj.167
Dirlewanger, E., Claverie, J., Wünsch, A., Iezzoni, A. F. (2007). Cherry, Fruits and Nuts. (Berlin, Heidelberg: Springer), 103–118.
Edger, P. P., Poorten, T. J., VanBuren, R., Hardigan, M. A., Colle, M., McKain, M. R., et al. (2019). Origin and evolution of the octoploid strawberry genome. Nat. Genet. 51, 541–547. doi: 10.1038/s41588-019-0356-4
Flynn, J. M., Hubley, R., Goubert, C., Rosen, J., Clark, A. G., Feschotte, C., et al. (2020). RepeatModeler2 for automated genomic discovery of transposable element families. Proc. Natl. Acad. Sci. U.S.A. 117, 9451–9457. doi: 10.1073/pnas.1921046117
Gabriel, L., Hoff, K. J., Brůna, T., Borodovsky, M., Stanke, M. (2021). TSEBRA: transcript selector for BRAKER. BMC Bioinf. 22, 566. doi: 10.1186/s12859-021-04482-0
Goeckeritz, C. Z., Rhoades, K. E., Childs, K. L., Iezzoni, A. F., VanBuren, R., Hollender, C. A. (2023). Genome of tetraploid sour cherry (Prunus cerasus L.)’Montmorency’ identifies three distinct ancestral Prunus genomes. Horticult. Res. 10 (7), uhad097. doi: 10.1093/hr/uhad097
Hancock, J. F. (2008). “Temperate Fruit Crop Breeding,” in Germplasm to Genomics (Dordrecht: Springer Science+Business Media B.V).
Hao, Y., Fleming, J., Petterson, J., Lyons, E., Edger, P. P., Pires, J. C., et al. (2022). Convergent evolution of polyploid genomes from across the eukaryotic tree of life. G3 (Bethesda Md.) 12 (6), 1–14. doi: 10.1093/g3journal/jkac094
Haug-Baltzell, A., Stephens, S. A., Davey, S., Scheidegger, C. E., Lyons, E. (2017). SynMap2 and SynMap3D: web-based whole-genome synteny browsers. Bioinformatics 33, 2197–2198. doi: 10.1093/bioinformatics/btx144
Hawkins, J. S., Proulx, S. R., Rapp, R. A., Wendel, J. F. (2009). Rapid DNA loss as a counterbalance to genome expansion through retrotransposon proliferation in plants. Proc. Natl. Acad. Sci. U. S. A. 106, 17811–17816. doi: 10.1073/pnas.0904339106
Hoff, K. J. (2019). MakeHub: fully automated generation of UCSC genome browser assembly hubs. Genomics, Proteomics & Bioinformatics 17 (5), 546–549. doi: 10.1016/j.gpb.2019.05.003
Hoff, K. J., Lange, S., Lomsadze, A., Borodovsky, M., Stanke, M. (2016). BRAKER1: unsupervised RNA-seq-based genome annotation with geneMark-ET and AUGUSTUS. Bioinformatics 32, 767–769. doi: 10.1093/bioinformatics/btv661
Hoff, K. J., Lomsadze, A., Borodovsky, M., Stanke, M. (2019). “Whole-Genome Annotation with BRAKER,” in Gene Prediction (New York, NY: Humana), 65–95.
Hrotkó, K., Feng, Y., Halász, J. (2020). Spontaneous hybrids of Prunus fruticosa Pall. in Hungary. Genet. Resour Crop Evol. 67, 489–502. doi: 10.1007/s10722-019-00847-w
Hunter, S., Apweiler, R., Attwood, T. K., Bairoch, A., Bateman, A., Binns, D., et al. (2009). InterPro: the integrative protein signature database. Nucleic Acids Res. 37, D211–D215. doi: 10.1093/nar/gkn785
International Peach Genome Initiative, Verde, I., Abbott, A. G., Scalabrin, S., Jung, S., Shu, S., et al. (2013). The high-quality draft genome of peach (Prunus persica) identifies unique patterns of genetic diversity, domestication and genome evolution. Nature Genetics 45, 487–494. doi: 10.1038/ng.2586
Jakob, S. S., Meister, A., Blattner, F. R. (2004). The considerable genome size variation of Hordeum species (poaceae) is linked to phylogeny, life form, ecology, and speciation rates. Mol. Biol. Evol. 21, 860–869. doi: 10.1093/molbev/msh092
Jo, Y., Chu, H., Cho, J. K., Choi, H., Lian, S., Cho, W. K. (2015). De novo transcriptome assembly of a sour cherry cultivar, Schattenmorelle. Genomics Data 6, 271–272. doi: 10.1016/j.gdata.2015.10.013
Jones, P., Binns, D., Chang, H.-Y., Fraser, M., Li, W., McAnulla, C., et al. (2014). InterProScan 5: genome-scale protein function classification. Bioinformatics 30, 1236–1240. doi: 10.1093/bioinformatics/btu031
Keilwagen, J., Hartung, F., Grau, J. (2019). “GeMoMa: Homology-Based Gene Prediction Utilizing Intron Position Conservation and RNA-seq Data,” in Gene Prediction (New York, NY: Humana), 161–177.
Keilwagen, J., Lehnert, H., Berner, T., Badaeva, E., Himmelbach, A., Börner, A., et al. (2022). Detecting major introgressions in wheat and their putative origins using coverage analysis. Sci. Rep. 12 (1), 1908.
Keilwagen, J., Wenk, M., Erickson, J. L., Schattat, M. H., Grau, J., Hartung, F. (2016). Using intron position conservation for homology-based gene prediction. Nucleic Acids Res. 44, e89. doi: 10.1093/nar/gkw092
Kim, D., Paggi, J. M., Park, C., Bennett, C., Salzberg, S. L. (2019). Graph-based genome alignment and genotyping with HISAT2 and HISAT-genotype. Nat. Biotechnol. 37, 907–915. doi: 10.1038/s41587-019-0201-4
Kim, S., Park, M., Yeom, S.-I., Kim, Y.-M., Lee, J. M., Lee, H.-A., et al. (2014). Genome sequence of the hot pepper provides insights into the evolution of pungency in Capsicum species. Nat. Genet. 46, 270–278. doi: 10.1038/ng.2877
Knight, C. A., Molinari, N. A., Petrov, D. A. (2005). The large genome constraint hypothesis: Evolution, ecology and phenotype. Annals of Botany 95, 177–190.
Kobel, F. (1927). Zytologische Untersuchungen an Prunoideen und Pomoideen. Institut Orell Füssli, 1–84.
Kriventseva, E. V., Kuznetsov, D., Tegenfeldt, F., Manni, M., Dias, R., Simão, F. A., et al. (2019). OrthoDB v10: sampling the diversity of animal, plant, fungal, protist, bacterial and viral genomes for evolutionary and functional annotations of orthologs. Nucleic Acids Res. 47, D807–D811. doi: 10.1093/nar/gky1053
Kumar, S., Stecher, G., Li, M., Knyaz, C., Tamura, K. (2018). MEGA X: molecular evolutionary genetics analysis across computing platforms. Mol. Biol. Evol. 35 (6), 1547.
Langmead, B., Salzberg, S. L. (2012). Fast gapped-read alignment with Bowtie 2. Nat. Methods 9, 357–359. doi: 10.1038/nmeth.1923
Le Dantec, L., Girollet, N., Fouché, M., Gouzy, J., Sallet, E., Quero-Garcia, J., et al. (2018). A High Quality Draft Assembly of the Diploid ‘Regina’Sweet Cherry Genome. Plant & Animal Genome Conference XXVI, Jan 2018, San Diego, United States. Available at: https://hal.science/hal-01865005.
Leitch, I. J., Hanson, L., Lim, K. Y., Kovarik, A., Chase, M. W., Clarkson, J. J., et al. (2008). The ups and downs of genome size evolution in polyploid species of Nicotiana (Solanaceae). Ann. Bot. 101, 805–814. doi: 10.1093/aob/mcm326
Li, H. (2016). Minimap and miniasm: fast mapping and de novo assembly for noisy long sequences. Bioinformatics 32, 2103–2110. doi: 10.1093/bioinformatics/btw152
Li, H. (2018). Minimap2: pairwise alignment for nucleotide sequences. Bioinformatics 34, 3094–3100. doi: 10.1093/bioinformatics/bty191
Li, L., Chen, M., Zhang, X., Jia, X. (2022). Spatial Distribution Pattern of Root Sprouts under the Canopy of Malus sieversii in a Typical River Valley on the Northern Slopes of the Tianshan Mountain. Forests 13, 2044. doi: 10.3390/f13122044
Li, H., Handsaker, B., Wysoker, A., Fennell, T., Ruan, J., Homer, N., et al. (2009). The sequence alignment/map format and SAMtools. Bioinformatics 25, 2078–2079. doi: 10.1093/bioinformatics/btp352
Lomsadze, A., Burns, P. D., Borodovsky, M. (2014). Integration of mapped RNA-Seq reads into automatic training of eukaryotic gene finding algorithm. Nucleic Acids Res. 42, e119. doi: 10.1093/nar/gku557
Macková, L., Vít, P., Urfus, T. (2018). Crop-to-wild hybridization in cherries-Empirical evidence from Prunus fruticosa. Evolution. Appl. 11, 1748–1759. doi: 10.1111/eva.12677
Mason, A. S., Wendel, J. F. (2020). Homoeologous exchanges, segmental allopolyploidy, and polyploid genome evolution. Front. Genet. 11. doi: 10.3389/fgene.2020.01014
Oldén, E. J., Nybom, N. (1968). ON THE ORIGIN OF PRUNUS CERASUS L. Hereditas 59, 327–345. doi: 10.1111/j.1601-5223.1968.tb02181.x
Ou, S., Chen, J., Jiang, N. (2018). Assessing genome assembly quality using the LTR Assembly Index (LAI). Nucleic Acids Res. 46, e126. doi: 10.1093/nar/gky730
Ou, S., Su, W., Liao, Y., Chougule, K., Agda, J. R. A., Hellinga, A. J., et al. (2019). Benchmarking transposable element annotation methods for creation of a streamlined, comprehensive pipeline. Genome Biol. 20, 275. doi: 10.1186/s13059-019-1905-y
Pinosio, S., Marroni, F., Zuccolo, A., Vitulo, N., Mariette, S., Sonnante, G., et al. (2020). A draft genome of sweet cherry (Prunus avium L.) reveals genome-wide and local effects of domestication. Plant J. 103, 1420–1432. doi: 10.1111/tpj.14809
Potter, D., Eriksson, T., Evans, R. C., Oh, S., Smedmark, J. E. E., Morgan, D. R., et al. (2007). Phylogeny and classification of rosaceae. Plant Syst. Evol. 266, 5–43. doi: 10.1007/s00606-007-0539-9
Quero-García, J., Iezzoni, A., López-Ortega, G., Peace, C., Fouché, M., Dirlewanger, E., et al. (2019). “Advances and challenges in cherry breeding,” in Achieving sustainable cultivation of temperate zone tree fruits and berries (Cambridge, UK: Burleigh Dodds Science Publishing), 55–88.
Quevillon, E., Silventoinen, V., Pillai, S., Harte, N., Mulder, N., Apweiler, R., et al. (2005). InterProScan: protein domains identifier. Nucleic Acids Res. 33, W116–W120. doi: 10.1093/nar/gki442
Ranallo-Benavidez, T. R., Jaron, K. S., Schatz, M. C. (2020). GenomeScope 2.0 and Smudgeplot for reference-free profiling of polyploid genomes. Nat. Commun. 11, 1432. doi: 10.1038/s41467-020-14998-3
Raptopoulos, T. (1941). Chromosomes and fertility of cherries and their hybrids. J. Genet. 42 (1), 91–114.
Renny-Byfield, S., Chester, M., Kovařík, A., Le Comber, S. C., Grandbastien, M.-A., Deloger, M., et al. (2011). Next generation sequencing reveals genome downsizing in allotetraploid Nicotiana tabacum, predominantly through the elimination of paternally derived repetitive DNAs. Mol. Biol. Evol. 28, 2843–2854. doi: 10.1093/molbev/msr112
Schuster, M., Apostol, J., Iezzoni, A., Jensen, M., Milatović, D. (2017). “Sour cherry varieties and improvement,” in Cherries: botany, production and uses (Wallingford: CABI), 95–116.
Schuster, M., Schreibner, H. (2000). GENOME INVESTIGATION IN SOUR CHERRY, P. CERASUS L. Acta Hortic. 538, 375–379. doi: 10.17660/ActaHortic.2000.538.66
Schuster, M., Wolfram, B. (2008). New sour cherry cultivars from Dresden-Pillnitz. Acta Hortic. 795, 83–86. doi: 10.17660/ActaHortic.2008.795.6
Shirasawa, K., Esumi, T., Hirakawa, H., Tanaka, H., Itai, A., Ghelfi, A., et al. (2019). Phased genome sequence of an interspecific hybrid flowering cherry, ‘Somei-Yoshino’ (Cerasus × yedoensis). DNA Res. 26, 379–389. doi: 10.1093/dnares/dsz016
Shirasawa, K., Isuzugawa, K., Ikenaga, M., Saito, Y., Yamamoto, T., Hirakawa, H., et al. (2017). The genome sequence of sweet cherry (Prunus avium) for use in genomics-assisted breeding. DNA Res. 24, 499–508. doi: 10.1093/dnares/dsx020
Stanke, M., Diekhans, M., Baertsch, R., Haussler, D. (2008). Using native and syntenically mapped cDNA alignments to improve de novo gene finding. Bioinformatics 24, 637–644. doi: 10.1093/bioinformatics/btn013
Tang, S., Lomsadze, A., Borodovsky, M. (2015). Identification of protein coding regions in RNA transcripts. Nucleic Acids Res. 43, e78. doi: 10.1093/nar/gkv227
Tillich, M., Lehwark, P., Pellizzer, T., Ulbricht-Jones, E. S., Fischer, A., Bock, R., et al. (2017). GeSeq - versatile and accurate annotation of organelle genomes. Nucleic Acids Res. 45, W6–W11. doi: 10.1093/nar/gkx391
Vaser, R., Sović, I., Nagarajan, N., Šikić, M. (2017). Fast and accurate de novo genome assembly from long uncorrected reads. Genome Res. 27, 737–746. doi: 10.1101/gr.214270.116
Verde, I., Jenkins, J., Dondini, L., Micali, S., Pagliarani, G., Vendramin, E., et al. (2017). The Peach v2.0 release: high-resolution linkage mapping and deep resequencing improve chromosome-scale assembly and contiguity. BMC Genomics 18, 225. doi: 10.1186/s12864-017-3606-9
Walker, B. J., Abeel, T., Shea, T., Priest, M., Abouelliel, A., Sakthikumar, S., et al. (2014). Pilon: an integrated tool for comprehensive microbial variant detection and genome assembly improvement. PloS One 9, e112963. doi: 10.1371/journal.pone.0112963
Wang, J., Liu, W., Zhu, D., Hong, P., Zhang, S., Xiao, S., et al. (2020). Chromosome-scale genome assembly of sweet cherry (Prunus avium L.) cv. Tieton obtained using long-read and Hi-C sequencing. Hortic. Res. 7, 122. doi: 10.1038/s41438-020-00343-8
Wang, X., Liu, S., Zuo, H., Zheng, W., Zhang, S., Huang, Y., et al. (2021). Genomic basis of high-altitude adaptation in Tibetan Prunus fruit trees. Curr. biol.: CB 31, 3848–3860.e8. doi: 10.1016/j.cub.2021.06.062
Wang, Z., Miao, H., Liu, J., Xu, B., Yao, X., Xu, C., et al. (2019). Musa balbisiana genome reveals subgenome evolution and functional divergence. Nat. Plants 5, 810–821. doi: 10.1038/s41477-019-0452-6
Wöhner, T. W., Emeriewen, O. F., Wittenberg, A. H. J., Schneiders, H., Vrijenhoek, I., Halász, J., et al. (2021). The draft chromosome-level genome assembly of tetraploid ground cherry (Prunus fruticosa Pall.) from long reads. Genomics 113, 4173–4183. doi: 10.1016/j.ygeno.2021.11.002
Wu, Y., Lin, F., Zhou, Y., Wang, J., Sun, S., Wang, B., et al. (2021). Genomic mosaicism due to homoeologous exchange generates extensive phenotypic diversity in nascent allopolyploids. Natl. Sci. Rev. 8 (5), nwaa277.
Xie, Z., Wang, L., Wang, L., Wang, Z., Lu, Z., Tian, D., et al. (2016). Mutation rate analysis via parent-progeny sequencing of the perennial peach. I. A low rate in woody perennials and a higher mutagenicity in hybrids. Proc. Biol. Sci. 283, 1–9. doi: 10.1098/rspb.2016.1016
Zdobnov, E. M., Apweiler, R. (2001). InterProScan: protein domains identifier. Bioinformatics 17, 847–848.
Zenil-Ferguson, R., Ponciano, J. M., Burleigh, J. G. (2016). Evaluating the role of genome downsizing and size thresholds from genome size distributions in angiosperms. Am. J. Bot. 103, 1175–1186. doi: 10.3732/ajb.1500408
Keywords: genome assembly, P. cerasus, sour cherry, segmental tetraploid, third generation sequencing, Oxford Nanopore, long reads
Citation: Wöhner TW, Emeriewen OF, Wittenberg AHJ, Nijbroek K, Wang RP, Blom E-J, Schneiders H, Keilwagen J, Berner T, Hoff KJ, Gabriel L, Thierfeldt H, Almolla O, Barchi L, Schuster M, Lempe J, Peil A and Flachowsky H (2023) The structure of the tetraploid sour cherry ‘Schattenmorelle’ (Prunus cerasus L.) genome reveals insights into its segmental allopolyploid nature. Front. Plant Sci. 14:1284478. doi: 10.3389/fpls.2023.1284478
Received: 28 August 2023; Accepted: 31 October 2023;
Published: 01 December 2023.
Edited by:
Peng Wang, Jiangsu Province and Chinese Academy of Sciences, ChinaReviewed by:
Christos Noutsos, State University of New York at Old Westbury, United StatesXuming Li, Hugo Biotechnologies Co., Ltd., China
Copyright © 2023 Wöhner, Emeriewen, Wittenberg, Nijbroek, Wang, Blom, Schneiders, Keilwagen, Berner, Hoff, Gabriel, Thierfeldt, Almolla, Barchi, Schuster, Lempe, Peil and Flachowsky. This is an open-access article distributed under the terms of the Creative Commons Attribution License (CC BY). The use, distribution or reproduction in other forums is permitted, provided the original author(s) and the copyright owner(s) are credited and that the original publication in this journal is cited, in accordance with accepted academic practice. No use, distribution or reproduction is permitted which does not comply with these terms.
*Correspondence: Thomas W. Wöhner, thomas.woehner@julius-kuehn.de