 Xuanli Guan1,2,3
 Nana Yuyama4
 Alan Stewart5Chenglong Ding6Nengxiang Xu6Takako Kiyoshi7
 Hongwei Cai1,2,3,4*
- 1Department of Plant Genetics, Breeding and Seed Science, College of Agronomy and Biotechnology, China Agricultural University, Beijing, China
- 2Laboratory of Crop Heterosis and Utilization, Ministry of Education, Beijing, China
- 3Beijing Key Laboratory of Crop Genetic Improvement and Genome, Ministry of Agriculture, Beijing, China
- 4Forage Crop Research Institute, Japan Grassland Agricultural and Forage Seed Association, Nasushiobara, Japan
- 5PGG Wrightson Seeds, Christchurch, New Zealand
- 6Institute of Livestock Science, Jiangsu Academy of Agricultural Sciences, Nanjing, China
- 7Forage Crop Biotechnology Research Team, National Institute of Livestock and Grassland Science, Nasushiobara, Japan
To assess the genetic diversity and population structure of Lolium species, we used 32 nuclear simple sequence repeat (SSR) markers and 7 cytoplasmic gene markers to analyze a total of 357 individuals from 162 accessions of 9 Lolium species. This survey revealed a high level of polymorphism, with an average number of alleles per locus of 23.59 and 5.29 and an average PIC-value of 0.83 and 0.54 for nuclear SSR markers and cytoplasmic gene markers, respectively. Analysis of molecular variance (AMOVA) revealed that 16.27 and 16.53% of the total variation was due to differences among species, with the remaining 56.35 and 83.47% due to differences within species and 27.39 and 0% due to differences within individuals in 32 nuclear SSR markers set and 6 chloroplast gene markers set, respectively. The 32 nuclear SSR markers detected three subpopulations among 357 individuals, whereas the 6 chloroplast gene markers revealed three subpopulations among 160 accessions in the STRUCTURE analysis. In the clustering analysis, the three inbred species clustered into a single group, whereas the outbreeding species were clearly divided, especially according to nuclear SSR markers. In addition, almost all Lolium multiflorum populations were clustered into group C4, which could be further divided into three subgroups, whereas Lolium perenne populations primarily clustered into two groups (C2 and C3), with a few lines that instead grouped with L. multiflorum (C4) or Lolium rigidum (C6). Together, these results will useful for the use of Lolium germplasm for improvement and increase the effectiveness of ryegrass breeding.
Introduction
The genus Lolium comprises nine species representing both outbreeding and inbreeding species (Terrell, 1968; Scholz et al., 2000), of which the most commonly used species are Lolium perenne L. (perennial ryegrass) and Lolium multiflorum L. (Italian ryegrass or annual ryegrass). These two species produce high yields, are widely adaptable, and have high nutritional value; they are the most important pasture-grass species for cool temperate grassland agriculture, with large areas of cultivation in the British Isles, Denmark, Northern Europe, New Zealand, Southeastern Australia, and other countries (Guthridge, 2001). In addition, L. perenne is noteworthy for its use as turf in golf courses and lawns worldwide. Another outbreeding species, Lolium rigidum, is typically regarded as a forage species, like L. multiflorum. In contrast, the three of inbreeding species—Lolium temulentum, Lolium persicum, and Lolium remotum—are considered to be weedy species of wheat, oat, and flax fields, respectively.
The species within the genus Lolium (ryegrass) are all diploid (2n = 2x = 14), except for some improved tetraploid cultivars of L. perenne and L. multiflorum. A two-locus self-incompatibility system in the Lolium outbreeding species (Cornish et al., 1979) maintains the obligate outbreeding habit. The self-incompatibility and outbreeding features increase genetic variation and complexity in the genus Lolium. Most studies have indicated that the genus can be divided into two groups—an inbreeding group and an outbreeding group—according to morphologic features (Bulinska-Radomska and Lester, 1985; Loos, 1993; Bennett et al., 2000), seed proteins (Bulinska-Radomska and Lester, 1985), isozymes and interspecific hybridization (Charmet and Balfourier, 1994; Charmet et al., 1996), and molecular markers such as restriction fragment length polymorphism (RFLP) and random amplified polymorphic DNA (RAPD) markers (Charmet et al., 1997), internal transcribed spacer (ITS) rDNA (Charmet et al., 1997; Gaut et al., 2000; Catalan et al., 2004), sequence-related amplified polymorphism (SRAP) markers (Cheng et al., 2016a), and chloroplast DNA (Balfourier et al., 2000; Cheng et al., 2016b). In contrast, although both L. rigidum and L. perenne are outbreeding species, among 51 natural populations sampled throughout Europe and the Middle East, most of the L. rigidum populations clustered with those of the three inbred species (L. temulentum, L. persicum, and L. remotum), whereas the L. perenne populations could be divided between two different clusters on the basis of chloroplast DNA markers (Balfourier et al., 2000). Cresswell et al. (2001) used amplified fragment length polymorphism (AFLP) markers to analyze three populations of L. perenne, four of L. multiflorum, and nine of their hybrid, L. × hybridum, from locations across Portugal and found that the three populations of L. perenne formed a discrete cluster that was widely separated from all other populations, whereas, L. × hybridum populations formed two distinct groups, one of which was similar to and overlapped with L. multiflorum, and the second formed a separate cluster.
Due to simple sequence repeats (SSRs) markers exhibit co-dominant inheritance, multiple allelic complexity, it have proven to be highly effective for the evaluation of genetic variation, and it can be detected high polymorphism levels within and between populations. For these reasons, SSRs have continued to be the molecular marker system of choice for studies of plant genetic diversity (Matsuoka et al., 2002; Balfourier et al., 2007; Blair et al., 2009). In the Festuca–Lolium complex, SSR markers based genetic diversity studies also have been reported on single or a few species including tall fescue and meadow fescue (Hand et al., 2012), L. temulentum (Kirigwi et al., 2008; Hirata et al., 2011), Lolium persicum (Sharifi Tehrani et al., 2008; Hirata et al., 2011), and L. perenne (Wang et al., 2009), but no reports on all nine species of genus Lolium.
Festuca, a close related genus to Lolium, is one of the largest genera in the grass family (Poaceae; Clayton and Renvoize, 1986; Tzvelev, 1989), with a global distribution in temperate and alpine regions including some economically important species like Festuca arundinacea (tall fescue), Festuca pratensis (meadow fescue), and Festuca rubra (red fescue) used as forage or lawns. Compared with the Lolium species, most Festuca species are perennial outbreeders, but they display wide variation in ploidy level, ranging from diploid to decaploid. A better understanding of phylogenetic relationships within the species of Festuca–Lolium complex would not only be very useful for future species conservation and for improved collection knowledge, but would also greatly assist future for age grass breeding programs (Cheng et al., 2016b). A number of phylogenetic analysis of Festuca–Lolium complex have been reported based on ITS sequence (Gaut et al., 2000; Catalan et al., 2004), chloroplast gene sequence (Catalan et al., 2004; Cheng et al., 2016b), nuclear genes (Hand et al., 2010) and SRAP markers (Cheng et al., 2016a), and these reports indicated the Festuca–Lolium complex can be derived into fine-leaved fescue group and broad-leaved fescue group, and the Lolium species were grouped into broad-leaved fescue group.
Most of the previous studies focused on the phylogenetic relationships among species included in the Festuca–Lolium complex, evaluating a few individuals of each species, rather than on the genetic divergence within the same species. In the current study, to investigate the relationships among nine species of Lolium and the genetic diversity within these species, we used nuclear SSR markers and cytoplasmic gene polymerase chain reaction (PCR) markers to characterize a total of 357 individuals from 162 accessions of nine Lolium species. Our findings likely will be useful for future genetic diversity studies of Lolium.
Materials and Methods
Plant Materials
A total of 357 individuals sampled from 162 accessions (1–3 individuals for each outbreeding species and 1 individual per inbreeding species) and representing nine species of Lolium were used. Because the cytoplasmic gene showed matrilineal inheritance, the open pollination progenies of same accession will have same cytoplasmic genotypes, so we used only one individual for each accession for the cytoplasmic gene analysis. Most materials were kindly provided by the United States National Plant Germplasm System, GRIN–USDA, ARS; the remaining samples were from the Forage Crop Research Institute, Japan Grassland Agriculture and Forage Seed Association (Table 1, Table S1). The species classification used was as received.
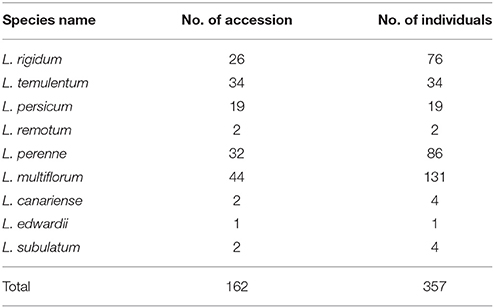
Table 1. Materials used in this study.
Genomic DNA Extraction
Total DNA was extracted from fresh leaves by using the cetyl trimethylammonium bromide (CTAB) method (Murray and Thompson, 1980). DNA concentrations were estimated by spectrophotometry (NanoDrop 2000, Thermo Fisher Scientific, Waltham, MA, USA), and the final concentration of each DNA sample was adjusted to 25 ng/μL.
PCR Amplification
In total, 32 nuclear SSR primers from L. multiflorum (Table S2, Hirata et al., 2006) distributed in the seven linkage groups of entire genome were used to analyze nuclear diversity. PCR for nuclear SSR markers were performed in a total volume of 10 μL containing 0.5 unit of Taq polymerase (Tiangen, Beijing, China), 1.0 μL of 10 × Taq DNA polymerase buffer, 0.4 μL of 500 μM dNTPs, 1 pmol M13-taied forward primer, 5 pmol reverse primer, 5 pmol M13 primer, and 20 ng total DNA. The M13 primer (5′ CACGACGTTGTAAAACGAC 3′) was labeled with IRD700 or IRD800 fluorescent dye (Li-COR, Lincoln, NE, USA), and for the M13-taied forward primer, the M13 primer sequence was added to the 5′ end of the forward primer. PCR amplification was performed according to the following program: 95°C for 5 min; then 2 cycles of 95°C for 1 min, 65°C for 1 min, and 72°C for 1.5 min; followed by 10 cycles of 95°C for 1 min, 65–55°C for 1 min decreasing by 1°C per cycle, and 72°C 1.5 min; then 30 cycles of 95°C for 1 min, 55°C 1 min, and 72°C for 1.5 min; followed by 72°C for 7 min; and ending with a 4°C hold. PCR products were confirmed by a LI-COR 4300 DNA Sequencer (LI-COR, Lincoln, NE, USA).
A total of six chloroplast and one mitochondrial primer pairs developed from tabaco, spinach, rice, and carrot (Table S3; Nakamura et al., 1998; Robison and Wolyn, 2002; Kishimoto et al., 2003) that revealed polymorphism were selected for use after the screening of 47 chloroplast and 32 mitochondrial primer pairs (data not shown). For the cytoplasmic gene markers, 160 individuals of 160 accession were used (one individual for each accession). Each PCR was performed in a total volume of 20 μL containing 1.0 unit of Taq polymerase (Tiangen, Beijing, China), 2.0 μL of 10 × Taq DNA polymerase buffer, 0.4 μL of 500 μM dNTPs, 2 μM of each primer, and 40 ng total DNA. PCR conditions were as follows: 35 cycles of 30 s at 95°C for denaturation, 30 s at 55°C for annealing, and 1 min at 72°C for extension, followed by holding at 4°C. PCR products were separated on 2% agarose gels.
Phylogenetic and Population Structure Analysis
The number of alleles, the number of genotypes, polymorphism information content (PIC) per locus, pair-wise comparisons of species genetic distance (Nei et al., 1983), and Fst (genetic differentiation) were calculated by using PowerMarker version 3.25 (Liu and Muse, 2005). Phylogenetic trees were constructed by using the unrooted neighbor-joining tree method based on shared genetic distance in PowerMarker and were displayed by using the program MEGA 4.0 (Tamura et al., 2007). Population structure was estimated by using the model-based program STRUCTURE 2.2 (Pritchard et al., 2000; Falush et al., 2003). The analysis had a burn-in length of 10,000 iterations and a run length of 100,000 iterations, and the model allowed for admixture and correlated allele frequencies. At least 20 runs of structure estimation were performed by setting the number of populations (K) from 2 to 10, and the average likelihood value, L(K), across all runs was calculated for each K. The model choice criterion to detect the most probable value of K was ΔK, which is an ad hoc quantity related to the second-order change of the log probability of data with regard to the number of clusters inferred by STRUCTURE (Evanno et al., 2005). Analysis of molecular variance (AMOVA) was calculated by using ARLEQUIN ver. 3.5.2 (Excoffier et al., 2005) based on the haplotypic data mode.
Results
Genetic Diversity
All 32 nuclear SSR primers tested were polymorphic across the 357 individuals, and 755 alleles were detected overall (Table S2). The average number of alleles per locus was 23.59, ranging from 9 (LMSSR09-07G) to 36 (IRGSSR252). The average number of genotypes was 69.13, ranging from 12 (LMSSR09-07G) to 120 (LMSSRST7G4). PIC varied from 0.48 for LMSSR09-07G to 0.95 for LMSSRST12H9, with an average of 0.83. This value is much higher than that obtained by Roldan-Ruiz et al. (2001) by AFLP analysis (PIC, 0.28) and Bolaric et al. (2005) by using RAPD markers (PIC, 0.41).
The seven pairs of cytoplasmic polymorphic primers revealed a total of 37 alleles across the 160 accessions (Table S3). The average number of alleles per locus and the average number of genotypes were both 5.29, ranging from 3 (atpH) to 7 (psaA). The average PIC-value was 0.54, ranging from 0.14 (ORF100-1) to 0.76 (petA). The average number of alleles per locus and PIC determined by using the cytoplasmic gene markers were smaller than those from the nuclear SSR primers.
The genetic diversity for each species is listed in Table 2; four species—L. remotum, Lolium canariense, Lolium edwardii, and Lolium subulatum—were excluded because only few individuals were evaluated for each. According to the nuclear primers, L. multiflorum had the highest PIC (0.83) and L. persicum had the lowest PIC (0.21). In contrast, L. rigidum had the highest PIC (0.52) and L. persicum had the lowest PIC (0.27) on the basis of the six chloroplast gene markers. These results indicate that genetic diversity is higher in the three out-crossing species, L. multiflorum, L. perenne, and L. rigidum, but is lower in the inbreeding species L. persicum and L. temulentum.
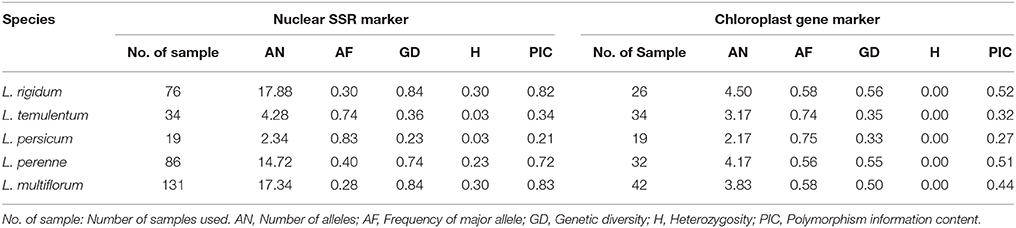
Table 2. The genetic diversity for five major Lolium species.
Genetic Relationships among the Nine Species
According to the nuclear SSR markers, Nei's genetic distance ranged from 0.25 to 0.76 among all pairs of the nine Lolium species (Table 3); the greatest genetic distance occurred between L. edwardii and L. persicum, whereas the smallest was observed between L. multiflorum and L. perenne. Analysis of molecular variance (AMOVA) revealed that 16.27% of the total variation was due to differences among species, with the remaining 56.35% due to differences within species and 27.39% due to differences within individuals (Table S6). Pair-wise estimates of Fst indicated a high degree of differentiation among the nine species, and the trend was similar to that for genetic distance. As for genetic distance, the highest pair-wise Fst-value occurred between L. edwardii and L. persicum (0.72); the lowest pair-wise Fst-value was between L. multiflorum and L. rigidum (0.06). All pair-wise Fst-values for the nine species were significant (P < 0.001).
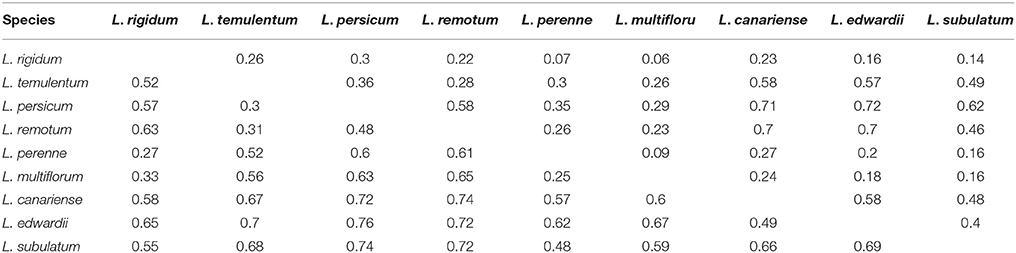
Table 3. Pair-wise estimates of Fst (above diagonal) and Nei's genetic distance (below diagonal) based on nuclear SSR markers among nine species.
On the basis of the six chloroplast gene markers, Nei's genetic distance ranged from 0.06 to 0.72 (Table 4), with the greatest distance between L. edwardii and L. subulatum and the smallest between L. multiflorum and L. perenne. The overall AMOVA indicated that 16.53% of the variation was due to differences among species; the remaining 83.47% was due to differences within species (Table S7). Pair-wise estimates of Fst showed that the highest degree of differentiation occurred between L. persicum and L. subulatum (0.68), with the least differentiation between L. multiflorum and L. canariense (0.02).
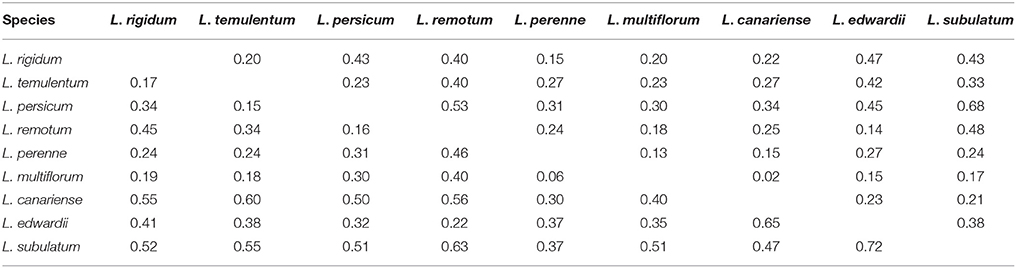
Table 4. Pair-wise estimates of Fst (above diagonal) and Nei's genetic distance (below diagonal) based on chloroplast gene markers among nine species.
Analysis of Population Structure
We used a model-based clustering method for multi-loci genotype data to infer the population structure and assign individuals to populations by using STRUCTURE. According to L (K) and ΔK, the model-based simulation of population structure using nuclear SSR markers showed that the optimal number of populations was 3, meaning that the ancestry of each individual was inferred from the Q-value and classified into one of three groups, as inferred from the model, here denoted as G1, G2, and G3, respectively (Figure 1; Figure S1; Table S4). Group G1 consisted of 129 individuals, including most of those of L. multiflorum and a few of L. perenne; G2 comprised the 55 individuals from all three inbreeding species, and G3 contained the 173 remaining individuals, the majority of which belonged to L. rigidum and L. perenne; the three rare species of L. subulatum (4 individuals), L. canariense (4 individuals), and L. edwardii (1 individual) were also grouped into G3.
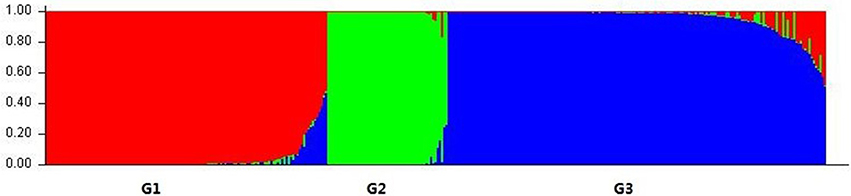
Figure 1. Population structure of Lolium species based on 32 nuclear SSR markers (K = 3). Bar plot was sorted by Q-values in single line.
Compared with the results from the nuclear SSR markers, the population structure inferred by using cpDNA markers was not delineated as clearly. The 160 accessions were grouped optimally into three subpopulations (K = 3), denoted as G1, G2, and G3, respectively (Figure 2; Figure S2; Table S5).
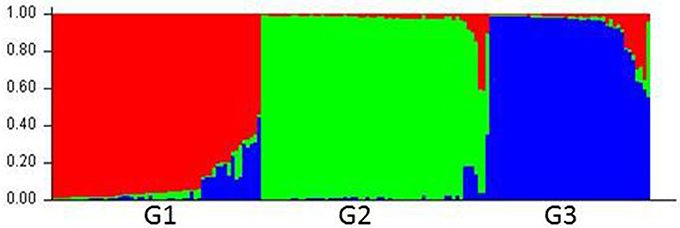
Figure 2. Population structure of Lolium species based on six chloroplast gene markers (K = 3). Bar plot was sorted by Q-values in single line.
To verify the results of the STRUCTURE analysis, unrooted neighbor-joining trees of 357 individuals and 160 accessions were constructed based on Nei's genetic distance by using nuclear SSR markers and cpDNA gene markers, respectively (Figures 3, 4, and Table S1). With few exceptions, the neighbor-joining tree showed that the Lolium materials could be differentiated according to their subspecies affiliation. In addition, compared with the results from the STRUCTURE analysis, the materials were better differentiated and more clearly visualized in the neighbor-joining tree. For example, three inbreeding species were clustered into one group (C1), whereas another inbreeding species, L. subulatum, was grouped with L. perenne (C3). Almost all L. multiflorum individuals were allocated into group C4, which seemed to consist of three subgroups. Populations of L. perenne clearly clustered into two groups (C2 and C3), although a few lines of L. perenne were grouped with L. multiflorum (C4) and L. rigidum (C6). Interestingly, two minor species, L. canariense (represented by four individuals) and L. edwardii (one individual), both from Spain, were grouped as C7 (Figure 3).
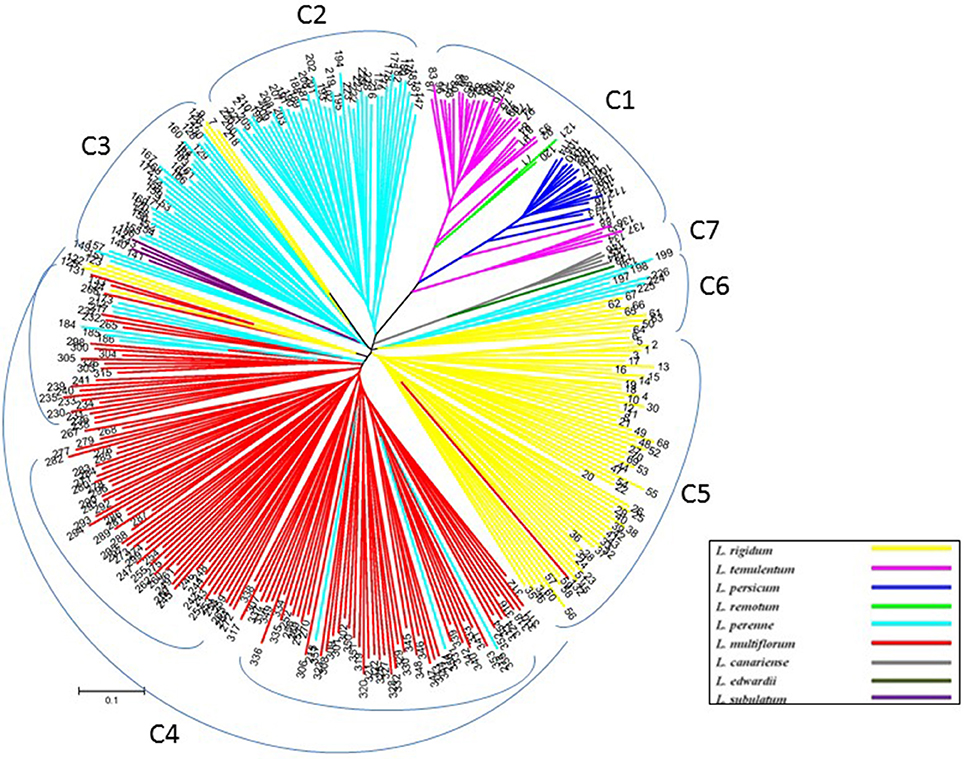
Figure 3. Unrooted neighbor-joining tree comprising 357 individuals from 162 accessions of Lolium, according to 32 nuclear SSR markers.
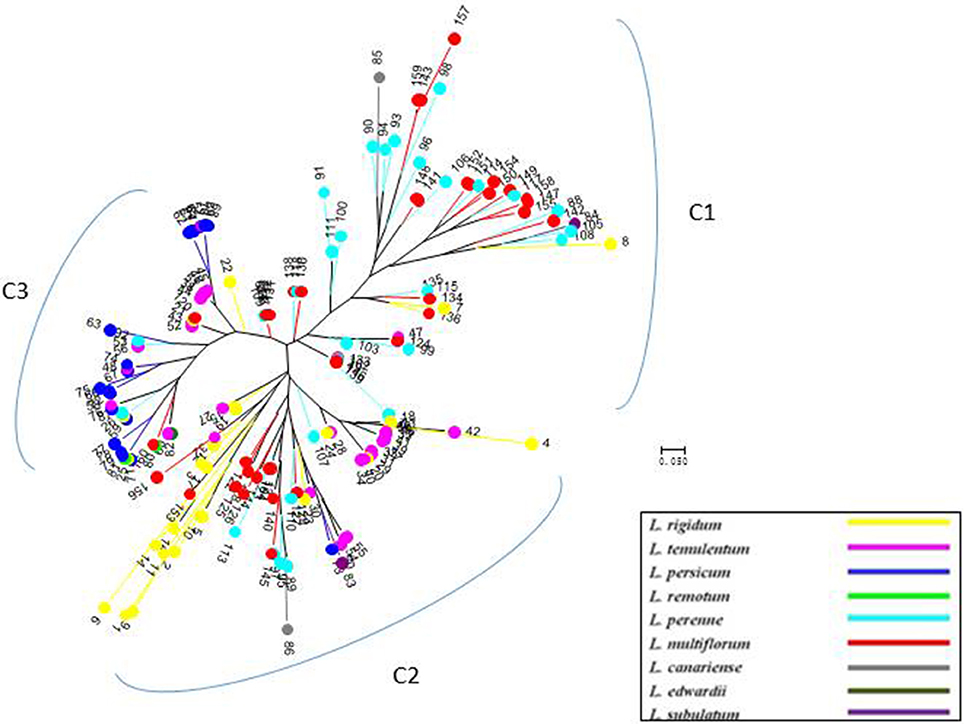
Figure 4. Unrooted neighbor-joining tree of 160 accessions of Lolium, according to six chloroplast gene markers.
Compared with nuclear SSR markers, the clustering analysis based on cpDNA gene markers detected three groups, but the subspecies affiliation were not so clear (Figure 4), although most of the inbreeding species, particularly L. persicum populations, were included in group C3, and most L. perenne and some L. multiflorum were grouped as C1.
Discussion
SSR marker were easily transferred between Festuca–Lolium complex (Rouf Mian et al., 2005; Hirata et al., 2006, 2011; Kirigwi et al., 2008; Sharifi Tehrani et al., 2008; Hand et al., 2012), in this study, SSR markers form Italian ryegrass were used, in our results, the 32 nuclear SSR markers were successfully amplified in all nine Lolium species used, and showed higher genetic diversity and PIC-values in out-crossing species than inbreeding species, suggesting the usefulness of these SSR markers in Lolium genetic diversity study. On the other hands, the organellar genome is usually well conserved among different plant species, and organellar markers are used as tools for studies of population genetics and evolution and for phylogenic analysis (Dumolin-Lapegue et al., 1997). We have tested a total of 38 primer pairs from chloroplast genes and 30 primer pairs from mitochondrial genes designed from rice and other species, and almost all the primers could provide single clear amplification products in Italian ryegrass (Cai et al., 2009). In this study, seven cytoplasmic markers were from tabaco, spinach, rice, and carrot, and these markers showed a moderate polymorphism in nine Lolium species, although other tested cytoplasmic primers don't detected polymorphism by using agarose electrophorese (data not shown), to get more polymorphism using these cytoplasmic primers, it may need to detect polymorphism by digest the amplification products using four-base cutter restriction endonuclease like AluI, HaeIII, RsaI, HhaI, MspI, and MseI, or by finding of SNP by sequencing of the PCR products.
Although many reports address the phylogenetic relationships of the Festuca–Lolium complex (Charmet et al., 1997; Gaut et al., 2000; Hand et al., 2010; Cheng et al., 2016a,b), few are molecular studies of larger numbers of Lolium samples. In contrast, the current study evaluated a total of 357 individuals from 160 accessions representing both the five major species as well as four minor species—L. remotum, L. canariense, L. edwardii, and L. subulatum—to give an overall view of the relationships among the Lolium species at the molecular level. Our results were mostly in agreement with those from a morphological study (Loos, 1993) and an isozyme study (Charmet et al., 1996). Loos (1993) indicated that the two inbreeding species L. loliaceum (L. subulatum) and L. remotum do not form a distinct group and that L. remotum is intermediate between the cross-breeding species and the other inbreeding species, whereas L. loliaceum is in a somewhat isolated position, more closely related to L. rigidum. However, in our results, the L. remotum populations grouped with the inbreeding species and close to L. temulentum, whereas L. subulatum was not grouped with L. rigidum but rather close to L. perenne. In contrast, Balfourier et al. (2000) reported that L. perenne populations can be divided into two different clusters on the basis of chloroplast DNA markers. Similarly, using nuclear SSR markers, we also detected two groups of L. perenne: group C3 materials were mainly from the Middle East and Northern Europe, whereas those in group C2 were from other regions of Europe primarily; in addition, a few L. perenne accessions were grouped with L. multiflorum (C4) and L. rigidum (C6). Moreover, L. multiflorum (C4) seemed to be divided into three subgroups, which have not been reported previously.
Due to adapting to differences in the ecological environment from place to place, Lolium seems to have formed different geographic ecological groups during long-term migration and evolution (Terrell, 1968). In our study, although the two L. perenne groups show some geographic evolution tendency according to the nuclear SSR-based clustering, the relationships between the population structures with geographic origin were rather indistinct, especially for the cytoplasmic gene markers.
The contrasted patterns of inheritance of organelle (cpDNA and mtDNA) and nuclear genes can be used to unravel the complexity of gene flow in plants, as they are predicted to result in very different distribution of genetic diversity within and among populations (Birky et al., 1989; Petit et al., 1993). Petit et al. (2005) compared the genetic structure based on chloroplast DNA (cpDNA), mitochondrial DNA (mtDNA) and nuclear markers from a data set of 183 species belonging to 103 genera and 52 families, they concluded that maternally inherited genomes (cpDNA and mtDNA) experience considerably more subdivision than paternally or biparentally inherited genomes (nuclear genes). GST at cpDNA and mtDNA markers covary narrowly when both genomes are maternally inherited, whereas GST at paternally and biparentally inherited markers also covary positively but more loosely and GST at maternally inherited markers are largely independent of values based on nuclear markers. In this study, we used both nuclear SSR markers and cpDNA gene markers for estimation of the population differentiation, but the Fst-values of nuclear SSR markers and cpDNA gene markers-based were not clearly different. The genetic diversity and PIC-values for different marker types were also no clear difference detected in same species (Table 2). For the AMOVA results of two types of markers were comparable, nuclear SSR markers revealed that 16.27% of the total variation was due to differences among species, with the remaining 56.35% due to differences within species and 27.39% due to differences within individuals, but the cpDNA gene markers detected 16.53% of the variation was due to differences among species; the remaining 83.47% was due to differences within species, and no variation were from the differences within individuals, because no heterozygosity detected from cpDNA gene markers. Wang et al. (2009) has reported that genetic variation among (8.7%) and within populations (91.3%) in eight forage perennial ryegrass populations comprising 48 individual plants per population genotyped with 29 SSR marker loci. Compared with this result, a larger value of among species and smaller value of within species in our study were detected, because we used both inbreeding and out-crossing species of Lolium, which has larger genetic difference.
In this study, we combined the nuclear SSR markers and cytoplasmic gene markers to analyze the genetic diversity and structure among nine Lolium species. We found clear differentiation between L. perenne populations as well as several tendencies toward differentiation within L. multiflorum. These results will be useful for future species conservation and for improved collection knowledge, and will be also useful for efficiently use of Lolium germplasm for ryegrass breeding.
Author Contributions
HC: designed the experiments; XG, NY, CD, and NX: performed the experiments; AS and TK: collected materials; XG and HC: analyzed the data; and GX and CH: wrote the manuscript.
Conflict of Interest Statement
The authors declare that the research was conducted in the absence of any commercial or financial relationships that could be construed as a potential conflict of interest.
Acknowledgments
This study was financially supported by grants from the National Natural Science Foundation of China (Nos. 31571733 and 30971835).
Supplementary Material
The Supplementary Material for this article can be found online at: http://journal.frontiersin.org/article/10.3389/fpls.2017.00584/full#supplementary-material
Figure S1. Population structure of Lolium species based on 32 nuclear SSR markers (K = 3). Bar plot was sorted by Q-values in multiple lines.
Figure S2. Population structure of Lolium species based on six chloroplast gene markers (K = 3). Bar plot was sorted by Q-values in multiple lines.
Table S1. The materials used in this study.
Table S2. Nuclear SSR markers information used in this study.
Table S3. Cytoplasm gene markers information used in this study.
Table S4. Summary statistics for each group (K = 3) in Figure 1.
Table S5. Summary statistics for each group (K = 3) in Figure 2.
Table S6. Results of AMOVA using 32 nuclear SSR markers and 357 Lolium individuals.
Table S7. Results of AMOVA using 6 cpDNA gene markers and 160 Lolium individuals.
References
Balfourier, F., Imbert, C., and Charmet, G. (2000). Evidence for phylogeographic structure in Lolium species related to the spread of agriculture in Europe. A cpDNA study. Theor. Appl. Genet. 101, 131–138. doi: 10.1007/s001220051461
Balfourier, F., Roussel, V., Strelchenko, P., Exbrayat-Vinson, F., Sourdille, P., Boutet, G., et al. (2007). A worldwide bread wheat core collection arrayed in a 384-well plate. Theor. Appl. Genet. 114, 1265–1275. doi: 10.1007/s00122-007-0517-1
Bennett, S. J., Hayward, M. D., and Marshall, D. F. (2000). Morphological differentiation in four species of the genus Lolium. Genet. Res. Crop Evol. 47, 247–255. doi: 10.1023/A:1008751026645
Birky, C. W. Jr., Fuerst, P., and Maruyama, T. (1989). Organelle gene diversity under migration, mutation and drift: equilibrium expectations, approach to equilibrium, effects of heteroplasmic cells, and comparison to nuclear genes. Genetics 103, 513–527.
Blair, M., Díaz, L., Buendía, H., and Duque, M. (2009). Genetic diversity, seed size associations and population structure of a core collection of common beans (Phaseolus vulgaris L.). Theor. Appl. Genet. 119, 955–972. doi: 10.1007/s00122-009-1064-8
Bolaric, S., Barth, S., and Melchinger, A. E. (2005). Genetic diversity in European perennial ryegrass cultivars investigated with RAPD markers. Plant Breed. 124, 161–166. doi: 10.1111/j.1439-0523.2004.01032.x
Bulinska-Radomska, Z., and Lester, R. N. (1985). Relationships between five species of Lolium (Poaceae). Plant Sys. Evol. 148, 169–175. doi: 10.1007/BF00985922
Cai, H. W., Inoue, M., Yuyama, N., and Hirata, M. (2009). “Genome mapping in cool-season forage grass.” in Molecular Breeding of Forage and Turf. The Proceedings of the 5th International Symposium on the Molecular Breeding of Forage and Turf, eds T. Yamada and G. Spangenberg (Sapporo: Springer), 173–183.
Catalan, P., Torrecilla, P., Rodriguez, J. A. L., and Olmstead, R. G. (2004). Phylogeny of the festucoid grasses of subtribe Loliinae and allies (Poeae, Pooideae) inferred from ITS and trnL-F sequences. Mol. Phytogenet. Evol. 31, 517–541. doi: 10.1016/j.ympev.2003.08.025
Charmet, G., and Balfourier, F. (1994). Isozyme variation and species relationships in the genus Lolium, L. (ryegrasses, Graminaceae). Theor. Appl. Genet. 87, 641–649. doi: 10.1007/BF00222888
Charmet, G., Balfourier, F., and Chatard, V. (1996). Taxonomic relationships and interspecific hybridization in the genus Lolium (grasses). Genet. Res. Crop Evol. 43, 319–327. doi: 10.1007/BF00132951
Charmet, G., Ravel, C., and Balfourier, F. (1997). Phylogenetic analysis in the Festuca-Lolium complex using molecular markers and ITS rDNA. Theor. Appl. Genet. 94, 1038–1046. doi: 10.1007/s001220050512
Cheng, Y., Ma, X., Zhou, K., Humphreys, M. W., and Zhang, X. Q. (2016a). Phylogenetic analysis of Festuca–Lolium complex using SRAP markers. Genet. Res. Crop Evol. 63, 7–18. doi: 10.1007/s10722-015-0324-5
Cheng, Y., Zhou, K., Humphreys, M. W., Harper, J. A., Ma, X., Zhang, X., et al. (2016b). Phylogenetic relationships in the Festuca-Lolium complex (Loliinae; Poaceae): new insights from chloroplast sequences. Front. Ecol. Evol. 4:89. doi: 10.3389/fevo.2016.00089
Clayton, W. D., and Renvoize, S. A. (1986). Genera graminum: grasses of the world. Kew Bull. 13, 1–389.
Cornish, M. A., Hayward, M. D., and Lawrence, M. J. (1979). Self-incompatibility in ryegrass. I. Genetic control in diploid Lolium perenne L. Heredity 43, 95–106. doi: 10.1038/hdy.1979.63
Cresswell, A., Hamilton, N. R. S., Roy, A. K., and Viegas, B. M. F. (2001). Use of amplified fragment length polymorphism markers to assess genetic diversity of Lolium species from Portugal. Mol. Ecol. 10, 229–241. doi: 10.1046/j.1365-294X.2001.01170.x
Dumolin-Lapegue, S., Pemonge, M. H., and Petit, R. J. (1997). An enlarged set of consensus primers for the study of organelle DNA in plants. Mol. Ecol. 6, 393–397. doi: 10.1046/j.1365-294X.1997.00193.x
Evanno, G., Regnaut, S., and Goudet, J. (2005). Detecting the number of clusters of individuals using the software STRUCTURE: a simulation study. Mol. Ecol. 14, 2611–2620. doi: 10.1111/j.1365-294X.2005.02553.x
Excoffier, L., Laval, G., and Schneider, S. (2005). Arlequin ver. 3.0: an integrated software package for population genetics data analysis. Evol. Bioinform. 1, 47–50.
Falush, D., Stephens, M., and Pritchard, J. K. (2003). Inference of population structure using multilocus genotype data: linked loci and correlated allele frequencies. Genetics 164, 1567–1587.
Gaut, B. S., Tredway, L. P., Kubik, C., Gaut, R. L., and Meyer, W. (2000). Phylogenetic relationships and genetic diversity among members of the Festuca-Lolium complex (Poaceae) based on ITS sequence data. Plant Sys. Evol. 224, 33–53. doi: 10.1007/BF00985265
Guthridge, K. M. (2001). AFLP analysis of genetic diversity within and between populations of perennial ryegrass (Lolium perenne L.). Euphytica 122, 191–201. doi: 10.1023/A:1012658315290
Hand, M. L., Cogan, N. O., and Forster, J. W. (2012). Molecular characterization and interpretation of genetic diversity within globally distributed germplasm collections of tall fescue (Festuca arundinacea Schreb.) and meadow fescue (F. pratensis Huds.). Theor. Appl. Genet. 124, 1127–1137. doi: 10.1007/s00122-011-1774-6
Hand, M. L., Cogan, N. O., Stewart, A. V., and Forster, J. W. (2010). Evolutionary history of tall fescue morphotypes inferred from molecular phylogenetics of the Lolium-Festuca species complex. BMC Evol. Biol. 10:1. doi: 10.1186/1471-2148-10-303
Hirata, M., Cai, H. W., and Inoue, M. (2006). Development of simple sequence repeat (SSR) markers and construction of an SSR-based linkage map in Italian ryegrass (Lolium multiflorum Lam). Theor. Appl. Genet. 113, 270–279. doi: 10.1007/s00122-006-0292-4
Hirata, M., Kiyoshi, T., Yuyama, N., and Cai, H. (2011). Development of SSR simple sequence repeat markers for inbreeding Lolium species. Grassland Sci. 57, 35–45. doi: 10.1111/j.1744-697X.2010.00206.x
Kirigwi, F. M., Zwonitzer, J. C., Rouf Mian, M. A., Wang, Z. Y., and Saha, M. C. (2008). Microsatellite markers and genetic diversity assessment in Lolium temulentum. Genet. Resour. Crop Evol. 55, 105–114. doi: 10.1007/s10722-007-9218-5
Kishimoto, S., Aida, R., and Shibata, M. (2003). Identification of chloroplast DNA variations by PCR-RFLP analysis in Dendranthema. J. Jpn. Soc. Hort. Sci. 72, 197–204. doi: 10.2503/jjshs.72.197
Liu, K., and Muse, S. V. (2005). PowerMarker: an integrated analysis environment for genetic marker analysis. Bioinformatics 21, 2128–2129. doi: 10.1093/bioinformatics/bti282
Loos, B. P. (1993). Morphological variation in Lolium (Poaceae) as a measure of species relationships. Plant Syst. Evol. 188, 87–99.
Matsuoka, Y., Vigouroux, Y., Goodman, M. M., Sanchez, G. J., Buckler, E., and Doebley, J. (2002). A single domestication for maize shown by multilocus microsatellite genotyping. Proc. Natl. Acad. Sci. U.S.A. 99, 6080–6084. doi: 10.1073/pnas.052125199
Murray, M. G., and Thompson, W. F. (1980). Rapid isolation of high molecular weight plant DNA. Nucl. Acids Res. 8, 4321–4325. doi: 10.1093/nar/8.19.4321
Nakamura, I., Kameya, N., Kato, Y., Yamanaka, S., Jomori, H., and Sato, Y. I. (1998). A proposal for identifying the short ID sequence which addresses the plastid subtype of higher plants. Breed. Sci. 47, 385–388.
Nei, M., Tajima, F., and Tateno, Y. (1983). Accuracy of estimated phylogenetic trees from molecular data. II. Gene frequency data. J. Mol. Evol. 19, 153–170. doi: 10.1007/BF02300753
Petit, R. J., Duminil, J., Fineschi, S., Hampe, A., Salvini, D., and Vendramin, G. G. (2005). Comparative organization of chloroplast, mitochondrial and nuclear diversity in plant populations. Mol. Ecol. 14, 689–701. doi: 10.1111/j.1365-294X.2004.02410.x
Petit, R. J., Kremer, A., and Wagner, D. B. (1993). Finite island model for organelle and nuclear genes in plants. Heredity 71, 630–641. doi: 10.1038/hdy.1993.188
Pritchard, J. K., Stephens, M., and Donnelly, P. (2000). Inference of population structure using multilocus genotype data. Genetics 155, 945–959.
Robison, M., and Wolyn, D. (2002). Complex organization of the mitochondrial genome of petaloid CMS carrot. Mol. Genet. Genomics 268, 232–239. doi: 10.1007/s00438-002-0740-z
Roldan-Ruiz, I., Eeuwljk, F. A., and van Gilliland, T. J. (2001). A comparative study of molecular and morphological methods of describing relationships between perennial ryegrass (Lolium pererne L.) varieties. Theor. Appl. Genet. 103, 1138–1150. doi: 10.1007/s001220100571
Rouf Mian, M. A., Saha, M. C., Hopkins, A. A., and Wang, Z. (2005). Use of tall fescue EST-SSR markers in phylogenetic analysis of cool-season forage grasses. Genome 48, 637–647. doi: 10.1139/g05-029
Scholz, H., Stierstorfer, C. H., and Gaisberg, M. V. (2000). Lolium edwardii sp. nova (Gramineae) and its relationship with Schedonorus sect. Plantynia Dumort. Feddes Repertorium 111, 561–565. doi: 10.1002/fedr.20001110722
Sharifi Tehrani, M., Mardi, M., Saeidi, H., Gharehyazi, B., and Assadi, M. (2008). Transferability of genomic and EST-microsatellites from Festuca arundinacea Schreb. to Lolium persicum Boiss. and Hohen. ex Boiss. Int. J. Bot. 4, 476–480. doi: 10.3923/ijb.2008.476.480
Tamura, K., Dudley, J., Nei, M., and Kumar, S. (2007). MEGA4: Molecular evolutionary genetics analysis (MEGA) software version 4.0. Mol. Biol. Evol. 24, 1596–1599. doi: 10.1093/molbev/msm092
Keywords: Lolium, genetic diversity, population structure, nuclear SSR, cytoplasm gene
Citation: Guan X, Yuyama N, Stewart A, Ding C, Xu N, Kiyoshi T and Cai H (2017) Genetic Diversity and Structure of Lolium Species Surveyed on Nuclear Simple Sequence Repeat and Cytoplasmic Markers. Front. Plant Sci. 8:584. doi: 10.3389/fpls.2017.00584
Received: 25 January 2017; Accepted: 31 March 2017;
Published: 21 April 2017.
Edited by:
Badri Padhukasahasram, Illumina (United States), USACopyright © 2017 Guan, Yuyama, Stewart, Ding, Xu, Kiyoshi and Cai. This is an open-access article distributed under the terms of the Creative Commons Attribution License (CC BY). The use, distribution or reproduction in other forums is permitted, provided the original author(s) or licensor are credited and that the original publication in this journal is cited, in accordance with accepted academic practice. No use, distribution or reproduction is permitted which does not comply with these terms.
*Correspondence: Hongwei Cai, caihw@cau.edu.cn