 Jin Woong Kim
 Hyeon Seok Seok
 Hangsik Shin
- Department of Biomedical Engineering, Chonnam National University, Yeosu-si, South Korea
In mobile healthcare, heart rate variability (HRV) is increasingly being used in dynamic patient states. In this situation, shortening of the measurement time is required. This study aimed to validate ultra-short-term HRV in non-static conditions. We conducted electrocardiogram (ECG) measurements at rest, during exercise, and in the post-exercise recovery period in 30 subjects and analyzed ultra-short-term HRV in time and frequency domains by ECG in 10, 30, 60, 120, 180, and 240-s intervals, and compared the values to the 5-min HRV. For statistical analysis, null hypothesis testing, Cohen’s d statistics, Pearson’s correlation coefficient, and Bland-Altman analysis were used, with a statistical significance level of P < 0.05. The feasibility of ultra-short-term HRV and the minimum time required for analysis showed differences in each condition and for each analysis method. If the strict criteria satisfying all the statistical methods were followed, the ultra-short-term HRV could be derived from a from 30 to 240-s length of ECG. However, at least 120 s was required in the post-exercise recovery or exercise conditions, and even ultra-short-term HRV was not measurable in some variables. In contrast, according to the lenient criteria needed to satisfy only one of the statistical criteria, the minimum time required for ultra-short-term HRV analysis was 10–60 s in the resting condition, 10–180 s in the exercise condition, and 10–120 s in the post-exercise recovery condition. In conclusion, the results of this study showed that a longer measurement time was required for ultra-short-term HRV analysis in dynamic conditions. This suggests that the existing ultra-short-term HRV research results derived from the static condition cannot applied to the non-static conditions of daily life and that a criterion specific to the non-static conditions are necessary.
Introduction
The measurement of heart rate variability (HRV) is used to assess autonomic nervous system (ANS) activity and is known to be meaningful in assessing cardiac vagal activity (Malik et al., 1996; Berntson et al., 1997; Laborde et al., 2017). HRV measurement analyzes variations in the inter-beat interval seen in the electrocardiogram (ECG). In general, long-term HRV is derived from a 24 h ECG, and short-term HRV is derived from a 5 min ECG (Camm et al., 1996). While long-term recording has the potential to analyze physiological statuses, such as congestive heart failure, mitral regurgitation, and mortality (Camm et al., 1996), short-term HRV is becoming more popular because long-term HRV is difficult to measure in everyday life. Recently, for monitoring the health situations of an individual in daily life, the use of HRV has greatly increased in connection with mobile and wearable technologies. However, when used for routine healthcare purposes, the subject may feel that even the 5 min steady-state measurement required for short-term HRV analysis is long, which may result in measurement discomfort. Moreover, real-time measurements are difficult while the human body is in motion, and are likely to yield inaccurate results. To overcome these practical limitations and increase the usefulness of HRV in mobile and wearable situations, ultra-short-term HRV with an analysis interval of less than 5 min has been studied (Hamilton et al., 2004; Flatt and Esco, 2013; Castaldo et al., 2017). Previous studies have calculated HRV at intervals between 10 s and 10 min, the minimum time required to identify statistically significant differences for each ultra-short-term HRV variable compared to short-term HRV, as summarized in Table 1. While the previous results may seem to suggest the validity of ultra-short-term HRV, they cannot be generalized because each variable had a very large variation, which depended upon the analysis method or condition.
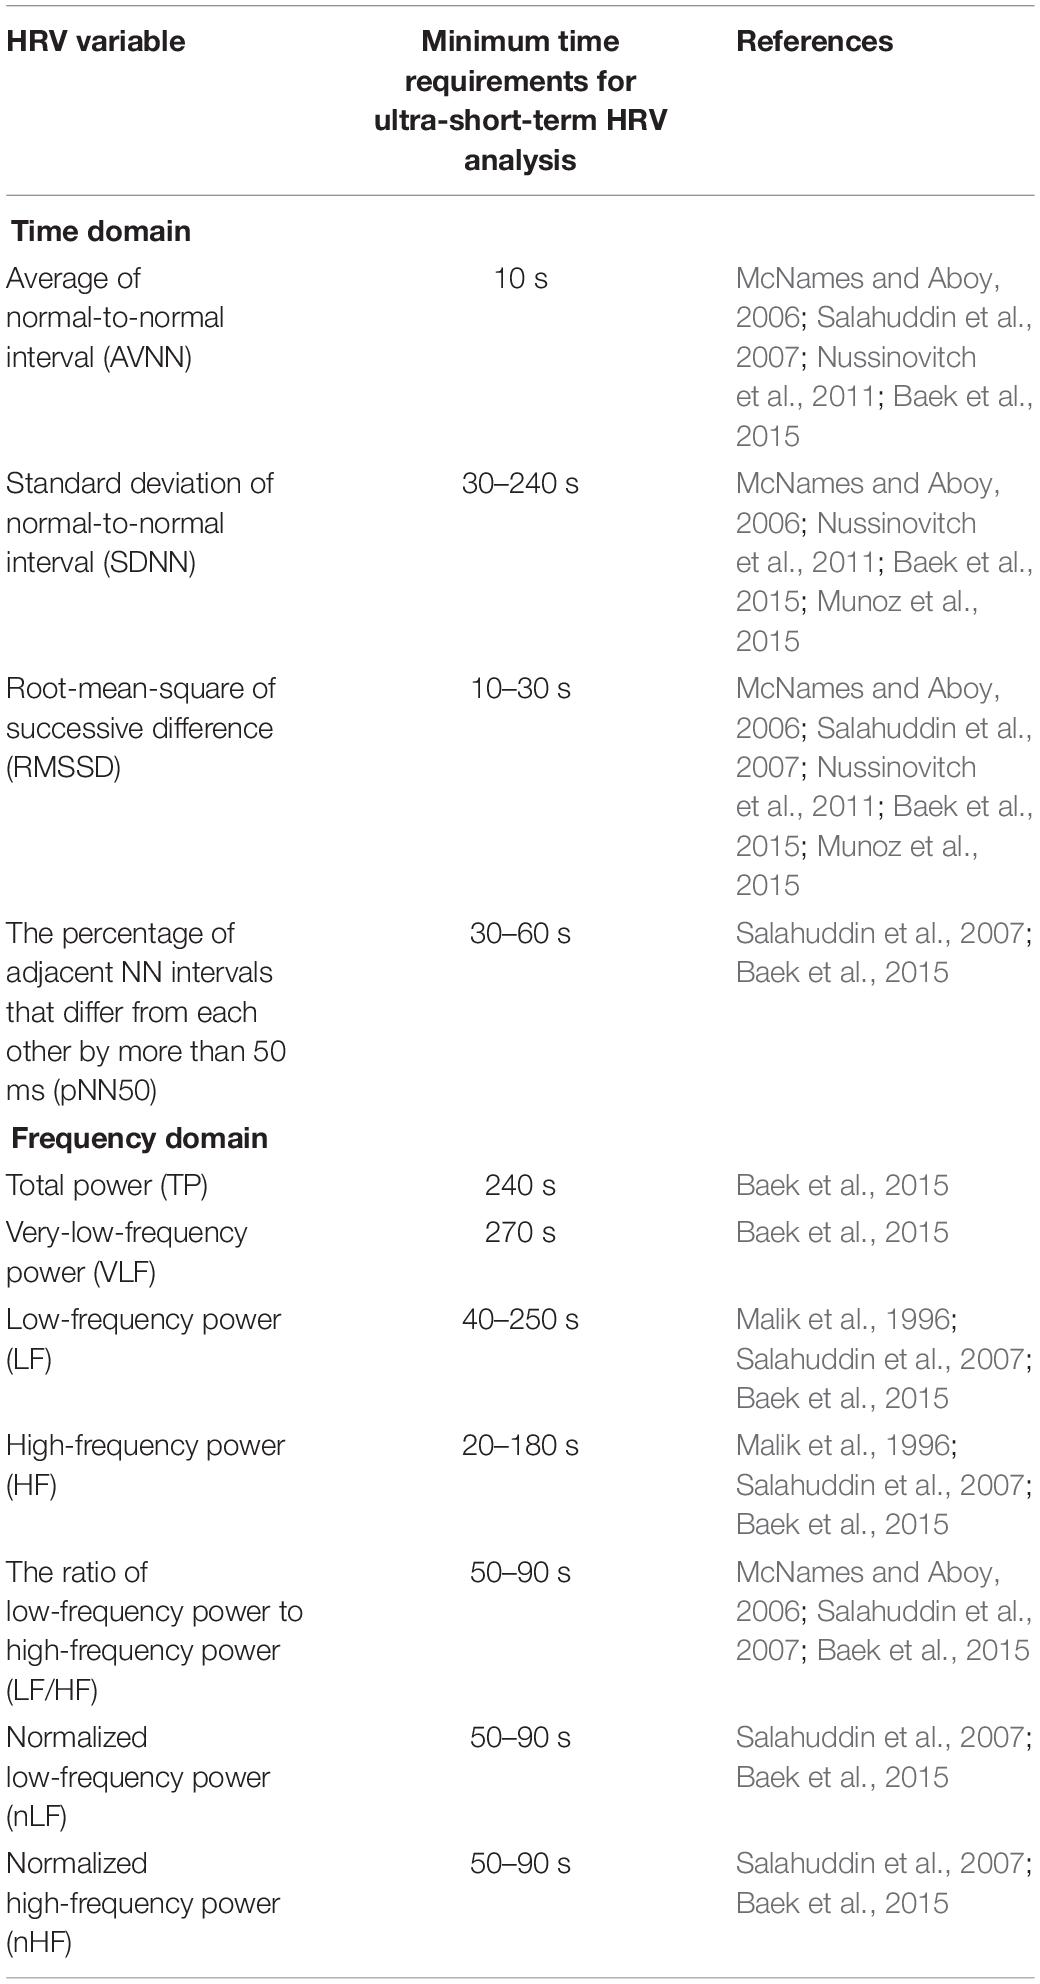
Table 1. Minimum time requirements for ultra-short-term HRV analysis.
The biggest pitfall of the previous studies was that ultra-short-term HRV was only evaluated in non-dynamic conditions, such as resting, despite its suggested use in situation including mobile healthcare. Dynamic activities occurring in daily life can activate and inhibit the autonomic nervous system, which can greatly affect HRV. Previous studies demonstrated that HRV was a reliable tool for assessing autonomic control of the HR during dynamic conditions such as walking before and after maximal effort (Hunt and Saengsuwan, 2018). However due to the exercise performed, average of normal-to-normal intervals (AVNN), standard deviation of normal-to-normal intervals (SDNN), root-mean-square of successive difference (RMSSD), percent of successive difference of normal-to-normal interval exceeds 50 ms (pNN50), total power (TP), low frequency (LF), high frequency (HF), and very low frequency (VLF) changed significantly from the resting state (Javorka et al., 2002; Leicht et al., 2008). In addition, significant changes in the SDNN, RMSSD, LF, and HF were observed according to exercise intensity (Buchheit et al., 2007; Martinmäki et al., 2008). Changes in HRV in post-exercise recovery conditions were also reported (Barak et al., 2010; Stanley et al., 2013). The above results demonstrate that the dynamic state causes a change in HRV, which may have a big impact on the analysis interval needed for ultra-short-term HRV. Thus, a separate analysis and dedicated criteria for ultra-short-term HRV in dynamic conditions are essential.
In the mobile healthcare environment, HRV is measured not only in the resting state, but also in various dynamic states such as standing, moving, and stopping. In addition, due to the nature of dynamic state measurements, a measurement time as short as possible is required. This study aimed to examine the feasibility of ultra-short-term HRV measurements in steady-state conditions, as well as dynamic conditions, using various statistical techniques. To this end, ultra-short-term HRV analysis was performed using ECGs obtained during rest, while exercising, and during post-exercise recovery, and the minimum required time for ultra-short-term HRV analysis was investigated in each condition and compared to the short-term HRV results.
Materials and Methods
Exercise Protocol
The experiments in this study were performed in the order of resting, while performing progressive resistance exercises, and during post-exercise recovery to induce autonomic activation in each condition (Figure 1). To minimize motion artifacts due to upper body movement during exercise, a stationary bicycle, DP-652-G-1 (Iwhasmp Inc., Seoul, South Korea) was used. The stationary bicycle used in the study had a total of eight levels of exercise intensity. Steps 1 and 2 were set to warm-up, steps 3, 4, 5, and 6 were set to moderate-intensity training, and steps 7 and 8 were set to high-intensity training. In the resting stage, the subject took a 10-min rest in the sitting position, and the latter 5 min of the ECG was used for HRV analysis. The exercise was performed for a total of 8 min, including 2 min of warm-up, taking into account the recommended exercise time for cardiopulmonary exercise testing (CPET) (Datta et al., 2015). During the exercise, the speed was maintained at 14–16 m/s. In the warm-up phase, the tension controller of the stationary bicycle was set to step one. After that, the step of the tension controller was increased by one step every two min to gradually increase the exercise intensity. In general, a heart rate greater than 85% of the age-predicted maximal heart rate is defined as high-intensity exercise, so when the subject’s heart rate reached 85% of the maximum age-related heart rate, the subject immediately stopped exercising and rested (Fletcher et al., 2013). Measurements in the post-exercise recovery condition were performed with the subject sitting comfortably on the stationary bicycle for 5 min. To exclude factors affecting HRV, subjects who had been drinking alcohol, consuming caffeine, smoking, had a lack of sleep, or were taking medication within 24 h that could affect the autonomic nerves were excluded. Since autonomic nervous system activity can change according to temperature and humidity (Zhu et al., 2018), the humidity of the measurement space was maintained at 65% and the temperature was maintained at room temperature at (20–28°C). The proposed protocol was approved by the Institutional Review Board (IRB) of Chonnam National University (IRB No. 1040198-190821-HR-090-02, Gwangju, South Korea). Figure 1 shows the experimental protocol and environment. All subjects provided written informed consent.
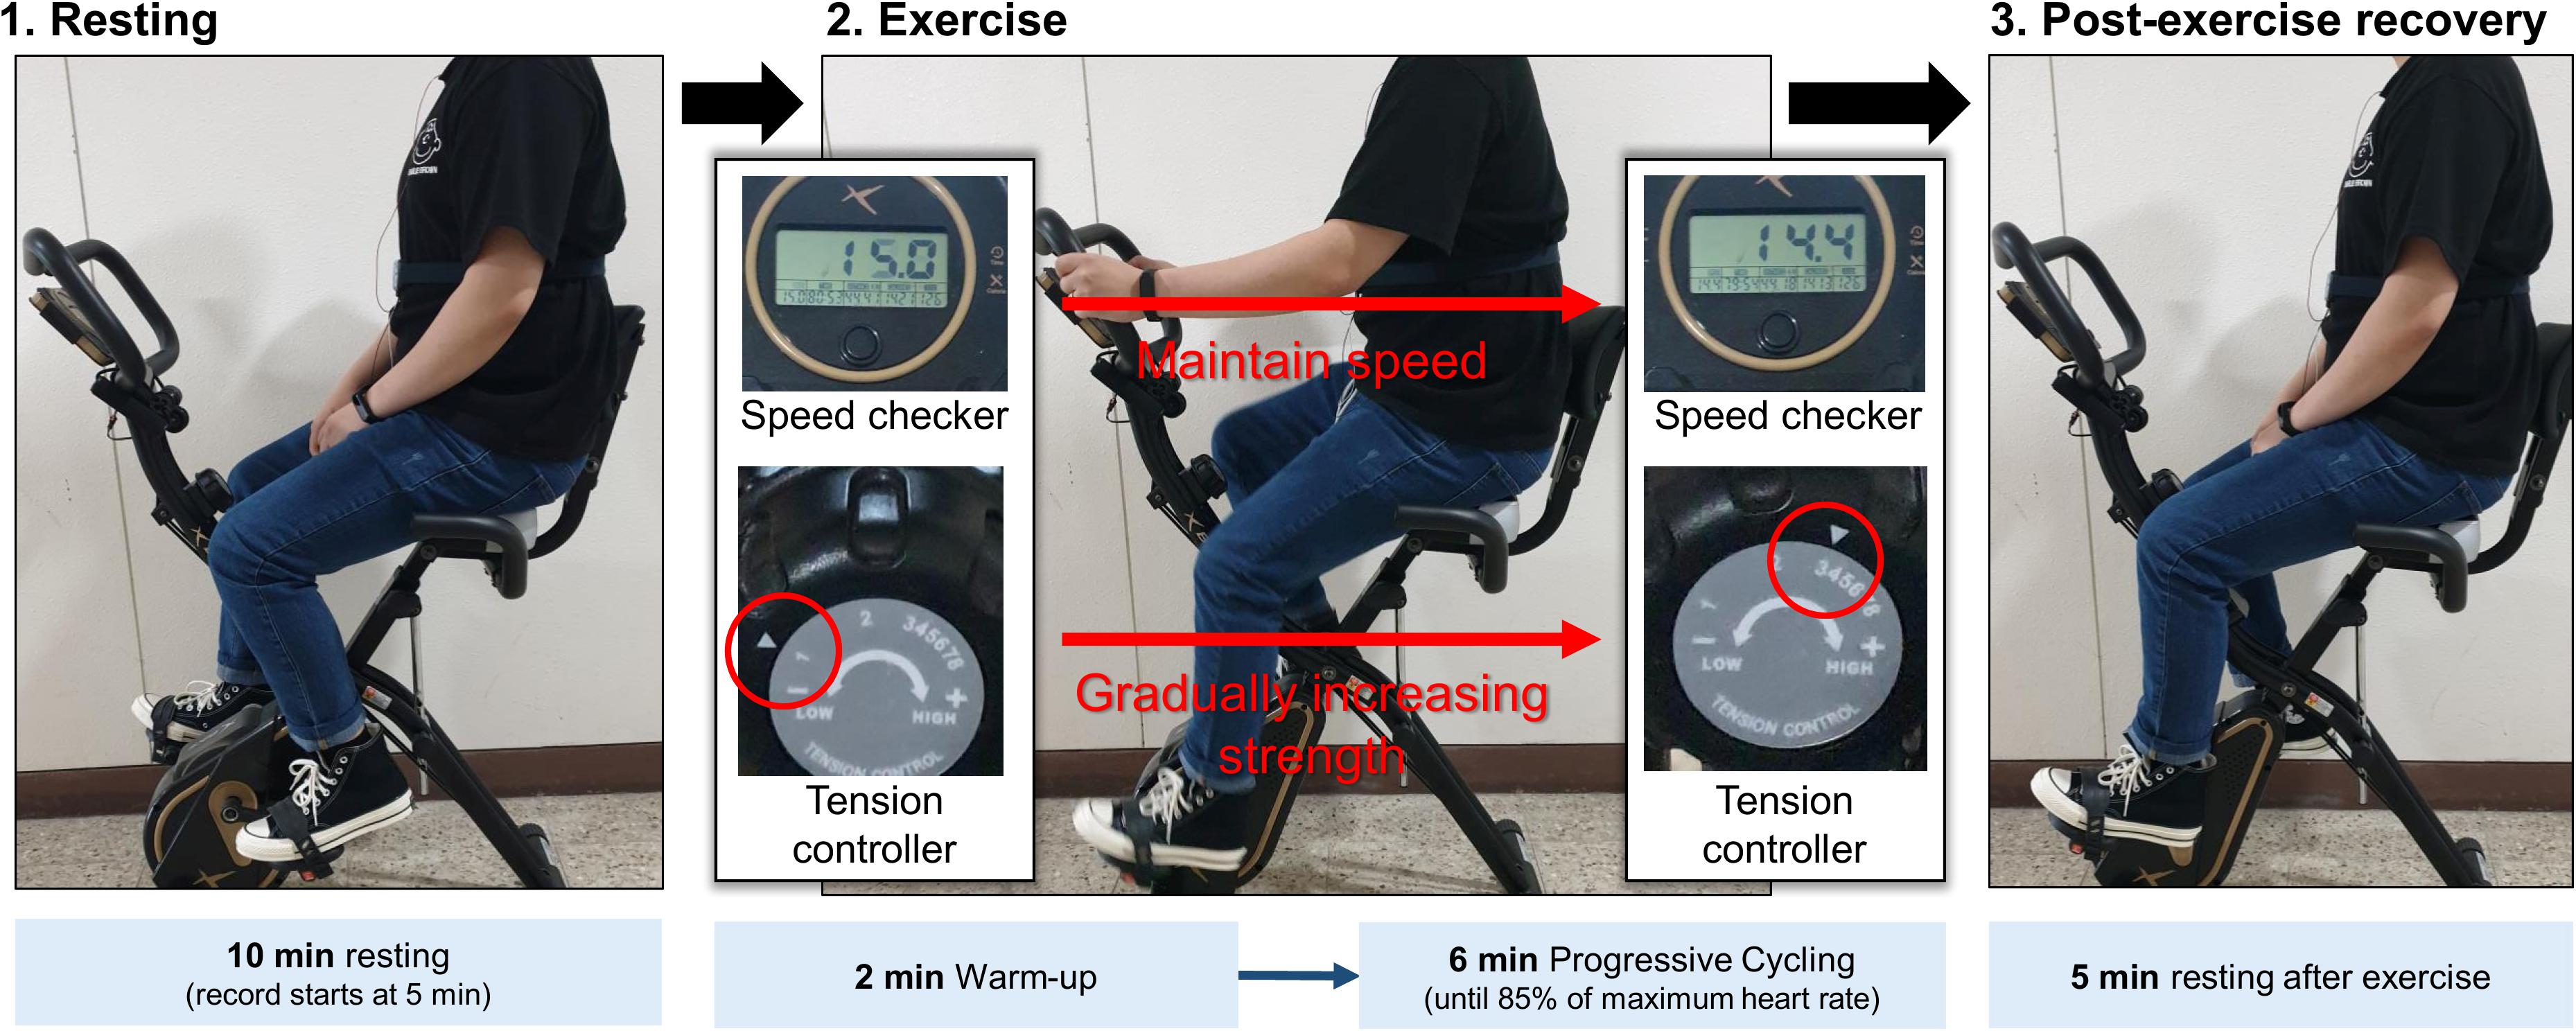
Figure 1. Experimental protocol.
Data Recording and Signal Preprocessing
The experimental protocol lasted a total of 23 min and ECG recordings were made for 18 min, except for the initial 5 min of the resting stage. ECG was measured with lead I at 1 kHz sampling frequency. An MP150 (BIOPAC Systems, Inc., CA, United States) and wireless module RSPEC-R (BIOPAC Systems, Inc., CA, United States) were used for the ECG measurements (Figure 2). The measured ECGs were stored on a laptop using BIOPAC’s AcqKnowledge software. As exercise can change the R–R interval (RRI) rapidly during warm-up, only the progressive cycling data after warm-up were used. ECG was bandpass filtered with a 0.05–30 Hz passband, and the QRS-complex was detected by the Pan and Tompkins (1985) QRS detection algorithm (threshold = 0.2). Experienced researchers checked whether the QRS complex was appropriately detected and manually corrected falsely detected QRS complex. Prior to data analysis, pre-screening was conducted and cases where the QRS waveform could not be intuitively observed due to severe motion artifacts were excluded from the analysis. During measurement, instrument errors and severe subject movements may cause errors in QRS detection such as a mis-detected QRS or missing QRS, which may result in abnormal RRIs. For example, a falsely detected QRS complex decreases or increases the RRI, and a missed QRS complex prolongs the RRI. Thus, the abnormal range of RRIs were corrected by removing and interpolating when the current RRI increased by more than 32.5% or decreased by more than 24.5% from the previous RRI (Marked, 1995; Choi and Shin, 2018). Linear interpolation was used for interpolating the RRIs. To analyze HRV according to the analysis time, the analysis interval was set to 10, 30, 60, 120, 180, 240, and 300-s lengths (Figure 3). After calculating the RRI for each analysis interval, time domain and frequency domain HRV variables were derived. As a result of the HRV analysis, seven resting condition datasets, seven exercise condition datasets, and seven post-exercise recovery condition datasets were derived per subject, including six ultra-short-term HRVs per measurement condition.
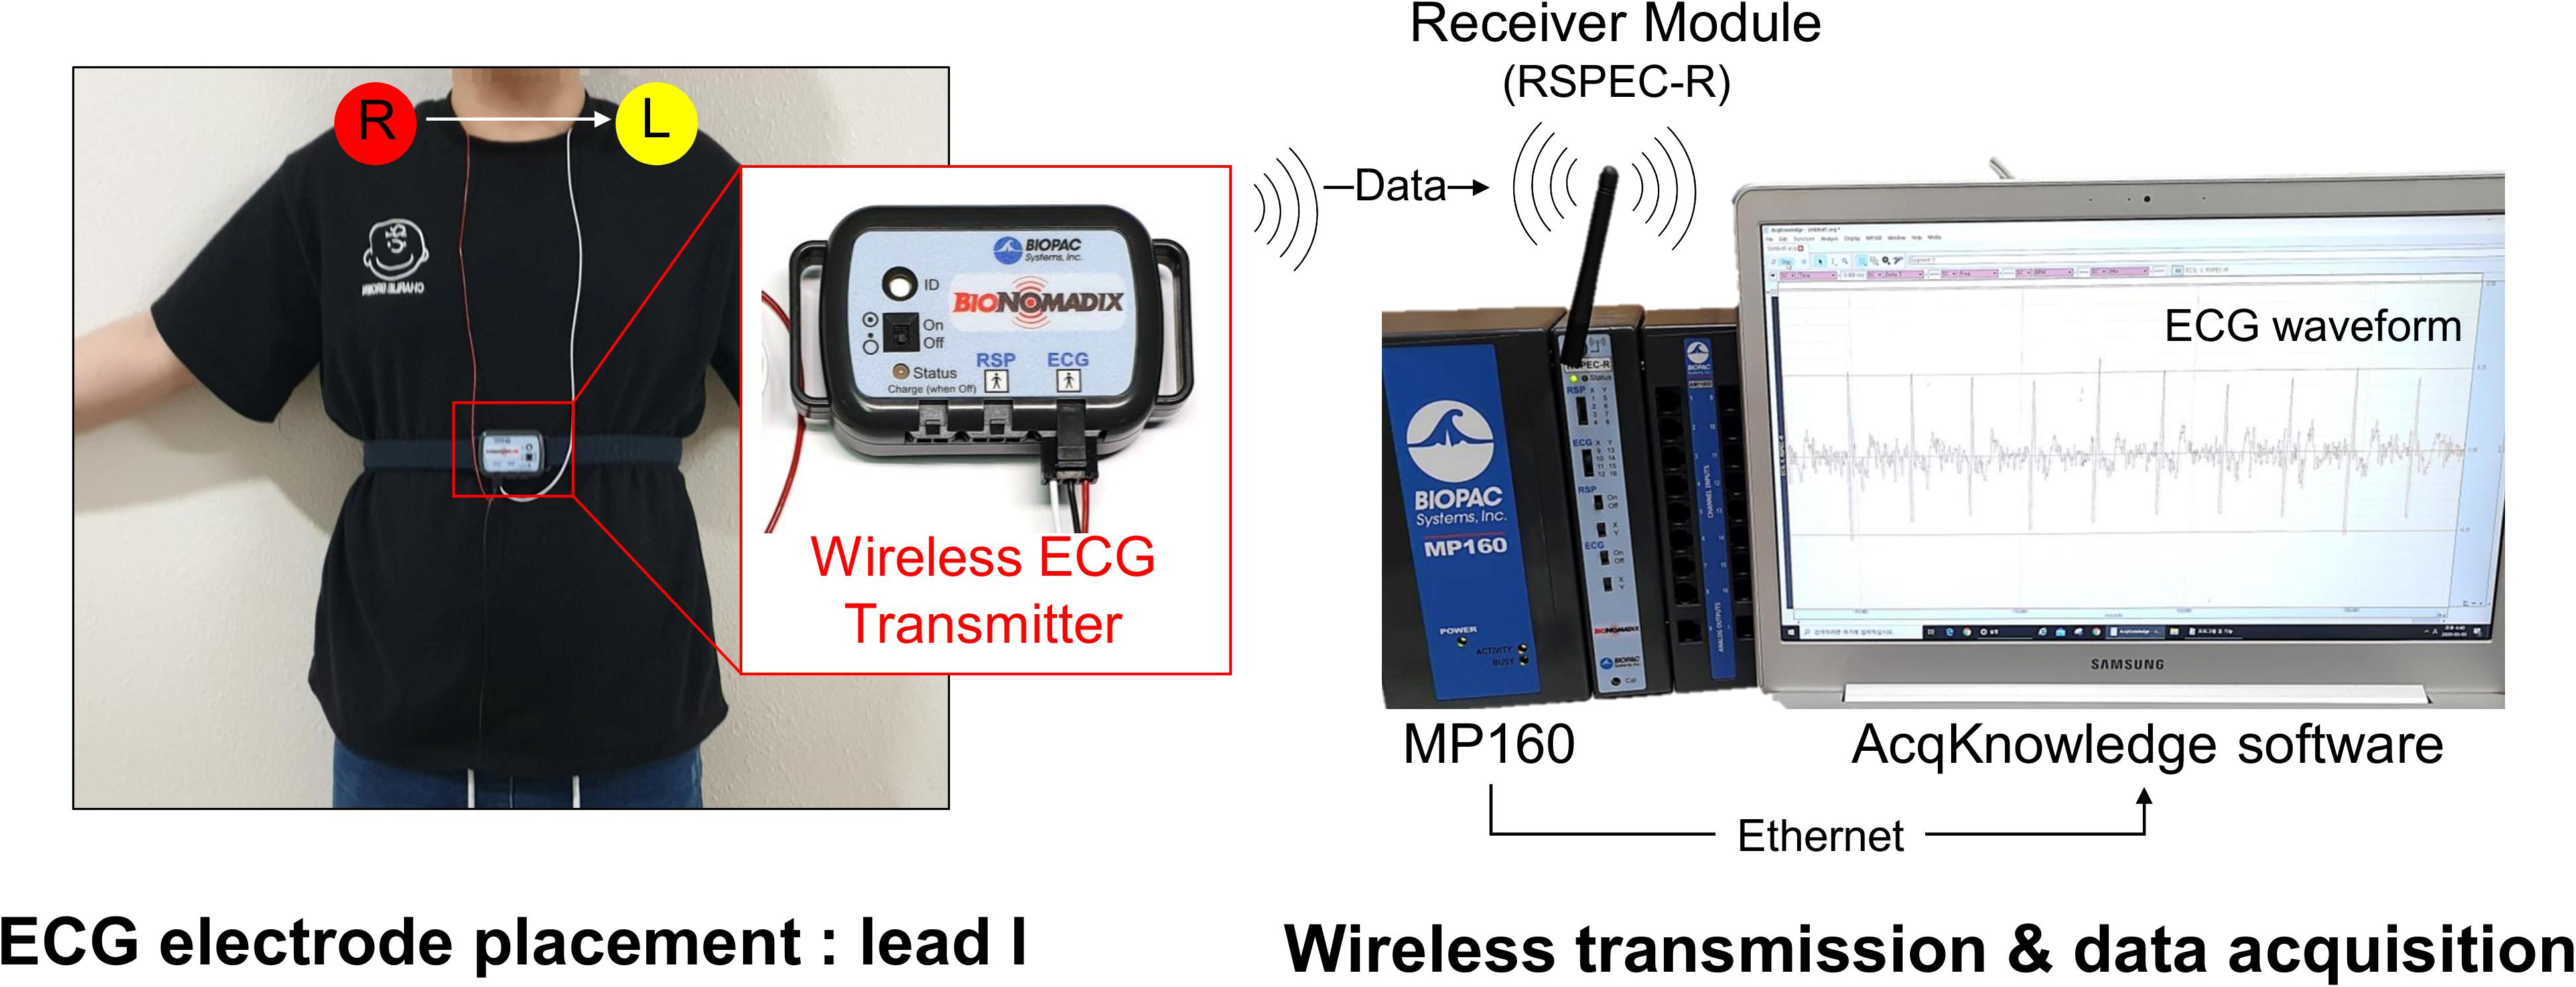
Figure 2. System configuration for obtaining electrocardiograms.
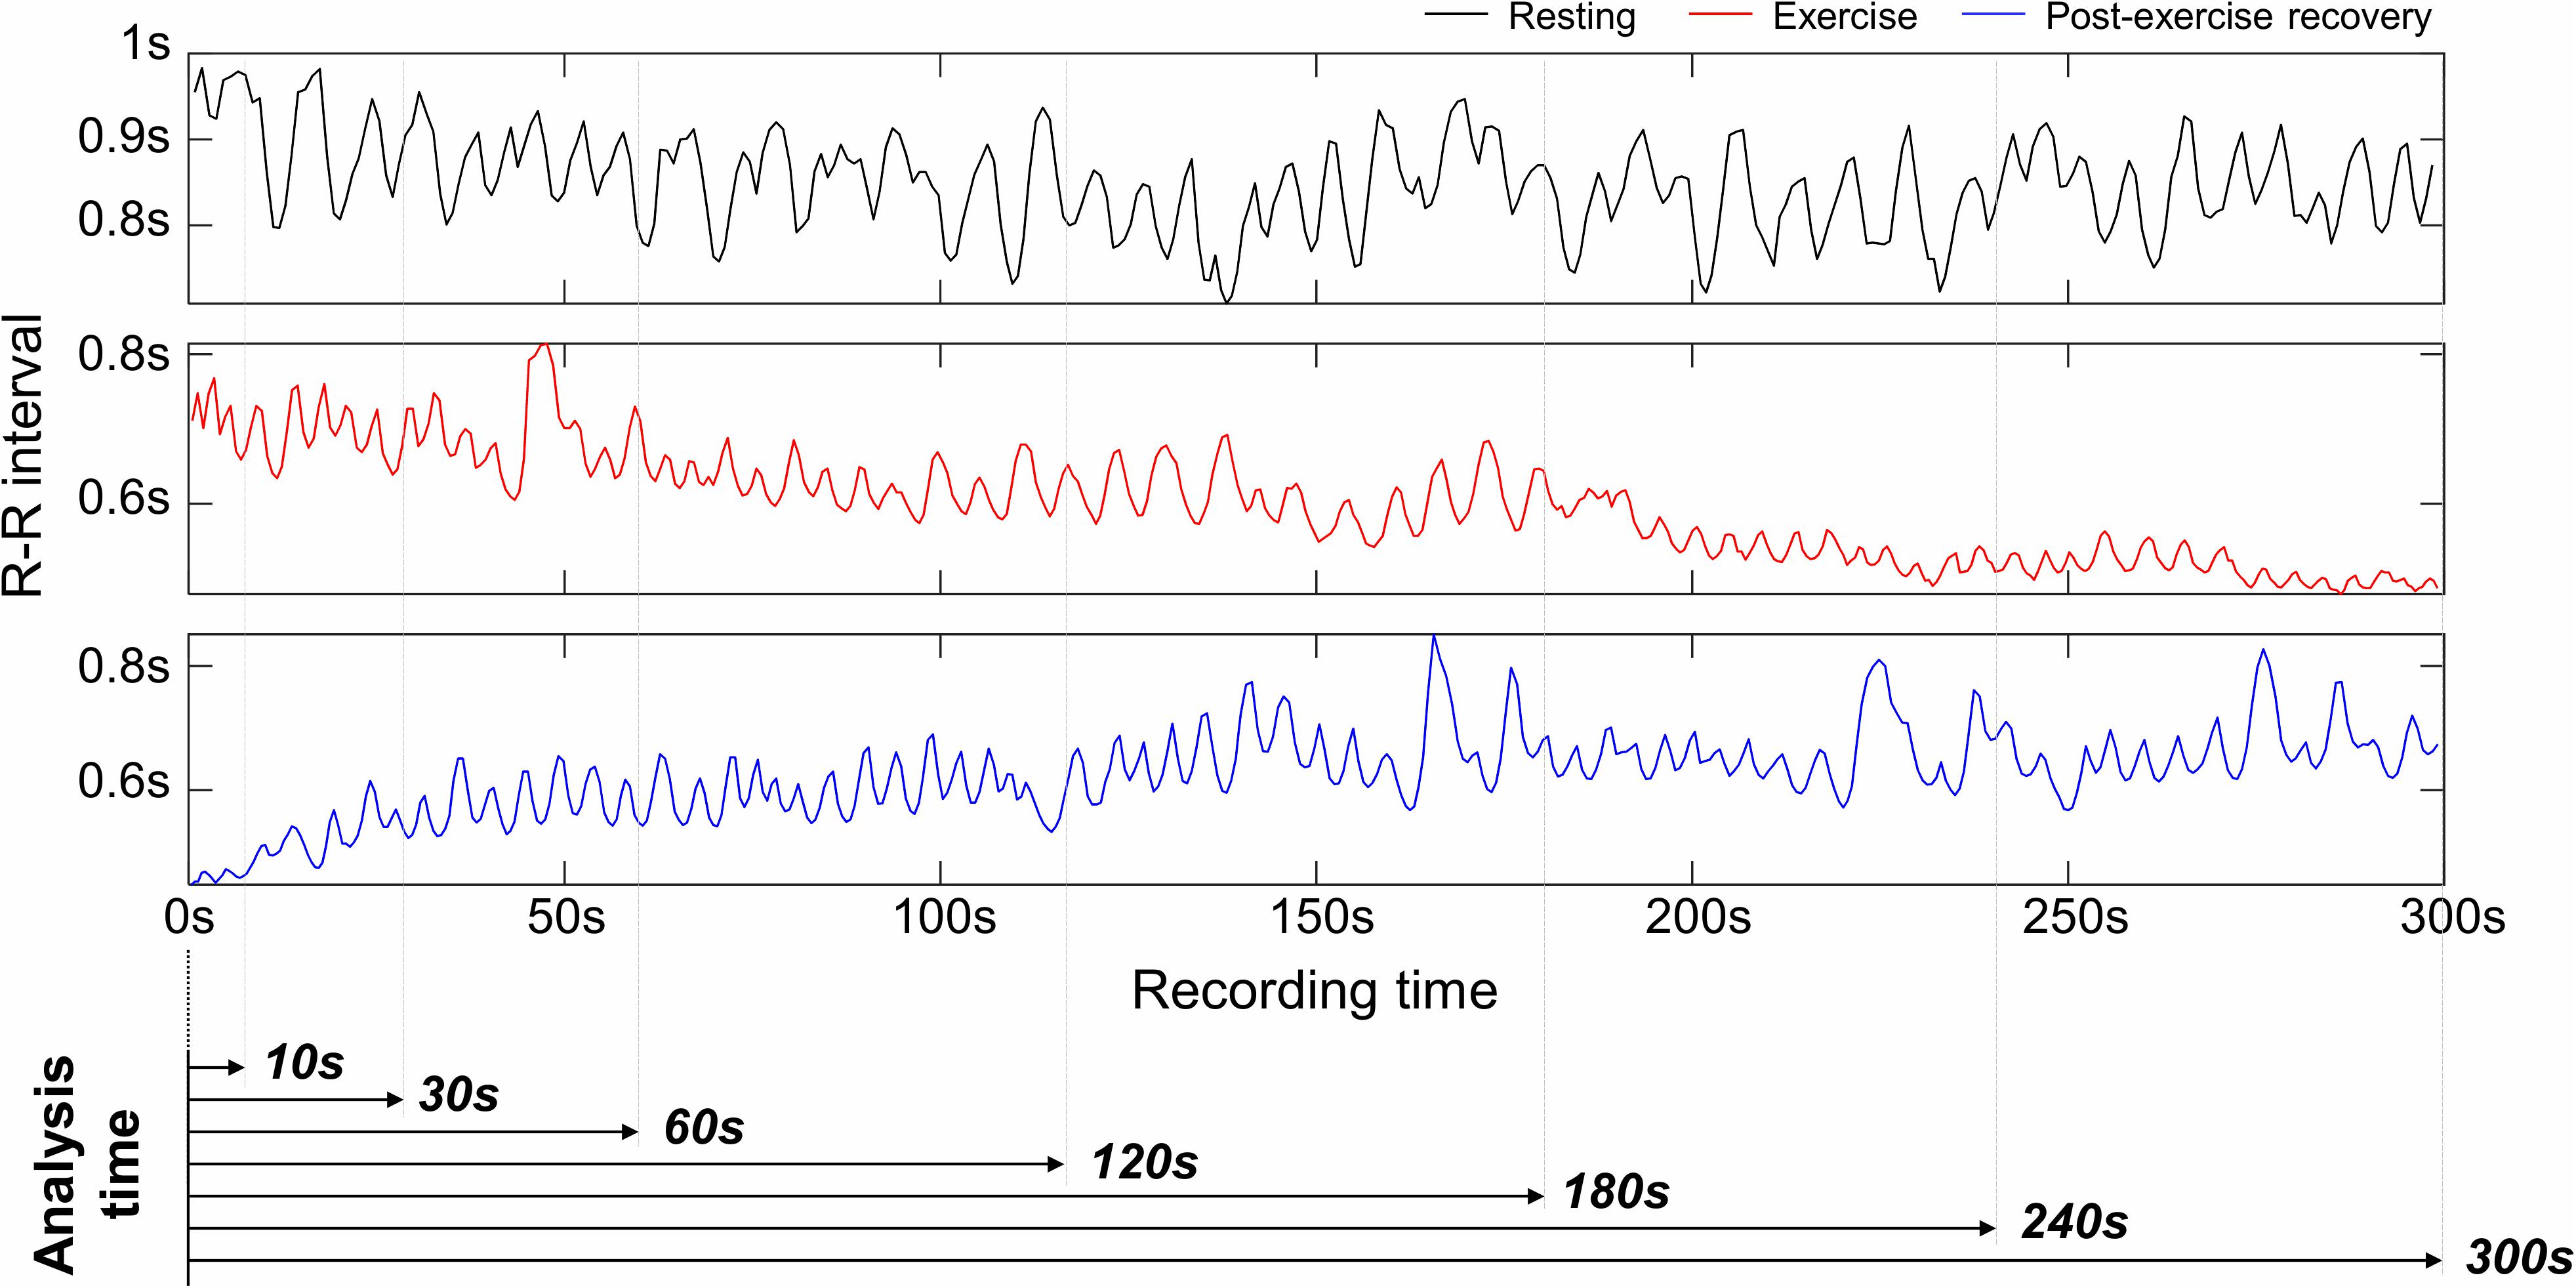
Figure 3. Examples of R–R interval in resting, exercising, and post-exercise recovery conditions, and analysis intervals for ultra-short-term heart rate variability analysis.
HRV Parameters
The HRV variables used in this study were AVNN, SDNN, standard deviation of successive difference (SDSD), RMSSD, and pNN50 in the time domain, and TP, VLF, LF, HF, LF/HF, normalized LF (nLF), and normalized HF (nHF) in the frequency domain (Acharya et al., 2006). Table 2 shows the definition of each HRV variable. For the HRV frequency domain analysis, the RRIs were transformed to an evenly sampled time series by resampling with 4 Hz after 1 kHz linear interpolation, and both the mean and linear trends were removed. The power spectral density was estimated by fast Fourier transform. The frequencies corresponding to VLF, LF, and HF were set to 0.0033–0.04, 0.04–0.15, and 0.15–0.4 Hz, respectively. HRV variables reflect various physiological activities related to the autonomic nervous system. The HF reflects parasympathetic or vagal activity frequently called the respiratory band. The LF is known to primarily reflect baroreceptor activity while at rest (Malliani, 1995).
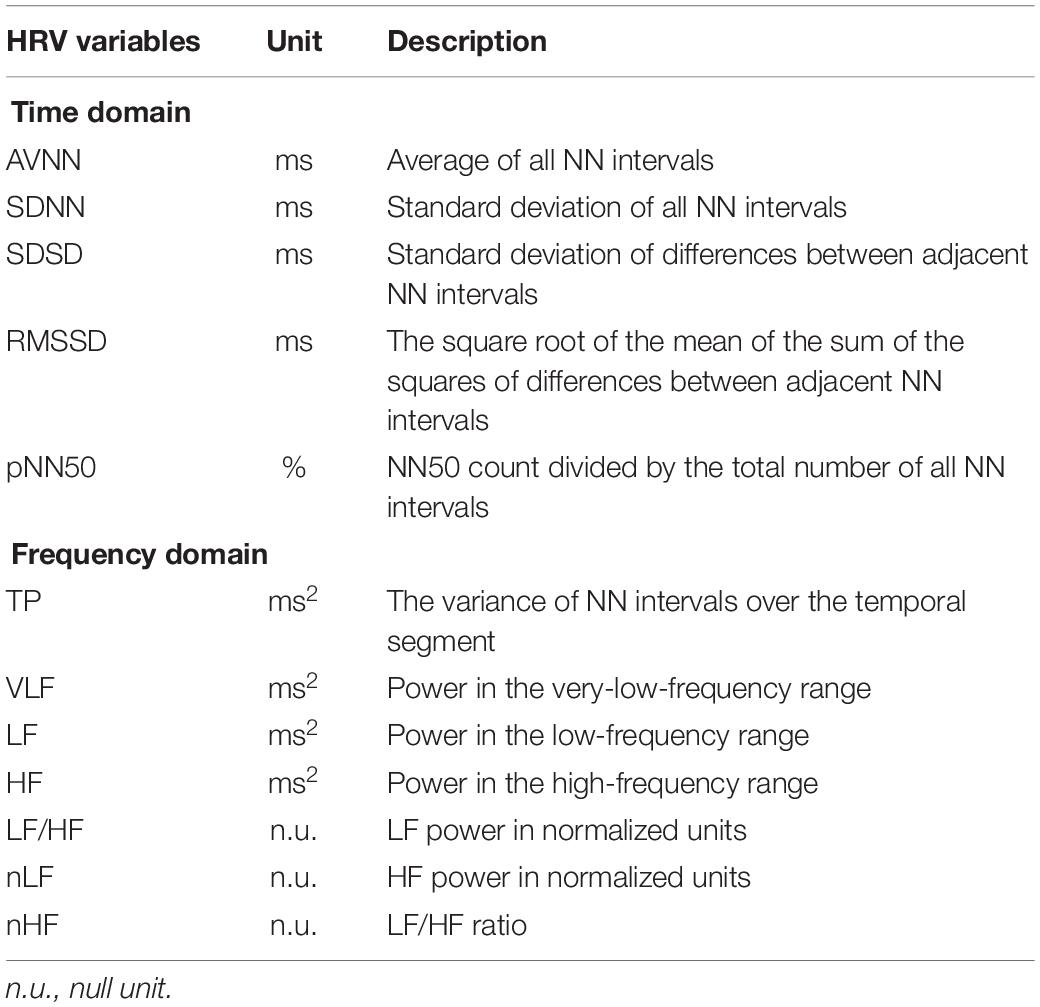
Table 2. Definition of HRV variables.
Since this study aimed to verify the significance of short-term and ultra-short-term HRVs, the SDNN index (the mean of the 5 min standard deviation of the average NN intervals), the standard deviation of the average NN intervals (SDANN), and ultra-low-frequency power (ULF) were excluded from the analysis.
Statistical Analysis
Statistical significance was assessed for each variable of the ultra-short-term HRV and short-term HRV measured at rest, while exercising, and during post-exercise recovery. Prior to the analyses, all HRV variables were log-transformed to obtain approximately normal distributions. For statistical analysis, to test agreement with the null hypothesis, the ANOVA test was performed when the equivariance and normality conditions were satisfied, and the Kruskal-Wallis test was performed when the equivariance was satisfied without normality. Otherwise, Friedman’s test was performed. Bonferroni’s post hoc test was carried out for inter-group comparisons. Prior to the analysis of variance, Levene’s test was used to assess the homogeneity of variance, and the Kolmogorov-Smirnov test was used to test normality. P-values of less than 0.05 were considered to indicate statistical significance.
We calculated Cohen’s d statistics to quantify the bias of the HRV measurements of different analysis intervals relative to their within-group variations (Cohen, 1988). Cohen’s d is an appropriate effect size indicating the standardized measure of the size of the mean difference or the relationship among the study groups and is used to indicate the standardized difference between two means. Cohen’s d is determined by calculating the mean difference between the two groups and then dividing the result by the pooled standard deviation that is a weighted average of the standard deviations of two or more groups. The individual standard deviations are averaged, with more weight given to larger sample sizes (Equation 1).
where, SDpooled is , and M1 and M2, and SD1 and SD2 are the mean and standard deviation of the two groups, respectively.
The d value is interpreted in a range from 0.01 to 2.0, where 0.01 is very small, 0.2 is small, 0.5 is medium, 0.8 is large, 1.2 is very large, and 2 is huge (Cohen, 1988; Rosenthal, 1990). A d of 1 indicates that the two groups differ by 1 standard deviation, while a d of 2 indicates that they differ by 2 standard deviations.
In this study, a d value of less than 0.5 was set as the criterion indicating two groups had similar values, and the minimum required interval was evaluated using shortest ultra-short-term HRV interval measured as the minimum time interval for which this criterion was maintained. Pearson’s correlation coefficients (R) were calculated between the short-term HRV and the ultra-short-term HRV values. In this study, R > 0.8, which is generally used to represent a strong correlation, was set as the ultra-short-term HRV measurability criterion. However, a strong correlation does not guarantee a close agreement between two groups. Therefore, the Bland–Altman (BA) analysis was carried out to analyze the agreement between short-term HRV and ultra-short-term HRV with 95% limits of agreement (LoA) (Altman and Bland, 1983; Bland and Altman, 2003). We performed a BA analysis with the x-axis as the ground truth (short-term HRV) (Krouwer, 2008). The bias was calculated as the mean difference between the short-term HRV and ultra-short-term HRV measurements. In this study, we examined whether the LoA of the ultra-short-term HRV variable included the zero-difference line of the BA plot, indicating the short-term HRV equaled the ultra-short-term HRV. This is not the method used in the general BA analysis but was used to check the measurability based on whether the LoA of the estimated value of the ultra-short-term HRV included the ground truth. We used 50% LoA as a decision threshold, which means that the interquartile range of the derived ultra-short-term HRV variable included the ground truth. Matlab 2016a (Mathworks, Inc., MA, United States) was used for signal processing in the HRV analysis and statistical analyses.
Results
Experimental Data
Experiments and data acquisition were performed on 30 healthy adults without cardiovascular disease, eight of whom were excluded due to severe motion artifacts during the experiment, preventing the QRS from being distinguished intuitively. Finally, the data from 22 participants were used for the analysis. Table 3 shows the demographics of the subjects who participated in the experiment.
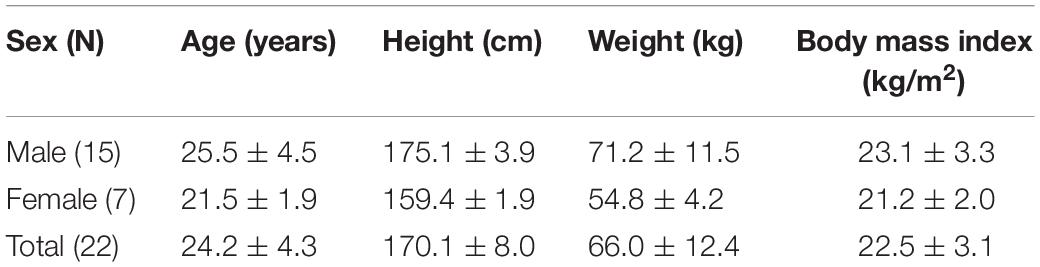
Table 3. Participant demographics.
Null Hypothesis Testing
Figure 4 and Table 4 show the ultra- and short-term HRV results in resting, exercising, and post-exercise recovery conditions. The results of the null hypothesis test showed that all HRV variables were significantly (P < 0.05) different, except pNN50 in the resting and exercising conditions, and HF in the resting condition. The Bonferroni post hoc test showed significant differences (P < 0.05) in the resting state between ultra-short-term HRV and short-term HRV at analysis intervals of ≤10 s in the SDNN, LF, LF/HF, and HF; ≤30 s intervals in the AVNN; and ≤60 s intervals in the SDSD and RMSSD. In the exercising state, significant differences were found at ≤10-s intervals in the TP, LF, LF/HF, nLF, and nHF; at ≤60-s intervals in the VLF and HF; and at ≤180-s intervals in the SDNN, SDSD, and RMSSD. In the recovery stage, significant differences (P < 0.05)
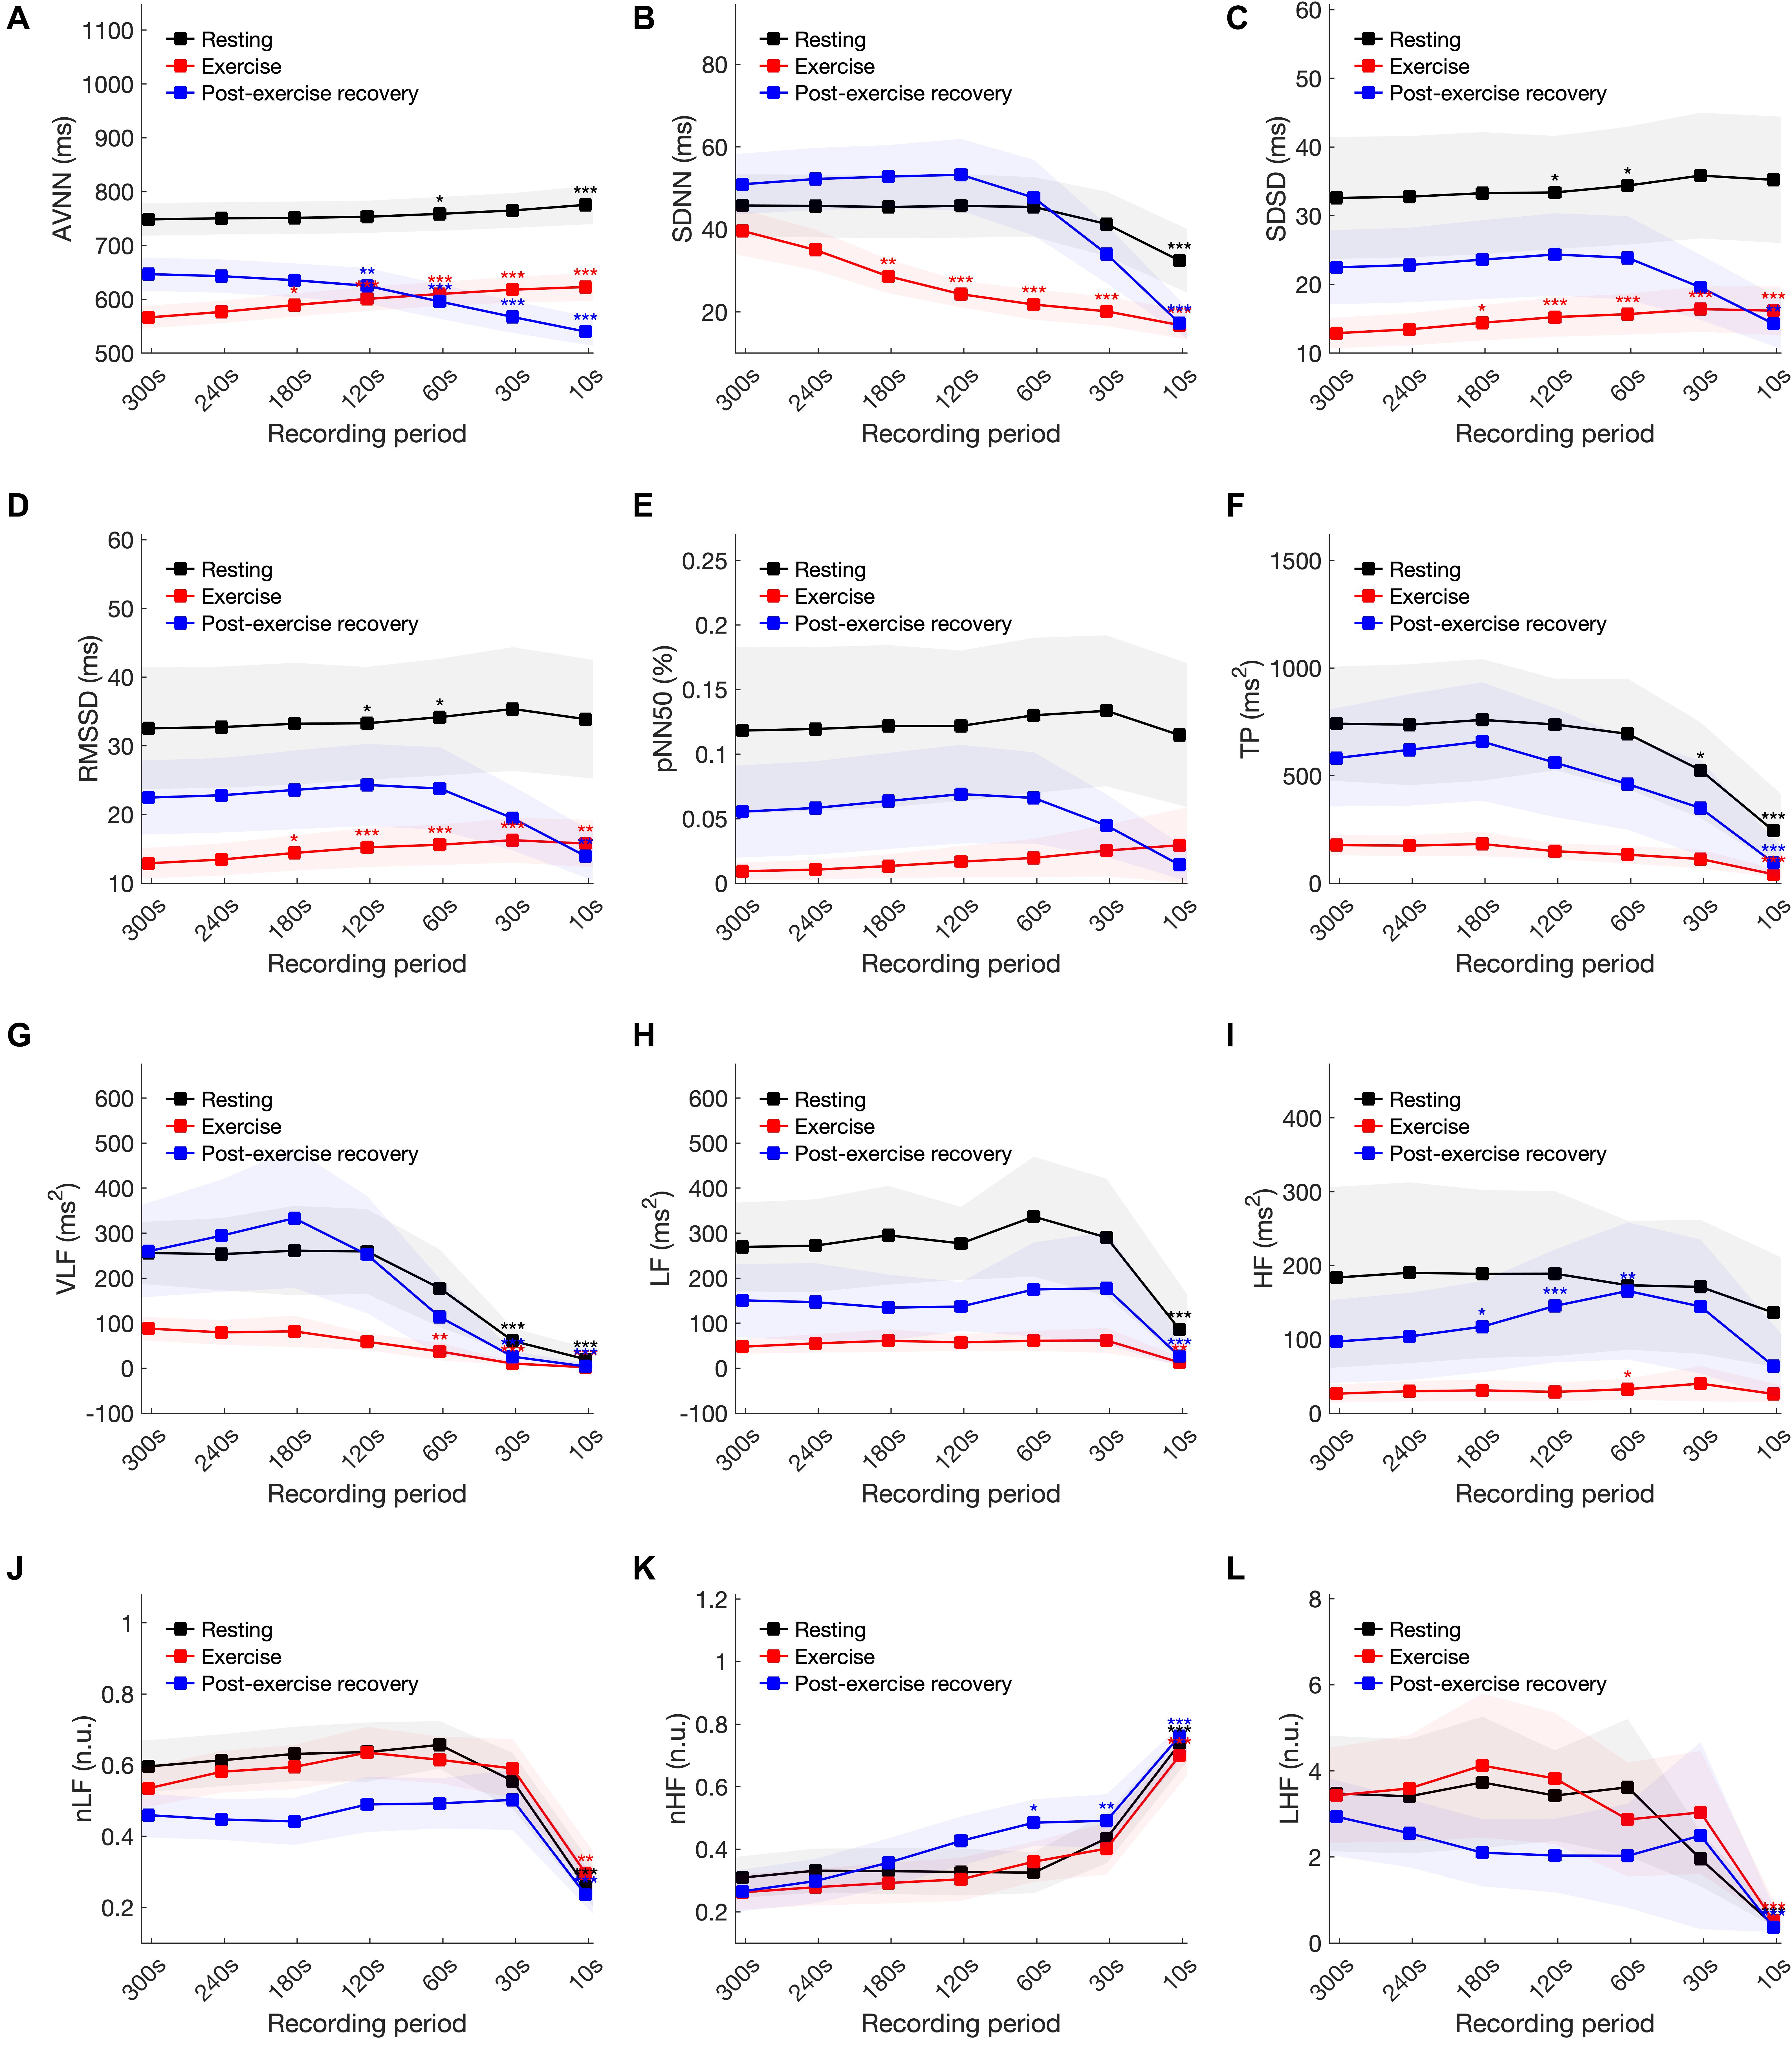
Figure 4. Statistical analysis of heart rate variability variables in resting, exercising, and post-exercise recovery conditions according to shortening of the analysis interval. (A) AVNN, (B) SDNN, (C) SDSD, (D) RMSSD, (E) pNN50, (F) TP, (G) VLF, (H) LF, (I) HF, (J) LH/HF, (K) nLF, and (L) nHF. Statistical significance was evaluated compared to the 300-s analysis results at *P < 0.05, **P < 0.01 and ***P < 0.001.
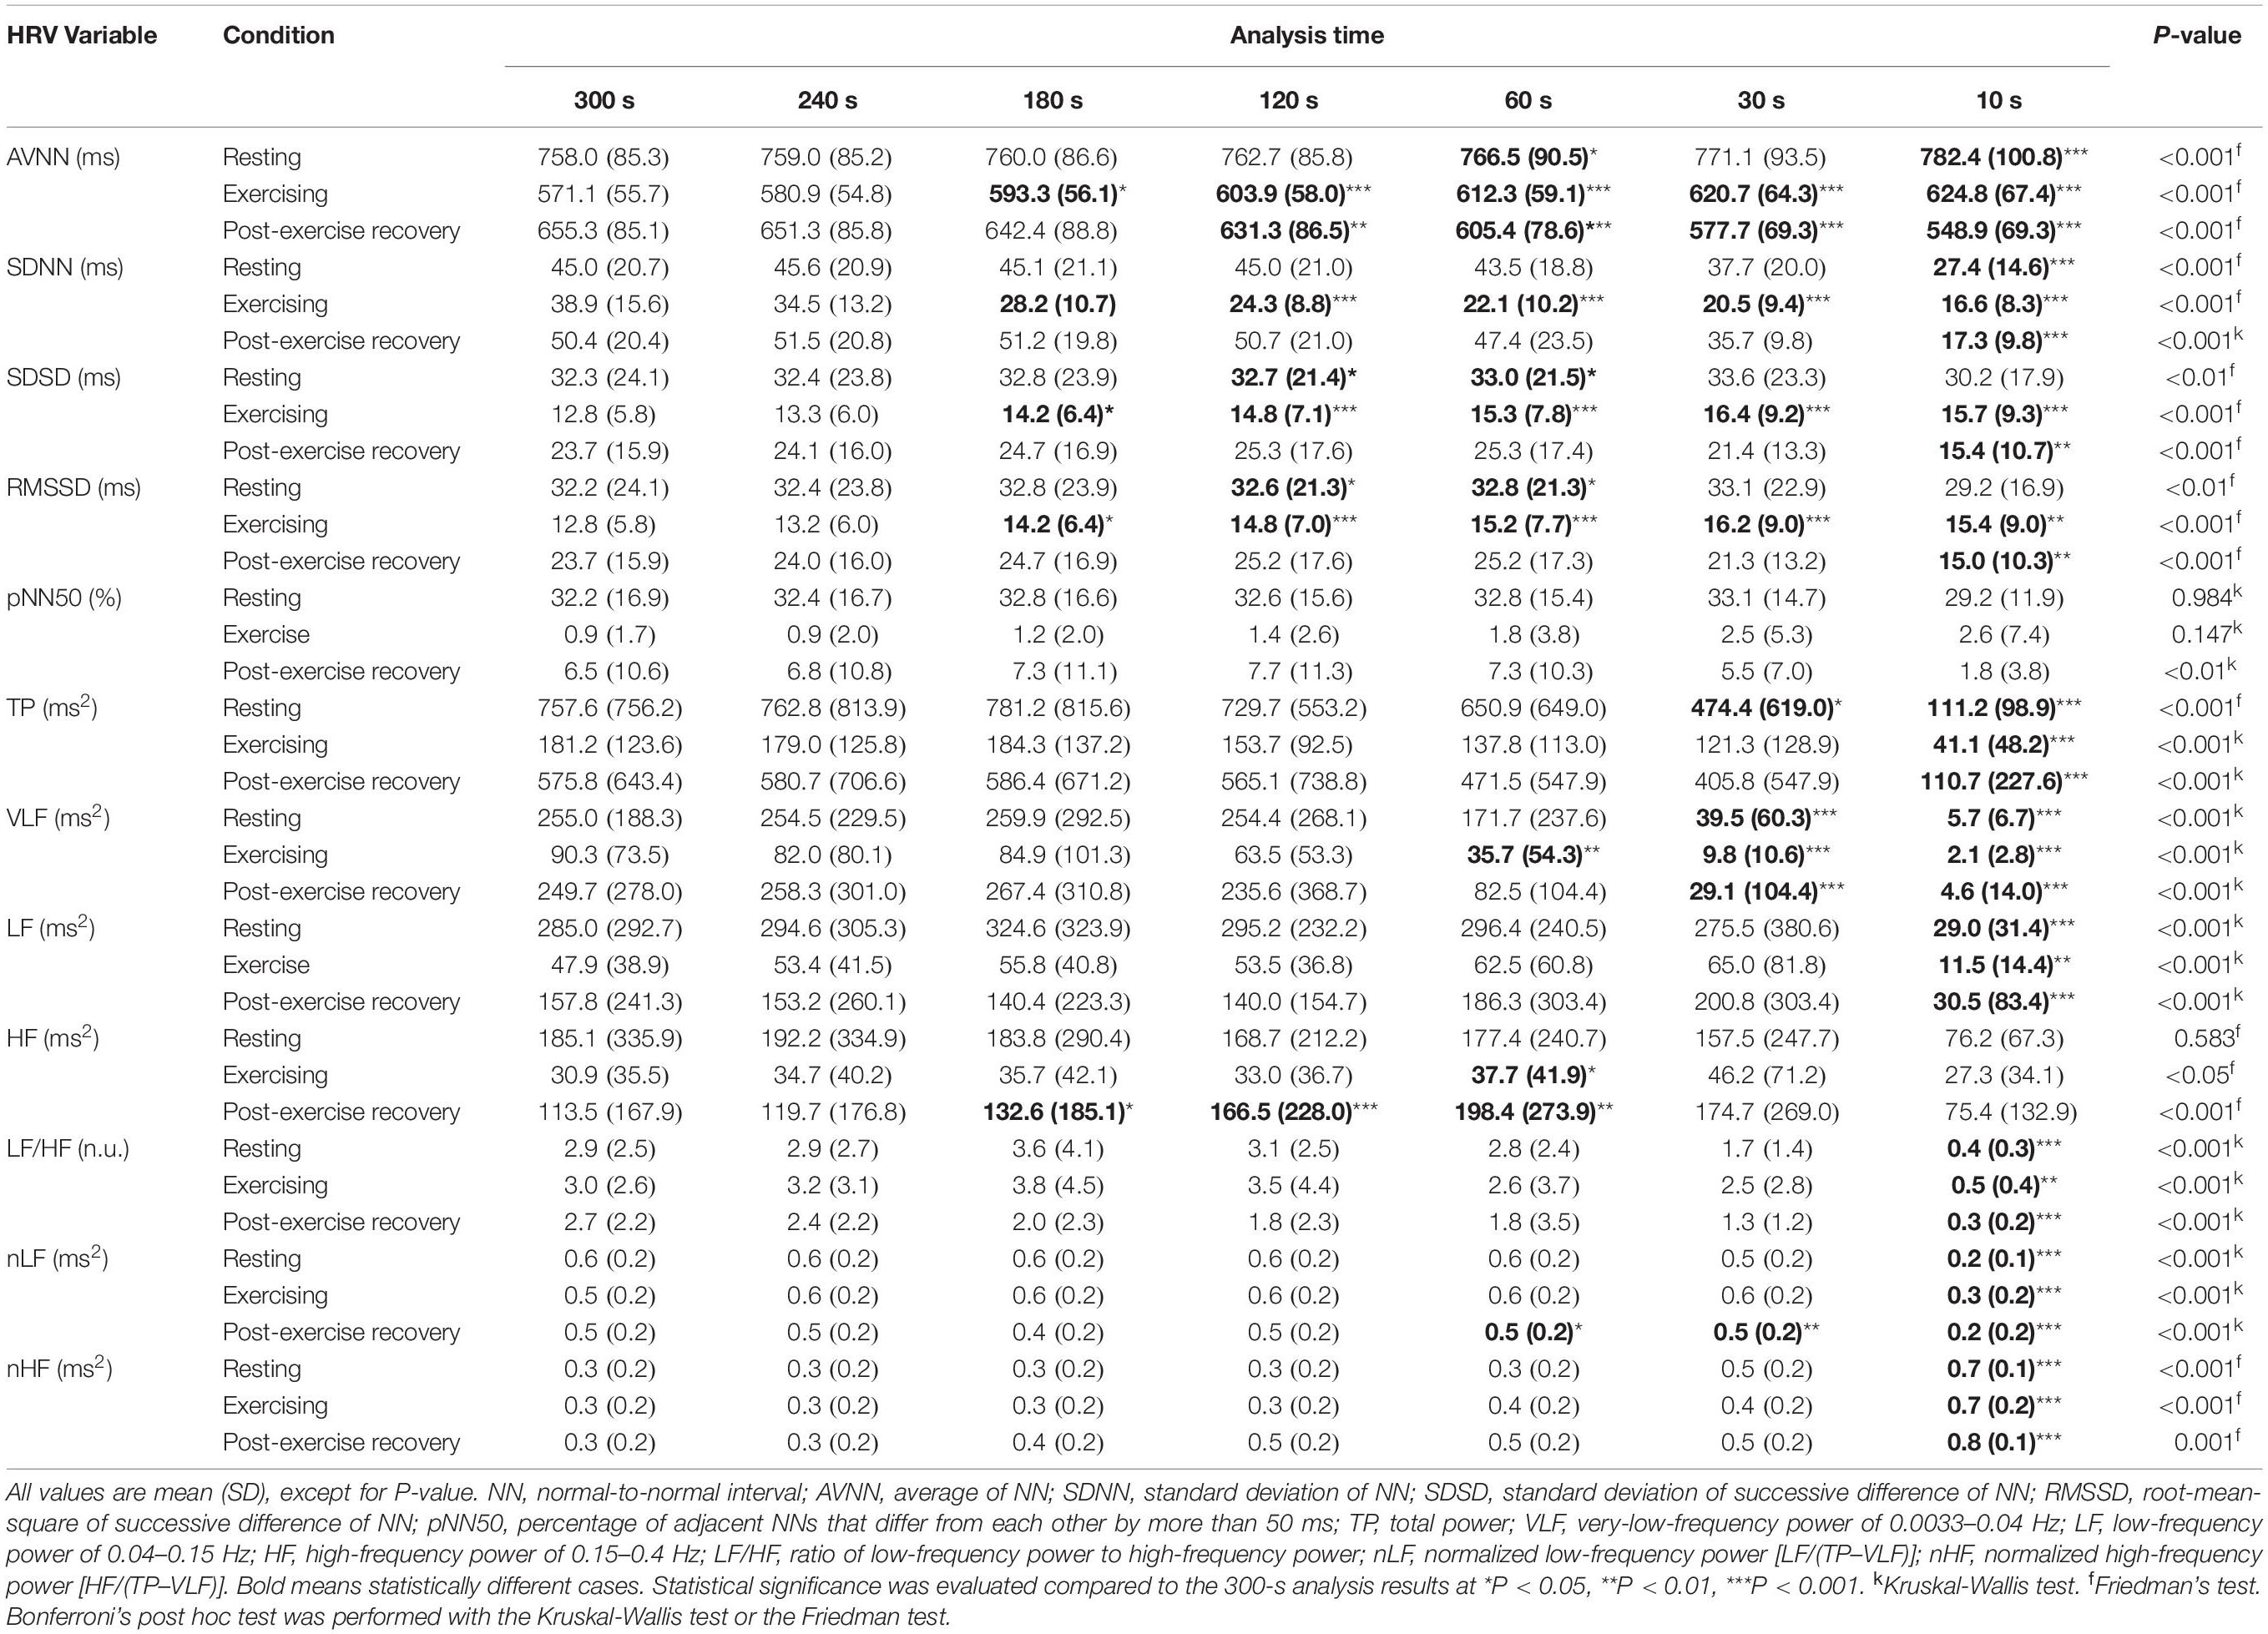
Table 4. Ultra-short-term and short-term HRV group statistical results in resting, exercising, and post-exercise recovery conditions.
were found at ≤10-s intervals in the SDNN, SDSD, RMSSD, TP, LF, LF/HF, and nHF; at ≤30-s intervals in the VLF; at ≤60-s intervals in the nLF; ≤120-s intervals in the AVNN; and ≤180-s intervals in the HF.
Cohen’s d Statistics
Figure 5 and Supplementary Table 1 of the Supplementary Information (SI) show Cohen’s d statistics for the ultra-short-term HRV values. The minimum recording time required for each variable except for the ultra-short-term HRV values indicated as not available (n/a) was as follows for resting, exercising, and post-exercise recovery, respectively: AVNN: 120 s, n/a, and n/a; SDNN: 60 s, n/a, and n/a; SDSD: 240 s, n/a, and n/a; RMSSD: 240 s, n/a, and n/a; pNN50: 30, 120 s, and n/a; TP: 60, 120, and 120 s; VLF: 120, 180, and 120 s; LF: 30 s, n/a, and 30 s; HF: 10 s, n/a, and n/a; LF/HF: 30, 30, and 30 s; nLF: 60 s, n/a, n/a; and nHF: 30, 30 s, and n/a. The 95% confidence interval of d was >0.5 in all cases, and the interval was wider in the post-exercise recovery and exercising states than in the resting condition. Cohen’s d tended to increase with decreasing analysis interval, regardless of the experimental conditions. In addition, except for some cases, d was increased in the exercising and recovery conditions compared to the resting state. Based on the 240 s results, in some cases, d was smaller compared to the resting condition results. For example, TP was lower in the resting condition than in the exercising and post-exercise recovery conditions. In LF/HF, d decreased in the post-exercise recovery condition, whereas pNN50 and nHF decreased in the exercising condition.
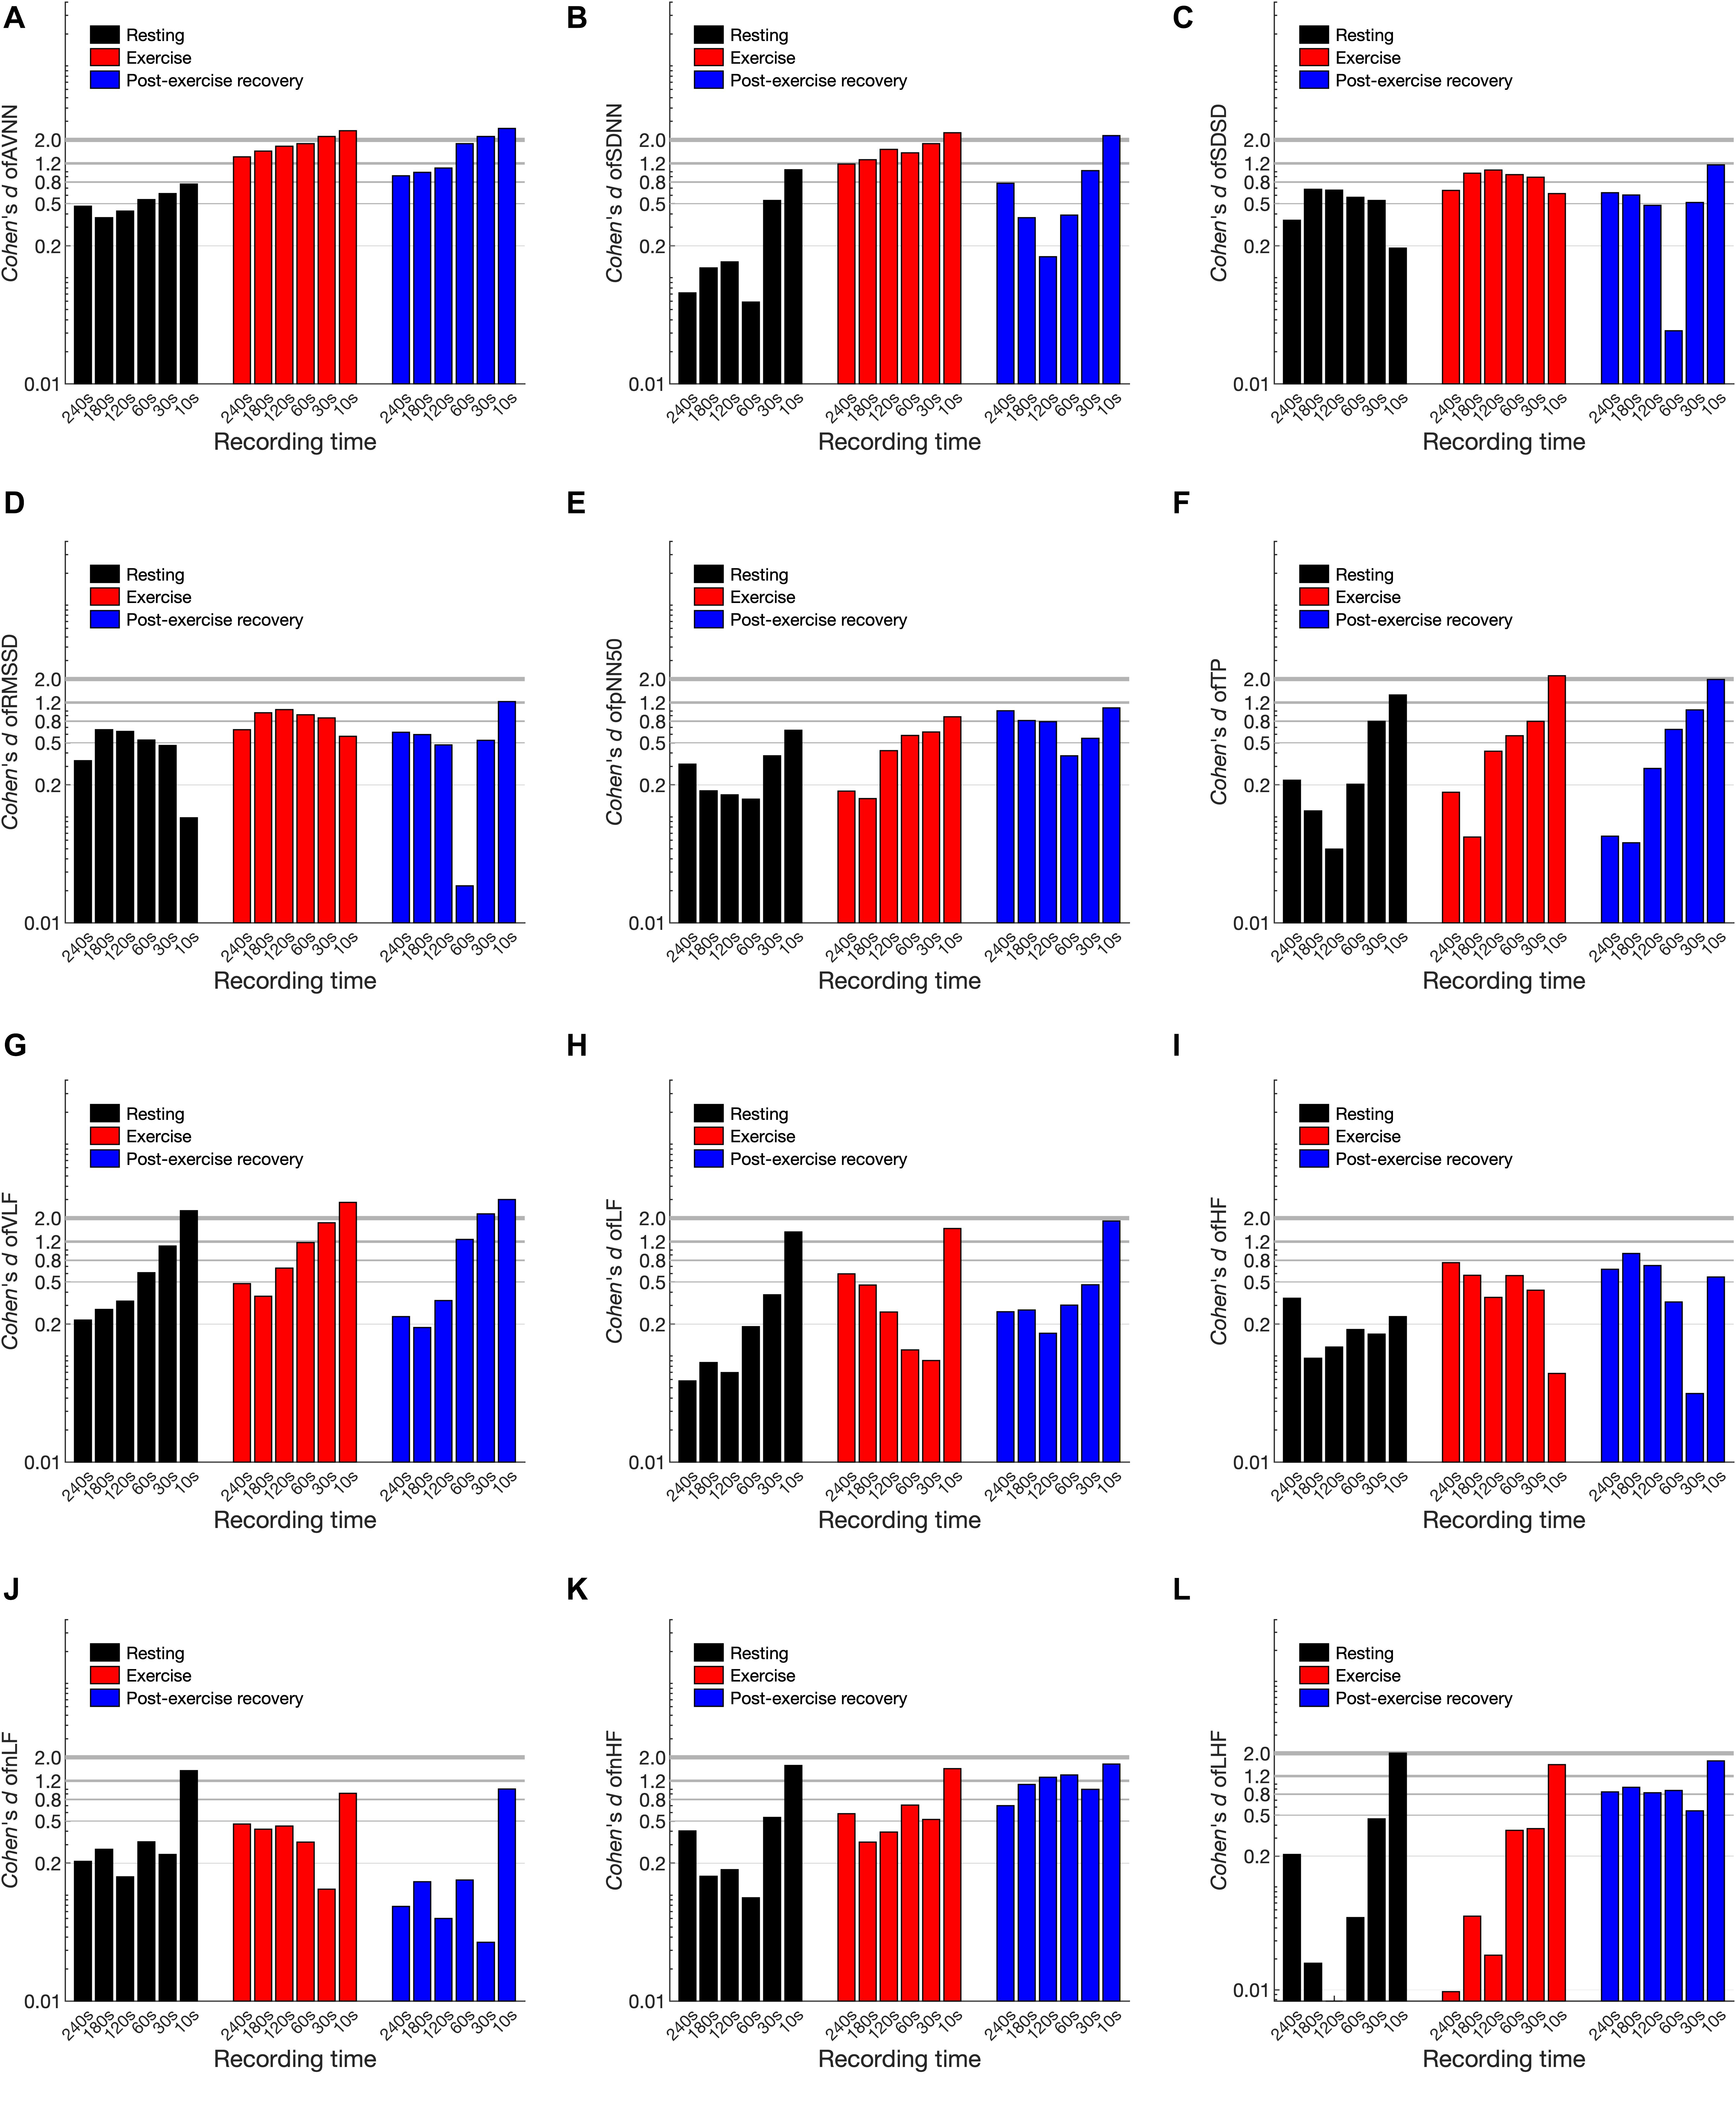
Figure 5. Cohen’s d statistics of heart rate variability variables in resting, exercising, and post-exercise recovery conditions according to shortening of the analysis interval. (A) AVNN, (B) SDNN, (C) SDSD, (D) RMSSD, (E) pNN50, (F) TP, (G) VLF, (H) LF, (I) HF, (J) LH/HF, (K) nLF, and (L) nHF.
Pearson’s Correlation
Figure 6 and Supplementary Table 2 of the SI show the results of Pearson’s correlation analysis. In all cases, the correlation coefficient decreased according to the shortening of the analysis interval. The trend of the decrease was different for each condition, but variables such as SDNN, pNN50, TP, VLF, and LF/HF showed clear differences in each condition. In most cases, the correlation coefficient was largely decreased in the dynamic condition compared to the resting condition as the analysis interval decreased. The minimum analysis interval required for each HRV variable for resting, exercising, and post-exercise recovery, respectively, was as follows: AVNN: 10, 10, and 10 s; SDNN: 30, 180, and 60 s; SDSD: 10, 10, and 30 s; RMSSD: 10, 10, and 30 s; pNN50: 60, 180, and 120 s; TP: 30, 120, and 120 s; VLF: 120, 240, and 180 s; LF: 120, 120, and 180 s; HF: 30, 30, and 120 s; LF/HF: 180, 240, and 240 s; nLF: 120, 120, and 120 s; and nHF: 120, 120, and 180 s. The correlation coefficient also showed a drastic decrease in specific analysis intervals. For example, the correlation coefficient in the resting pNN50 decreased from 0.700 to 0.497 at <30-s intervals, the VLF from 0.806 to 0.482 at <120-s intervals, and 0.916–0.488 at <120-s intervals.
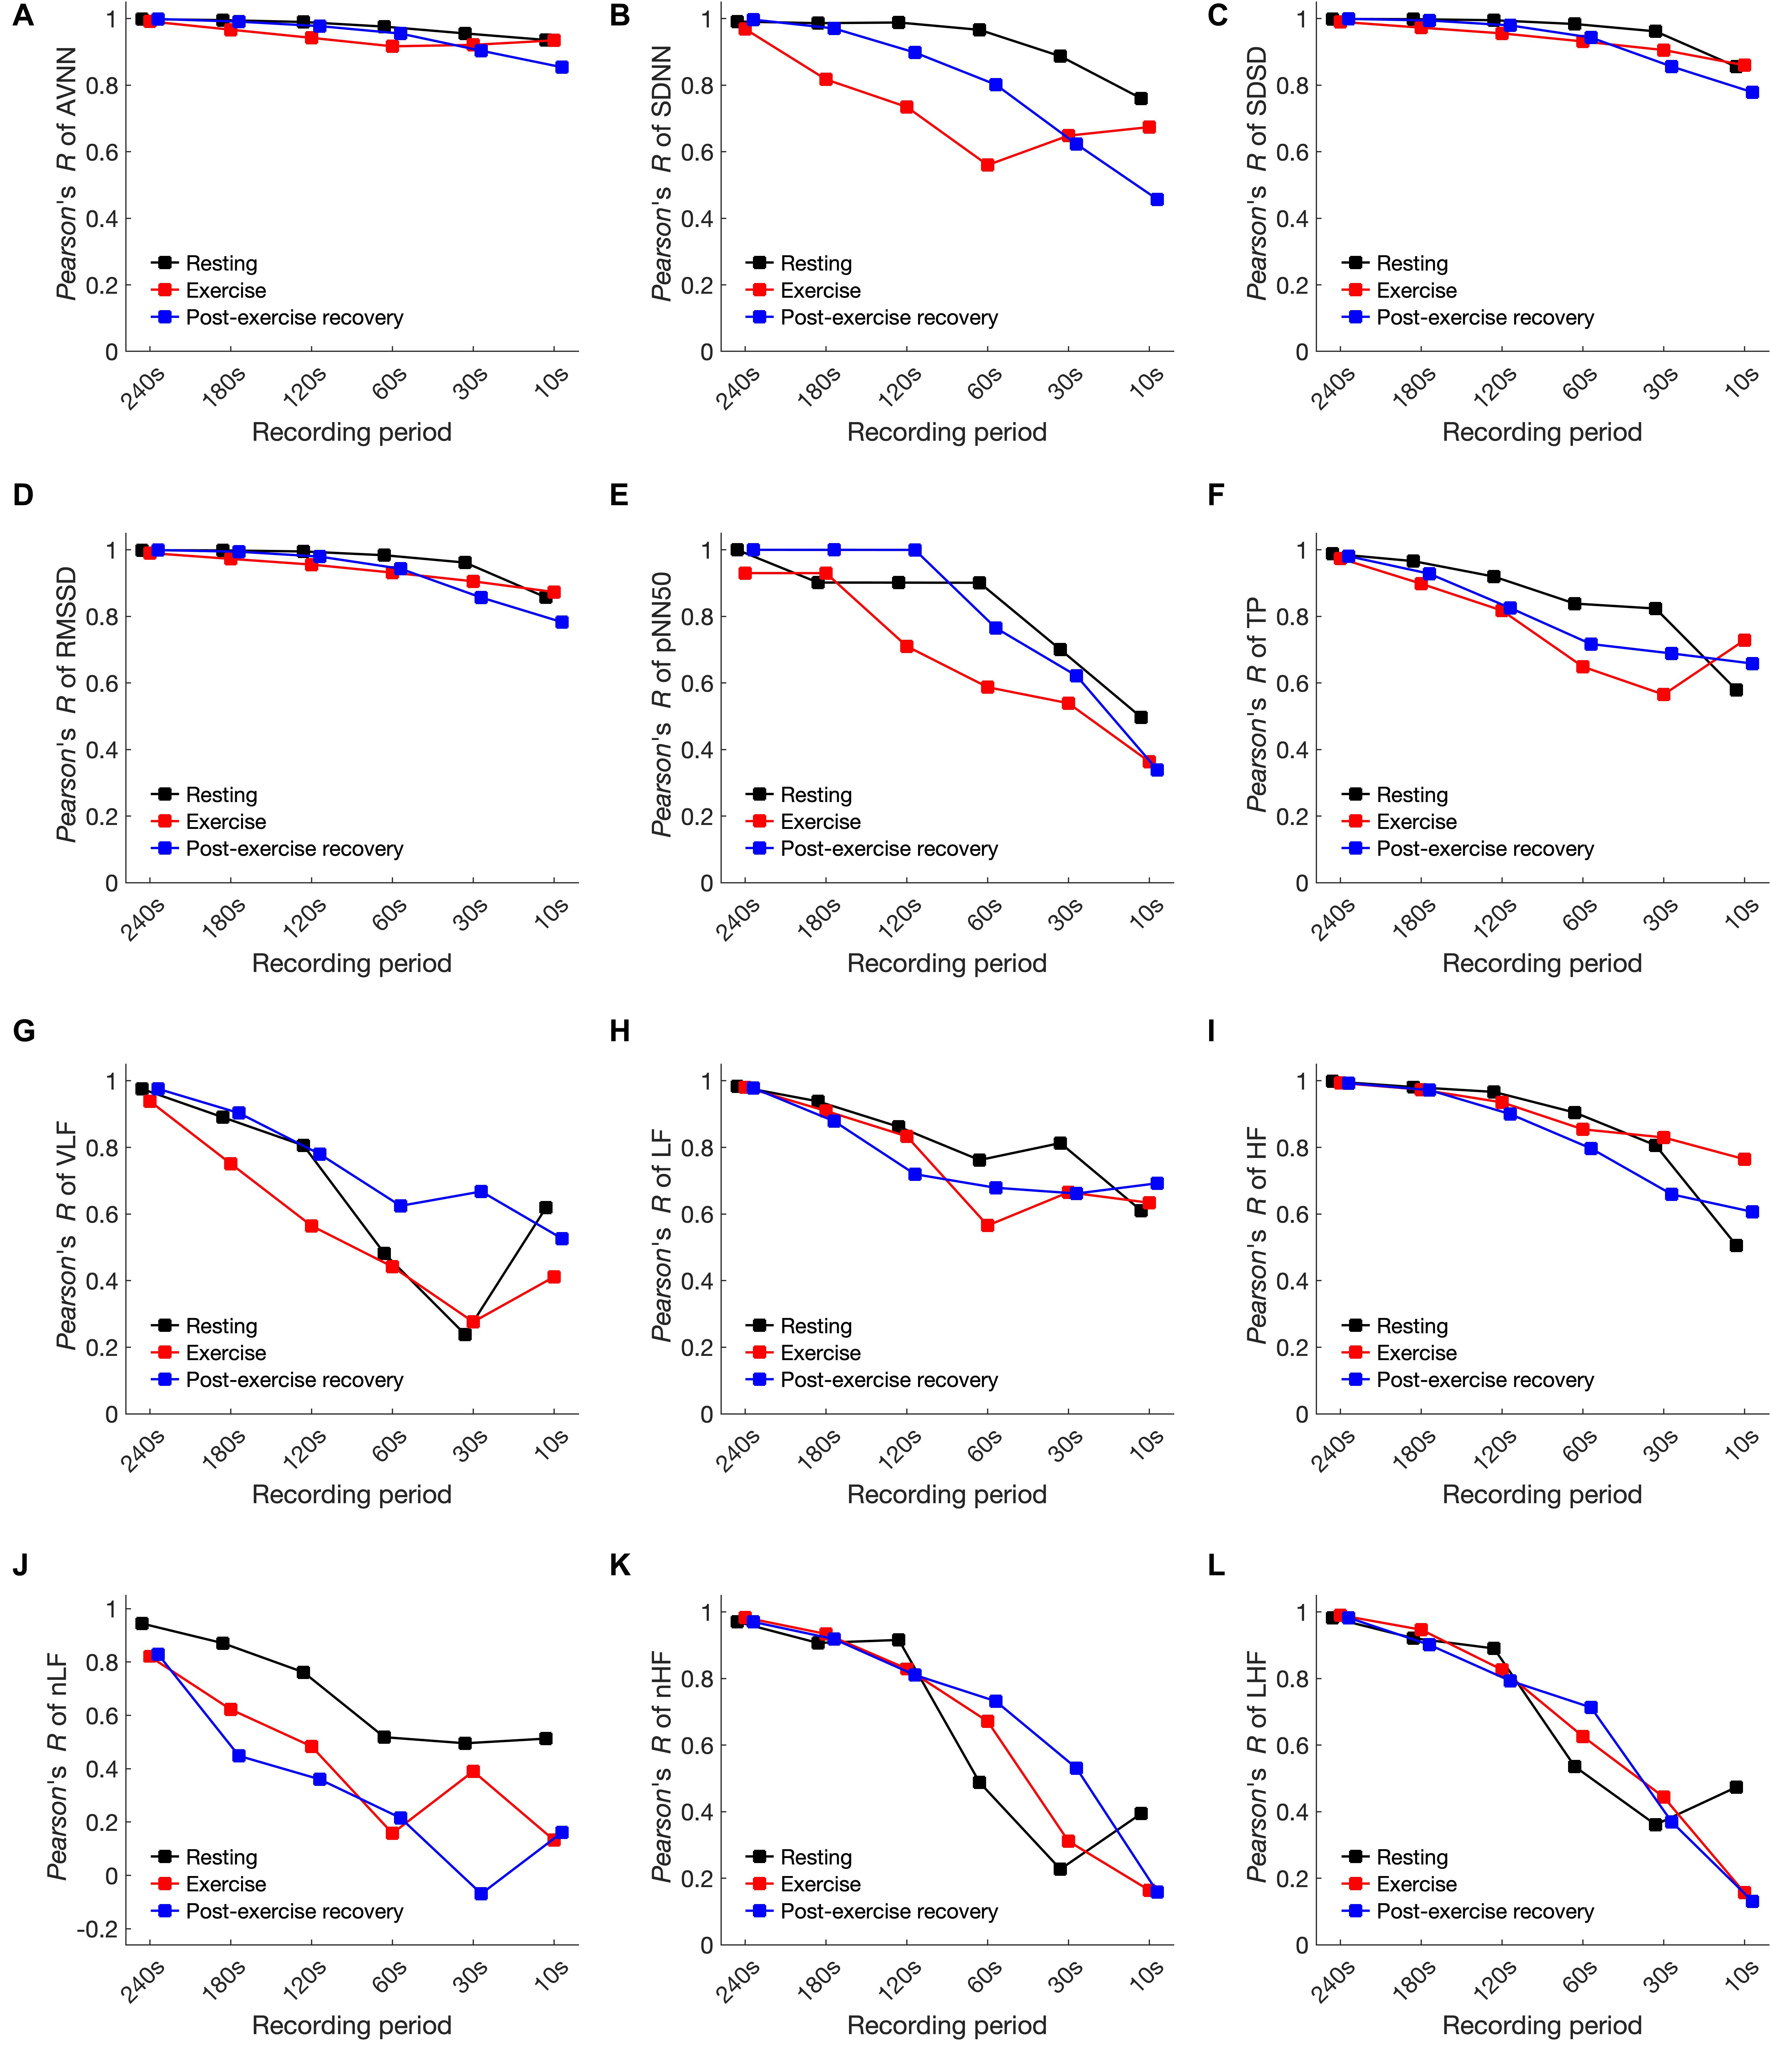
Figure 6. Pearson’s correlation coefficient of heart rate variability variables in resting, exercising, and post-exercise recovery conditions according to shortening of the analysis interval. (A) AVNN, (B) SDNN, (C) SDSD, (D) RMSSD, (E) pNN50, (F) TP, (G) VLF, (H) LF, (I) HF, (J) LH/HF, (K) nLF, and (L) nHF.
Bland–Altman Limits of Agreement
Figure 7 and Supplementary Table 3 in the SI, show increases in bias, and the width of the 50% LoA interval was observed to increase as the analysis interval decreased for all HRV variables in every condition. This means that the shorter the analysis interval, the greater the likelihood of error. The minimum time for ultra-short-term HRV analysis based on 50% LoA for resting, exercising, and post-exercise recovery states, respectively, was as follows: AVNN: 30 s, n/a, and n/a; SDNN: 30 s, n/a, and n/a; SDSD: 240, 240, and 30 s; RMSSD: 10, 240, and 30 s; pNN50: 10, 30 s, and n/a; TP: 60, 60, and 60 s; VLF: 60, 120, and 120 s; LF: 30, 30, and 30 s; HF:10 s, n/a, and 240 s; LF/HF: 30, 30, and 30 s; nLF: 30, 120 s, and n/a; and nHF: 30, 30 s, and n/a.
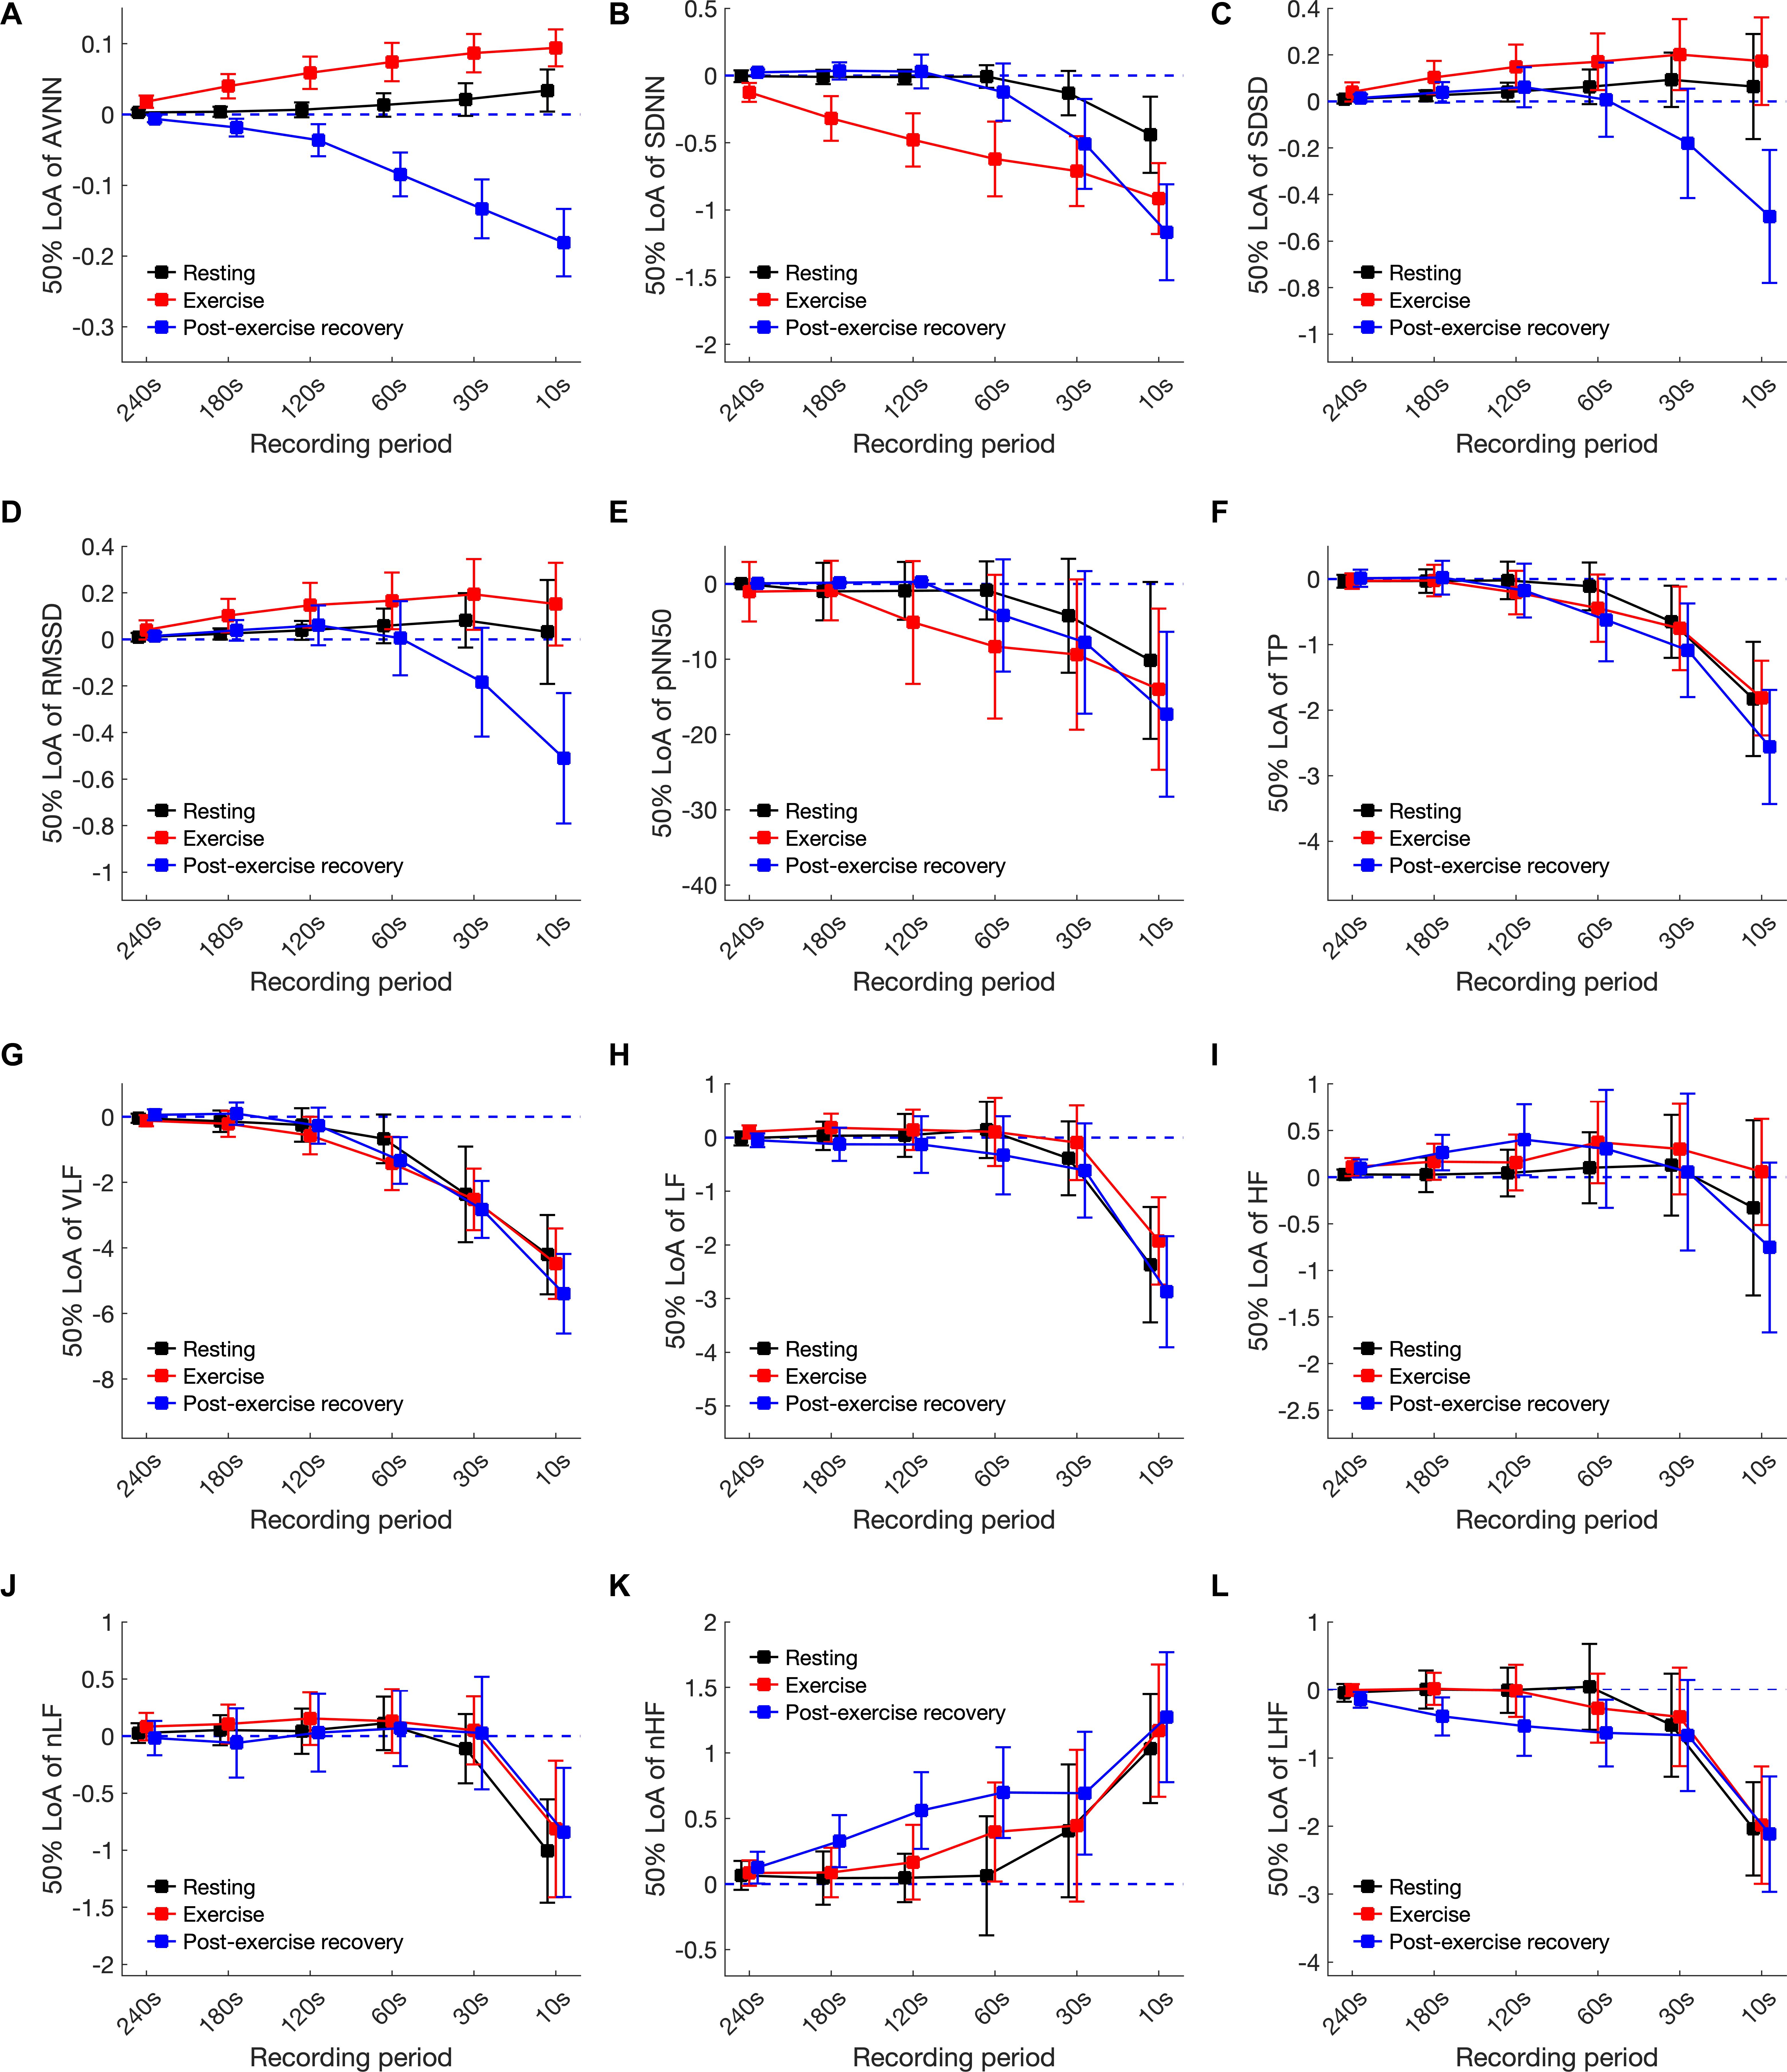
Figure 7. The 50% limits of agreement of heart rate variability variables in resting, exercising, and post-exercise recovery conditions according to shortening of the analysis interval. (A) AVNN, (B) SDNN, (C) SDSD, (D) RMSSD, (E) pNN50, (F) TP, (G) VLF, (H) LF, (I) HF, (J) LH/HF, (K) nLF, and (L) nHF.
Discussion
Unlike the existing ultra-short-term HRV studies conducted in resting conditions, we focused on analyzing the minimum time required for ultra-short-term HRV analysis in resting, exercising, and post-exercise recovery conditions. In this study, we used statistical methods such as null hypothesis testing, Cohen’s d statistics, Pearson’s correlation, or Bland-Altman LoA in combination to derive the required time for ultra-short-term HRV analysis.
The Minimum Time Requirement for Ultra-Short-Term HRV Analysis
Table 5 shows the summary of the minimum time required for the analysis of ultra-short-term HRV variables in each condition investigated using various statistical metrics. Although the minimum requirement times derived from the various analysis methods differed from each other, in general, the minimum analysis time requirement in the dynamic condition increased in all results. In addition, while Cohen’s d, the LoA, and the null hypothesis tests showed a relatively longer minimum time requirement in the time domain analysis and a shorter minimum time requirement in the frequency domain analysis, Pearson’s R tests showed a short minimum time requirement for time-domain analysis and a longer time requirement for frequency domain analysis, revealing mutually opposite results. Although it is very difficult to synthesize these results, conclusions can be drawn from the most strict or lenient conditions that satisfy all conditions. Strict conditions are mainly derived from the results of Cohen’s d, the LoA, or the null hypothesis test, indicating that many HRV variables cannot be used for dynamic analysis or require at least 120 s of analysis time for some variables. Lenient conditions showed that the time domain variables were mainly derived from Cohen’s d, the LoA, and the hypothesis tests, while the frequency domain variables were mainly derived from Pearson’s R, which showed the ability of ultra-short-term HRV analysis in 60-s recording intervals. While the two suggestions show a difference in the minimum required time, they suggest that in common, longer recording is required in almost all cases for the ultra-short-term HRV analysis of dynamic conditions compared to the static condition.
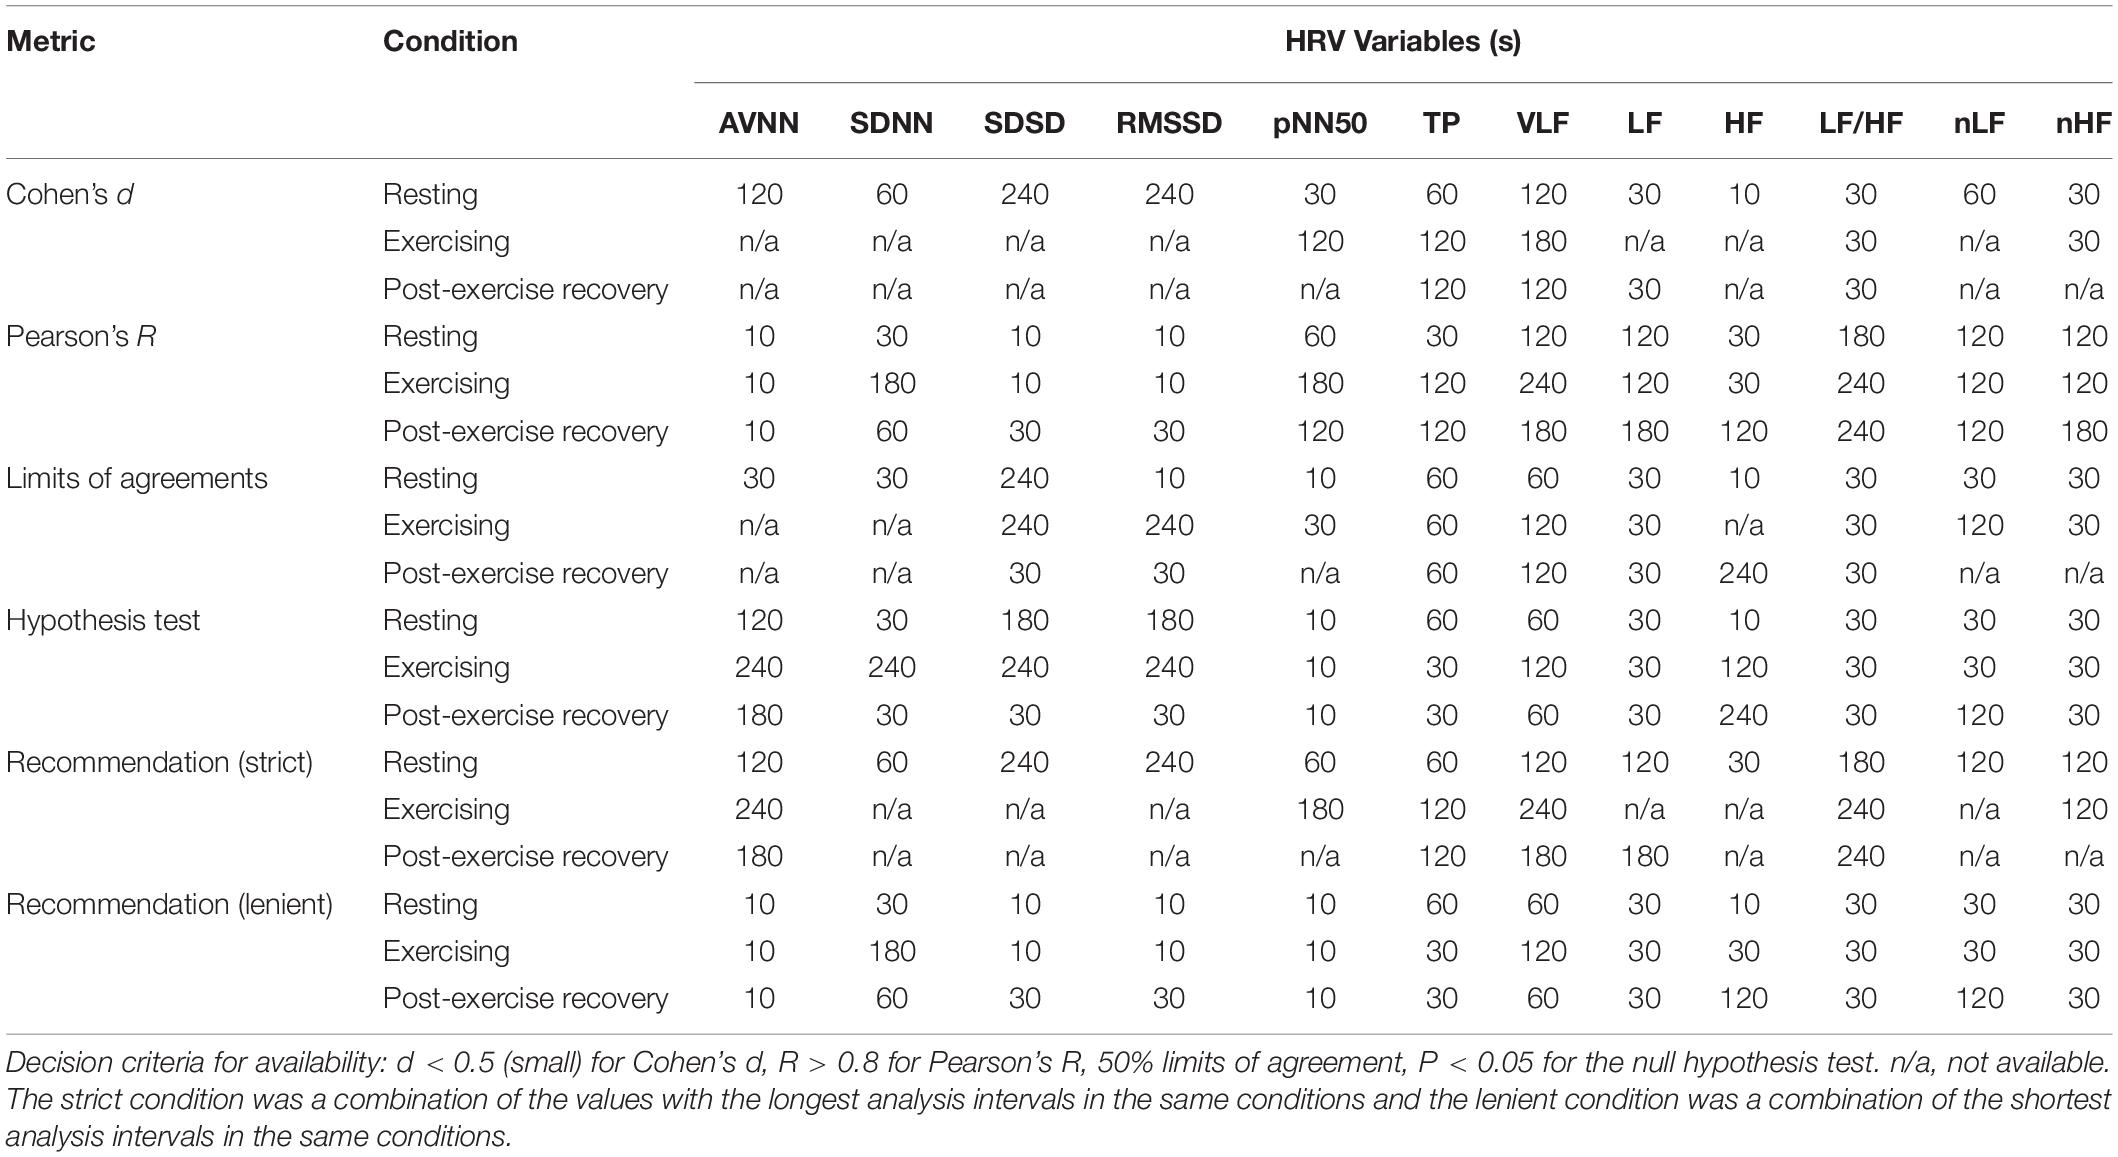
Table 5. Suggested minimum analysis intervals for ultra-short-term heart rate variability analysis according to the statistical metrics.
Ultra-Short-Term HRV in Dynamic Conditions
HRV in Exercise Conditions
Before discussing ultra-short-term HRV in dynamic conditions, consideration should be given to cardiac autonomic regulation during exercising or post-exercise recovery. In the emerged cardiac autonomic regulation model (Raven et al., 2006; Nobrega et al., 2014; White and Raven, 2014; Michelini et al., 2015), the HR rapidly increases, primarily mediated by reduced cardiac parasympathetic neural activity and reductions in cardiac sympathetic neural activity. In cardiac rhythm regulation, both the SNS (Sympathetic Nervous System) and PNS (Parasympathetic Nervous System) regulate HR throughout the entire exercise duration, where the SNS works as a tone-setter and the PNS operates as a rapid responder/modulator (Michael et al., 2017). In resting or low-level activity conditions, parasympathetic control is dominant. However, sympathetic control becomes dominant according to increases in exercise intensity (White and Raven, 2014). As a result, higher exercise intensity was reportedly associated with decreases in the SDNN (Tulppo et al., 1996; Hautala et al., 2003); RMSSD (Tulppo et al., 1996; Leicht et al., 2008; Boettger et al., 2010; Karapetian et al., 2012); LF, HF, and TP (Perini et al., 1989; Tulppo et al., 1996; Avery et al., 2001; Hautala et al., 2003; Povea et al., 2005; Casties et al., 2006; Spadacini et al., 2006; Fisher et al., 2009; Boettger et al., 2010; Karapetian et al., 2012); and HF (Cottin et al., 2006, 2007). Typically, the nLF increases during low-moderate intensity exercise and decreases during higher intensity exercise, whereas the nHF shows the opposite response (Perini et al., 1990, 1993; Hautala et al., 2003; Pichon et al., 2004; Povea et al., 2005; Martinmäki and Rusko, 2008), although conflicting responses have also been reported (Avery et al., 2001; Casties et al., 2006). The LF/HF demonstrates inconsistent responses to exercise. Some studies reported an increase in low-moderate intensity exercise and a decrease during higher intensity exercises (Radaelli et al., 1996; Tulppo et al., 1996; Hautala et al., 2003). However, other studies reported a progressive decrease from rest with increasing exercise intensity (Casties et al., 2006) or a progressive increase from rest (Saito and Nakamura, 1995; Avery et al., 2001).
HRV in Post-exercise Recovery Conditions
In post-exercise recovery conditions, the aforementioned processes mediating cardio-acceleration during exercise occur in reverse, and finally, the HR and HRV demonstrate a time-dependent recovery and eventual return to pre-exercise levels (Stanley et al., 2013). Heart rate changes in the post-exercise recovery period are not theoretically well-established, and there is a view that rapid HR reduction immediately after exercise is influenced by parasympathetic reactions (Cole et al., 1999; Coote, 2010; Peçanha et al., 2014) or is affected by sympathetic activity as well (Kannankeril et al., 2004; Pichon et al., 2004). All of the above demonstrate that during exercise or recovery, either the SNS or the PNS may be dominant and that this effect may vary from person to person. In addition, the balance of the SNS and PNS may change according to exercise intensity and the post-exercise recovery status. For example, which nervous system will be dominant depends upon the exercise intensity, with the PNS dominant in low-moderate exercise and the SNS in strenuous exercise (White and Raven, 2014). Similarly, during recovery, autonomic activity may be different depending upon early and late recovery periods. In the early phase of recovery, although some evidence has suggested sympathetic involvement as well (Nandi and Spodick, 1977; Kannankeril et al., 2004; Pichon et al., 2004), the “fast phase” of HR recovery has often been attributed to parasympathetic reactivation (Perini et al., 1989; Imai et al., 1994; Cole et al., 1999; Peçanha et al., 2014), and in the late phase of recovery, a more gradual “slow phase” of cardio-deceleration is observed, mediated by both progressive parasympathetic reactivation and sympathetic withdrawal (Michael et al., 2017).
Thus, in a dynamic state, such as movement or recovery, the response of the autonomic nervous system is not steady-state, but transient. Transient indicates a status in which the autonomic nervous system is not stabilized and continuously changes. Therefore, longer analysis intervals than transient intervals can be used to ensure stable analysis without significant differences compared to the steady-state. Therefore, finding the minimum required interval for ultra-short-term HRV means finding the transient interval under each condition? Thus, it is generally expected that the time required for HRV analysis in the dynamic condition will be longer than in the resting condition, assuming steady-state. In addition, since the length of the transient interval for exercise and recovery differs for each individual, it is necessary to consider the time required for ultra-short-term HRV analysis under the various conditions.
Limitations
This study was the first study to investigate the application of ultra-short-term HRV in dynamic conditions. However, the following limitations impact the generalizability of the results and emphasize the necessity of further research. First, the conventional HF band of 0.15–0.40 Hz was used in this research. However, this band may not be suitable during exercise where higher respiratory frequencies are observed. This was already suggested by the results of previous studies where the standard spectral HRV analysis was more susceptible to anomalies compared to the time domain analysis (Ng et al., 2009), and thus, should not be used in exercise conditions (Michael et al., 2017).
Second, because the subjects of this study were limited to young and healthy adults, the results of this study cannot be generalized to all age groups, including diseased populations, and the number of subjects was also insufficient for parameter validation. In addition, this study did not include the analysis of various activities, such as walking, running, sitting, standing, and climbing stairs that can be encountered in daily life nor did it include an analysis by emotional state. Therefore, for the application to general mobile healthcare research, expansion of the research to various dynamic states is required.
Conclusion
Dynamic behavior causes non-stationary transient changes in the autonomic nervous system, which can greatly affect the minimum interval required for HRV analysis. The results of this study suggest that the application of ultra-short-term HRV in dynamic conditions, such as exercising and post-exercise recovery periods that may occur in daily life, requires dedicated criteria for the analysis interval that is different from the existing resting ultra-short-term HRV analysis criteria. In conclusion, ultra-short-term HRV analysis in dynamic conditions required longer analysis intervals compared to resting conditions, and in dynamic conditions, when strict criteria are applied to satisfy various statistical analysis techniques, ultra-short-term HRV analysis is not recommended.
Data Availability Statement
The data analyzed in this study is subject to the following licenses/restrictions: The datasets analyzed during the current study are not publicly available due to privacy issue but are available from the corresponding author on reasonable request. Requests to access these datasets should be directed to HS, hangsik.shin@jnu.ac.kr.
Ethics Statement
The studies involving human participants were reviewed and approved by Asan medical center. The patients/participants provided their written informed consent to participate in this study.
Author Contributions
HS and JK designed the experimental protocol. JK carried out experiment and collected data. HS and HSS analyzed data statistically. HS supervised the project. All authors contributed to the article and approved the submitted version.
Funding
This research was supported by two grants from the Basic Science Research Program through the National Research Foundation of Korea (NRF), one funded by the Ministry of Science and ICT (NRF-2018R1A4A1025704), and one funded by the Ministry of Education (NRF-2018R1D1A3B07046442), South Korea.
Conflict of Interest
The authors declare that the research was conducted in the absence of any commercial or financial relationships that could be construed as a potential conflict of interest.
Supplementary Material
The Supplementary Material for this article can be found online at: https://www.frontiersin.org/articles/10.3389/fphys.2021.596060/full#supplementary-material
References
Acharya, U. R., Joseph, K. P., Kannathal, N., Lim, C. M., and Suri, J. S. (2006). Heart rate variability: a review. Med. Biol. Eng. Comput. 44, 1031–1051.
Altman, D. G., and Bland, J. M. (1983). Measurement in medicine: the analysis of method comparison studies. J. R. Statist. Soc. Ser. D (Statist.) 32, 307–317. doi: 10.2307/2987937
Avery, N., Wolfe, L., Amara, C., Davies, G., and Mcgrath, M. (2001). Effects of human pregnancy on cardiac autonomic function above and below the ventilatory threshold. J. Appl. Physiol. 90, 321–328. doi: 10.1152/jappl.2001.90.1.321
Baek, H. J., Cho, C. H., Cho, J., and Woo, J. M. (2015). Reliability of ultra-short-term analysis as a surrogate of standard 5-min analysis of heart rate variability. Telemed. J. E Health, 21, 404–414.
Barak, O. F., Jakovljevic, D. G., Gacesa, J. Z. P., Ovcin, Z. B., Brodie, D. A., and Grujic, N. G. (2010). Heart rate variability before and after cycle exercise in relation to different body positions. J. Sports Sci. Med. 9:176.
Berntson, G. G., Thomas Bigger, J. Jr., Eckberg, D. L., Grossman, P., Kaufmann, P. G., Malik, M., et al. (1997). Heart rate variability: origins, methods, and interpretive caveats. Psychophysiology 34, 623–648. doi: 10.1111/j.1469-8986.1997.tb02140.x
Bland, J. M., and Altman, D. G. (2003). Applying the right statistics: analyses of measurement studies. Ultrasound Obstetr. Gynecol. Off. J. Int. Soc. Ultrasound Obstetr. Gynecol. 22, 85–93. doi: 10.1002/uog.122
Boettger, S., Puta, C., Yeragani, V. K., Donath, L., Mueller, H.-J., Gabriel, H. H., et al. (2010). Heart rate variability, QT variability, and electrodermal activity during exercise. Med. Sci. Sports Exerc. 42, 443–448. doi: 10.1249/mss.0b013e3181b64db1
Buchheit, M., Solano, R., and Millet, G. P. (2007). Heart-rate deflection point and the second heart-rate variability threshold during running exercise in trained boys. Pediatr. Exerc. Sci. 19, 192–204. doi: 10.1123/pes.19.2.192
Camm, A. J., Malik, M., Bigger, J. T., Breithardt, G., Cerutti, S., Cohen, R., et al. (1996). Heart rate variability: standards of measurement, physiological interpretation and clinical use. Task Force of the European Society of Cardiology and the North American Society of Pacing and Electrophysiology. Circulation 93, 1043–1065. doi: 10.1161/01.cir.93.5.1043
Castaldo, R., Montesinos, L., Melillo, P., Massaro, S., and Pecchia, L. (2017). “To what extent can we shorten HRV analysis in wearable sensing? A case study on mental stress detection,” in EMBEC & NBC 2017, eds H. Eskola, O. Väisänen, J. Viik, and J. Hyttinen (Singapore: Springer), 643–646. doi: 10.1007/978-981-10-5122-7_161
Casties, J.-F., Mottet, D., and Le Gallais, D. (2006). Non-linear analyses of heart rate variability during heavy exercise and recovery in cyclists. Int. J. Sports Med. 27, 780–785. doi: 10.1055/s-2005-872968
Choi, A., and Shin, H. (2018). Quantitative analysis of the effect of an ectopic beat on the heart rate variability in the resting condition. Front. Physiol. 9:922.
Cole, C. R., Blackstone, E. H., Pashkow, F. J., Snader, C. E., and Lauer, M. S. (1999). Heart-rate recovery immediately after exercise as a predictor of mortality. N. Engl. J. Med. 341, 1351–1357. doi: 10.1056/nejm199910283411804
Coote, J. H. (2010). Recovery of heart rate following intense dynamic exercise. Exp. Physiol. 95, 431–440. doi: 10.1113/expphysiol.2009.047548
Cottin, F., Leprêtre, P.-M., Lopes, P., Papelier, Y., Médigue, C., and Billat, V. (2006). Assessment of ventilatory thresholds from heart rate variability in well-trained subjects during cycling. Int. J. Sports Med. 27, 959–967. doi: 10.1055/s-2006-923849
Cottin, F., Medigue, C., Lopes, P., Leprêtre, P.-M., Heubert, R., and Billat, V. (2007). Ventilatory thresholds assessment from heart rate variability during an incremental exhaustive running test. Int. J. Sports Med. 28, 287–294. doi: 10.1055/s-2006-924355
Datta, D., Normandin, E., and Zuwallack, R. (2015). Cardiopulmonary exercise testing in the assessment of exertional dyspnea. Annal. Thorac. Med. 10:77. doi: 10.4103/1817-1737.151438
Fisher, J. P., Ogoh, S., Junor, C., Khaja, A., Northrup, M., and Fadel, P. J. (2009). Spontaneous baroreflex measures are unable to detect age-related impairments in cardiac baroreflex function during dynamic exercise in humans. Exp. Physiol. 94, 447–458. doi: 10.1113/expphysiol.2008.044867
Flatt, A. A., and Esco, M. R. (2013). Validity of the ithleteTM smart phone application for determining ultra-short-term heart rate variability. J. Hum. Kinet. 39, 85–92. doi: 10.2478/hukin-2013-0071
Fletcher, G. F., Ades, P. A., Kligfield, P., Arena, R., Balady, G. J., Bittner, V. A., et al. (2013). Exercise standards for testing and training: a scientific statement from the American Heart Association. Circulation 128, 873–934. doi: 10.1161/cir.0b013e31829b5b44
Hamilton, R. M., Mckechnie, P. S., and Macfarlane, P. W. (2004). Can cardiac vagal tone be estimated from the 10-second ECG? Int. J. Cardiol. 95, 109–115. doi: 10.1016/j.ijcard.2003.07.005
Hautala, A. J., Mäkikallio, T. H., Seppänen, T., Huikuri, H. V., and Tulppo, M. P. (2003). Short-term correlation properties of R–R interval dynamics at different exercise intensity levels. Clin. Physiol. Funct. Imag. 23, 215–223. doi: 10.1046/j.1475-097x.2003.00499.x
Hunt, K. J., and Saengsuwan, J. (2018). Changes in heart rate variability with respect to exercise intensity and time during treadmill running. Biomed. Eng. Online 17, 1–12.
Imai, K., Sato, H., Hori, M., Kusuoka, H., Ozaki, H., Yokoyama, H., et al. (1994). Vagally mediated heart rate recovery after exercise is accelerated in athletes but blunted in patients with chronic heart failure. J. Am. College Cardiol. 24, 1529–1535. doi: 10.1016/0735-1097(94)90150-3
Javorka, M., Zila, I., Balharek, T., and Javorka, K. (2002). Heart rate recovery after exercise: relations to heart rate variability and complexity. Brazil. J. Med. Biol. Res. 35, 991–1000. doi: 10.1590/s0100-879x2002000800018
Kannankeril, P. J., Le, F. K., Kadish, A. H., and Goldberger, J. J. (2004). Parasympathetic effects on heart rate recovery after exercise. J. Investigat. Med. 52, 394–401. doi: 10.2310/6650.2004.00611
Karapetian, G., Engels, H., Gretebeck, K., and Gretebeck, R. (2012). Effect of caffeine on LT, VT and HRVT. Int. J. Sports Med. 33, 507–513. doi: 10.1055/s-0032-1301904
Krouwer, J. S. (2008). Why Bland–Altman plots should use X, not (Y+X)/2 when X is a reference method. Statist. Med. 27, 778–780. doi: 10.1002/sim.3086
Laborde, S., Mosley, E., and Thayer, J. F. (2017). Heart rate variability and cardiac vagal tone in psychophysiological research–recommendations for experiment planning, data analysis, and data reporting. Front. Psychol. 8:213.
Leicht, A. S., Sinclair, W. H., and Spinks, W. L. (2008). Effect of exercise mode on heart rate variability during steady state exercise. Eur. J. Appl. Physiol. 102, 195–204. doi: 10.1007/s00421-007-0574-9
Malik, M., Bigger, J. T., Camm, A. J., Kleiger, R. E., Malliani, A., Moss, A. J., et al. (1996). Heart rate variability: Standards of measurement, physiological interpretation, and clinical use. Eur. Heart J. 17, 354–381. doi: 10.1093/oxfordjournals.eurheartj.a014868
Malliani, A. (1995). Association of heart rate variability components with physiological regulatory mechanisms. Heart Rate Variabil. 8, 202–242.
Marked, V. (1995). “Correction of the heart rate variability signal for ectopics and missing beats,” in Heart Rate variability, eds M. Malik and A. J. Camm (Armonk, NY: Futura Publishing Co. Inc.).
Martinmäki, K., Häkkinen, K., Mikkola, J., and Rusko, H. (2008). Effect of low-dose endurance training on heart rate variability at rest and during an incremental maximal exercise test. Eur. J. Appl. Physiol. 104:541. doi: 10.1007/s00421-008-0804-9
Martinmäki, K., and Rusko, H. (2008). Time-frequency analysis of heart rate variability during immediate recovery from low and high intensity exercise. Eur. J. Appl. Physiol. 102, 353–360. doi: 10.1007/s00421-007-0594-5
McNames, J., and Aboy, M. (2006). Reliability and accuracy of heart rate variability metrics versus ECG segment duration. Med. Biol. Eng. Comput. 44,, 747–756.
Michael, S., Graham, K. S., and Davis, G. M. (2017). Cardiac autonomic responses during exercise and post-exercise recovery using heart rate variability and systolic time intervals—a review. Front. Physiol. 8:301.
Michelini, L. C., O’leary, D. S., Raven, P. B., and Nóbrega, A. C. (2015). Neural control of circulation and exercise: a translational approach disclosing interactions between central command, arterial baroreflex, and muscle metaboreflex. Am. J. Physiol. Heart Circulat. Physiol. 309, H381–H392.
Munoz, M. L., van Roon, A., Riese, H., Thio, C., Oostenbroek, E., Westrik, I., and Snieder, H. (2015). Validity of (ultra-) short recordings for heart rate variability measurements. PLoS One 10:e0138921. doi: 10.1371/journal.pone.0138921
Nandi, P. S., and Spodick, D. H. (1977). Recovery from exercise at varying work loads. Time course of responses of heart rate and systolic intervals. Br. Heart J. 39:958. doi: 10.1136/hrt.39.9.958
Ng, J., Sundaram, S., Kadish, A. H., and Goldberger, J. J. (2009). Autonomic effects on the spectral analysis of heart rate variability after exercise. Am. J. Physiol. Heart Circulat. Physiol. 297, H1421–H1428.
Nobrega, A. C., O’leary, D., Silva, B. M., Marongiu, E., Piepoli, M. F., and Crisafulli, A. (2014). Neural regulation of cardiovascular response to exercise: role of central command and peripheral afferents. BioMed Res. Int. 2014:478965.
Nussinovitch, U., Elishkevitz, K. P., Katz, K., Nussinovitch, M., Segev, S., Volovitz, B., and Nussinovitch, N. (2011). Reliability of ultra-short ECG indices for heart rate variability. Ann. Noninvasive Electrocardiol. 16, 117–122.
Pan, J., and Tompkins, W. J. (1985). A real-time QRS detection algorithm. IEEE Transact. Biomed. Eng. 32, 230–236. doi: 10.1109/tbme.1985.325532
Peçanha, T., Silva-Júnior, N. D., and Forjaz, C. L. D. M. (2014). Heart rate recovery: autonomic determinants, methods of assessment and association with mortality and cardiovascular diseases. Clin. Physiol. Funct. Imag. 34, 327–339. doi: 10.1111/cpf.12102
Perini, R., Orizio, C., Baselli, G., Cerutti, S., and Veicsteinas, A. (1990). The influence of exercise intensity on the power spectrum of heart rate variability. Eur. J. Appl. Physiol. Occupat. Physiol. 61, 143–148. doi: 10.1007/bf00236709
Perini, R., Orizio, C., Comandè, A., Castellano, M., Beschi, M., and Veicsteinas, A. (1989). Plasma norepinephrine and heart rate dynamics during recovery from submaximal exercise in man. Eur. J. Appl. Physiol. Occupat. Physiol. 58, 879–883. doi: 10.1007/bf02332222
Perini, R., Orizio, C., Milesi, S., Biancardi, L., Baselli, G., and Veicsteinas, A. (1993). Body position affects the power spectrum of heart rate variability during dynamic exercise. Eur. J. Appl. Physiol. Occupat. Physiol. 66, 207–213. doi: 10.1007/bf00235095
Pichon, A. P., De Bisschop, C., Roulaud, M., Denjean, A., and Papelier, Y. (2004). Spectral analysis of heart rate variability during exercise in trained subjects. Med. Sci. Sports Exerc. 36, 1702–1708. doi: 10.1249/01.mss.0000142403.93205.35
Povea, C., Schmitt, L., Brugniaux, J., Nicolet, G., Richalet, J.-P., and Fouillot, J.-P. (2005). Effects of intermittent hypoxia on heart rate variability during rest and exercise. High Altitude Med. Biol. 6, 215–225. doi: 10.1089/ham.2005.6.215
Radaelli, A., Valle, F., Falcone, C., Calciati, A., Leuzzi, S., Martinelli, L., et al. (1996). Determinants of heart rate variability in heart transplanted subjects during physical exercise. Eur. Heart J. 17, 462–471. doi: 10.1093/oxfordjournals.eurheartj.a014881
Raven, P. B., Fadel, P. J., and Ogoh, S. (2006). Arterial baroreflex resetting during exercise: a current perspective. Exp. Physiol. 91, 37–49. doi: 10.1113/expphysiol.2005.032250
Rosenthal, R. (1990). How are we doing in soft psychology? Am. Psychol. 45:775. doi: 10.1037/0003-066x.45.6.775
Saito, M., and Nakamura, Y. (1995). Cardiac autonomic control and muscle sympathetic nerve activity during dynamic exercise. Jpn. J. Physiol. 45, 961–977. doi: 10.2170/jjphysiol.45.961
Salahuddin, L., Cho, J., Jeong, M. G., and Kim, D. (2007). “Ultra short term analysis of heart rate variability for monitoring mental stress in mobile settings,” in Proceedings of the 29th Annual International Conference of the IEEE Engineering in Medicine and Biology Society (Piscataway, NJ: IEEE), 4656–4659.
Spadacini, G., Passino, C., Leuzzi, S., Valle, F., Piepoli, M., Calciati, A., et al. (2006). Frequency-dependent baroreflex control of blood pressure and heart rate during physical exercise. Int. J. Cardiol. 107, 171–179. doi: 10.1016/j.ijcard.2005.03.011
Stanley, J., Peake, J. M., and Buchheit, M. (2013). Cardiac parasympathetic reactivation following exercise: implications for training prescription. Sports Med. 43, 1259–1277. doi: 10.1007/s40279-013-0083-4
Tulppo, M. P., Makikallio, T., Takala, T., Seppanen, T., and Huikuri, H. V. (1996). Quantitative beat-to-beat analysis of heart rate dynamics during exercise. Am. J. Physiol. Heart Circul. Physiol. 271, H244–H252.
White, D. W., and Raven, P. B. (2014). Autonomic neural control of heart rate during dynamic exercise: revisited. J. Physiol. 592, 2491–2500. doi: 10.1113/jphysiol.2014.271858
Keywords: autonomic nervous system, heart rate variability, mobile healthcare, ultra-short-term heart rate variability, electrocadiogram
Citation: Kim JW, Seok HS and Shin H (2021) Is Ultra-Short-Term Heart Rate Variability Valid in Non-static Conditions? Front. Physiol. 12:596060. doi: 10.3389/fphys.2021.596060
Received: 18 August 2020; Accepted: 10 March 2021;
Published: 30 March 2021.
Edited by:
Sylvain Laborde, German Sport University Cologne, GermanyReviewed by:
Moacir Fernandes Godoy, Faculty of Medicine of São José do Rio Preto, BrazilPaolo Melillo, University of Campania Luigi Vanvitelli, Italy
Copyright © 2021 Kim, Seok and Shin. This is an open-access article distributed under the terms of the Creative Commons Attribution License (CC BY). The use, distribution or reproduction in other forums is permitted, provided the original author(s) and the copyright owner(s) are credited and that the original publication in this journal is cited, in accordance with accepted academic practice. No use, distribution or reproduction is permitted which does not comply with these terms.
*Correspondence: Hangsik Shin, hangsik.shin@jnu.ac.kr
†These authors have contributed equally to this work