Microdosimetry and Dose-Averaged LET Calculations of Protons in Liquid Water: A Novel Geant4-DNA Application
 Anna Baratto-Roldán1,2*
  Alejandro Bertolet3,4
  Giorgio Baiocco5
  Alejandro Carabe6
  Miguel Antonio Cortés-Giraldo2*
- 1Centro Nacional de Aceleradores, Seville, Spain
- 2Department of Atomic, Molecular and Nuclear Physics, Universidad de Sevilla, Seville, Spain
- 3Department of Radiation Oncology, Massachusetts General Hospital, Boston, MA, United States
- 4Harvard Medical School, Boston, MA, United States
- 5Radiation Biophysics and Radiobiology Group, Department of Physics, University of Pavia, Pavia, Italy
- 6Hampton University Proton Therapy Institute, Hampton University, Hampton, VA, United States
The spatial distribution of energy deposition events is an essential aspect in the determination of the radiobiological effects of ionizing radiation at the cellular level. Microdosimetry provides a theoretical framework for the description of these events, and has been used in several studies to address problems such as the characterization of Linear Energy Transfer (LET) and Relative Biological Effectiveness (RBE) of ion beams for proton therapy applications. Microdosimetry quantities and their distributions can be obtained by means of Monte Carlo simulations. In this work, we present a track structure Monte Carlo (MC) application, based on Geant4-DNA, for the computation of microdosimetric distributions of protons in liquid water. This application provides two sampling methods uniform and weighted, for the scoring of the quantities of interest in spherical sites, with diameters ranging from 1 to 10 μm. As an element of novelty, the work shows the approach followed to calculate, without resorting to dedicated simulations, the distribution of energy imparted to the site per electronic collision of the proton, which can be used to obtain the macroscopic dose-averaged LET as proposed by Kellerer. Furthermore, in this work the concept of effective mean chord length is proposed to take into account δ-ray influx and escape in the calculation of macroscopic dose-averaged LET for proton track segments and retrieve the agreement predicted by Kellerer’s formula. Finally, the results obtained demonstrate that our MC application is reliable and computational-efficient to perform calculations of microdosimetric distributions and dose-averaged LET of proton track segments in liquid water.
1 Introduction
The radiobiological effects of ionizing radiation can be traced back to the microscopic patterns of energy deposition in irradiated media, which can be described quantitatively with the formalism of microdosimetry [1–3]. In view of the growing awareness of the variations of proton Relative Biological Effectiveness (RBE) with increasing Linear Energy Transfer (LET) [4–6], several studies have turned to the framework of microdosimetry to approach problems such as the characterization of LET distributions for proton therapy beams and the determination of their RBE [7–10]. Indeed, by obtaining the LET distributions it is possible to optimize treatment plans, taking into account the actual biological impact of radiation by working on LET objectives and constraints. Microdosimetry, on one hand, permits the calculation of RBE from a microscopic approach by means of the Microdosimetric-Kinetic Model (MKM) [11–13] for cell killing endpoint and, on the other hand, provides physical concepts and computational tools to calculate macroscopic dose-averaged LET (
The microscopic analogue of the LET is called lineal energy (y), which is a stochastic quantity that accounts for the energy imparted per unit length to a certain sensitive volume, called site, by an incident particle and all its secondary products [14]. As for the macroscopic distribution of LET, the microscopic distribution of y can be biologically characterised by its dose-weighted average,
The calculation of microdosimetric distributions and their moments can be carried out both analytically or by means of Monte Carlo (MC) simulations. In this work, we present the main features of a MC code developed with Geant4 [19–21] for the computation of microdosimetric distributions generated by proton track segments in liquid water via track-structure simulations done with the package Geant4-DNA [22–25]. Our code provides two sampling methods, called uniform and weighted, for the computation of the quantities of interest in spherical sites. We also highlight the description of the novel scoring method followed to compute of the energy imparted to the site per electronic collision of the primary proton, in order to connect the obtained
2 Materials and Methods
2.1 Theoretical Framework
The use of the LET for the description of the biological effect of different radiation qualities at a small scale presents some limitations, the principal ones being that the concept of LET does not consider the random nature of energy loss along a particle track and that it does not take into account the length of the track relative to a finite target structure. The effects of these limitations, and the ranges of proton energies and site dimensions in which they are relevant to energy deposition, were extensively studied by Kellerer and Chmelevsky [27–30]. For large site dimensions (of the order of 1–10 μm) and small proton energies (below 1 MeV), the energy deposition is strongly influenced by the limited range of protons, since the LET may change significantly along the path through the site. On the other hand, as the energy of the proton increases, energy straggling and eventually δ-rays influx and escape start playing an important role, which becomes more relevant as site dimensions get smaller [14]. The interplay of the various factors affecting the energy deposition in cellular or sub-cellular regions and their contribution to the macroscopic dose-averaged LET is discussed in detail in the following paragraphs.
2.1.1 Basic Microdosimetric Concepts
The basic microdosimetric quantity is the energy imparted to a site by a single energy-deposition event, ϵs, where an event is defined as an energy deposition due to particles that are statistically correlated. The energy imparted is a random variable, and its value varies from event to event. Therefore, predictions can be only made on the basis of probability distributions.
The single-event distribution
For radiobiological considerations, it is also useful to consider the weighted or dose distribution
The expectation value of ϵs following
From Eq. 3 it is possible to relate both averages through:
where
where σx and Vx are the variance and the relative variance of x, respectively.
Another fundamental microdosimetric quantity is the lineal energy, y, defined as:
where
The frequency-averaged lineal energy
2.1.2 The Relative Variance Formula for the Derivation of Macroscopic LET From Microdosimetry
As already mentioned at the beginning of this section, if a medium is exposed to an absorbed dose D, the actual energy imparted to a specified site will depend on various factors [30]. Firstly, the number of independent charged particles traversing the region and their different LET values if a composite beam impinges on the site. Secondly, the chord length associated to each proton crossing the site. Finally, even particles with same LET and chord length can result in a different energy imparted, as both the number of collisions along the chord and the energy lost in each collision might vary. The impact of this last factor, called energy straggling, can be expressed as ϵs = L × l ± δ, where L and l are respectively the LET and chord length of a particle, and δ is the stochastic variability of the energy imparted with respect to the expected energy
where VLET, Vl and Vδ are the relative variances of the distributions of LET, chord length and energy straggling, respectively. The computation of the straggling distribution is complicated by the fact that the escape and influx of δ-rays from and into the region of interest presents considerable theoretical difficulties, and the problem needs to be studied with Monte Carlo simulations of δ-ray tracks. The relative variance of the straggling distribution, in particular, is determined by the weighted average of the distribution of energy imparted per individual proton collision:
where
Consequently, from Eq. 7 the following formula can be obtained:
By using the previous relations, and considering that
As emerges from Eq. 11, identified hereafter as Kellerer’s formula, macroscopic and microscopic quantities are related to each other. Therefore, the calculation through MC track structure simulations of the microdosimetric quantities
2.2 MC Track Structure Simulations
In order to calculate the various microdosimetric quantities in Eq. 11 through MC track structure simulations, a particle track needs to be simulated and sampled, placing a site in such a way that at least one energy deposit occurs inside it. There are different types of randomness for the interception of a convex body with straight lines; in the following, two types will be distinguished: uniform and weighted [31, 32]. The first type results when a body is exposed to a uniform isotropic fluence of infinite straight lines, while the second occurs when an uniformly distributed random point is chosen in a body and is traversed by straight lines with uniform random direction. From a computational point of view, uniform sampling consist in randomly selecting a position for the center of the site within the region of interest, while weighted sampling consist in selecting an energy transfer point and then placing a site randomly around it. An immediate drawback of the first method is that it is highly inefficient, since the chances of selecting areas with no energy imparted to them are really high. On the other hand, the second method ensures the occurrence of at least one energy transfer within the site, and it is more suitable for MC track structure calculations. The term “weighted” in this context, refers to the fact that the probability of selecting a point centered at a certain elementary volume dV is not uniform but weighted by a factor that compensates for the non-uniform density of transfer points around the particle track [14, 33].
The chord length is a stochastic quantity that depends on the geometry of the site and the straight line associated to each proton in the site. Therefore, its distribution and average values are strictly connected to the sampling method chosen, affecting the shape of Kellerer’s formula [31]. However, with the selection of the appropriate weighting factor, uniform and random sampling methods can be considered as equivalent and, in the case of spherical sites of diameter d, Eq. 11 takes the form [18]:
Straggling, on its side, is an independent random factor from LET and chord length, as even particles with same LET traversing the site with the same chord length might result in a different energy imparted per event ϵs. Therefore, it is not affected by the sampling method considered. However, when simulating a beam composed by particles of different LET, attention must be put to not include the variance of the LET distribution into the straggling one for the computation of δ2, as explained extensively by Bertolet et al. [26].
In the following paragraphs, the main features of the MC application developed for the computation of the various quantities involved in Kellerer’s formula are presented. All simulations were carried out with the Geant4 toolkit (version 10.5), by using our computing cluster hosted at Centro Informático Científico de Andalucía (CICA, Seville, Spain), consisting of 24 computational nodes, each with 2 × 12C AMD Abu Dhabi 6344 (2.6 GHz/6 MB) L3. For every case considered, a number of 250,000 proton tracks was simulated, divided into 250 parallel jobs. The Geant4-DNA package, available within Geant4, was used for this purpose. Compared to Geant4, which provides various physics list options based on a condensed-history approach for the transport of charged particles, Geant4-DNA includes models developed for track structure simulations, which allows the reproduction of each single interaction of neutral and charged particles with liquid water [22–25]. This is especially key to carry out an accurate modeling of electron transport below 1 keV, which affects to energy deposition tallied at sub-micrometric targets (below ∼100 nm) as pointed out by Kyriakou et al. [34]. Geant4-DNA provides various physics list options as well, which mostly differ on the electron transport models used below 255 keV or its algorithm speed [25]. In this work, intended to highlight the code capabilities and illustrate the accuracy with which the dose-averaged LET can be calculated from microdosimetry quantities, we used the “option 2” of the Geant4-DNA constructor, which is an accelerated version of Geant4-DNA default constructor. This package only allows calculations for proton energies below 100 MeV. Therefore, simulations were performed with mono-energetic proton beams in the range 10–90 MeV, choosing the lower limit to ensure the validity of the short track segment condition. Simulations carried out with weighted sampling ranged from 90 min (protons at 10–20 MeV) to 87 h (90 MeV) per 1,000 primary protons; as for simulations using uniform sampling of site position, they took from 170 min (20–40 MeV) to 87 h (90 MeV) including, to improve statistics, a loop of up to 1,000 tries which finished once at least one energy exchange point was found within the site.
For mono-energetic proton beams, the LET distribution approximates a delta function, centered at the LET of the particle for the specific energy considered. In this specific situation, therefore, the relation
where n and s are the indexes for an event and a step, respectively, Lsn is the mean energy loss per unit path length in the material, ɛsn is the energy deposited by the primary particle along the step and ωn its statistical weight. Further details of this calculation can be found in [35].
2.2.1 Geometry
Figure 1 shows the geometry of our microdosimetry code. The world volume, i.e., the volume that represents the experimental area and contains all the other components, consist of a water cubic box having half dimensions Rmax slightly greater than the maximum range, Rδ, max, of δ-rays emitted by the incident protons. This range is calculated with the formula proposed by Tabata et al. [36], and the condition Rmax ≥ Rδ, max is necessary to ensure intra-track electronic equilibrium. The scoring volume, i.e., the volume in which the energy transfer points (hits) are detected and stored, is a water slab positioned in the center of the world volume with same transversal dimensions and thickness ZS = 4d, where d is the diameter of the site. The value of ZS was set to ensure enough energy transfer points for each track within the scoring volume, being 4d a good compromise between its thickness and calculations carried out comparing the two site positioning methods explained below; more details can be found elsewhere [37]. Simulations were run with spherical sites of 1 and 10 μm diameter. In order to have the same proton kinetic energy distribution at the center of the world volume for both site diameters, the decision to set Rmax = Rδ, max + ZS, max/2 was taken, where ZS, max is the thickness of the scoring volume corresponding to a site diameter of 10 μm.
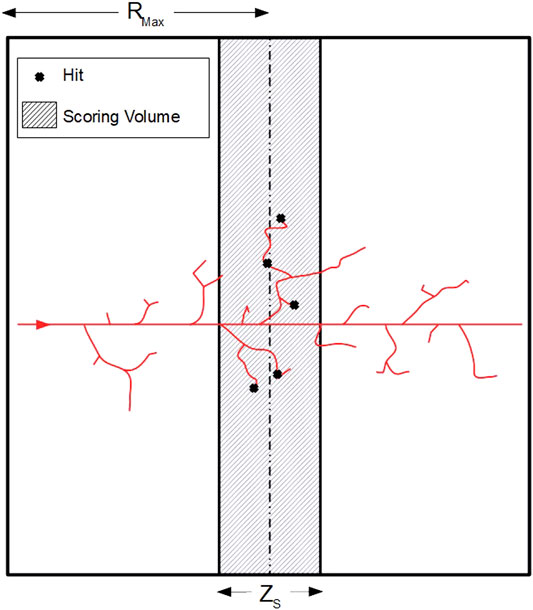
FIGURE 1. Scheme of the geometry used for microdosimetry simulations (2D projection). The primary proton (red track) is generated at the surface (on the left) of a cubic water volume (world volume) and travels along the Z axis. The energy transfer points (hits) are then scored in the middle of the volume (shaded area), in a slab whose thickness (ZS) varies depending on the dimension of the site. The spherical sites are not physically simulated, as they are virtually selected in the scoring volume with an algorithm that depends on the type of randomness considered. Finally, the half-dimension of the world volume (Rmax) varies according to the maximum energy of the incident protons, and is slightly greater than the maximum range of the δ-rays emitted.
In our simulations, the beam (red track in Figure 1) originates at the surface of the cubic volume located at z = − Rmax and travels along the z-axis. The physical quantities of interest are scored in randomly placed spherical sites, that are virtually identified as regions of the scoring volume thanks to specific algorithms for the selection of their centers. For the site positioning, two sampling methods have been implemented, uniform and weighted random sampling, which are described in the next paragraph.
2.2.2 Scoring Algorithms
The most intuitive way of scoring energy deposition events in micrometric sites along a proton track would be to randomly select a point
To increase the sampling efficiency, weighted sampling can be used instead. In this case, an energy transfer point
The working principle of the two methods, and the way they were implemented in our code, is shown in Figure 2. In both cases, a hit selection region within the scoring volume, where
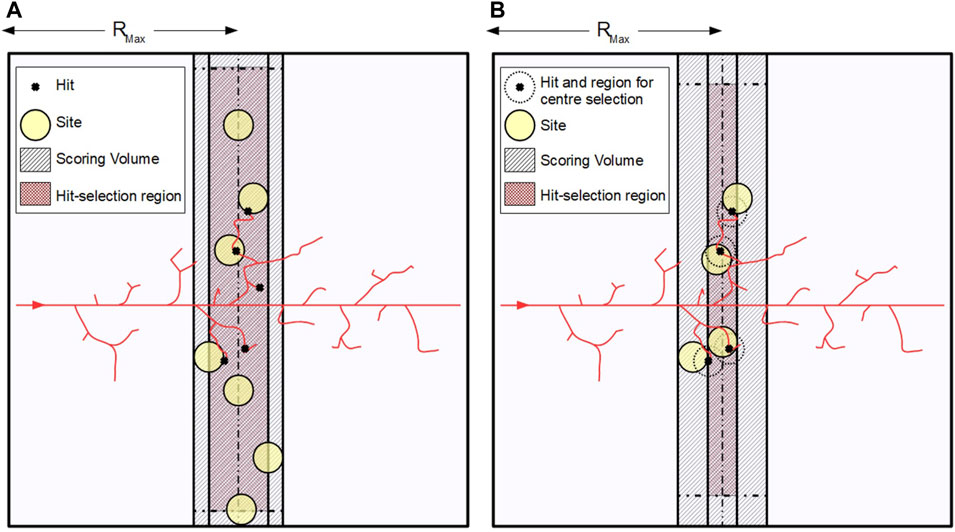
FIGURE 2. Graphical representation of the working principle of the two sampling algorithms: (A) uniform sampling and (B) weighted sampling. In both cases, a hit selection region (maroon shaded area) is identified, where the centers of the sites (yellow circles) are sorted. The dimensions of this region depend on the sampling algorithm used and on the diameter of the site, as lateral margins must be left to ensure that the site is always fully included in the scoring volume. For uniform sampling this margin must be set equal to the site radius, while for weighted sampling the margin is equal to the site diameter.
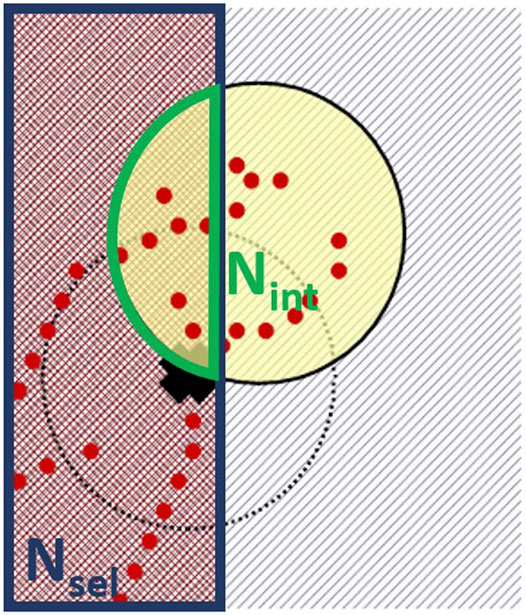
FIGURE 3. Detail of the working principle of the weighted sampling method in Figure 2B. The compensation factor is computed as the ratio between the number of selectable hits (with deposited energy different from zero) in the hit selection region (Nsel) and the number of hits in the intersection volume of the site with the hit selection region (Nint).
Once the position of the site is sorted, three main quantities are computed: the total energy deposited in the site per event, ϵs, the total energy deposited for each single proton collision, ɛc, and the trajectory length, s, of the proton traversing the site. In particular, for the computation of the energy imparted per individual proton collision, a Sensitive Detector class was specifically coded to identify uniquely the electronic showers generated by each collision. To this end, a distinctive tag is assigned to every primary electron set in motion by a proton collision. Then, taking advantage of the specific structure of the tracking algorithm of Geant4, all secondary electrons created by further collisions of the electron originating the shower are assigned the same tag, which becames an identifier of the shower. In this way, the energy deposited in the site by each δ-ray shower originating in the site or entering the site can be scored independently, as graphically represented in Figure 4.
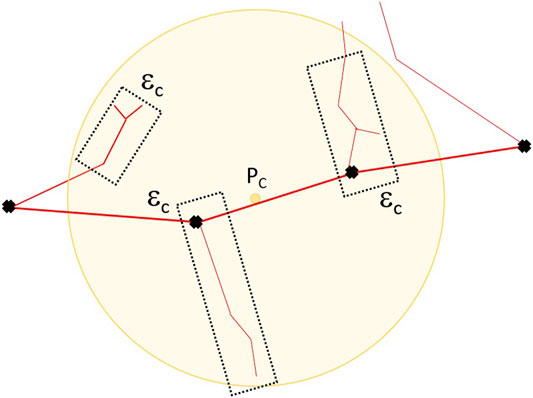
FIGURE 4. Schematic representation of the scoring method for the evaluation of the energy deposited per single proton collision in the site, ɛc. The primary δ-ray generated by the proton collision is identified and assigned one distinctive tag, that is then inherited by all the secondary electrons in the shower. Only the energy deposition events happening within the site are accounted for in the calculation of ɛc, including δ-ray influx from outside the site.
3 Results
Figure 5 shows the results obtained for the frequency-averaged energy imparted per event,
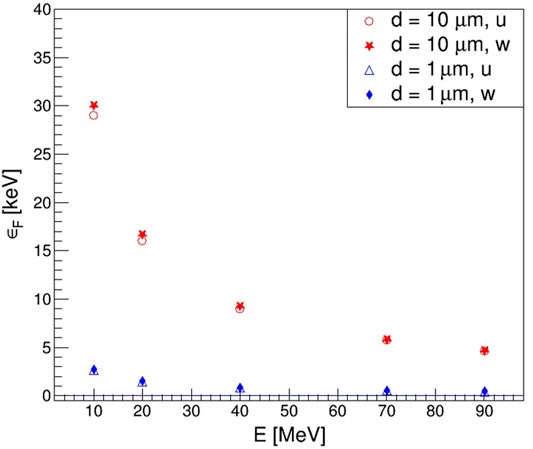
FIGURE 5. Frequency-averaged energy imparted per event
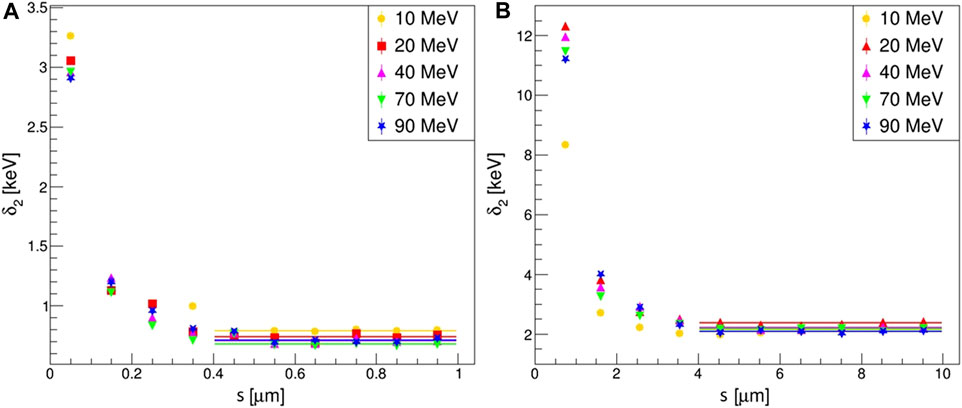
FIGURE 6. Variation of δ2 as a function of the proton trajectory length s within the site, obtained with weighted random sampling for the different energies. (A) sites of 1 μm diameter, (B) sites of 10 μm diameter. For the lower δ2 values, the main contribution to δ2 is given by the δ-ray influx, whose influence decreases quickly as s increases. For s > d/2, the value of δ2 can be considered as constant. Since
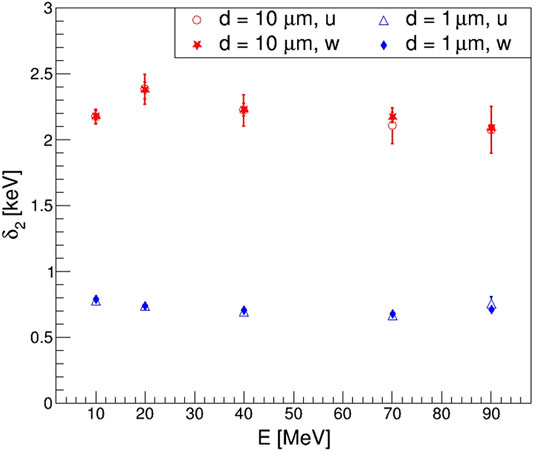
FIGURE 7. Weighted average of the distribution of energy imparted per individual proton collision δ2 as a function of the proton kinetic energy. Uniform (open markers) and weighted (full markers) random sampling results are compared for sites of 1 (blue triangles and diamonds) and 10 μm (red circles and stars) diameter sites.
The results obtained for the frequency-averaged lineal energy
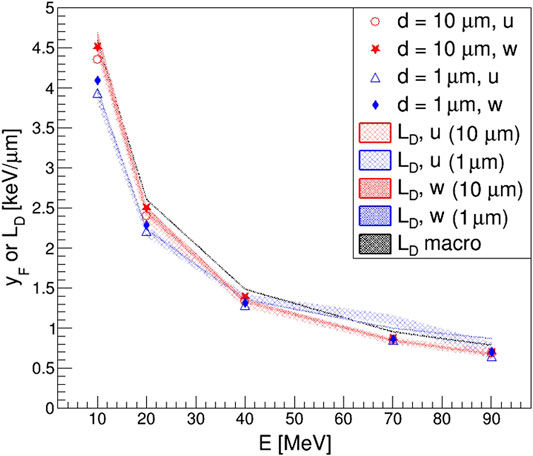
FIGURE 8. Frequency-averaged lineal energy
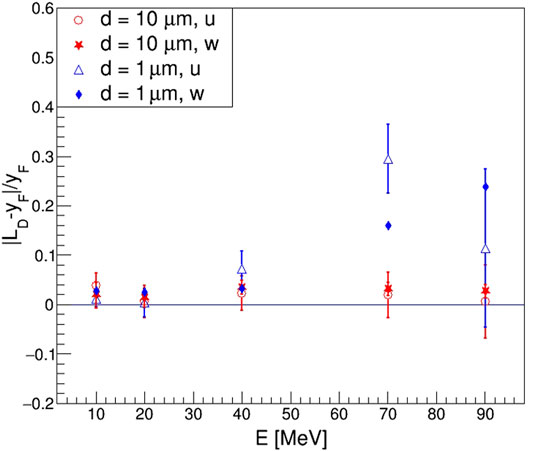
FIGURE 9. Relative residuals of
To solve this problem, we proposed the use of new quantities named effective mean chord length,
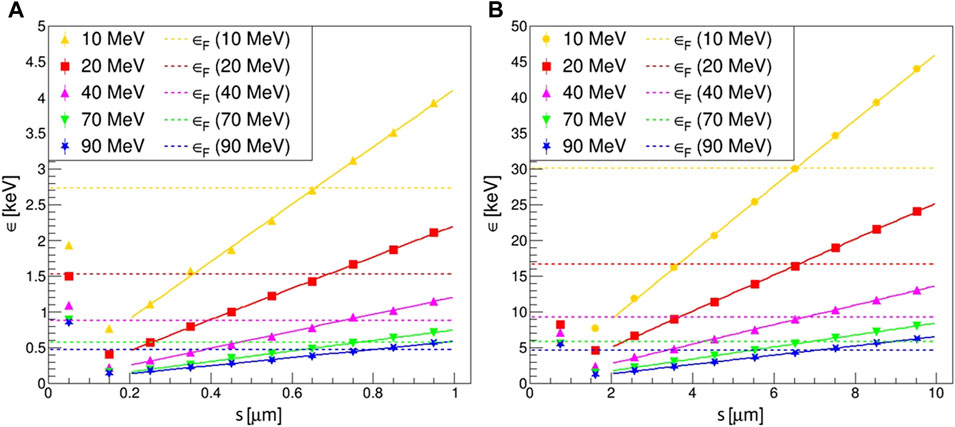
FIGURE 10. Plot of the variation of the mean energy imparted per event, ϵs, as a function of the proton trajectory length s, described in the site, obtained with weighted random sampling for the different energies and sites: (A) 1 μm diameter; (B) 10 μm diameter. For s ∼ 0, when proton tracks do not cross the site or pass tangent to it, the only contribution to ϵs is given by δ-ray influx. Then, for higher s, ϵs increases linearly with the trajectory length. The frequency-averaged energies imparted per event
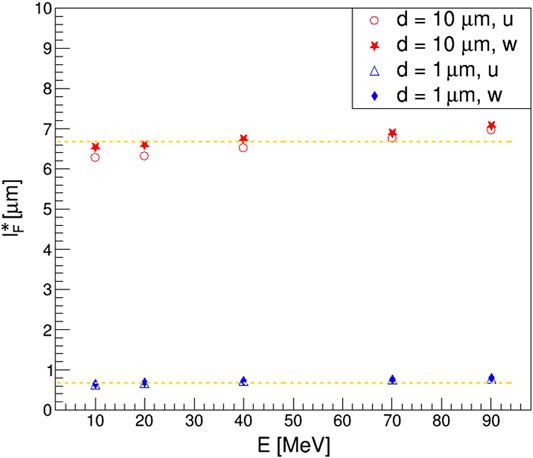
FIGURE 11. Effective mean chord length
Using the effective chord lengths for the computation of frequency and dose-averaged effective lineal energies, the results shown in Figure 12 could be obtained, where all the values of
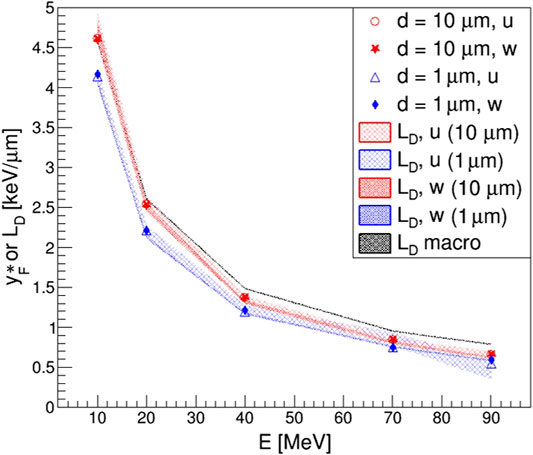
FIGURE 12. Effective frequency-averaged lineal energy
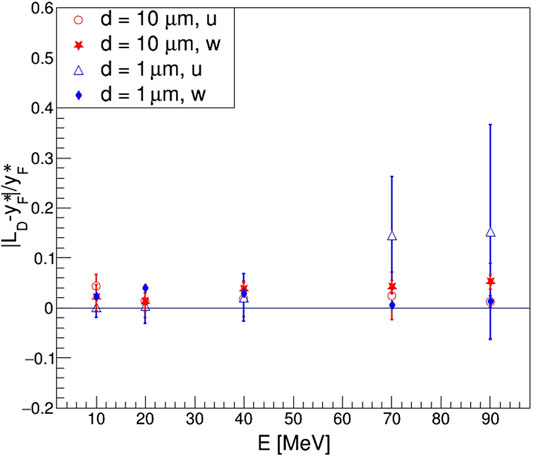
FIGURE 13. Relative residuals of
4 Discussion
In this work, a novel MC code for the computation of microdosimetric distributions generated by proton track segments in liquid water has been presented. Two different algorithms were implemented for the scoring of the quantities of interest: uniform and weighted random sampling for site positioning. While the first is ideally better as it is not subject to any bias, it is also very inefficient due to the high chances of selecting sites with no energy depositions within. On the contrary, weighted random sampling has a 100% efficiency, but might be subject to biases related to the choice of the weighting factor. One of the main elements of novelty of our code is the inclusion of an algorithm for the computation of the distribution of energy imparted per individual proton collision. This distribution, which is impossible to measure experimentally, reflects the action of energy straggling and δ-ray influx and escape on the energy deposited in the site, and it is fundamental for the computation of dose-averaged LET from microdosimetric quantities with Kellerer’s formula (Eq. 11).
In this study, our weighted random sampling algorithm was optimized so that the results obtained could be considered equivalent to uniform ones, with relative differences generally lower than 6%. Then, the code was used to run various simulations with mono-energetic proton beams, with energies in the range 10–90 MeV impinging on spherical sites of 1 and 10 μm diameter. Since for mono-energetic proton beams the relation
While generally no evident problems emerged in the results obtained for the 10 μm diameter site, the 1 μm site arose questions about the validity of Kellerer’s formula, as the
Concerning the δ2-values, we observed deviations from previous works when comparing calculations with sites of 10 μm diameter. While the values obtained in this work were between 2.1 and 2.4 keV for protons from 10 to 90 MeV, lower values were reported previously using other approaches. With dedicated simulations, aiming at isolating its calculation from contributions due to the variance of single-event energy imparted variance as discussed in [26], we reported values of about 1.8 keV; previously, with a more approximated calculation with G4EmPenelopePhysics physics list [35], values of about 1.5 keV were reported for the same energy range. These deviations suggest that the methodology followed to calculate δ2 must be explained in detail, as it may impact the values of
Using a weighted sampling approach in MC simulations to obtain microdosimetric quantities is undoubtedly advantageous in terms of computation time and efficiency. Indeed, the lower efficiency of uniform random sampling has emerged in our results numerous times, being its effects especially evident for sites of 1 μm diameter and proton kinetic energies above 70 MeV. For the same number of primary protons generated, a loss in statistic going from 60% to more than 90% in the worst case was observed, when comparing uniform sampling with weighted one. Therefore, the observed differences in the computational efficiencies clearly justifies the adoption of a weighted random sampling method for the computation of the microdosimetric quantities of interest, since equivalent results for
The current version of the code, available upon request, is intended to be incorporated within the official examples of the Geant4 toolkit dealing with the extension Geant4-DNA, as it shows the main aspects of the calculation of microdosimetric quantities with track segments of protons and ions (such as He, Li, C, O or Si) using spherical sites, and illustrates how
5 Conclusion
The use of a weighted random sampling approach in MC simulations for the calculation of microdosimetric quantities is widely supported in literature for its undeniable computational efficiency if compared to uniform random sampling. However, especially when considering segments of proton tracks traversing a sensitive volume, particular attention must be put in the computation of the weighting factors, to obtain unbiased results equivalent to uniform ones. In this work, we addressed this problem by developing a MC application for the computation of microdosimetric distributions generated by segments of proton tracks. A remarkable feature of our code, which would constitute a novelty as an official example of Geant4 toolkit, is the possibility of computing the distribution of energy imparted per single proton collision. This distribution, indeed, is strongly connected to the effect of energy straggling and δ-ray influx and escape on the energy deposited in a site per event, and represents the liaison between the microscopic dose-averaged lineal energy and the macroscopic dose-averaged LET, as theorised by Kellerer. To test and benchmark our code, we ran various simulations with mono-energetic proton beams, comparing frequency-averaged lineal energy results with dose-averaged LET ones obtained with Kellerer’s formula. As predicted theoretically for proton beams of this kind in the short track segment condition, we obtained a very good agreement between the two quantities, with percentage differences always lower than 6%. In order to obtain this result, we resorted to a new quantity proposed in this work, the effective mean chord length
Data Availability Statement
The raw data supporting the conclusions of this article will be made available by the authors, without undue reservation.
Author Contributions
Conceptualization, AB-R, AB, AC, and MC-G; Methodology, AB-R, AB, AC and MC-G; Simulations, AB-R, AB, GB; Formal Analysis, AB-R, AB and MC-G; Resources, AC and MC-G; Writing-Original Draft Preparation, AB-R. and MC-G; Writing-Review and Editing, AB-R, AB, GB, AC, and MC-G; Project Administration, AC and MC-G; Funding Acquisition, MC-G.
Funding
This work was funded by Grant RTI2018-098117-B-C21 funded by MCIN/AEI/10.13039/501100011033 and by “ERDF A way of making Europe”. The work also received funds from the European Union's Horizon 2020 research and innovation programme under the Marie Sklodowska-Curie Grant No. 675265, OMA--Optimization of Medical Accelerators, and from the Council for Economy, Industry, Knowledge and Universities of the Andalusian Government under Grant No. P18-RT-1900.
Conflict of Interest
The authors declare that the research was conducted in the absence of any commercial or financial relationships that could be construed as a potential conflict of interest.
Publisher’s Note
All claims expressed in this article are solely those of the authors and do not necessarily represent those of their affiliated organizations, or those of the publisher, the editors and the reviewers. Any product that may be evaluated in this article, or claim that may be made by its manufacturer, is not guaranteed or endorsed by the publisher.
Acknowledgments
All the Monte Carlo simulations presented in this work were carried out at the FIS-ATOM computing cluster hosted at CICA (Seville, Spain).
References
1. Rossi HH. Spatial Distribution of Energy Deposition by Ionizing Radiation. Radiat Res Suppl (1960) 2:290–9. doi:10.2307/3583601
2. Rossi HH. Distribution of Radiation Energy in the Cell. Radiology (1962) 78:530–5. doi:10.1148/78.4.530
3. Rossi HH. Correlation of Radiation Quality and Biological Effect. Ann N Y Acad Sci (1964) 114:4–15. doi:10.1111/j.1749-6632.1964.tb53559.x
4. Belli M, Cera F, Cherubini R, Vecchia MD, Haque AM, Lanzini F, et al. RBE-LET Relationships for Cell Inactivation and Mutation Induced by Low Energy Protons in V79 Cells: Further Results at the LNL Facility. Int J Radiat Biol (1998) 74:501–9. doi:10.1080/095530098141375
5. Peeler CR, Mirkovic D, Titt U, Blanchard P, Gunther JR, Mahajan A, et al. Clinical Evidence of Variable Proton Biological Effectiveness in Pediatric Patients Treated for Ependymoma. Radiother Oncol (2016) 121:395–401. doi:10.1016/j.radonc.2016.11.001
6. Grün R, Friedrich T, Traneus E, Scholz M. Is the Dose‐Averaged LET a Reliable Predictor for the Relative Biological Effectiveness? Med Phys (2019) 46:1064–74. doi:10.1002/mp.13347
7. Sanchez-Parcerisa D, Cortés-Giraldo MA, Dolney D, Kondrla M, Fager M, Carabe A. Analytical Calculation of Proton Linear Energy Transfer in Voxelized Geometries Including Secondary Protons. Phys Med Biol (2016) 61:1705–21. doi:10.1088/0031-9155/61/4/1705
8. Marsolat F, De Marzi L, Pouzoulet F, Mazal A. Analytical Linear Energy Transfer Model Including Secondary Particles: Calculations along the central axis of the Proton Pencil Beam. Phys Med Biol (2016) 61:740–57. doi:10.1088/0031-9155/61/2/740
9. Fager M, Toma-Dasu I, Kirk M, Dolney D, Diffenderfer ES, Vapiwala N, et al. Linear Energy Transfer Painting with Proton Therapy: a Means of Reducing Radiation Doses with Equivalent Clinical Effectiveness. Int J Radiat Oncol Biol Phys (2015) 91:1057–64. doi:10.1016/j.ijrobp.2014.12.049
10. Cao W, Khabazian A, Yepes PP, Lim G, Poenisch F, Grosshans DR, et al. Linear Energy Transfer Incorporated Intensity Modulated Proton Therapy Optimization. Phys Med Biol (2017) 63:015013. doi:10.1088/1361-6560/aa9a2e
11. Hawkins RB. A Microdosimetric-Kinetic Model of Cell Death from Exposure to Ionizing Radiation of Any LET, with Experimental and Clinical Applications. Int J Radiat Biol (1996) 69:739–55. doi:10.1080/095530096145481
12. Hawkins RB. A Microdosimetric-Kinetic Model for the Sensitization of V79 Cells to Radiation by Incorporation of Bromodeoxyuridine. Radiat Res (2001) 155:698–702. doi:10.1667/0033-7587(2001)155[0698:amkmft]2.0.co;2
13. Hawkins RB. A Microdosimetric-Kinetic Model for the Effect of Non-Poisson Distribution of Lethal Lesions on the Variation of RBE with LET. Radiat Res (2003) 160:61–9. doi:10.1667/rr3010
15. Lindborg L, Nikjoo H. Microdosimetry and Radiation Quality Determinations in Radiation protection and Radiation Therapy. Radiat Prot Dosimetry (2011) 143:402–8. doi:10.1093/rpd/ncq390
16. Kellerer AM. Microdosimetry and the Theory of Straggling. In: Biophysical Aspects of Radiation Quality. Vienna: International Atomic Energy Agency (1968). p. 89–103. Second Panel Report.
17. Kellerer AM. Analysis of Patterns of Energy Deposition. In: H Ebert, editor. Second Symposium on Microdosimetry. Stresa (Italy): Euratom (1970). p. 107–36. doi:10.5282/ubm/epub.7951
18. Kellerer AM. Fundamentals of Microdosimetry. In: KR Kase, BE Bjärngard, and FH Attix, editors. The Dosimetry of Ionizing Radiation. Cambridge MA: Academic Press (1985). p. 77–162. doi:10.1016/b978-0-12-400401-6.50007-3
19. Agostinelli S, Allison J, Amako K, Apostolakis J, Araujo H, Arce P, et al. Geant4 – a Simulation Toolkit. Nucl Instrum Meth Phys Res A (2003) 506:250–303. doi:10.1016/S0168-9002(03)01368-8
20. Allison J, Amako K, Apostolakis J, Araujo H, Arce Dubois P, Asai M, et al. Geant4 Developments and Applications. IEEE Trans Nucl Sci (2006) 53:270–8. doi:10.1109/tns.2006.869826
21. Allison J, Amako K, Apostolakis J, Arce P, Asai M, Aso T, et al. Recent Developments in Geant4. Nucl Instrum Meth Phys Res A (2016) 835:186–225. doi:10.1016/j.nima.2016.06.125
22. Incerti S, Baldacchino G, Bernal M, Capra R, Champion C, Francis Z, et al. The Geant4-DNA Project. Int J Model Simul Sci Comput (2010) 01:157–78. doi:10.1142/S1793962310000122
23. Incerti S, Ivanchenko A, Karamitros M, Mantero A, Moretto P, Tran HN, et al. Comparison ofGEANT4very Low Energy Cross Section Models with Experimental Data in Water. Med Phys (2010) 37:4692–708. doi:10.1118/1.3476457
24. Bernal MA, Bordage MC, Brown JMC, Davídková M, Delage E, El Bitar Z, et al. Track Structure Modeling in Liquid Water: A Review of the Geant4-DNA Very Low Energy Extension of the Geant4 Monte Carlo Simulation Toolkit. Physica Med (2015) 31:861–74. doi:10.1016/j.ejmp.2015.10.087
25. Incerti S, Kyriakou I, Bernal MA, Bordage MC, Francis Z, Guatelli S, et al. Geant4‐DNA Example Applications for Track Structure Simulations in Liquid Water: A Report from the Geant4‐DNA Project. Med Phys (2018) 45:e722–2739. doi:10.1002/mp.13048
26. Bertolet A, Baratto‐Roldán A, Barbieri S, Baiocco G, Carabe A, Cortés‐Giraldo MA. Dose‐Averaged LET Calculation for Proton Track Segments Using Microdosimetric Monte Carlo Simulations. Med Phys (2019) 46:4184–92. doi:10.1002/mp.13643
27. Kellerer AM, Chmelevsky D. Concepts of Microdosimetry. I. Quantities. Radiat Environ Biophys (1975) 12:61–9. doi:10.1007/BF02339810
28. Kellerer AM, Chmelevsky D. Concepts of Microdosimetry. II. Probability Distributions of the Microdosimetric Variables. Radiat Environ Biophys (1975) 12:205–16. doi:10.1007/BF01327348
29. Kellerer AM, Chmelevsky D. Concepts of Microdosimetry. III. Mean Values of the Microdosimetric Distributions. Radiat Environ Biophys (1975) 12:321–35. doi:10.1007/BF01323420
30. Kellerer AM, Chmelevsky D. Criteria for the Applicability of LET. Radiat Res (1975) 63:226–34. doi:10.2307/3574148
31. Kellerer AM. Chord-Length Distributions and Related Quantities for Spheroids. Radiat Res (1984) 98:425–37. doi:10.2307/3576477
32. Coleman R. Random Paths through Convex Bodies. J Appl Probab (1969) 6:430–41. doi:10.1017/s0021900200032939
33. Kyriakou I, Emfietzoglou D, Ivanchenko V, Bordage MC, Guatelli S, Lazarakis P, et al. Microdosimetry of Electrons in Liquid Water Using the Low-Energy Models of Geant4. J Appl Phys (2017) 122:024303. doi:10.1063/1.4992076
34. Kyriakou I, Ivanchenko V, Sakata D, Bordage MC, Guatelli S, Incerti S, et al. Influence of Track Structure and Condensed History Physics Models of Geant4 to Nanoscale Electron Transport in Liquid Water. Physica Med (2019) 58:149–54. doi:10.1016/j.ejmp.2019.01.001
35. Cortés-Giraldo MA, Carabe A. A Critical Study of Different Monte Carlo Scoring Methods of Dose Average Linear-Energy-Transfer Maps Calculated in Voxelized Geometries Irradiated with Clinical Proton Beams. Phys Med Biol (2015) 60:2645–69. doi:10.1088/0031-9155/60/7/2645
36. Tabata T, Ito R, Okabe S. Generalized Semiempirical Equations for the Extrapolated Range of Electrons. Nucl Instr Methods (1972) 103:85–91. doi:10.1016/0029-554x(72)90463-6
37. Baratto-Roldán A. Development of an External Beam Line for Radiobiology Experiments and Microdosimetry Applications at the 18 MeV Proton Cyclotron Facility at CNA. [Ph.D. Thesis]. Seville, Spain: Universidad de Sevilla (2020).
38. Famulari G, Pater P, Enger SA. Microdosimetry Calculations for Monoenergetic Electrons Using Geant4-DNA Combined with a Weighted Track Sampling Algorithm. Phys Med Biol (2017) 62:5495–508. doi:10.1088/1361-6560/aa71f6
39. Carabe A, España S, Grassberger C, Paganetti H. Clinical Consequences of Relative Biological Effectiveness Variations in Proton Radiotherapy of the Prostate, Brain and Liver. Phys Med Biol (2013) 58:2103–17. doi:10.1088/0031-9155/58/7/2103
40. Wedenberg M, Lind BK, Hårdemark B. A Model for the Relative Biological Effectiveness of Protons: The Tissue Specific Parameter α/β of Photons Is a Predictor for the Sensitivity to LET Changes. Acta Oncologica (2013) 52:580–8. doi:10.3109/0284186X.2012.705892
41. McNamara AL, Schuemann J, Paganetti H. A Phenomenological Relative Biological Effectiveness (RBE) Model for Proton Therapy Based on All Publishedin Vitrocell Survival Data. Phys Med Biol (2015) 60:8399–416. doi:10.1088/0031-9155/60/21/8399
42. Perales Á, Baratto-Roldán A, Kimstrand P, Cortés-Giraldo MA, Carabe A. Parameterising Microdosimetric Distributions of Mono-Energetic Proton Beams for Fast Estimates of Y D and Y*. Biomed Phys Eng Express (2019) 5:045014. doi:10.1088/2057-1976/ab236a
43. Bertolet A, Baratto‐Roldán A, Cortés‐Giraldo MA, Carabe‐Fernandez A. Segment‐Averaged LET Concept and Analytical Calculation from Microdosimetric Quantities in Proton Radiation Therapy. Med Phys (2019) 46:4204–14. doi:10.1002/mp.13673
44. Bertolet A, Cortés‐Giraldo MA, Souris K, Carabe A. A Kernel‐Based Algorithm for the Spectral Fluence of Clinical Proton Beams to Calculate Dose‐Averaged LET and Other Dosimetric Quantities of Interest. Med Phys (2020) 47:2495–505. doi:10.1002/mp.14108
45. Bertolet A, Ramos-Méndez J, Paganetti H, Schuemann J. The Relation between Microdosimetry and Induction of Direct Damage to DNA by Alpha Particles. Phys Med Biol (2021) 66:155016. doi:10.1088/1361-6560/ac15a5
46. Bertolet A, Grilj V, Guardiola C, Harken AD, Cortés-Giraldo MA, Baratto-Roldán A, et al. Experimental Validation of an Analytical Microdosimetric Model Based on Geant4-DNA Simulations by Using a Silicon-Based Microdosimeter. Radiat Phys Chem (2020) 176:109060. doi:10.1016/j.radphyschem.2020.109060
Keywords: Geant4-DNA, dose-averaged LET, microdosimetry, lineal energy, site sampling method, proton therapy
Citation: Baratto-Roldán A, Bertolet A, Baiocco G, Carabe A and Cortés-Giraldo MA (2021) Microdosimetry and Dose-Averaged LET Calculations of Protons in Liquid Water: A Novel Geant4-DNA Application. Front. Phys. 9:726787. doi: 10.3389/fphy.2021.726787
Received: 17 June 2021; Accepted: 05 October 2021;
Published: 27 October 2021.
Edited by:
Paul Sellin, University of Surrey, United KingdomReviewed by:
Giuseppe Schettino, National Physical Laboratory, United KingdomDimitris Emfietzoglou, University of Ioannina, Greece
Copyright © 2021 Baratto-Roldán, Bertolet, Baiocco, Carabe and Cortés-Giraldo. This is an open-access article distributed under the terms of the Creative Commons Attribution License (CC BY). The use, distribution or reproduction in other forums is permitted, provided the original author(s) and the copyright owner(s) are credited and that the original publication in this journal is cited, in accordance with accepted academic practice. No use, distribution or reproduction is permitted which does not comply with these terms.
*Correspondence: Anna Baratto-Roldán, abaratto@us.es; Miguel Antonio Cortés-Giraldo, miancortes@us.es