 Kasja Pavlovic1*
 Nina Krako Jakovljevic1
 Andjelka M. Isakovic2
 Tijana Ivanovic3
 Ivanka Markovic2
 Nebojsa M. Lalic1
- 1Clinic for Endocrinology, Diabetes and Metabolic Diseases, University Clinical Center of Serbia, Belgrade, Serbia
- 2Faculty of Medicine, Institute of Medical and Clinical Biochemistry, University of Belgrade, Belgrade, Serbia
- 3Faculty of Medicine, University of Belgrade, Belgrade, Serbia
Metformin is an oral antidiabetic agent that has been widely used in clinical practice for over 60 years, and is currently the most prescribed antidiabetic drug worldwide. However, the molecular mechanisms of metformin action in different tissues are still not completely understood. Although metformin-induced inhibition of mitochondrial respiratory chain Complex I and activation of AMP-activated protein kinase have been observed in many studies, published data is inconsistent. Furthermore, metformin concentrations used for in vitro studies and their pharmacological relevance are a common point of debate. The aim of this study was to explore the effects of different metformin concentrations on energy metabolism and activity of relevant signaling pathways in C2C12 muscle cells in vitro. In order to determine if therapeutic metformin concentrations have an effect on skeletal muscle cells, we used micromolar metformin concentrations (50 µM), and compared the effects with those of higher, millimolar concentrations (5 mM), that have already been established to affect mitochondrial function and AMPK activity. We conducted all experiments in conditions of high (25 mM) and low glucose (5.5 mM) concentration, in order to discern the role of glucose availability on metformin action. According to our results, micromolar metformin treatment did not cause Complex I inhibition nor AMPK activation. Also, cells cultured in low glucose medium were more sensitive to Complex I inhibition, mitochondrial membrane depolarization and AMPK activation by millimolar metformin, but cells cultured in high glucose medium were more prone to induction of ROS production. In conclusion, even though suprapharmacological metformin concentrations cause Complex I inhibition and AMPK activation in skeletal muscle cells in vitro, therapeutic concentrations cause no such effect. This raises the question if these mechanisms are relevant for therapeutic effects of metformin in skeletal muscle.
Introduction
Metformin is an oral antidiabetic drug from the biguanide group. Relevant organizations recommend metformin as a first line drug for treating type 2 diabetes mellitus (American Diabetes Association, 2022). Due to its efficacy, favorable safety profile and affordable price, it is currently the most prescribed antidiabetic in the world (Diabetes Prevention Program Research Group, 2012). Metformin lowers blood glucose by inhibiting hepatic glucose production and increasing glucose uptake in peripheral tissues, mainly skeletal muscle (Inzucchi et al., 1998; Giannarelli et al., 2003; Phielix et al., 2011). Although it has been used in clinical practice for over 60 years, its molecular mechanisms of action are not yet fully elucidated.
Some of the commonly proposed mechanisms are inhibition of mitochondrial respiratory chain Complex I (CI) (El-Mir et al., 2000; Owen et al., 2000) and activation of AMP-activated protein kinase (AMPK) (Zhou et al., 2001; Musi et al., 2002). Clear conclusions about the precise mechanisms, target tissues and pharmacological relevance of these molecular effects of metformin are hard to draw, since published data is variable and inconsistent. Part of this variability can be explained by differences in chosen models, methods and experimental design. Also, there are significant differences in concentrations and durations of treatments that lead to observable effects. Concentrations of metformin used in in vitro studies are a common point of criticism (Fontaine, 2018; Vial et al., 2019), as most frequently reported concentrations are in the millimolar range, whereas plasma concentrations in conditions of oral administration rarely exceed 30 µM (Christensen et al., 2011). A small number of recent studies that used lower metformin concentrations showed either no change or an improvement of mitochondrial function (Wang et al., 2019; Emelyanova et al., 2021).
Metformin is also assumed to act as an insulin sensitizer, but it is unclear if this is caused by changes in insulin signaling at the cellular level, or changes in whole-body glucose and lipid metabolism (Zabielski et al., 2017; Bradley et al., 2019). Data on the direct effects of metformin on the phosphoinositide 3-kinase (PI3K)/Akt signaling pathway are inconsistent (Kim et al., 2002; Zhou et al., 2016), but having in mind the established relationship of this pathway and the AMPK pathway, which are regulated by one another at multiple sites (Towler and Hardie, 2007), it is safe to say that further exploration of this signaling axis is of importance for clarifying the full scope of metformin action. The insulin sensitizing effect of metformin could prove especially important for peripheral tissues like skeletal muscle, as previously discussed mechanisms have been studied and confirmed almost exclusively in liver cells. Studies on metformin action in skeletal muscle have been scarse in recent years, but as it is a tissue with a large impact in glycemic regulation, its potential role in glucose-lowering effects of metformin should not be disregarded.
Our hypothesis is that low metformin concentrations, in the therapeutic range, have a different effect on energy metabolism and activity of relevant signaling pathways in skeletal muscle cells than the previously described suprapharmacological concentrations. In order to determine this we used micromolar metformin concentrations (50 µM), to treat muscle cells in vitro, and we performed all experiments with high concentration (5 mM) in parallel, to see if the previously established effects would be reproduced in C2C12 cells and in our conditions. We conducted all experiments in conditions of high (25 mM) and low glucose (5.5 mM), as we consider energy substrate availability to be important, especially when studying an agent that is believed to alter pathways of glucose metabolism.
Material and Methods
Cell Culture and Reagents
C2C12 mouse myoblast cell line was obtained from European Collection of Animal Cell Cultures (ECACC). Cells were cultured at 37°C, in a humidified atmosphere with 5% CO2, in two different culture mediums—Dulbecco’s Modified Eagle Medium (DMEM) with high glucose (HG) (25 mM glucose) or low glucose (LG) (5.5 mM glucose), supplemented with 10% fetal bovine serum and 1% antibiotic/antimycotic solution (all from Capricorn Scientific, Ebsdorfergrund, Germany). Cells were prepared for experiments using the conventional trypsinization procedure with trypsin/EDTA, counted and plated in 96-well plates (3000 cells/well) for viability assays, 12-well plates (40,000 cells/well) for flow cytometry, Petri dishes (400,000 cells) for high-resolution respirometry and western blot (tissue culture plates were from Sarstedt, Numbrecht, Germany). After plating, cells were treated on the subsequent day with a solution of metformin hydrochloride (Galenika, Belgrade, Serbia) (concentration and duration of treatment are indicated in figure legends). If not otherwise stated cells were undifferentiated. For differentiation, cells were grown until reaching confluency, standard growth medium was altered to differentiation medium (DMEM supplemented with 2% horse serum), and cultured for another 4 days.
Cell Viability
Cell viability was determined using three different viability assays - acid phosphatase (AcP), MTT and crystal violet (CV). For AcP assay, substrate solution (10 mM p-nitrophenyl phosphate in 0.1 M sodium acetate buffer, pH 5.5, with 0.1% Triton X-100) was added to cell culture. Cells were incubated for 90 min at 37°C, reaction was blocked by adding 1 M NaOH, and absorbance measured at 405 nm. For MTT assay, cell medium was removed after treatment and 3-(4,5-dimethylthiazol-2-yl)-2,5-diphenyltetrazolium bromide (MTT) solution (0.5 mg/ml) added to cell culture and incubated for 3 h at 37°C. The solution was discarded and formazan crystals solubilized by adding DMSO, and absorbance was measured at 570 nm. For CV assay, cell medium was discarded after the treatment and wells were washed with PBS, to remove the non-viable cells. The remaining cells were then fixed with methanol and stained with CV. The dye was diluted by adding 33% acetic acid and absorbance measured at 570 nm. For all viability assays, absorbance was measured using an automated microplate reader (Sunrise; Tecan, Dorset, United Kingdom). Viability of treated cells was expressed as a percentage of control (untreated) cells, which was considered to be 100%.
Glucose Concentration
Glucose concentration in cell medium was measured as an indirect indicator of glucose uptake by the cells. Glucose concentration was measured spectrophotometrically, using Glucose-TR kit (Spinreact, Girona, Spain), which is based on an enzymatic reaction of glucose oxidation by glucose oxidase, followed by formation of hydrogen peroxide which reacts with a chromogenic oxygen acceptor, phenol-aminophenazone in the presence of peroxidase, and the intensity of formed color is proportional to the glucose concentration in the sample. Absorbance at 492 nm was measured using an automated microplate reader (Sunrise; Tecan, Dorset, United Kingdom). Each measurement was performed in duplicate, and mean values were used for further statistical analysis.
Mitochondrial Respiration
Mitochondrial respiratory function was measured by high-resolution respirometry (Oroboros Oxygraph-2k, Oroboros Instruments, Innsbruck, Austria). After treatment, cells were trypsinized, counted and resuspended in mitochondrial respiration medium MiR05 (EGTA 0.5 mM, MgCl2⋅6H2O 3 mM, lactobionic acid 60 mM, taurine 20 mM, KH2PO4 10 mM, HEPES 20 mM, D-sucrose 110 mM, BSA 1 g/l, pH 7.1), and experiments were performed in the same medium. For experiments on permeabilized cells, detergent digitonin was used to make pores in cell membranes, in order for substances that are not cell-permeable to be able to reach the mitochondria. Optimal cell number per chamber (500,000 cells) and digitonin concentration (10 µg/million cells) were determined according to protocol (Doerrier et al., 2018). Mitochondrial respiration was assessed using different substrate-uncoupler-inhibitor titration (SUIT) protocols, and expressed as O2 flow per cell (amol∙s-1∙cell-1). Respiration of permeabilized cells was assessed by measuring ROUTINE respiration of living (intact) cells prior to permeabilization by digitonin (10 µg/million cells) followed by LEAK respiration, which compensates for electron leak through the inner mitochondrial membrane, when ADP is not present and ATP synthase is not active, in presence of NADH-linked substrates (pyruvate 5 mM; malate 2 mM; glutamate 10 mM). NADH-linked oxidative phosphorylation capacity was measured in presence of NADH-linked substrates and ADP (ADP 2.5 mM; Mg 1.5 mM), and convergent NADH and succinate-linked oxidative phosphorylation capacity was measured after addition of succinate (10 mM). Succinate-linked oxidative phosphorylation capacity was obtained by inhibiting CI (rotenone 0.5 µM), ROX—residual oxygen consumption, after inhibition of Complex III (antimycin A 2.5 µM) and CIV—activity of Complex IV by addition of artificial Complex IV-specific electron donor (N,N,N′,N′-tetramethyl-p-phenylenediamine dihydrochloride - TMPD 0.5 mM; ascorbate 2 mM). All respiratory states presented in figures are corrected for ROX. Respiratory states measured and presented for experiments on living (intact) cells are ROUTINE - respiration of living cells, LEAK—respiration in presence of ATP synthase inhibitor oligomycin, ET—electron transfer capacity, i.e., respiration in presence of uncoupler (carbonyl cyanide m-chlorophenyl hydrazone—CCCP). Cytochrome c was used for assessing outer mitochondrial membrane integrity. For experiments performed in differentiated and undifferentiated cells with 5 days metformin treatment, citrate synthase activity, as a measure of mitochondrial content, was measured spectrophotometrically, according to protocol (Eigentler, 2020) modified for 96-well plate. All reagents for high-resolution respirometry were purchased from Sigma-Aldrich (St. Louis, Missouri, United States).
Oxidative Stress and Mitochondrial Function
Cells were stained with dihydroethidium (DHE) for superoxide anion radical detection, dihydrorhodamine (DHR) for total production of reactive oxygen species (ROS), JC-1 for mitochondrial membrane potential and MitoTracker Red CMXRos for mitochondrial content (all from Thermo Fisher Scientific, Waltham, Massachusetts, United States). Cells were incubated with appropriate fluorochromes (1 µM DHR, 10 µM DHE, 2 μM JC-1, 100 nM MitoTracker Red) for 30 min. Fluorescence intensity was measured using FACSCalibur flow cytometer and analysed using CellQuest Pro Software (BD, Franklin Lakes, New Jersey, United States). Results for JC-1 are presented as green/red fluorescence ratio (FL1/FL2). All results are presented as fold change of GeoMean (geometric mean of detected fluorescence) compared to control (untreated) cells, set to 1.
Signaling Pathway Activity
Signaling pathway activity was measured by western blot. For preparing samples, cells were lysed with buffer (15 mM Tris pH 7.4, 150 mM NaCl, 1% NP-40, 1 mM EDTA) with PMSF, phosphatase inhibitors NaF and Na2VO3 and protease/phosphatase inhibitor cocktail (Sigma-Aldrich; St Louis, Missouri, United States). After incubation (30 min on ice), samples were centrifuged at 14,000 g for 15 min at 4°C and supernatants were collected. Total protein concentration was measured by Bradford assay, and samples prepared by adding loading buffer (final concentrations in sample 80 mM Tris, 2% SDS, 10% glycerol, 2 mM β-mercaptoethanol, 0.9 mM bromophenol blue) and boiling at 100°C for 5 min. Equal amounts of sample (10 µg protein/lane) were separated by SDS-PAGE using 8–12% gels (depending on the proteins of interest). Proteins were transferred to nitrocellulose membranes (GE Healthcare, Chicago, Illinois, United States) by semi-dry transfer. Membranes were incubated with primary antibodies against proteins of interest: pAMPK Thr172 (#2535), AMPK (#2603), pAkt Ser473 (#9271), pAkt Thr308 (#4056), Akt (#9272), pGSK3β Ser9 (#5558), GSK3β (#12456), pACC Ser79 (#11818), ACC (#3676) (1:1000 dilution, all from Cell Signaling Technology; Danvers, Massachusetts, United States) and β-actin (PA5-85291) (1:10000 dilution, from Invitrogen, Thermo Fisher Scientific, Waltham, Massachusetts, United States) over night at 4°C and peroxidase-conjugated goat anti-rabbit IgG secondary antibody (111-035-144) (1:10,000 dilution, from Jackson Immuno Research Laboratories; West Grove, Pennsylvania, United States) for 90 min at room temperature. Chemiluminescent visualization was performed with luminol and p-coumaric acid solution using ChemiDoc. Protein levels were quantified by densitometry, using Image Lab software. Proteins of interest were normalized to β-actin, and phosphorylated forms were additionally normalized to the total levels of the same protein. Results are presented as fold change compared to untreated cells, set to 1. All equipment for SDS-PAGE, transfer and visualization, including software for densitometry is from Bio-Rad (Bio-Rad Laboratories Inc., Hercules, California, United States).
Statistical Analysis
Student’s t-test was used for one factor comparison of two groups, and one way ANOVA for one factor comparison of three or more groups. Post hoc tests were performed according to Dunnett. A p value ≤0.05 was considered significant and ≤0.01 highly significant. Statistical tests were done using GraphPad Prism software (GraphPad Prism Software Inc., San Diego, California, United States).
Results
Metformin treatment caused a decrease in cell viability in concentrations higher than 3 mM (3.2 and 12.8 mM), in two of the cell viability assays (CV and AcP) (Figures 1A,B). In the MTT assay, viability of cells grown in high glucose (HG) medium decreased only when treated with the highest metformin concentration (Figure 1C). High metformin concentration (5 mM) caused a decrease in glucose concentration in both HG and LG medium, where lower metformin concentration (50 µM) had no effect (Figure 1D).
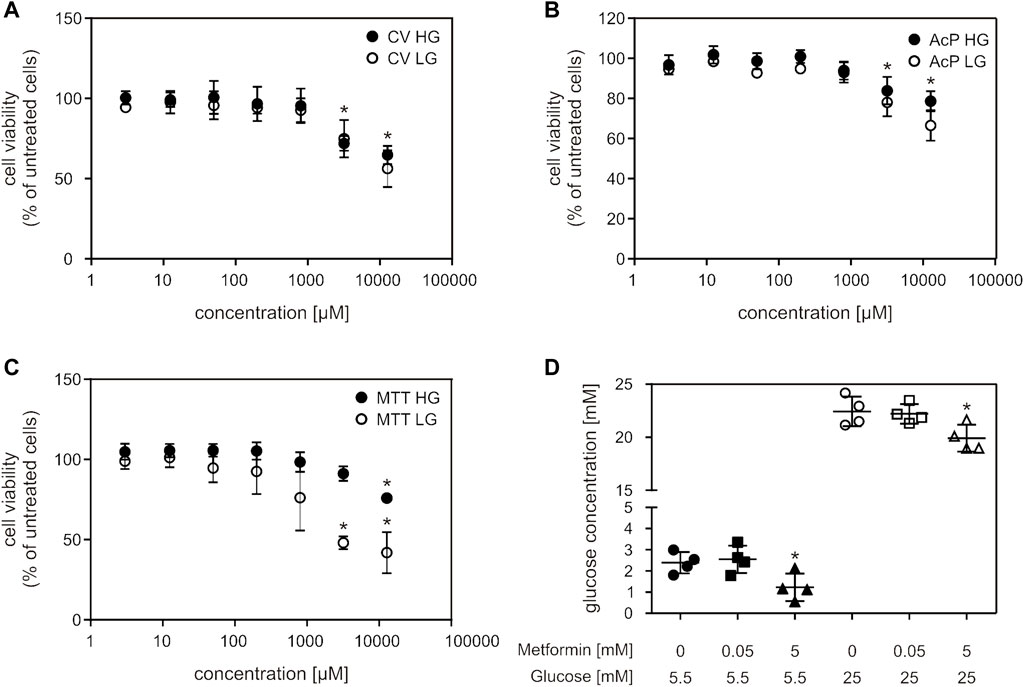
FIGURE 1. Millimolar metformin concentrations decreased cell viability and glucose concentration in cell medium. C2C12 cells were treated with a wide range of metformin concentrations (3; 12.5; 50; 200; 800; 3,200; 12,800 µM) for 24 h and cell viability was measured by CV (A), AcP (B) and MTT (C) assays. Results from three independent experiments (each with six technical replicates) are presented as mean ± SD (A–C). Glucose concentration in HG and LG cell medium after 24 h of treatment with 50 μM and 5 mM metformin was measured by Glucose-TR assay (D). Results from four independent experiments are presented as scatter plots, with mean ± SD (D), *p < 0.05. MF—metformin, CV—crystal violet, AcP—acid phosphatase, HG—high glucose, LG—low glucose.
When we treated cells with increasing metformin concentrations for 24 h, we observed a decrease in ROUTINE respiration only in cells treated with the highest concentration (5 mM) (Figures 2A–C), and a decrease in oxidative phosphorylation capacity with NADH (Complex I)-linked substrates (OXPHOS-N) in cells treated with 1 and 5 mM metformin, in both cell media (Figures 2A,B,E). No differences were observed in either LEAK respiration or succinate (Complex II)-linked OXPHOS capacity (OXPHOS-S) (Figures 2D,F). Cells cultured in LG medium were more sensitive to metformin treatment—when treated with 5 mM metformin, the decrease in NADH-linked OXPHOS capacity was more pronounced (68% for HG and 85% for LG) (Figures 2A,B,E). OXPHOS capacity was higher in untreated LG, compared to HG medium-cultured cells (Figures 2A,B,E), which can be explained by the Warburg-Crabtree effect (Marroquin et al., 2007; de Kok et al., 2021), and was previously shown for C2C12 cells (Elkalaf et al., 2013).

FIGURE 2. Mitochondrial respiration is decreased by suprapharmacological but not therapeutic metformin concentrations. C2C12 cells were treated with metformin (50–5000 µM) for 24 h and mitochondrial respiration of permeabilized cells was measured by high-resolution respirometry. Representative DatLab traces of untreated and 5 mM metformin treated high glucose (A) and low glucose (B) medium-cultured cells. Respiration rates of ROUTINE (C), LEAK (D), OXPHOS-N (E), and OXPHOS-S (F) respiratory states, all corrected for ROX, from 3 to 5 independent experiments are presented as scatter plots, with mean ± SD, *p < 0.05. Dig—digitonin, P—pyruvate, M—malate, D—ADP, Rot—rotenone, S—succinate, cyt c—cytochrome c, Ama—antimycin A, HG—high glucose, LG—low glucose, MF—metformin, Ø—untreated control, OXPHOS-N—NADH-linked oxidative phosphorylation capacity, OXPHOS-S—succinate-linked oxidative phosphorylation capacity.
We wanted to further explore the effect of metformin on mitochondrial respiration by using a different protocol for high-resolution respirometry (respiration of living cells) as well as different treatment durations—a short treatment (adding metformin directly to the instrument chamber prior to measurement) and a 5-day treatment of undifferentiated and differentiated cells. Differentiated C2C12 cells were added in order to explore possible differences in response to metformin treatment between undifferentiated and differentiated cells, as differentiation has been shown to affect energy metabolism in C2C12 cells (Siengdee et al., 2015). Measuring respiration of intact cells, we observed decreased respiration in cells treated with 5 mM (but not 50 µM) metformin, in all three measured respiratory states (ROUTINE, LEAK, ET) (Figures 3A–C). Similarly, NADH-linked OXPHOS capacity decreased only in cells exposed to short-term 5 mM metformin treatment (Supplementary Figure S1C). We observed no changes in differentiated and undifferentiated cells treated with 50 µM metformin for 5 days, in any of the respiratory states or either cell culture medium (Figures 3D,E). Citrate synthase activity, as a measure of mitochondrial content, showed no difference between either untreated and cells treated with metformin for 5 days, or cells cultured in LG and HG medium [HG: Ø = 0.033 ± 0.026; MF = 0.035 ± 0.029; LG: Ø = 0.05 ± 0.01; MF = 0.053 ± 0.013 (IU/106 cells)] Respiratory data normalized to citrate synthase activity also showed no difference between groups (data not shown).
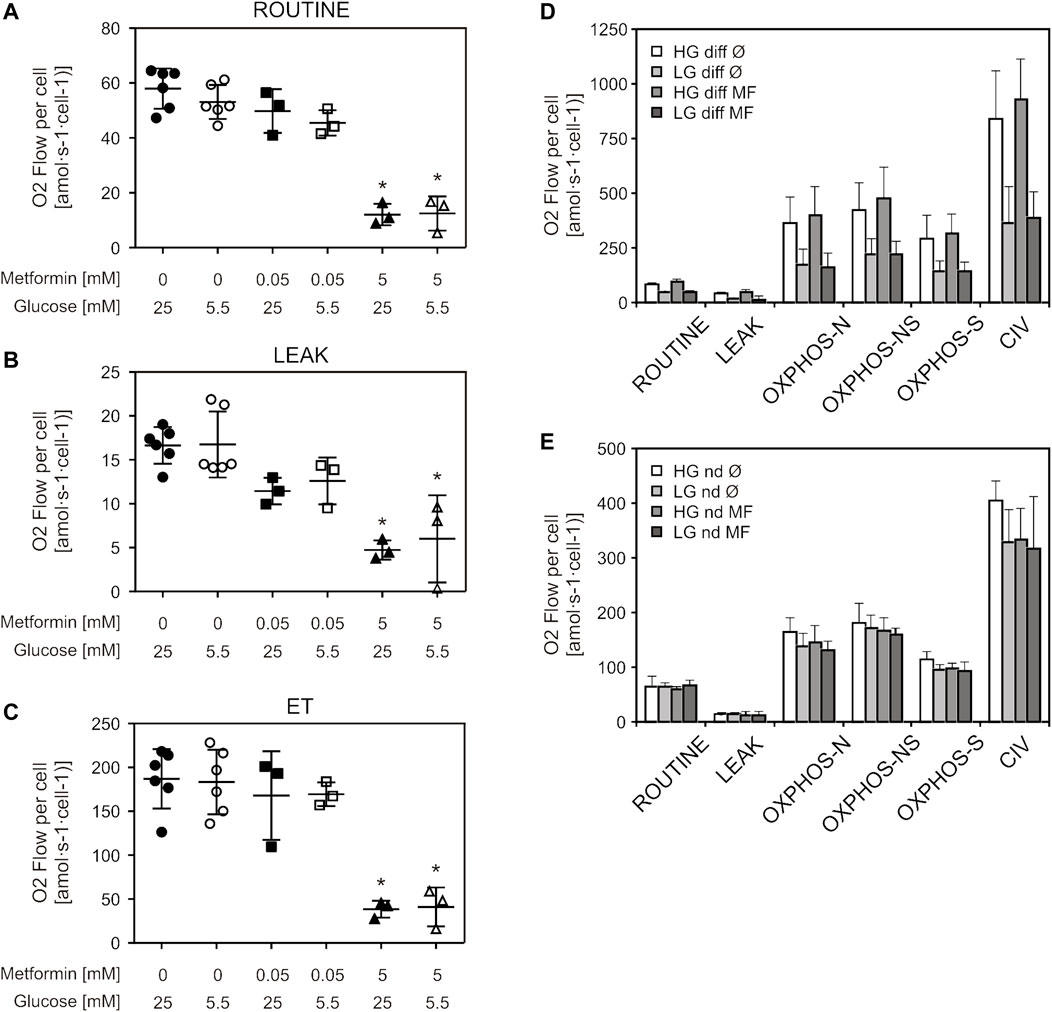
FIGURE 3. Therapeutic metformin concentrations did not alter mitochondrial respiration of living cells or long-term treated permeabilized cells. C2C12 cells were treated with 50 µM or 5 mM metformin for 24 h and respiration of living (intact) cells was measured by high-resolution respirometry. Respiration rates of ROUTINE (A), LEAK (B) and ET (C) respiratory states, corrected for ROX, are presented as scatter plots, with mean ± SD (number of independent experiments n = 3). Differentiated (D) and undifferentiated (E) C2C12 cells were treated with 50 µM metformin for 5 days, and respiration of permeabilized cells was measured by high-resolution respirometry. Results from three independent experiments are presented as mean ± SD, *p < 0.05. HG—high glucose, LG—low glucose, MF—metformin, Ø—untreated control, diff—differentiated cells, nd—undifferentiated cells, ET—electron transfer capacity, OXPHOS-N—NADH-linked oxidative phosphorylation capacity, OXPHOS-NS—NADH and succinate-linked oxidative phosphorylation capacity, OXPHOS-S—succinate-linked oxidative phosphorylation capacity.
Superoxide production was increased by 5 mM metformin treatment in both cell media, which was more pronounced for HG (34%) compared to LG—cultured cells (18%) (Figure 4A). Furthermore, 5 mM metformin treatment also increased ROS production in HG medium (Figure 4B). Total ROS production was elevated in HG medium, irrespective of metformin treatment, when compared to LG medium-grown cells (Figure 4B). 5 mM metformin caused depolarization of inner mitochondrial membrane in both media, the effect being more pronounced in LG medium-grown cells (mean FL1/FL2 for HG = 3.1, LG = 14.2) (Figure 4C). Total mitochondrial content did not change in any of the studied conditions (Figure 4D). It should be noted that mitochondrial membrane depolarization is also evident at earlier time points (starting from 6 h), whereas the values of other parameters remained unchanged (data not shown).
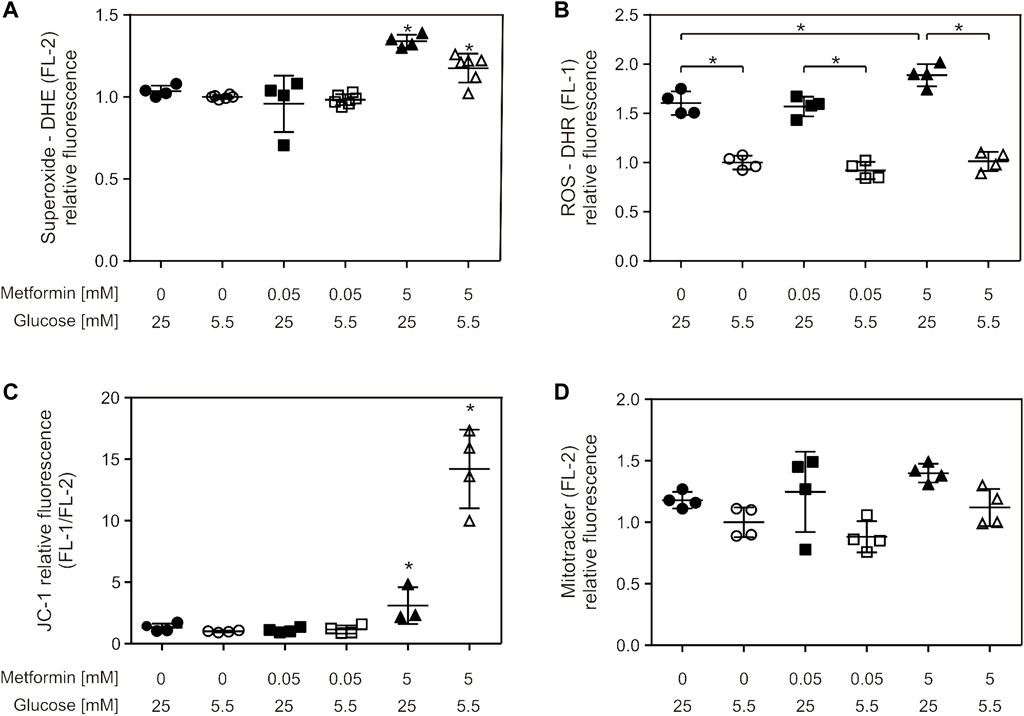
FIGURE 4. Suprapharmacological, but not therapeutic, metformin concentration caused increased total ROS and superoxide production and mitochondrial membrane depolarization. C2C12 cells were treated with 50 µM or 5 mM metformin for 24 h, and superoxide (A), ROS (B), mitochondrial membrane potential (C) and mitochondrial content (D) were measured by flow cytometry using appropriate fluorophores. All the data points from two independent experiments done in duplicate are presented as scatter plots, with mean ± SD, *p < 0.05.
Activity of PI3K/Akt and AMPK signaling pathways was studied using western blot (Figure 5A). In cells treated with 5 mM, but not 50 µM metformin, a trend of increase in AMPK (Thr172) and its downstream substrate ACC phosphorylation level was observed in both HG and LG medium (2-5 fold and 2-7 fold, respectively), which implies activation of this signaling pathway (Figure 5B, upper panels). The change was more pronounced in LG medium. The same trend was also observed for phosphorylated Akt, including both phosphorylation sites (1.5-5 fold and 1.5–3.5 fold increase for Thr308 and Ser473, respectively), and phosphorylation of GSK3β (downstream substrate of Akt) (1.3–3.5 fold increase), reaching statistical significance for pAkt S473 and GSK3β in LG medium-cultured cells (Figure 5B, lower panels).
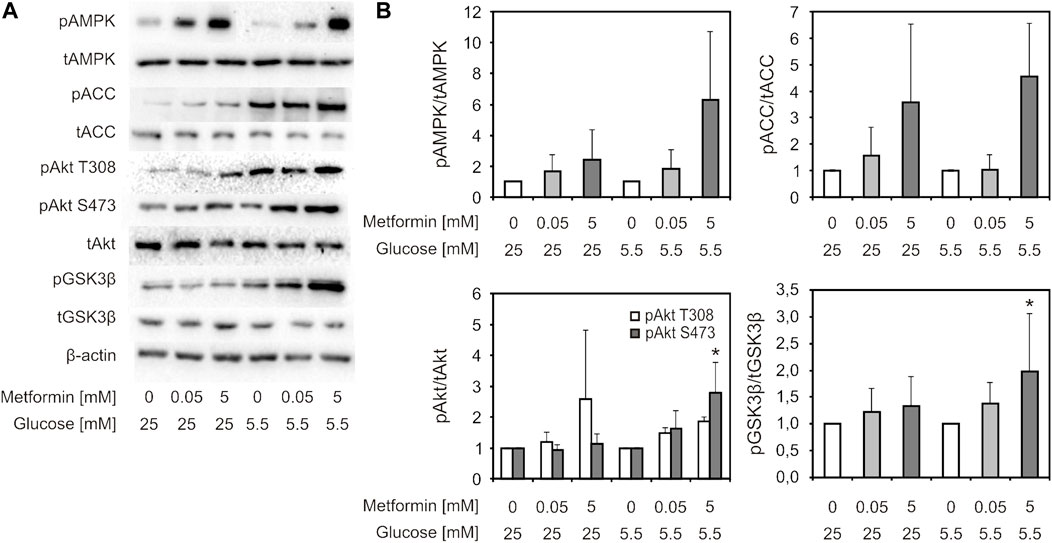
FIGURE 5. AMPK and Akt signaling pathways were activated by suprapharmacological, but not therapeutic metformin concentration. C2C12 cells were treated with 50 µM or 5 mM metformin for 24 h. Representative immunoblot analysis of proteins of interest—phosphorylated and total forms (pAMPK Thr172, AMPK, pAkt Ser473, pAkt Thr308, Akt, pGSK3β Ser9, GSK3β, pACC Ser79, ACC, β-actin) of one of three indipendent experiments with similar results (A). Densitometry data (B) is presented as fold change ±SD, compared to untreated control set to 1. Protein levels were normalised to β-actin, and phosphorylated protein levels were expressed relative to total protein level. *p < 0.05 compared to control, number of independent experiments n ≥ 3.
Discussion
We found that low concentrations of metformin, representative of the therapeutic concentration in vivo, have a different effect in muscle cells than the vastly studied millimolar concentrations. Micromolar metformin treatment failed to induce Complex I inhibition or AMPK activation. Additionally, glucose availability in cell medium slightly changed the cells’ response to higher metformin concentrations. Metformin had a more pronounced effect on Complex I inhibition, mitochondrial membrane depolarization and AMPK activation in cells cultured in low glucose medium, but cells cultured in high glucose medium were more prone to induction of ROS production.
Data on how metformin affects cell viability is scarce, and the majority of studies that explore mechanisms of metformin action fail to report if the investigated concentrations impact cell viability, even if these concentrations are quite high. Metformin has been shown to cause cell death in tumor cells (Wang Y. et al., 2018; Zhao et al., 2018; Teh et al., 2019), and some non-tumor cell lines (Wang X. et al., 2018; Deng and Ma, 2018), but also to counteract cytotoxic effects of other substances, like lipids and high glucose (Kim et al., 2010; Jadhav et al., 2013; Langer et al., 2016; Geng et al., 2020). According to our results, 24 h treatment with millimolar metformin concentrations caused a decrease in cell viability, which is another fact pointing to the questionable relevance of using high concentrations for exploring possible mechanisms behind metformin’s therapeutic effects. Complex I inhibition has been proposed as one of the mechanism behind the antineoplastic effect of metformin, and it has been shown that tumor cells are more prone to metformin-induced cell death when glucose-starved (Wheaton et al., 2014; Samuel et al., 2017). As metformin has been shown to decrease ATP production (El-Mir et al., 2000; Griss et al., 2015), low glucose concentration in cell medium would render the cells less capable to compensate for this, and thus more sensitive to metformin-induced cell death. Considering this, we hypothesized that C2C12 cells grown in LG medium are more sensitive to cytotoxic effects of metformin. Nevertheless, a more pronounced decrease in cell viability in cells grown in LG medium was observed only in MTT assay.
In the majority of in vitro studies that showed metformin inhibiting mitochondrial Complex I (using respirometry or isolated Complex I activity measurement) suprapharmacological, millimolar concentrations were applied (El-Mir et al., 2000; Owen et al., 2000; Carvalho et al., 2008; Bridges et al., 2014; Pecinova et al., 2017), which are significantly higher than plasma concentrations in patients on oral therapy (0.4–30 µM) (Christensen et al., 2011) and experimental animals (Wilcock et al., 1991). The rationale for using high metformin concentrations in vitro is the assumed accumulation of positively charged metformin molecules in the mitochondrial matrix, which could, due to mitochondrial membrane potential, occur in a therapeutic setting (Owen et al., 2000; Bridges et al., 2014). According to metformin pharmacodynamics and the fact that, to this day a transporter on the inner mitochondrial membrane that would allow this hydrophilic molecule to enter the matrix has not been identified, this hypothesis seems unlikely (Glossmann and Lutz, 2019). Also, by measuring radio-labelled metformin in different cellular fractions (Detaille et al., 2002; Wang et al., 2019) it was not possible to detect a significant enough accumulation in mitochondria. Some recent studies in hepatocytes and cardiomyocytes reveal the biphasic nature of metformin action, with high concentrations inhibiting mitochondrial respiration, and low concentrations exerting different effects or even increasing mitochondrial respiratory function (Alshawi and Agius, 2019; Wang et al., 2019; Emelyanova et al., 2021). As for in vivo studies, metformin therapy in experimental animals and humans has been shown by some to decrease mitochondrial respiration (Wessels et al., 2014), while others claim that metformin had no effect on mitochondrial respiration of skeletal muscle measured ex vivo (Owen et al., 2000; Larsen et al., 2012).
One of the hallmark papers on the topic (El-Mir et al., 2000) claims that metformin (in millimolar concentrations) caused inhibition of Complex I respiratory activity in intact liver cells, but not in isolated mitochondria and permeabilized cells, explaining this difference by the activation of a yet unknown signaling pathway causing Complex I inhibition. Another paper published the same year (Owen et al., 2000) showed that even micromolar metformin treatment (24 and 60 h) of rat hepatoma cells caused a decrease in Complex I-linked respiration. Respiration of isolated mitochondria and sub-mitochondrial particles (SMPs) was also inhibited by short treatments of millimolar metformin, with SMPs requiring much higher concentrations in order to cause inhibition. This difference in IC50 values is explained by accumulation of metformin inside the mitochondria. Considering this hypothesis, our experimental setting should allow for metformin to accumulate and reach concentrations sufficient for Complex I inhibition. However, this was not observed, as mitochondrial respiration was unaltered after 24-h and even 5-day 50 µM metformin treatment. One commentary article (Fontaine, 2014) indicates that the different interpretation of similar results in these two papers is due to different measured respiratory states—while one group performed all measurements in OXPHOS state (state 3) (Owen et al., 2000), the other measured respiration in LEAK state (state 4) (El-Mir et al., 2000), in experiments where they did not observe inhibition of respiration in either permeabilized cells or isolated mitochondria. The paper states that, according to previous work on biguanides, metformin-induced inhibition of respiration is observed in OXPHOS state, but is not as evident in LEAK or ET. The fact that O2 flux remained unaltered by metformin in ET (uncoupled) state is explained by the previously mentioned assumption that metformin accumulates inside polarized mitochondria, and that dissipation of membrane potential by an uncoupler would attenuate metformin accumulation and subsequent Complex I inhibition. To the best of our knowledge, no explanation for why metformin would not exert its effects in LEAK state was offered so far. According to our data on respiration of permeabilized cells, 5 mM metformin decreased OXPHOS but not LEAK respiration (ET was not measured). On the other hand, 5 mM metformin caused a decrease in all three measured respiratory states in living cells (ROUTINE, LEAK, ET), contradictory to the previously discussed hypothesis. It is important to note that these LEAK states are not identical—in permeabilized cells LEAK state is measured in absence of ADP [as in the discussed publication (El-Mir et al., 2000)], and in living cells by adding the ATP-synthase inhibitor oligomycin. This underlines the significance of standardization of protocols for respirometry, as using different experimental conditions and nomenclature makes it difficult to reproduce and compare published data.
Metformin has been shown to increase ROS production in isolated mitochondria, when using extremely high concentrations (>25 mM) (Bridges et al., 2014; Pecinova et al., 2017). On the other hand, metformin has been shown to decrease ROS production (Emelyanova et al., 2021) or return it to control levels in animal and cell models of diabetes and ischemia (Kane et al., 2010; Mohsin et al., 2019; Liu et al., 2020). Our results show an increase in ROS and superoxide production caused by 5 mM metformin, which was only present in HG medium for total ROS and more pronounced in said medium for superoxide. Also, total ROS production was higher in HG when compared to LG cells, independently of metformin. It is known that hyperglycemia causes oxidative stress in many tissues (Fiorentino et al., 2013; Luc et al., 2019), resulting in diabetes complications, but so-called glucotoxicity has not been extensively studied in skeletal muscle. The link between Complex I inhibition and ROS production (both induced by 5 mM metformin in our experiments) is not clear-cut, as Complex I inhibition can result in both an increase and a decrease in ROS production, depending on the conditions (Scialò et al., 2017). While not in accordance with some of the previously published data (Wheaton et al., 2014; Wang et al., 2019), our results show mitochondrial membrane depolarization by high concentrations of metformin. This is to be expected as a consequence of Complex I inhibition, as previously shown for metformin (Carvalho et al., 2008), as well as rotenone, a typical Complex I inhibitor (Xiong et al., 2013; Hong et al., 2014; Fortalezas et al., 2018). This result, along with the decrease of respiration in uncoupled ET state, contradicts the statement that metformin-induced Complex I inhibition is specific for polarised mitochondria. Metformin has been previously shown to alter processes of mitochondrial dynamics (Terada et al., 2002; Zong et al., 2002; Krogh et al., 2016; Wang et al., 2019; Crocker et al., 2020). However, our data from flow cytometry and citrate synthase activity show that metformin did not cause changes in mitochondrial content, in accordance to some of the previously published results (Wessels et al., 2014).
Activation of AMPK is the most well studied and universally accepted mechanism of metformin action, and it has been shown in skeletal muscle in numerous in vivo (Musi et al., 2002; Sajan et al., 2010), as well as in vitro studies using millimolar metformin treatment (Kalender et al., 2010; Sajan et al., 2010; Chen et al., 2011; Ouyang et al., 2011). Only a small number of in vitro studies on hepatocytes obtained similar results with therapeutic metformin concentrations (Zhou et al., 2001; Wang et al., 2019). Metformin in micromolar concentrations failed to induce AMPK activation in C2C12 cells (Bruckbauer and Zemel, 2013). Insulin signaling pathway activation by metformin was observed in some studies (Fantus and Brosseau, 1986; Kumar and Dey, 2002; Gunton et al., 2003), but not in others (Kim et al., 2002; Miller et al., 2013). Metformin was mostly studied in context of reversing the effects of insulin resistance on the insulin signaling pathway (Wu et al., 2015; Zhou et al., 2016; Zabielski et al., 2017; Bradley et al., 2019). These two pathways respond to opposite cues - AMPK is activated when nutrients are deficient and PI3K/Akt when they are abundant. On the other hand, they lead to some converging effects, especially in skeletal muscle, where both induce glucose uptake and GLUT4 exocytosis (Towler and Hardie, 2007). These pathways are typically reciprocally regulated by inhibiting one-another (Hahn-Windgassen et al., 2005; Towler and Hardie, 2007; Salminen et al., 2016), but there is a growing body of evidence suggesting this interaction is more complex than previously assumed, with many examples of AMPK activating the insulin signaling pathway (Bertrand et al., 2006; Leclerc et al., 2010; Tao et al., 2010). How metformin fits into this interaction is not well studied—in cancer cells metformin has been shown to cause cell death by activating AMPK and thus inhibiting Akt (Wang Y. et al., 2018; Lu et al., 2019; Chen et al., 2021), but data in non-tumor cells is scarce (Kovacic et al., 2003). Studying the effects of metformin treatment on these two pathways using pharmacological or genetic modulation of their activity presents a promising future research perspective. By measuring protein phosphorylation levels, we observed that AMPK and PI3K/Akt pathways were both activated only by millimolar metformin concentrations, more so in LG medium. Both pathways having a stronger response to metformin activation in LG medium can be explained by low glucose concentration inducing AMPK activation independently of metformin (Salt et al., 1998), and high glucose concentrations (which lead to insulin resistance) inhibiting the activity of the insulin signaling pathway (Huang et al., 2002; Samuel and Shulman, 2016). According to some authors, by inhibiting mitochondrial respiratory function, metformin causes a decrease in ATP production and a subsequent change in cell energy status (ADP/ATP and AMP/ATP ratios), which leads to AMPK activation (Stephenne et al., 2011), while others claim that AMPK activation by metformin is independent of Complex I inhibition (Ouyang et al., 2011). Our results show that millimolar metformin concentrations caused both Complex I inhibition and AMPK activation, while therapeutic concentrations caused none of these effects. The overall mechanisms behind metformin-induced AMPK activation in skeletal muscle are still insufficiently elucidated and are currently being investigated in our lab.
Effects of therapeutic metformin concentrations on energy metabolism have recently been extensively studied in liver cells—changes in energy and redox status, allosteric regulation of metabolic pathway enzymes (Gui et al., 2017; Cameron et al., 2018; Alshawi and Agius, 2019) and inhibition of glycerol-3-phosphate dehydrogenase (Madiraju et al., 2014, 2018; Thakur et al., 2018) may have replaced Complex I inhibition as a central mechanism of metformin action. These mechanisms have not been studied in skeletal muscle, as it has been sidetracked and considered not as important for the therapeutic effects of metformin. As a metabolically highly active tissue that plays an important role in glycemia regulation, and with peripheral insulin resistance arising before hepatic (Hales, 1994), studying the effects of metformin on skeletal muscle is important for diabetes treatment and prevention strategies (eg., pharmacological therapy in prediabetes).
In conclusion, our results show that therapeutic metformin concentrations lead to different effects compared to widely used millimolar concentrations—they did not cause the previously described effects on mitochondrial respiration and AMPK signaling. Even though suprapharmacological metformin concentrations were shown to cause Complex I inhibition and AMPK activation in skeletal muscle cells in vitro, therapeutic concentrations did not induce such an effect. This raises the question if these mechanisms are relevant for therapeutic effects of metformin in skeletal muscle.
Data Availability Statement
The raw data supporting the conclusions of this article will be made available by the authors, without undue reservation.
Author Contributions
KP, AI, and NK conceived and designed the study. KP and TI performed the experiments, collected the data and performed the analysis. AI performed the flow cytometry measurements and helped with data analysis. KP wrote the paper. IM, NL, AI, and TI helped with editing and proofreading the manuscript.
Funding
This work was supported by the Ministry of Education, Science and Technological Development, Republic of Serbia (grant number 451-03-68/2022-14/200110).
Conflict of Interest
The authors declare that the research was conducted in the absence of any commercial or financial relationships that could be construed as a potential conflict of interest.
Publisher’s Note
All claims expressed in this article are solely those of the authors and do not necessarily represent those of their affiliated organizations, or those of the publisher, the editors and the reviewers. Any product that may be evaluated in this article, or claim that may be made by its manufacturer, is not guaranteed or endorsed by the publisher.
Supplementary Material
The Supplementary Material for this article can be found online at: https://www.frontiersin.org/articles/10.3389/fphar.2022.930308/full#supplementary-material
Supplementary Figure S1 | C2C12 cells were treated with metformin (50 and 5 mM) by adding the treatment directly to the instrument chamber and mitochondrial respiration of permeabilized cells was measured by high-resolution respirometry. Results for ROUTINE (A), LEAK (B), OXPHOS-N (C) and OXPHOS-S (D) respiratory states, all corrected for ROX, from 3 to 5 independent experiments are presented as scatter plots, with mean ± SD, *p<0.05. OXPHOS-N—NADH-linked oxidative phosphorylation capacity, OXPHOS-S—succinate-linked oxidative phosphorylation capacity.
References
Alshawi, A., and Agius, L. (2019). Low Metformin Causes a More Oxidized Mitochondrial NADH/NAD Redox State in Hepatocytes and Inhibits Gluconeogenesis by a Redox-independent Mechanism. J. Biol. Chem. 294, 2839–2853. doi:10.1074/jbc.RA118.006670
American Diabetes Association (2022). 9. Pharmacologic Approaches to Glycemic Treatment: Standards of Medical Care in Diabetes-2022. Diabetes Care 45, S125–S143. doi:10.2337/dc22-S009
Bertrand, L., Ginion, A., Beauloye, C., Hebert, A. D., Guigas, B., Hue, L., et al. (2006). AMPK Activation Restores the Stimulation of Glucose Uptake in an In Vitro Model of Insulin-Resistant Cardiomyocytes via the Activation of Protein Kinase B. Am. J. Physiol. Heart Circ. Physiol. 291, H239–H250. doi:10.1152/ajpheart.01269.2005
Bradley, E. A., Premilovac, D., Betik, A. C., Hu, D., Attrill, E., Richards, S. M., et al. (2019). Metformin Improves Vascular and Metabolic Insulin Action in Insulin-Resistant Muscle. J. Endocrinol. 243, 85–96. doi:10.1530/JOE-19-0067
Bridges, H. R., Jones, A. J., Pollak, M. N., and Hirst, J. (2014). Effects of Metformin and Other Biguanides on Oxidative Phosphorylation in Mitochondria. Biochem. J. 462, 475–487. doi:10.1042/BJ20140620
Bruckbauer, A., and Zemel, M. B. (2013). Synergistic Effects of Metformin, Resveratrol, and Hydroxymethylbutyrate on Insulin Sensitivity. Diabetes Metab. Syndr. Obes. 6, 93–102. doi:10.2147/DMSO.S40840
Cameron, A. R., Logie, L., Patel, K., Erhardt, S., Bacon, S., Middleton, P., et al. (2018). Metformin Selectively Targets Redox Control of Complex I Energy Transduction. Redox Biol. 14, 187–197. doi:10.1016/j.redox.2017.08.018
Carvalho, C., Correia, S., Santos, M. S., Seiça, R., Oliveira, C. R., and Moreira, P. I. (2008). Metformin Promotes Isolated Rat Liver Mitochondria Impairment. Mol. Cell. Biochem. 308, 75–83. doi:10.1007/s11010-007-9614-3
Chen, C. T., Chen, W., Chung, H. H., Cheng, K. C., Yeh, C. H., and Cheng, J. T. (2011). Activation of Imidazoline I-2B Receptor by Metformin to Increase Glucose Uptake in Skeletal Muscle. Horm. Metab. Res. 43, 708–713. doi:10.1055/s-0031-1286259
Chen, Y. H., Yang, S. F., Yang, C. K., Tsai, H. D., Chen, T. H., Chou, M. C., et al. (2021). Metformin Induces Apoptosis and Inhibits Migration by Activating the AMPK/p53 axis and Suppressing PI3K/AKT Signaling in Human Cervical Cancer Cells. Mol. Med. Rep. 23, 1–11. doi:10.3892/mmr.2020.11725
Christensen, M. M., Brasch-Andersen, C., Green, H., Nielsen, F., Damkier, P., Beck-Nielsen, H., et al. (2011). The Pharmacogenetics of Metformin and its Impact on Plasma Metformin Steady-State Levels and Glycosylated Hemoglobin A1c. Pharmacogenet. Genomics 21, 837–850. doi:10.1097/FPC.0b013e32834c0010
Crocker, C. L., Baumgarner, B. L., and Kinsey, S. T. (2020). β-Guanidinopropionic Acid and Metformin Differentially Impact Autophagy, Mitochondria and Cellular Morphology in Developing C2C12 Muscle Cells. J. Muscle Res. Cell Motil. 41, 221–237. doi:10.1007/s10974-019-09568-0
de Kok, M. J. C., Schaapherder, A. F., Wüst, R. C. I., Zuiderwijk, M., Bakker, J. A., Lindeman, J. H. N., et al. (2021). Circumventing the Crabtree Effect in Cell Culture: A Systematic Review. Mitochondrion 59, 83–95. doi:10.1016/j.mito.2021.03.014
Deng, Y., and Ma, W. (2018). Metformin Inhibits HaCaT Cell Viability via the miR-21/PTEN/Akt Signaling Pathway. Mol. Med. Rep. 17, 4062–4066. doi:10.3892/mmr.2017.8364
Detaille, D., Guigas, B., Leverve, X., Wiernsperger, N., and Devos, P. (2002). Obligatory Role of Membrane Events in the Regulatory Effect of Metformin on the Respiratory Chain Function. Biochem. Pharmacol. 63, 1259–1272. doi:10.1016/S0006-2952(02)00858-4
Diabetes Prevention Program Research Group (2012). Long-term Safety, Tolerability, and Weight Loss Associated with Metformin in the Diabetes Prevention Program Outcomes Study. Diabetes Care 35, 731–737. doi:10.2337/dc11-1299
Doerrier, C., Garcia-Souza, L. F., Krumschnabel, G., Wohlfarter, Y., Mészáros, A. T., and Gnaiger, E. (2018). High-resolution Fluorespirometry and Oxphos Protocols for Human Cells, Permeabilized Fibers from Small Biopsies of Muscle, and Isolated Mitochondria. Methods Mol. Biol. 1782, 31–70. doi:10.1007/978-1-4939-7831-1_3
Eigentler, A. (2020). Oroboros Instruments High-Resolution Respirometry Oroboros Protocols Enzymes Laboratory Protocol: Citrate Synthase a Mitochondrial Marker Enzyme. Mitochondrial Physiol. Netw. 17, 1–12. Available at: https://wiki.oroboros.at/images/4/40/MiPNet17.04_CitrateSynthase.pdf.
El-Mir, M. Y., Nogueira, V., Fontaine, E., Avéret, N., Rigoulet, M., and Leverve, X. (2000). Dimethylbiguanide Inhibits Cell Respiration via an Indirect Effect Targeted on the Respiratory Chain Complex I. J. Biol. Chem. 275, 223–228. doi:10.1074/jbc.275.1.223
Elkalaf, M., Anděl, M., and Trnka, J. (2013). Low Glucose but Not Galactose Enhances Oxidative Mitochondrial Metabolism in C2C12 Myoblasts and Myotubes. PLoS One 8, e70772–9. doi:10.1371/journal.pone.0070772
Emelyanova, L., Bai, X., Yan, Y., Bosnjak, Z. J., Kress, D., Warner, C., et al. (2021). Biphasic Effect of Metformin on Human Cardiac Energetics. Transl. Res. 229, 5–23. doi:10.1016/j.trsl.2020.10.002
Fantus, I. G., and Brosseau, R. (1986). Mechanism of Action of Metformin: Insulin Receptor and Postreceptor Effects In Vitro and In Vivo. J. Clin. Endocrinol. Metab. 63, 898–905. doi:10.1210/jcem-63-4-898
Fiorentino, T. V., Prioletta, A., Zuo, P., and Folli, F. (2013). Hyperglycemia-induced Oxidative Stress and its Role in Diabetes Mellitus Related Cardiovascular Diseases. Curr. Pharm. Des. 19, 5695–5703. doi:10.2174/1381612811319320005
Fontaine, E. (2014). Metformin and Respiratory Chain Complex I: The Last Piece of the Puzzle? Biochem. J. 463, e3–5. doi:10.1042/BJ20141020
Fontaine, E. (2018). Metformin-induced Mitochondrial Complex I Inhibition: Facts, Uncertainties, and Consequences. Front. Endocrinol. (Lausanne) 9, 753. doi:10.3389/fendo.2018.00753
Fortalezas, S., Marques-da-Silva, D., and Gutierrez-Merino, C. (2018). Creatine Protects against Cytosolic Calcium Dysregulation, Mitochondrial Depolarization and Increase of Reactive Oxygen Species Production in Rotenone-Induced Cell Death of Cerebellar Granule Neurons. Neurotox. Res. 34, 717–732. doi:10.1007/s12640-018-9940-0
Geng, Y., Hernández Villanueva, A., Oun, A., Buist-Homan, M., Blokzijl, H., Faber, K. N., et al. (2020). Protective Effect of Metformin against Palmitate-Induced Hepatic Cell Death. Biochim. Biophys. Acta Mol. Basis Dis. 1866, 165621. doi:10.1016/j.bbadis.2019.165621
Giannarelli, R., Aragona, M., Coppelli, A., and Del Prato, S. (2003). Reducing Insulin Resistance with Metformin: The Evidence Today. Diabetes Metab. 29, 6S28–35. doi:10.1016/s1262-3636(03)72785-2
Glossmann, H. H., and Lutz, O. M. D. (2019). Pharmacology of Metformin - an Update. Eur. J. Pharmacol. 865, 172782. doi:10.1016/j.ejphar.2019.172782
Griss, T., Vincent, E. E., Egnatchik, R., Chen, J., Ma, E. H., Faubert, B., et al. (2015). Metformin Antagonizes Cancer Cell Proliferation by Suppressing Mitochondrial-Dependent Biosynthesis. PLoS Biol. 13, e1002309. doi:10.1371/journal.pbio.1002309
Gui, D. Y., Sullivan, L. B., Luengo, A., Hosios, A. M., Bush, L. N., Gitego, N., et al. (2017). Environment Dictates Dependence on Mitochondrial Complex I for NAD+ and Aspartate Production and Determines Cancer Cell Sensitivity to Metformin. Cell Metab. 24, 716–727. doi:10.1016/j.cmet.2016.09.006.Environment
Gunton, J. E., Delhanty, P. J., Takahashi, S., and Baxter, R. C. (2003). Metformin Rapidly Increases Insulin Receptor Activation in Human Liver and Signals Preferentially through Insulin-Receptor Substrate-2. J. Clin. Endocrinol. Metab. 88, 1323–1332. doi:10.1210/jc.2002-021394
Hahn-Windgassen, A., Nogueira, V., Chen, C. C., Skeen, J. E., Sonenberg, N., and Hay, N. (2005). Akt Activates the Mammalian Target of Rapamycin by Regulating Cellular ATP Level and AMPK Activity. J. Biol. Chem. 280, 32081–32089. doi:10.1074/jbc.M502876200
Hong, Y., Nie, H., Wu, D., Wei, X., Ding, X., and Ying, W. (2014). NAD(+) Treatment Prevents Rotenone-Induced Apoptosis and Necrosis of Differentiated PC12 Cells. Neurosci. Lett. 560, 46–50. doi:10.1016/j.neulet.2013.11.039
Huang, C., Somwar, R., Patel, N., Niu, W., Török, D., and Klip, A. (2002). Sustained Exposure of L6 Myotubes to High Glucose and Insulin Decreases Insulin-Stimulated GLUT4 Translocation but Upregulates GLUT4 Activity. Diabetes 51, 2090–2098. doi:10.2337/diabetes.51.7.2090
Inzucchi, S. E., Maggs, D. G., Spollett, G. R., Page, S. L., Rife, F. S., Walton, V., et al. (1998). Efficacy and Metabolic Effects of Metformin and Troglitazone in Type II Diabetes Mellitus. N. Engl. J. Med. 338, 867–872. doi:10.1056/NEJM199803263381303
Jadhav, K. S., Dungan, C. M., and Williamson, D. L. (2013). Metformin Limits Ceramide-Induced Senescence in C2C12 Myoblasts. Mech. Ageing Dev. 134, 548–559. doi:10.1016/j.mad.2013.11.002
Kalender, A., Selvaraj, A., Kim, S. Y., Gulati, P., Brûlé, S., Viollet, B., et al. (2010). Metformin, Independent of AMPK, Inhibits mTORC1 in a Rag GTPase-dependent Manner. Cell Metab. 11, 390–401. doi:10.1016/j.cmet.2010.03.014
Kane, D. A., Anderson, E. J., Price, J. W., Woodlief, T. L., Lin, C. T., Bikman, B. T., et al. (2010). Metformin Selectively Attenuates Mitochondrial H2O2 Emission without Affecting Respiratory Capacity in Skeletal Muscle of Obese Rats. Free Radic. Biol. Med. 49, 1082–1087. doi:10.1016/j.freeradbiomed.2010.06.022
Kim, D. S., Jeong, S. K., Kim, H. R., Kim, D. S., Chae, S. W., and Chae, H. J. (2010). Metformin Regulates Palmitate-Induced Apoptosis and ER Stress Response in HepG2 Liver Cells. Immunopharmacol. Immunotoxicol. 32, 251–257. doi:10.3109/08923970903252220
Kim, Y. B., Ciaraldi, T. P., Kong, A., Kim, D., Chu, N., Mohideen, P., et al. (2002). Troglitazone but Not Metformin Restores Insulin-Stimulated Phosphoinositide 3-kinase Activity and Increases P110beta Protein Levels in Skeletal Muscle of Type 2 Diabetic Subjects. Diabetes 51, 443–448. doi:10.2337/diabetes.51.2.443
Kovacic, S., Soltys, C. L., Barr, A. J., Shiojima, I., Walsh, K., and Dyck, J. R. (2003). Akt Activity Negatively Regulates Phosphorylation of AMP-Activated Protein Kinase in the Heart. J. Biol. Chem. 278, 39422–39427. doi:10.1074/jbc.M305371200
Krogh, A., Larsson, B., Sonnhammer, E. L., Campos, G. E., Neto, H. S., Marques, M. J., et al. (20162016). AMPK Mediates Mitochondrial Fission in Response to Energy. stress_Science 351, 275–282.
Kumar, N., and Dey, C. S. (2002). Metformin Enhances Insulin Signalling in Insulin-dependent And-independent Pathways in Insulin Resistant Muscle Cells. Br. J. Pharmacol. 137, 329–336. doi:10.1038/sj.bjp.0704878
Langer, S., Kreutz, R., and Eisenreich, A. (2016). Metformin Modulates Apoptosis and Cell Signaling of Human Podocytes under High Glucose Conditions. J. Nephrol. 29, 765–773. doi:10.1007/s40620-015-0258-1
Larsen, S., Rabøl, R., Hansen, C. N., Madsbad, S., Helge, J. W., and Dela, F. (2012). Metformin-treated Patients with Type 2 Diabetes Have Normal Mitochondrial Complex I Respiration. Diabetologia 55, 443–449. doi:10.1007/s00125-011-2340-0
Leclerc, G. M., Leclerc, G. J., Fu, G., and Barredo, J. C. (2010). AMPK-Induced Activation of Akt by AICAR Is Mediated by IGF-1R Dependent and Independent Mechanisms in Acute Lymphoblastic Leukemia. J. Mol. Signal. 5, 15–13. doi:10.1186/1750-2187-5-15
Liu, X. D., Li, Y. G., Wang, G. Y., Bi, Y. G., Zhao, Y., Yan, M. L., et al. (2020). Metformin Protects High Glucose-cultured C-ardiomyocytes from O-xidative S-tress by P-romoting NDUFA13 E-xpression and M-itochondrial B-iogenesis via the AMPK S-ignaling P-athway. Mol. Med. Rep. 22, 5262–5270. doi:10.3892/mmr.2020.11599
Lu, C. C., Chiang, J. H., Tsai, F. J., Hsu, Y. M., Juan, Y. N., Yang, J. S., et al. (2019). Metformin Triggers the Intrinsic Apoptotic Response in Human AGS Gastric Adenocarcinoma Cells by Activating AMPK and Suppressing mTOR/AKT Signaling. Int. J. Oncol. 54, 1271–1281. doi:10.3892/ijo.2019.4704
Luc, K., Schramm-Luc, A., Guzik, T. J., and Mikolajczyk, T. P. (2019). Oxidative Stress and Inflammatory Markers in Prediabetes and Diabetes. J. Physiol. Pharmacol. 70, 809–824. doi:10.26402/jpp.2019.6.01
Madiraju, A. K., Erion, D. M., Rahimi, Y., Zhang, X. M., Braddock, D. T., Albright, R. A., et al. (2014). Metformin Suppresses Gluconeogenesis by Inhibiting Mitochondrial Glycerophosphate Dehydrogenase. Nature 510, 542–546. doi:10.1038/nature13270.Metformin
Madiraju, A. K., Qiu, Y., Perry, R. J., Rahimi, Y., Zhang, X. M., Zhang, D., et al. (2018). Metformin Inhibits Gluconeogenesis via a Redox-dependent Mechanism In Vivo. Nat. Med. 24, 1384–1394. doi:10.1038/s41591-018-0125-4
Marroquin, L. D., Hynes, J., Dykens, J. A., Jamieson, J. D., and Will, Y. (2007). Circumventing the Crabtree Effect: Replacing Media Glucose with Galactose Increases Susceptibility of hepG2 Cells to Mitochondrial Toxicants. Toxicol. Sci. 97, 539–547. doi:10.1093/toxsci/kfm052
Miller, R. A., Chu, Q., Xie, J., Foretz, M., Viollet, B., and Birnbaum, M. J. (2013). Biguanides Suppress Hepatic Glucagon Signalling by Decreasing Production of Cyclic AMP. Nature 494, 256–260. doi:10.1038/nature11808.Biguanides
Mohsin, A. A., Chen, Q., Quan, N., Rousselle, T., Maceyka, M. W., Samidurai, A., et al. (2019). Mitochondrial Complex I Inhibition by Metformin Limits Reperfusion Injury. J. Pharmacol. Exp. Ther. 369, 282–290. doi:10.1124/jpet.118.254300
Musi, N., Hirshman, M. F., Nygren, J., Svanfeldt, M., Bavenholm, P., Rooyackers, O., et al. (2002). Metformin Increases AMP-Activated Protein Kinase Activity in Skeletal Muscle of Subjects with Type 2 Diabetes. Diabetes 51, 2074–2081. doi:10.2337/diabetes.51.7.2074
Ouyang, J., Parakhia, R. A., and Ochs, R. S. (2011). Metformin Activates AMP Kinase through Inhibition of AMP Deaminase. J. Biol. Chem. 286, 1–11. doi:10.1074/jbc.M110.121806
Owen, M. R., Doran, E., and Halestrap, A. P. (2000). Evidence that Metformin Exerts its Anti-diabetic Effects through Inhibition of Complex 1 of the Mitochondrial Respiratory Chain. Biochem. J. 348 Pt 3, 607–614. doi:10.1042/bj3480607
Pecinova, A., Drahota, Z., Kovalcikova, J., Kovarova, N., Pecina, P., Alan, L., et al. (20172017). Pleiotropic Effects of Biguanides on Mitochondrial Reactive Oxygen Species Production. Oxidative Med. Cell. Longev. 2017, 1–11. doi:10.1155/2017/7038603
Phielix, E., Szendroedi, J., and Roden, M. (2011). The Role of Metformin and Thiazolidinediones in the Regulation of Hepatic Glucose Metabolism and its Clinical Impact. Trends Pharmacol. Sci. 32, 607–616. doi:10.1016/j.tips.2011.06.006
Sajan, M. P., Bandyopadhyay, G., Miura, A., Standaert, M. L., Nimal, S., Longnus, S. L., et al. (2010). AICAR and Metformin, but Not Exercise, Increase Muscle Glucose Transport through AMPK-, ERK-, and PDK1-dependent Activation of Atypical PKC. Am. J. Physiol. Endocrinol. Metab. 298, E179–E192. doi:10.1152/ajpendo.00392.2009
Salminen, A., Kaarniranta, K., and Kauppinen, A. (2016). Age-related Changes in AMPK Activation: Role for AMPK Phosphatases and Inhibitory Phosphorylation by Upstream Signaling Pathways. Ageing Res. Rev. 28, 15–26. doi:10.1016/j.arr.2016.04.003
Salt, I. P., Johnson, G., Ashcroft, S. J., and Hardie, D. G. (1998). AMP-Activated Protein Kinase Is Activated by Low Glucose in Cell Lines Derived from Pancreatic Beta Cells, and May Regulate Insulin Release. Biochem. J. 335, 533–539. doi:10.1042/bj3350533
Samuel, S. M., Ghosh, S., Majeed, Y., Arunachalam, G., Emara, M. M., Ding, H., et al. (2017). Metformin Represses Glucose Starvation Induced Autophagic Response in Microvascular Endothelial Cells and Promotes Cell Death. Biochem. Pharmacol. 132, 118–132. doi:10.1016/j.bcp.2017.03.001
Samuel, V. T., and Shulman, G. I. (2016). The Pathogenesis of Insulin Resistance: Integrating Signaling Pathways and Substrate Flux. J. Clin. Invest. 126, 12–22. doi:10.1172/JCI77812
Scialò, F., Fernández-Ayala, D. J., and Sanz, A. (2017). Role of Mitochondrial Reverse Electron Transport in ROS Signaling: Potential Roles in Health and Disease. Front. Physiol. 8, 1–7. doi:10.3389/fphys.2017.00428
Siengdee, P., Trakooljul, N., Murani, E., Schwerin, M., Wimmers, K., and Ponsuksili, S. (2015). MicroRNAs Regulate Cellular ATP Levels by Targeting Mitochondrial Energy Metabolism Genes during C2C12 Myoblast Differentiation. PLoS One 10, e0127850. doi:10.1371/journal.pone.0127850
Stephenne, X., Foretz, M., Taleux, N., Van Der Zon, G. C., Sokal, E., Hue, L., et al. (2011). Metformin Activates AMP-Activated Protein Kinase in Primary Human Hepatocytes by Decreasing Cellular Energy Status. Diabetologia 54, 3101–3110. doi:10.1007/s00125-011-2311-5
Tao, R., Gong, J., Luo, X., Zang, M., Guo, W., Wen, R., et al. (2010). AMPK Exerts Dual Regulatory Effects on the PI3K Pathway. J. Mol. Signal. 5, 1–9. doi:10.1186/1750-2187-5-1
Teh, J. T., Zhu, W. L., Newgard, C. B., Casey, P. J., and Wang, M. (2019). Respiratory Capacity and Reserve Predict Cell Sensitivity to Mitochondria Inhibitors: Mechanism-Based Markers to Identify Metformin-Responsive Cancers. Mol. Cancer Ther. 18, 693–705. doi:10.1158/1535-7163.MCT-18-0766
Terada, S., Goto, M., Kato, M., Kawanaka, K., Shimokawa, T., and Tabata, I. (2002). Effects of Low-Intensity Prolonged Exercise on PGC-1 mRNA Expression in Rat Epitrochlearis Muscle. Biochem. Biophys. Res. Commun. 296, 350–354. doi:10.1016/S0006-291X(02)00881-1
Thakur, S., Daley, B., Gaskins, K., Vasko, V. V., Boufraqech, M., Patel, D., et al. (2018). Metformin Targets Mitochondrial Glycerophosphate Dehydrogenase to Control Rate of Oxidative Phosphorylation and Growth of Thyroid Cancer In Vitro and In Vivo. Clin. Cancer Res. 24, 4030–4043. doi:10.1158/1078-0432.CCR-17-3167
Towler, M. C., and Hardie, D. G. (2007). AMP-Activated Protein Kinase in Metabolic Control and Insulin Signaling. Circ. Res. 100, 328–341. doi:10.1161/01.RES.0000256090.42690.05
Vial, G., Detaille, D., and Guigas, B. (2019). Role of Mitochondria in the Mechanism(s) of Action of Metformin. Front. Endocrinol. (Lausanne) 10, 294. doi:10.3389/fendo.2019.00294
Wang, X., Li, R., Zhao, X., Yu, X., and Sun, Q. (2018a). Metformin Promotes HaCaT Cell Apoptosis through Generation of Reactive Oxygen Species via Raf-1-ERK1/2-Nrf2 Inactivation. Inflammation 41, 948–958. doi:10.1007/s10753-018-0749-z
Wang, Y., An, H., Liu, T., Qin, C., Sesaki, H., Guo, S., et al. (2019). Metformin Improves Mitochondrial Respiratory Activity through Activation of AMPK. Cell Rep. 29, 1511–e5. doi:10.1016/j.celrep.2019.09.070
Wang, Y., Xu, W., Yan, Z., Zhao, W., Mi, J., Li, J., et al. (2018b). Metformin Induces Autophagy and G0/G1 Phase Cell Cycle Arrest in Myeloma by Targeting the AMPK/mTORC1 and mTORC2 Pathways. J. Exp. Clin. Cancer Res. 37, 63–12. doi:10.1186/s13046-018-0731-5
Wessels, B., Ciapaite, J., Van Den Broek, N. M., Nicolay, K., and Prompers, J. J. (2014). Metformin Impairs Mitochondrial Function in Skeletal Muscle of Both Lean and Diabetic Rats in a Dose-dependent Manner. PLoS One 9, e100525. doi:10.1371/journal.pone.0100525
Wheaton, W. W., Weinberg, S. E., Hamanaka, R. B., Soberanes, S., Sullivan, L. B., Anso, E., et al. (20142014). Metformin Inhibits Mitochondrial Complex I of Cancer Cells to Reduce Tumorigenesis. Elife 3, e02242–18. doi:10.7554/eLife.02242
Wilcock, C., Wyre, N. D., and Bailey, C. J. (1991). Subcellular Distribution of Metformin in Rat Liver. J. Pharm. Pharmacol. 43, 442–444. doi:10.1111/j.2042-7158.1991.tb03507.x
Wu, W., Tang, S., Shi, J., Yin, W., Cao, S., Bu, R., et al. (2015). Metformin Attenuates Palmitic Acid-Induced Insulin Resistance in L6 Cells through the AMP-Activated Protein Kinase/sterol Regulatory Element-Binding Protein-1c Pathway. Int. J. Mol. Med. 35, 1734–1740. doi:10.3892/ijmm.2015.2187
Xiong, Y., Qian, J., Xu, M., Qiu, J., Xia, J., Ma, R., et al. (2013). Effects of Low Concentrations of Rotenone upon Mitohormesis in SH-SY5Y Cells. Dose-Response 11, 270–280. doi:10.2203/dose-response.12-005
Zabielski, P., Chacinska, M., Charkiewicz, K., Baranowski, M., Gorski, J., and Blachnio-Zabielska, A. U. (2017). Effect of Metformin on Bioactive Lipid Metabolism in Insulin-Resistant Muscle. J. Endocrinol. 233, 329–340. doi:10.1530/JOE-16-0381
Zhao, Y., Sun, H., Feng, M., Zhao, J., Zhao, X., Wan, Q., et al. (2018). Metformin Is Associated with Reduced Cell Proliferation in Human Endometrial Cancer by Inbibiting PI3K/AKT/mTOR Signaling. Gynecol. Endocrinol. 34, 428–432. doi:10.1080/09513590.2017.1409714
Zhou, G., Myers, R., Li, Y., Chen, Y., Shen, X., Fenyk-Melody, J., et al. (2001). Role of AMP-Activated Protein Kinase in Mechanism of Metformin Action. J. Clin. Invest. 108, 1167–1174. doi:10.1172/JCI200113505.Introduction10.1172/JCI13505
Zhou, Z. Y., Ren, L. W., Zhan, P., Yang, H. Y., Chai, D. D., and Yu, Z. W. (2016). Metformin Exerts Glucose-Lowering Action in High-Fat Fed Mice via Attenuating Endotoxemia and Enhancing Insulin Signaling. Acta Pharmacol. Sin. 37, 1063–1075. doi:10.1038/aps.2016.21
Keywords: metformin, mitochondria, skeletal muscle, therapeutic concentration, respirometry
Citation: Pavlovic K, Krako Jakovljevic N, Isakovic AM, Ivanovic T, Markovic I and Lalic NM (2022) Therapeutic vs. Suprapharmacological Metformin Concentrations: Different Effects on Energy Metabolism and Mitochondrial Function in Skeletal Muscle Cells in vitro. Front. Pharmacol. 13:930308. doi: 10.3389/fphar.2022.930308
Received: 27 April 2022; Accepted: 16 June 2022;
Published: 06 July 2022.
Edited by:
Sergej Pirkmajer, University of Ljubljana, SloveniaReviewed by:
Natasa Nikolic, University of Oslo, NorwayTímea Komlódi, Semmelweis University, Hungary
Copyright © 2022 Pavlovic, Krako Jakovljevic, Isakovic, Ivanovic, Markovic and Lalic. This is an open-access article distributed under the terms of the Creative Commons Attribution License (CC BY). The use, distribution or reproduction in other forums is permitted, provided the original author(s) and the copyright owner(s) are credited and that the original publication in this journal is cited, in accordance with accepted academic practice. No use, distribution or reproduction is permitted which does not comply with these terms.
*Correspondence: Kasja Pavlovic, kasja.pavlovic@med.bg.ac.rs