 SiNi Li
 JianHe Li3
 YaMin Li
 XiaoMin Wan
- 1Clinical Nursing Teaching and Research Section, The Second Xiangya Hospital, Central South University, Changsha, China
- 2The Xiangya Nursing School, Central South University, Changsha, China
- 3Department of Pharmacy, The Second Xiangya Hospital, Central South University, Changsha, China
Background: Recent randomized controlled trials have demonstrated that immune checkpoint inhibitors (ICIs) improve patient outcomes, but whether these novel agents are cost-effective for untreated advanced renal cell carcinoma (aRCC) remains unclear.
Materials and Methods: A microsimulation model was created to project the healthcare costs and outcomes of six strategies (lenvatinib-plus-pembrolizumab, nivolumab-plus-cabozantinib, nivolumab-plus-ipilimumab, pembrolizumab-plus-axitinib, avelumab-plus-axitinib, and sunitinib monotherapy) for patients with aRCC. Transition probability of patients was estimated from CLEAR, CheckMate 9ER, CheckMate 214, KEYNOTE-426, JAVELIN Renal 101, and other data sets by using parametric survival modeling. Lifetime direct medical costs, life years (LYs), quality-adjusted LYs (QALYs), and incremental cost-effectiveness ratios (ICERs) were estimated from a United States payer perspective. One-way and probabilistic sensitivity analyses were performed, along with multiple scenario analyses, to evaluate model uncertainty.
Results: Of the six competing strategies, nivolumab-plus-cabozantinib yielded the most significant health outcomes, and the sunitinib strategy was the least expensive option. The cost-effective frontier consisted of the nivolumab-plus-cabozantinib, pembrolizumab-plus-axitinib, and sunitinib strategies, which displayed the ordered ICERs of $81282/QALY for pembrolizumab-plus-axitinib vs sunitinib and $453391/QALY for nivolumab-plus-cabozantinib vs pembrolizumab-plus-axitinib. The rest of the strategies, such as lenvatinib-plus-pembrolizumab, nivolumab-plus-ipilimumab, and avelumab-plus-axitinib, were dominated. The cost of sunitinib drove the model most influentially.
Conclusions: For aRCC, the pembrolizumab-plus-axitinib strategy is likely to be the most cost-effective alternative at the willingness-to-pay threshold of $100,000.
Introduction
Renal cell carcinoma (RCC) is the most common type of kidney cancer, with more than 73,000 cases diagnosed and 14,000 deaths in 2020 in the United States (Choueiri et al., 2015; National Cancer Institute, 2021). Advanced RCC (aRCC) accounts for the highest death rate among kidney cancers because this disease is usually asymptomatic at the initial stage; the 5-year relative survival rate for aRCC is only 11% (Fisher et al., 2013; Bhatt and Finelli, 2014; Amzal et al., 2017; Sarfaty et al., 2018).
Sunitinib, once the mainstay target drug for the treatment of aRCC, has been substituted by novel immune checkpoint inhibitor (ICI) agents on the basis of survival data reported in multiple previous studies. Recently, CheckMate 9ER, a large open-label phase three trial, compared nivolumab combined with cabozantinib with sunitinib in treatment-naïve patients with aRCC (Choueiri et al., 2021). In this study, nivolumab-plus-cabozantinib was associated with significantly longer overall survival (OS) and progression-free survival (PFS) than was sunitinib (Choueiri et al., 2021). The median PFS in the nivolumab-plus-cabozantinib arm vs. sunitinib arm was 16.6 vs. 8.3 months (hazard ratio [HR], 0.51; 95% confidence interval [CI], 0.41–0.64). The proportion of patients with 12-month OS was 85.7% with the nivolumab-plus-cabozantinib strategy vs. 75.6% with sunitinib strategy (Choueiri et al., 2021). Another randomized phase three trial (CLEAR) revealed that lenvatinib-plus-pembrolizumab showed significant improvement when compared with sunitinib with respect to OS (median, 14.7 vs. 9.2 months; HR, 0.65; 95% CI, 0.53–0.80) and PFS (median, 23.9 vs. 9.2 months; HR, 0.39; 95% CI, 0.32–0.49) (Motzer et al., 2021). Moreover, multiple randomized controlled trials (RCTs) have reported that compared with sunitinib, ICI-based regimens (including nivolumab-plus-ipilimumab, pembrolizumab-plus-axitinib, and avelumab-plus-axitinib) can enhance survival and quality of life (QoL) (Motzer et al., 2018; Motzer et al., 2019; Powles et al., 2020).
Although ICIs have obviously improved health outcomes in patients with aRCC, it is still unclear whether the substantial ICI cost and adverse events (AEs) are justified by the health benefits gained, the decreased health resource consumption of subsequent line of treatments, or both. Under the current healthcare setting, patients, physicians, and policy makers alike need reasonable evidence as a framework to determine the value of different agents in oncology. Therefore, the aim of this study was to estimate the cost-effectiveness of ICI treatments compared with each other and with sunitinib as a first-line treatment for aRCC from a United States payer perspective, using the most recently reported RCT data.
Methods
Analytic Overview
A microsimulation model was developed to evaluate the lifetime health and economic outcomes of six treatment strategies for patients with treatment-naïve aRCC by using TreeAge Pro (TreeAge Software, Williamstown, MA, United States) (Figure 1 and Supplementary Figure S1). The baseline sample of patients was generated to mirror the respective RCTs (Motzer et al., 2018; Motzer et al., 2019; Powles et al., 2020; Choueiri et al., 2021; Motzer et al., 2021) (Supplementary Table S1). The mean age of the patients was 62 years (obtained by averaging the ages of the patients in the six RCTs), and all individuals had clear cell type aRCC (Motzer et al., 2018; Motzer et al., 2019; Powles et al., 2020; Choueiri et al., 2021; Motzer et al., 2021).
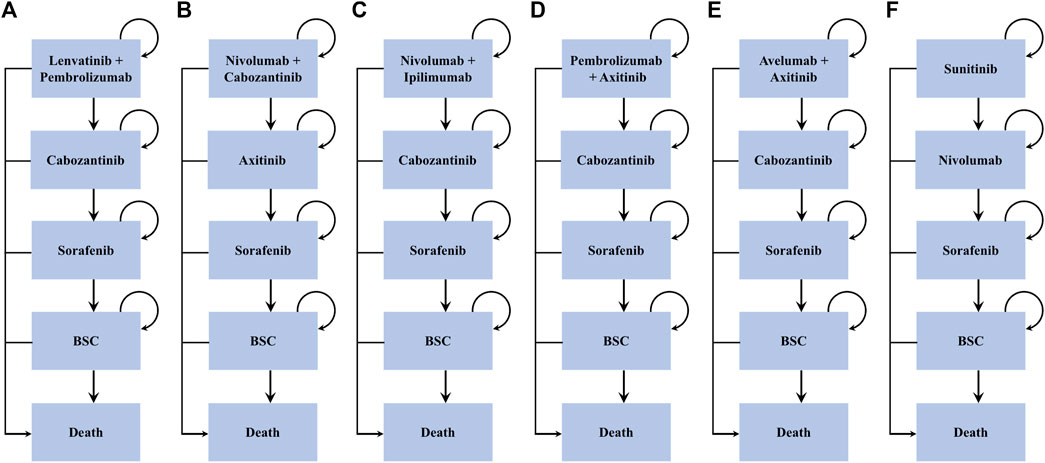
FIGURE 1. Treatment sequences. *BSC = best support care. Arrows represent patients staying on current treatment or moving to the next line of treatment.
Individuals entered the model and received one of the six frontline interventions: 1) lenvatinib-plus-pembrolizumab, 2) nivolumab-plus-cabozantinib, 3) nivolumab-plus-ipilimumab, 4) pembrolizumab-plus-axitinib, 5) avelumab-plus-axitinib, and 6) sunitinib. Patients who progressed to lenvatinib-plus-pembrolizumab, nivolumab-plus-ipilimumab, and pembrolizumab-plus-axitinib subsequently received cabozantinib as the second-line treatment, while those progressing to nivolumab-plus-cabozantinib and sunitinib subsequently received axitinib and nivolumab, respectively. Sorafenib was administered as the third-line therapy among all arms. All patients who progressed following sorafenib were switched to the best supportive care (BSC) phase before death (Figure 1). All dosage and administration schedules for each line of therapy were collected from the respective RCTs and are displayed in Supplementary Table S2 (Rini et al., 2011; Motzer et al., 2013; Motzer et al., 2014; Motzer et al., 2015; Choueiri et al., 2016; Motzer et al., 2018; Motzer et al., 2019; Powles et al., 2020; Rini et al., 2020; Choueiri et al., 2021; Motzer et al., 2021).
The model cycle was 42 days, and lifetime horizon was used to estimate the total costs, life years (LYs), quality-adjusted LYs (QALYs), and incremental cost-effectiveness ratios (ICERs). All the costs were adjusted to 2021 USD, and both cost and outcomes were discounted by 3% annually (Weinstein et al., 1996). This cost-effectiveness analysis was performed from a United States payer perspective with a willingness-to-pay threshold (WTP) of $100,000/QALY (Neumann et al., 2014).
Transition Probability
Based on transition probabilities estimated from the survival curves of the respective RCTs, patients transitioned among different health states (Rini et al., 2011; Motzer et al., 2013; Motzer et al., 2014; Motzer et al., 2015; Choueiri et al., 2016; Motzer et al., 2018; Motzer et al., 2019; Powles et al., 2020; Rini et al., 2020; Choueiri et al., 2021; Motzer et al., 2021). On the basis of the PFS Kaplan–Meier curves from the RCTs (Rini et al., 2011; Motzer et al., 2013; Motzer et al., 2014; Motzer et al., 2015; Choueiri et al., 2016; Motzer et al., 2018; Motzer et al., 2019; Powles et al., 2020; Rini et al., 2020; Choueiri et al., 2021; Motzer et al., 2021), the probability of patients remaining in the PFS state of each strategy was estimated by using the standard extrapolation technique derived by Guyot et al. (2012). In brief, the survival data of PFS derived from the Kaplan–Meier curves (Rini et al., 2011; Motzer et al., 2013; Motzer et al., 2014; Motzer et al., 2015; Choueiri et al., 2016; Motzer et al., 2018; Motzer et al., 2019; Powles et al., 2020; Rini et al., 2020; Choueiri et al., 2021; Motzer et al., 2021) were extracted to generate pseudo individual patient-level data. Then, these reconstructed survival data were fit to four standard parametric models (exponential, Weibull, lognormal, and log-logistic), and the suitable survival distribution selected for each PFS curve based on the goodness of fit (Akaike information criterion). The PFS data of the sunitinib strategy in the five trials (Motzer et al., 2018; Motzer et al., 2019; Powles et al., 2020; Choueiri et al., 2021; Motzer et al., 2021) and sorafenib in the two trials (Motzer et al., 2014; Rini et al., 2020) were pooled, given the comparable trial eligibility criteria and patient baseline characteristics (Supplementary Table S1) among the RCTs, similar to the analyses by Wu and Shi (2020).
This model also took into consideration discontinuation of treatment associated with AEs, with transition probabilities collected from literature (Rini et al., 2011; Motzer et al., 2013; Motzer et al., 2014; Motzer et al., 2015; Choueiri et al., 2016; Motzer et al., 2018; Motzer et al., 2019; Powles et al., 2020; Rini et al., 2020; Choueiri et al., 2021; Motzer et al., 2021). Finally, the overall transition probability for death during each line of active treatment was calculated by combining an age-specified background mortality rate from the 2017 United States Life Table (Arias et al., 2019) with the data concerning treatment-related severe AEs from the RCTs (Rini et al., 2011; Motzer et al., 2013; Motzer et al., 2014; Motzer et al., 2015; Choueiri et al., 2016; Motzer et al., 2018; Motzer et al., 2019; Powles et al., 2020; Rini et al., 2020; Choueiri et al., 2021; Motzer et al., 2021). The probability of death from the BSC state was estimated on the basis of the OS curve of the RECORD-1 trial using the same approach as with the transition probabilities of PFS (Motzer et al., 2008). Baseline evaluates for the clinical transition probabilities are displayed in Table 1.
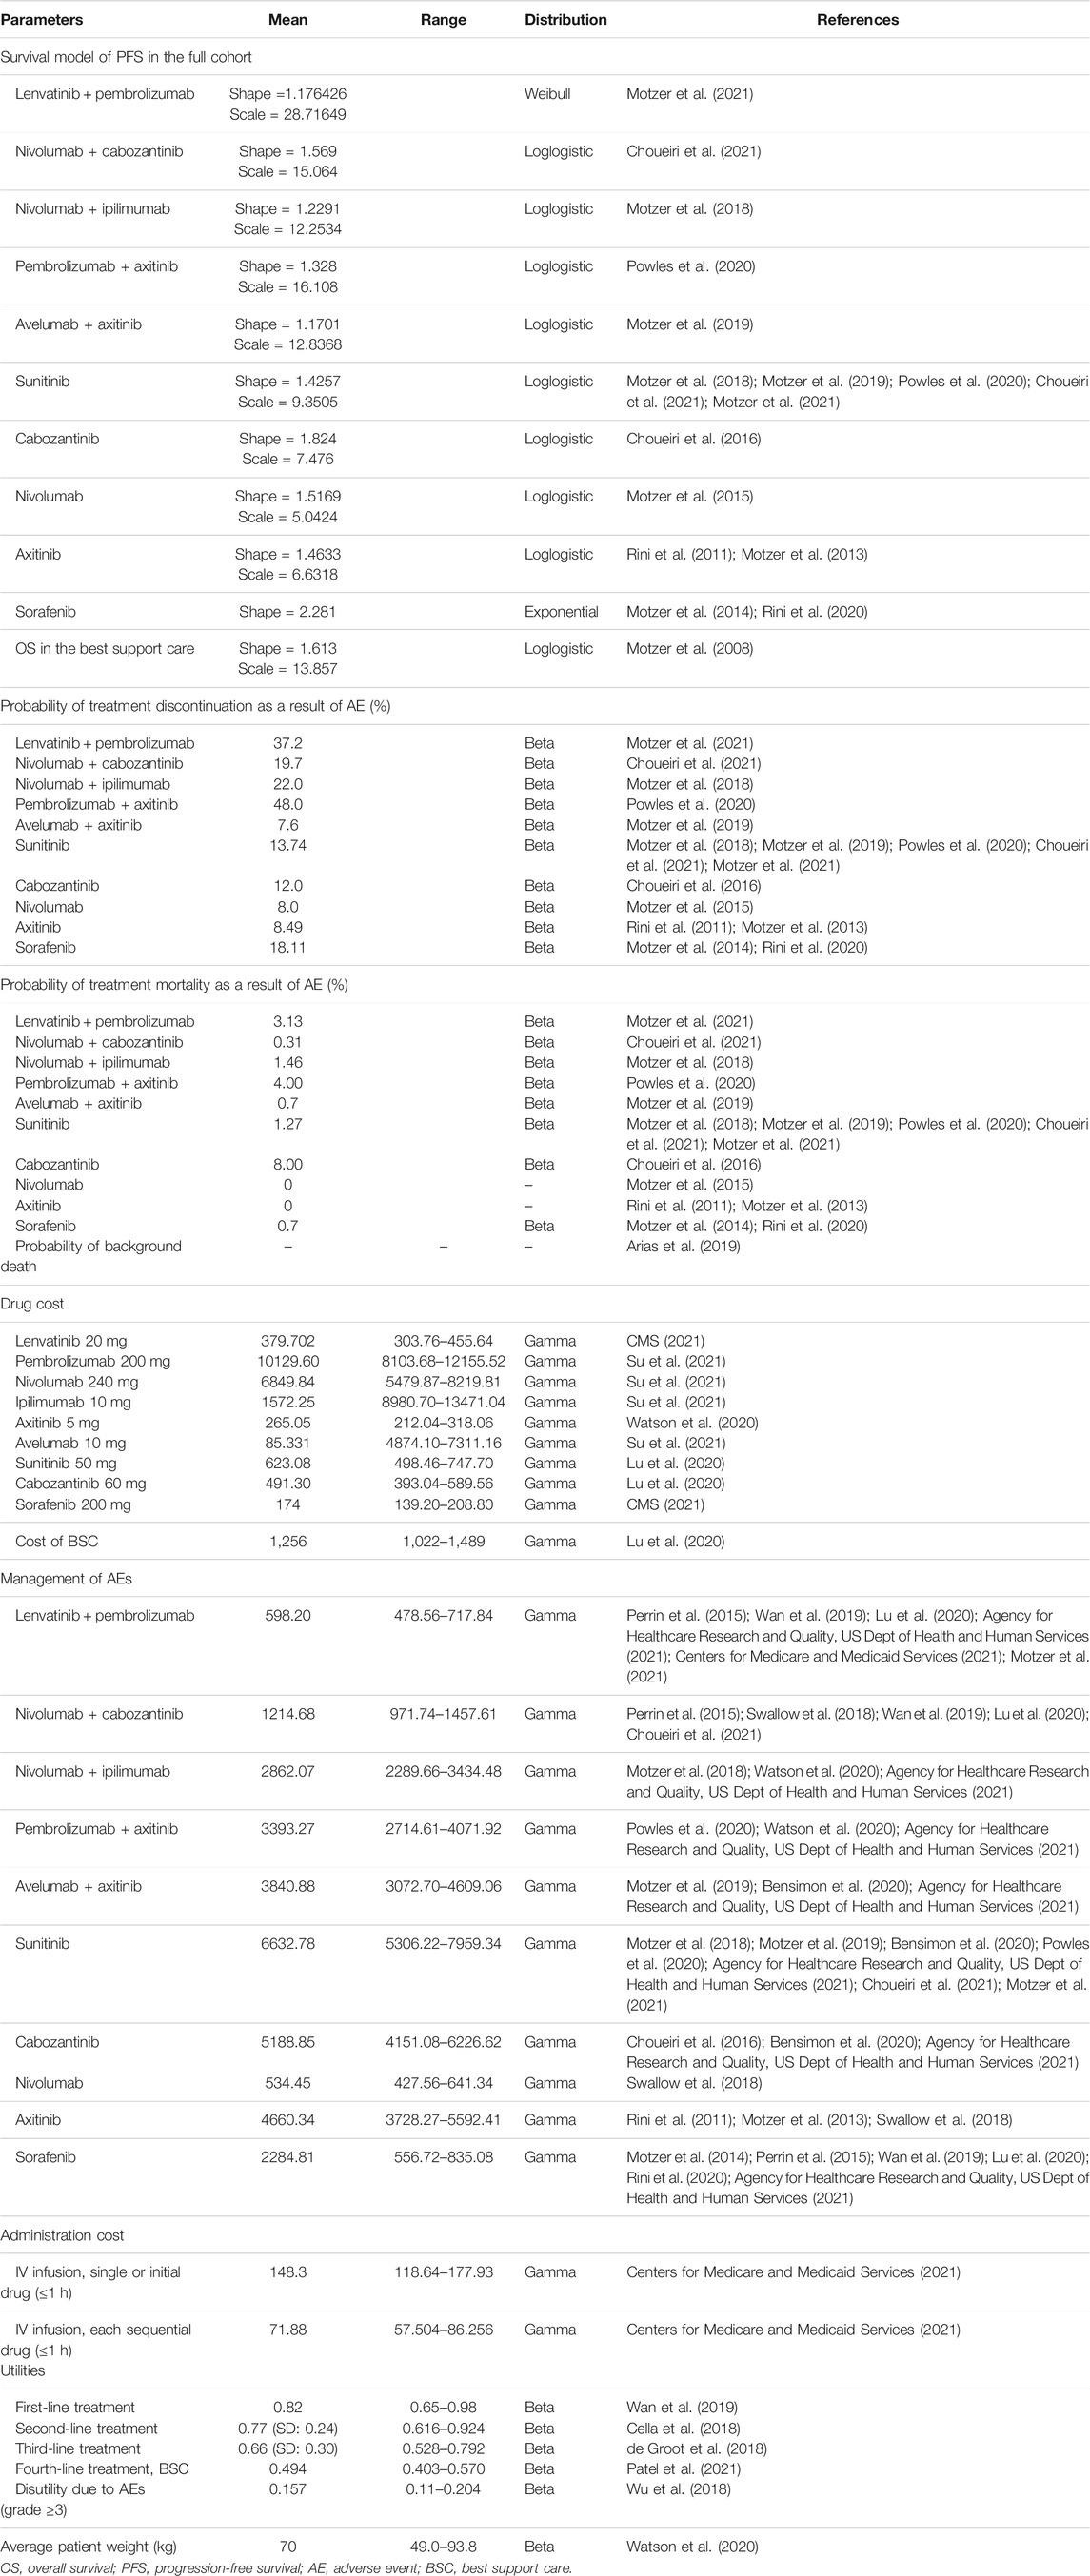
TABLE 1. Input parameters.
Costs and Utilities
The costs and utilities incorporated in the model are listed in Table 1. Only direct costs were considered, including drugs, administration, management of AEs, and BSC. The unit prices of pembrolizumab, nivolumab, ipilimumab, and avelumab in the United States were estimated based on the 2021 average sale price from the Centers for Medicare and Medicaid Services (CMS) (CMS, 2021). The costs of the oral drugs, including lenvatinib, axitinib, sunitinib, cabozantinib, and sorafenib, were derived from public databases and the literature (CMS, 2021; Su et al., 2021; Lu et al., 2020). Although the mean patient weight in the United States is 74.7 kg, the price of medications was estimated using a patient weight of 70 kg, accounting for weight loss effects in disease (Wan et al., 2019; Lu et al., 2020). The administration fee was based on the 2021 CMS Physician Fee Schedule, with the duration of drug infusion based on RCTs and United States Food and Drug Administration package inserts (Centers for Medicare & Medicaid Services, 2021). The overall costs associated with the management of grade 3 or 4 AEs and BSC were obtained from previous literature (Perrin et al., 2015; Swallow et al., 2018; Wan et al., 2019; Bensimon et al., 2020; Lu et al., 2020; Watson et al., 2020; Agency for Healthcare Research and Quality, US Dept of Health and Human Services (2021)).
The health utility scores, which range from 0 (death) to 1 (perfect health), were collected from published literature (Cella et al., 2018; de Groot et al., 2018; Wan et al., 2019; Patel et al., 2021). In this study, the first-, second-, and third-line treatments and the BSC phases were assigned utility values of 0.82, 0.77, 0.66, and 0.494, respectively. We also adopted a utility decrement (−0.157), specifying the reduction in the valued QoL for AEs (Wu et al., 2018). Based on utility calculations for every health state, QALYs were estimated by weighting patient survival.
Sensitivity Analyses
Sensitivity analyses, including one-way sensitivity analyses and probability sensitivity analyses (PSA), were incorporated to assess the robustness of the model and test the uncertainty in estimates of variables. In the one-way sensitivity analyses, for parameters with CIs, the upper and lower limits were changed for their 95% CIs; otherwise, the parameters were varied by a 20% change from the base case value to determine their impact on the ICER, in accordance with the existing approach (Goulart and Ramsey, 2011; Zhang et al., 2012; Kohn et al., 2017). During PSA, a Monte Carlo simulation of 2000 iterations of 5,000 patients was generated by using prespecified distributions to sample the critical input parameters. Cost parameters were described by gamma distribution, utility by beta distribution, and the median starting age and weight by normal distribution. On the basis of data from 5,000 iterations, a cost-effectiveness acceptability curve was drawn to illustrate the likelihood that a competing strategy would be regarded as cost-effective at various willingness-to-pay (WTP) threshold levels for health gains (QALYs).
Four scenario analyses were also incorporated in this study. In the first scenario analysis, we varied the time horizon at 5, 10, and 20 years to assess the influence of OS and PFS extrapolations used in the model. In the second, patients would experience a fixed percentage (between 10 and 30%) to elect for BSC after progressing from the first- or second-line treatment instead of receiving next-line treatment. In the third, we prescribed nivolumab or axitinib to replace cabozantinib as the second-line therapy in the model. For the second-line treatments that had progressed after the first-line use of nivolumab (axitinib), the second-line drugs were changed to axitinib (nivolumab). We developed the final scenario analysis accommodating indication-specific pricing, where the cost of nivolumab used in combination with cabozantinib in the first-line treatment varied from the price of nivolumab monotherapy used at second-line setting.
Results
Base Case Analysis
Examining six treatment strategies incrementally (Table 2), nivolumab-plus-cabozantinib, pembrolizumab-plus-axitinib, and sunitinib constituted the cost-effective frontier (Supplementary Figure S2). Supplementary Figure S2 illustrates that sunitinib strategy was the least expensive, and compared with this strategy, the pembrolizumab-plus-axitinib strategy gained an extra 0.39 QALYs with an additional cost of $31700.08, which resulted in an ICER of $81282/QALY and dominated the nivolumab-plus-ipilimumab and avelumab-plus-axitinib strategies. The lenvatinib-plus-pembrolizumab strategy was dominated by the nivolumab-plus-cabozantinib strategy, which yielded the greatest health outcomes with an incremental 0.47 QALYs and $213093.73 compared with the pembrolizumab-plus-axitinib strategy. The ICER of the nivolumab-plus-cabozantinib versus pembrolizumab-plus-axitinib strategy was $372109/QALY more than pembrolizumab-plus-axitinib versus sunitinib strategy.
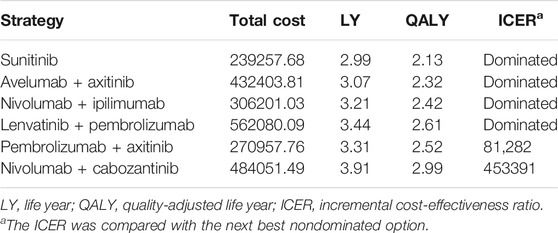
TABLE 2. Base case results.
One-Way Sensitivity and Probability Analyses
In the comparison between the pembrolizumab-plus-axitinib and sunitinib strategies, the one-way sensitivity analyses indicated that the model outcome was considerably impacted by the cost of sunitinib and pembrolizumab, and the weight of patients (Supplementary Figure S3). In the comparison between the nivolumab-plus-cabozantinib and pembrolizumab-plus-axitinib strategies, the age of the patients at the start of treatment, the utility of the second-line of treatment, and cost of nivolumab played a crucial role in the model outcomes (Supplementary Figure S4). Other model input parameters, such as the cost of AE management and discount rate, had a moderate or less influence on the estimated ICER. The cost-effectiveness acceptability curves revealed that the 96 and 100% probabilities of the pembrolizumab-plus-axitinib strategy were considered the cost-effective options at the WTP threshold of $100,000/QALY, when compared with sunitinib (Figure 2).
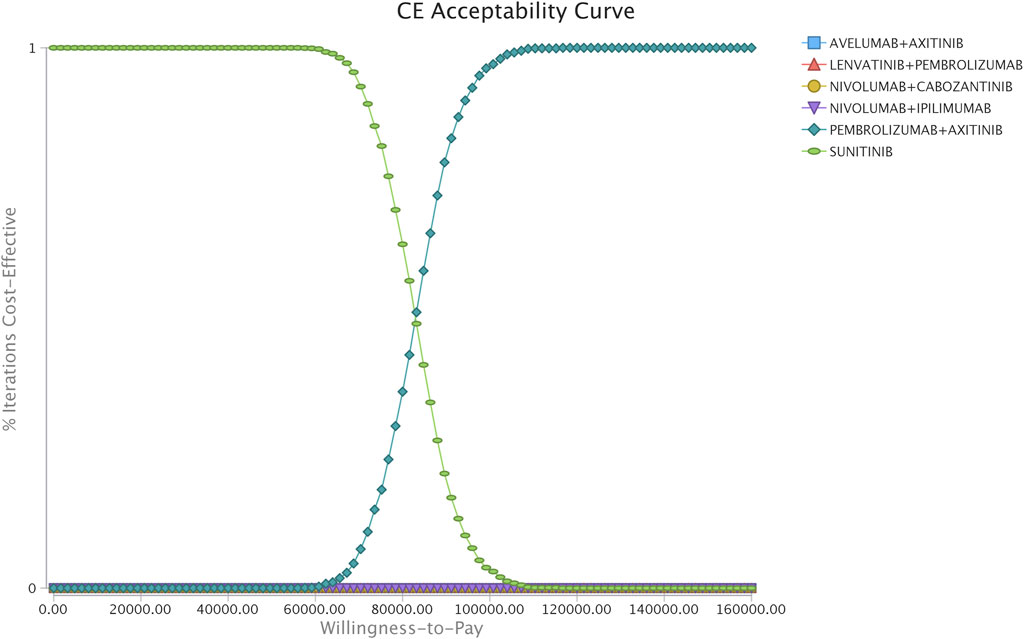
FIGURE 2. Acceptability curves comparing the cost-effectiveness of different competing strategies in the scenario of the simultaneous competition of six strategies.
Scenario Analyses
The first scenario analyses showed that when the time horizon was adjusted to 5 years, the model produced a higher ICER than the base case analyses because most of the medical costs (95%) were spent in the first 5 years of the time horizon, but patients continued to obtain benefit after 5 years. However, the ICERs were not changed significantly when the time horizon was varied to 10 and 20 years. In the second scenario analyses, a small percentage of patients switched to the BSC phase after disease progression from the first- or second-line therapy rather than receiving next-line treatment. And the results demonstrated that this adjustment did not largely change the model outcomes, with the ICERs for the pembrolizumab-plus-axitinib versus sunitinib strategies being $80186.46/QALY and $82077.16/QALY when modeling 30 and 10% of patients switching to the BSC phase. In the third scenario analyses, nivolumab or axitinib was substituted as the second-line therapy for cabozantinib. The results indicate that the use of nivolumab in the pembrolizumab-plus-axitinib versus sunitinib strategies as a second-line treatment was associated with a more acceptable ICER ($30382.22/QLAY) than in the base case analyses; by contrast, the use of axitinib was associated with a higher ICER of $455856.73/QALY. In the final scenario analyses, reductions in the acquisition prices for nivolumab used in the first-line treatment of 75, 50, and 25% were found to lead to lower ICERs of 259256.70/QALY, $172683.55/QALY, and 83,020.19/QALY, respectively. All the results of the scenario analyses are reported in Supplementary Table S4.
Discussion
This study suggests that among the six competing strategies, the upfront use of nivolumab-plus-cabozantinib maximized health outcomes, followed by lenvatinib-plus-pembrolizumab and pembrolizumab-plus-axitinib strategies. And as demonstrated in the economic analysis, the nivolumab-plus-cabozantinib, pembrolizumab-plus-axitinib, and sunitinib strategies can be regarded as the most potentially cost-effective options on the frontier line, while the rest of the competing strategies were dominated either because of their lower health benefits and higher costs or not being considered cost-effective as the ICER far exceeded the WTP threshold of the United States. The most influential input parameter driving this model was the cost of sunitinib.
Although there are several cost-effectiveness analyses focusing on ICIs as the first-line of treatment for patients with aRCC, the present study provides the most comprehensive economic evaluation to date that compares different treatment strategies for patients with aRCC. This study also has several potential strengths. First, to the authors' knowledge, this is the first cost-effectiveness study that has incorporated nivolumab-plus-cabozantinib and lenvatinib-plus-pembrolizumab strategies in the first-line setting for patients with aRCC. Second, the majority of parameters incorporated in the model have been based on large, multicenter, randomized, phase 3 clinical trials. Third, contemporary multiagent treatment sequences were predefined to reflect most advances in the treatment of aRCC, and the model presented in this study takes AEs into consideration, including treatment discontinuation due to AEs as well as costs and disutility related to drug toxicity. Forth, a scenario analysis was also performed to reflected the situation in clinical practice in that part of the patients will not receive subsequent treatment due to other causes. Finally, this study was conducted by adopting a microsimulation model to account for the heterogeneity of patients.
Based on the base case analyses, scenario analyses were additionally performed to evaluate drug acquisition prices by implementing indication-specific pricing in the final scenario analysis. And this study demonstrated that considerable price decrement (75–25%) to nivolumab used in the first-line setting resulted in lower ICERs than in base-line outcomes. The results of this study, combined with a series of previous cost-effectiveness studies that have reported high ICERs for aRCC medicines, enhance the requirement for alternative pricing schemes for this disease, such as value-based pricing (Bach and Pearson, 2015) or indication-specific pricing (Bach, 2014). In the United States, although such schemes could decrease consumer surplus and result in profit maximization, the pricing of cancer drugs have minimal association with clinical utility because the United States statutes force its largest insurer (Medicare) to reimburse all approved cancer treatments, restricting negotiations with pharmaceutical companies (Mailankody and Prasad, 2015; Prasad and Mailankody, 2016). By comparison, other countries, such as the regulatory body of the United Kingdom—the National Institute for Health and Care Excellence, that oversee the approval and reimbursement of novel agents on the basis of health economic evaluation (Patel et al., 2021). Therefore, it is crucial to update the policy in the United States that could offer potential to rationally align the drug prices of novel therapeutics with their clinical efficacy, and incentivize the research and development of highly effective treatments (Bach, 2014).
Although this study has important strengths, there are weaknesses that should be considered. First, data were incorporated from several RCTs because of lack of head-to-head data. This indirect comparison presents some biases of the model due to there being some differences among patient characteristics. And although the PFS of the model was validated at each treatment line, the OS curve of the model could not be externally validated because of limited long-term survival data for patients treated with ICIs as the frontier line (Supplementary Figures S5–8). It is necessary to evaluate the concordance of these modeled health outcomes with real-world data and long-term RCTs. Second, modeling the health outcomes of multiagent treatment sequences relies on precise data concerning discontinuation of treatment due to some unrelated reasons for disease progression. Although treatment discontinuation was assessed based on multiple respective RCTs, uncertainty remained regarding the probability of treatment discontinuation in the post-trial period. Third, the health utilities used in this model, although obtained from previously published aRCC cost-effectiveness analyses, may not precisely reflect the hypothetical population simulated in the present study. Accuracy and robustness of model might improve when health utilities estimated for patients with aRCC in populations with Immunotherapy are available in the future. Forth, same as the limitation of other cost-effectiveness analyses, the results of this study cannot be transferred to other countries because the large variation in healthcare systems and policies will result in different health outcomes for different countries (Li et al., 2021). Finally, we did not incorporate a societal perspective because of the theoretical challenge related to gathering the costs and benefits across different sectors and individuals together, including costs related to both informal and non-health sectors.
Conclusion
In summary, for patients with aRCC, the first-line therapy approaches of the pembrolizumab-plus-axitinib strategy could be regarded as a more cost-effective option for the current WTP threshold of $100,000 in the United States.
Data Availability Statement
The original contributions presented in the study are included in the article/Supplementary Material; further inquiries can be directed to the corresponding authors.
Author Contributions
SL had full access to all the data in the study and takes responsibility for the integrity of the data and the accuracy of the data analysis. Study concept and design: SL and XW. Acquisition of data: SL. Analysis and interpretation of data: SL. Drafting of the manuscript: SL and XW. Critical revision of the manuscript for important intellect content: YL. Statistical analysis: SL. Obtaining funding: XW. Administrative, technical, or material support: JL and LP. Supervision: JL and LP.
Funding
This study was funded by the Health and Family Planning Commission of Hunan Province (Grant No. 20200022) and the Fundamental Research Funds for the Central Universities of Central South University (Grant No. 2021zzts1010).
Conflict of Interest
The authors declare that the research was conducted in the absence of any commercial or financial relationships that could be construed as a potential conflict of interest.
Publisher’s Note
All claims expressed in this article are solely those of the authors and do not necessarily represent those of their affiliated organizations, or those of the publisher, the editors, and the reviewers. Any product that may be evaluated in this article, or claim that may be made by its manufacturer, is not guaranteed or endorsed by the publisher.
Acknowledgments
All named authors meet the International Committee of Medical Journal Editors (ICMJE) criteria for authorship for this article, take responsibility for the integrity of the work as a whole, and have given their approval for this version to be published.
Supplementary Material
The Supplementary Material for this article can be found online at: https://www.frontiersin.org/articles/10.3389/fphar.2021.718014/full#supplementary-material
References
Agency for Healthcare Research and Quality, US Dept of Health & Human Services (2021). Healthcare Cost and Utilization Project. Available from: https://hcupnet.ahrq.gov (Accessed February 26, 2021).
Amzal, B., Fu, S., Meng, J., Lister, J., and Karcher, H. (2017). Cabozantinib versus Everolimus, Nivolumab, Axitinib, Sorafenib and Best Supportive Care: A Network Meta-Analysis of Progression-free Survival and Overall Survival in Second Line Treatment of Advanced Renal Cell Carcinoma. PloS one. 12, e0184423. doi:10.1371/journal.pone.0184423
Arias, E., Xu, J., and Kochanek, K. D. (2019). United States Life Tables, 2016. Natl. Vital Stat. Rep. 68, 1–66.
Bach, P. B. (2014). Indication-specific Pricing for Cancer Drugs. Jama 312, 1629–1630. doi:10.1001/jama.2014.13235
Bach, P. B., and Pearson, S. D. (2015). Payer and Policy Maker Steps to Support Value-Based Pricing for Drugs. Jama 314, 2503–2504. doi:10.1001/jama.2015.16843
Bensimon, A. G., Zhong, Y., Swami, U., Briggs, A., Young, J., Feng, Y., et al. (2020). Cost-effectiveness of Pembrolizumab with Axitinib as First-Line Treatment for Advanced Renal Cell Carcinoma. Curr. Med. Res. Opin. 36, 1507–1517. doi:10.1080/03007995.2020.1799771
Bhatt, J. R., and Finelli, A. (2014). Landmarks in the Diagnosis and Treatment of Renal Cell Carcinoma. Nat. Rev. Urol. 11, 517–525. doi:10.1038/nrurol.2014.194
Cella, D., Escudier, B., Tannir, N. M., Powles, T., Donskov, F., Peltola, K., et al. (2018). Quality of Life Outcomes for Cabozantinib versus Everolimus in Patients with Metastatic Renal Cell Carcinoma: METEOR Phase III Randomized Trial. J. Clin. Oncol. 36, 757–764. doi:10.1200/JCO.2017.75.2170
Centers for Medicare & Medicaid Services (2021). Physician Fee Schedule. Available at https://www.cms.gov/apps/physician-fee-schedule (Accessed March 4, 2021).
Choueiri, T. K., Escudier, B., Powles, T., Mainwaring, P. N., Rini, B. I., Donskov, F., et al. (2015). Cabozantinib versus Everolimus in Advanced Renal-Cell Carcinoma. N. Engl. J. Med. 373, 1814–1823. doi:10.1056/NEJMoa1510016
Choueiri, T. K., Escudier, B., Powles, T., Tannir, N. M., Mainwaring, P. N., Rini, B. I., et al. (2016). Cabozantinib versus Everolimus in Advanced Renal Cell Carcinoma (METEOR): Final Results from a Randomised, Open-Label, Phase 3 Trial. Lancet Oncol. 17, 917–927. doi:10.1016/S1470-2045(16)30107-3
Choueiri, T. K., Powles, T., Burotto, M., Escudier, B., Bourlon, M. T., Zurawski, B., et al. (2021). Nivolumab Plus Cabozantinib versus Sunitinib for Advanced Renal-Cell Carcinoma. N. Engl. J. Med. 384, 829–841. doi:10.1056/NEJMoa2026982
CMS (2021). ASP Drug Pricing Files.2021. Available at: https://www.cms.gov/Medicare/Medicare-Fee-for-Service-Part-B-Drugs/McrPartBDrugAvgSalesPrice/2021ASPFiles.html. (Accessed February 25, 2021)
de Groot, S., Redekop, W. K., Versteegh, M. M., Sleijfer, S., Oosterwijk, E., Kiemeney, L. A. L. M., et al. (2018). Health-related Quality of Life and its Determinants in Patients with Metastatic Renal Cell Carcinoma. Qual. Life Res. 27, 115–124. doi:10.1007/s11136-017-1704-4
Fisher, R., Gore, M., and Larkin, J. (2013). Current and Future Systemic Treatments for Renal Cell Carcinoma. Semin. Cancer Biol. 23, 38–45. doi:10.1016/j.semcancer.2012.06.004
Goulart, B., and Ramsey, S. (2011). A Trial-Based Assessment of the Cost-Utility of Bevacizumab and Chemotherapy versus Chemotherapy Alone for Advanced Non-small Cell Lung Cancer. Value Health. 14, 836–845. doi:10.1016/j.jval.2011.04.004
Guyot, P., Ades, A. E., Ouwens, M. J., and Welton, N. J. (2012). Enhanced Secondary Analysis of Survival Data: Reconstructing the Data from Published Kaplan-Meier Survival Curves. BMC Med. Res. Methodol. 12, 9. doi:10.1186/1471-2288-12-9
Kohn, C. G., Zeichner, S. B., Chen, Q., Montero, A. J., Goldstein, D. A., and Flowers, C. R. (2017). Cost-Effectiveness of Immune Checkpoint Inhibition in BRAF Wild-type Advanced Melanoma. J. Clin. Oncol. 35, 1194–1202. doi:10.1200/JCO.2016.69.6336
Li, S., Li, J., Peng, L., Li, Y., and Wan, X. (2021). Cost-Effectiveness of Lorlatinib as a First-Line Therapy for Untreated Advanced Anaplastic Lymphoma Kinase-Positive Non-small Cell Lung Cancer. Front. Oncol. 11, 684073. doi:10.3389/fonc.2021.684073
Lu, P., Liang, W., Li, J., Hong, Y., Chen, Z., Liu, T., et al. (2020). A Cost-Effectiveness Analysis: First-Line Avelumab Plus Axitinib versus Sunitinib for Advanced Renal-Cell Carcinoma. Front. Pharmacol. 11, 619. doi:10.3389/fphar.2020.00619
Mailankody, S., and Prasad, V. (2015). Five Years of Cancer Drug Approvals: Innovation, Efficacy, and Costs. JAMA Oncol. 1, 539–540. doi:10.1001/jamaoncol.2015.0373
Motzer, R., Alekseev, B., Rha, S. Y., Porta, C., Eto, M., Powles, T., et al. (2021). Lenvatinib Plus Pembrolizumab or Everolimus for Advanced Renal Cell Carcinoma. N. Engl. J. Med. 384, 1289–1300. doi:10.1056/NEJMoa2035716
Motzer, R. J., Escudier, B., McDermott, D. F., George, S., Hammers, H. J., Srinivas, S., et al. (2015). Nivolumab versus Everolimus in Advanced Renal-Cell Carcinoma. N. Engl. J. Med. 373, 1803–1813. doi:10.1056/NEJMoa1510665
Motzer, R. J., Escudier, B., Oudard, S., Hutson, T. E., Porta, C., Bracarda, S., et al. (2008). Efficacy of Everolimus in Advanced Renal Cell Carcinoma: a Double-Blind, Randomised, Placebo-Controlled Phase III Trial. Lancet 372, 449–456. doi:10.1016/S0140-6736(08)61039-9
Motzer, R. J., Escudier, B., Tomczak, P., Hutson, T. E., Michaelson, M. D., Negrier, S., et al. (2013). Axitinib versus Sorafenib as Second-Line Treatment for Advanced Renal Cell Carcinoma: Overall Survival Analysis and Updated Results from a Randomised Phase 3 Trial. Lancet Oncol. 14, 552–562. doi:10.1016/S1470-2045(13)70093-7
Motzer, R. J., Penkov, K., Haanen, J., Rini, B., Albiges, L., Campbell, M. T., et al. (2019). Avelumab Plus Axitinib versus Sunitinib for Advanced Renal-Cell Carcinoma. N. Engl. J. Med. 380, 1103–1115. doi:10.1056/NEJMoa1816047
Motzer, R. J., Porta, C., Vogelzang, N. J., Sternberg, C. N., Szczylik, C., Zolnierek, J., et al. (2014). Dovitinib versus Sorafenib for Third-Line Targeted Treatment of Patients with Metastatic Renal Cell Carcinoma: an Open-Label, Randomised Phase 3 Trial. Lancet Oncol. 15, 286–296. doi:10.1016/S1470-2045(14)70030-0
Motzer, R. J., Tannir, N. M., McDermott, D. F., Arén Frontera, O., Melichar, B., Choueiri, T. K., et al. (2018). Nivolumab Plus Ipilimumab versus Sunitinib in Advanced Renal-Cell Carcinoma. N. Engl. J. Med. 378, 1277–1290. doi:10.1056/NEJMoa1712126
National Cancer Institute (2021). SEER Cancer Statistics Factsheets: Kidney and Renal Pelvis Cancer. Available at: https://seer.cancer.gov/statfacts/html/kidrp.html (Accessed March 2, 2021).
Neumann, P. J., Cohen, J. T., and Weinstein, M. C. (2014). Updating Cost-Effectiveness-Tthe Curious Resilience of the $50,000-Per-QALY Threshold. N. Engl. J. Med. 371, 796–797. doi:10.1056/NEJMp1405158
Patel, K. K., Giri, S., Parker, T. L., Bar, N., Neparidze, N., and Huntington, S. F. (2021). Cost-Effectiveness of First-Line versus Second-Line Use of Daratumumab in Older, Transplant-Ineligible Patients with Multiple Myeloma. J. Clin. Oncol. 39, 1119–1128. doi:10.1200/jco.20.01849
Perrin, A., Sherman, S., Pal, S., Chua, A., Gorritz, M., Liu, Z., et al. (2015). Lifetime Cost of Everolimus vs Axitinib in Patients with Advanced Renal Cell Carcinoma Who Failed Prior Sunitinib Therapy in the US. J. Med. Econ. 18, 200–209. doi:10.3111/13696998.2014.985789
Powles, T., Plimack, E. R., Soulières, D., Waddell, T., Stus, V., Gafanov, R., et al. (2020). Pembrolizumab Plus Axitinib versus Sunitinib Monotherapy as First-Line Treatment of Advanced Renal Cell Carcinoma (KEYNOTE-426): Extended Follow-Up from a Randomised, Open-Label, Phase 3 Trial. Lancet Oncol. 21, 1563–1573. doi:10.1016/S1470-2045(20)30436-8
Prasad, V., and Mailankody, S. (2016). The UK Cancer Drugs Fund Experiment and the US Cancer Drug Cost Problem: Bearing the Cost of Cancer Drugs until it Is Unbearable. Mayo Clin. Proc. 91, 707–712. doi:10.1016/j.mayocp.2016.04.028
Rini, B. I., Escudier, B., Tomczak, P., Kaprin, A., Szczylik, C., Hutson, T. E., et al. (2011). Comparative Effectiveness of Axitinib versus Sorafenib in Advanced Renal Cell Carcinoma (AXIS): a Randomised Phase 3 Trial. Lancet 378, 1931–1939. doi:10.1016/S0140-6736(11)61613-9
Rini, B. I., Pal, S. K., Escudier, B. J., Atkins, M. B., Hutson, T. E., Porta, C., et al. (2020). Tivozanib versus Sorafenib in Patients with Advanced Renal Cell Carcinoma (TIVO-3): a Phase 3, Multicentre, Randomised, Controlled, Open-Label Study. Lancet Oncol. 21, 95–104. doi:10.1016/S1470-2045(19)30735-1
Sarfaty, M., Leshno, M., Gordon, N., Moore, A., Neiman, V., Rosenbaum, E., et al. (2018). Cost Effectiveness of Nivolumab in Advanced Renal Cell Carcinoma. Eur. Urol. 73, 628–634. doi:10.1016/j.eururo.2017.07.041
Su, D., Wu, B., and Shi, L. (2021). Cost-effectiveness of Atezolizumab Plus Bevacizumab vs Sorafenib as First-Line Treatment of Unresectable Hepatocellular Carcinoma. JAMA Netw. Open. 4, e210037. doi:10.1001/jamanetworkopen.2021.0037
Swallow, E., Messali, A., Ghate, S., McDonald, E., Duchesneau, E., and Perez, J. R. (2018). The Additional Costs Per Month of Progression-free Survival and Overall Survival: An Economic Model Comparing Everolimus with Cabozantinib, Nivolumab, and Axitinib for Second-Line Treatment of Metastatic Renal Cell Carcinoma. J. Manag. Care Spec. Pharm. 24, 335–343. doi:10.18553/jmcp.2018.24.4.335
Wan, X., Zhang, Y., Tan, C., Zeng, X., and Peng, L. (2019). First-line Nivolumab Plus Ipilimumab vs Sunitinib for Metastatic Renal Cell Carcinoma: A Cost-Effectiveness Analysis. JAMA Oncol. 5, 491–496. doi:10.1001/jamaoncol.2018.7086
Watson, T. R., Gao, X., Reynolds, K. L., and Kong, C. Y. (2020). Cost-effectiveness of Pembrolizumab Plus Axitinib vs Nivolumab Plus Ipilimumab as First-Line Treatment of Advanced Renal Cell Carcinoma in the US. JAMA Netw. Open. 3, e2016144. doi:10.1001/jamanetworkopen.2020.16144
Weinstein, M. C., Siegel, J. E., Gold, M. R., Kamlet, M. S., and Russell, L. B. (1996). Recommendations of the Panel on Cost-Effectiveness in Health and Medicine. Jama 276, 1253–1258. doi:10.1001/jama.276.15.1253
Wu, B., Zhang, Q., and Sun, J. (2018). Cost-effectiveness of Nivolumab Plus Ipilimumab as First-Line Therapy in Advanced Renal-Cell Carcinoma. J. Immunother. Cancer. 6, 124. doi:10.1186/s40425-018-0440-9
Wu, B., and Shi, L. (20202020). FrontlineBRAFTesting-Guided Treatment for Advanced Melanoma in the Era of Immunotherapies. JAMA Dermatol. 156, 1177. doi:10.1001/jamadermatol.2020.2398
Keywords: cost-effectiveness, renal cell carcinoma, microsimulation, immune checkpoint inhibitors, immunotherapy
Citation: Li S, Li J, Peng L, Li Y and Wan X (2021) Cost-Effectiveness of Frontline Treatment for Advanced Renal Cell Carcinoma in the Era of Immunotherapies. Front. Pharmacol. 12:718014. doi: 10.3389/fphar.2021.718014
Received: 11 June 2021; Accepted: 16 August 2021;
Published: 09 September 2021.
Edited by:
Domenico Criscuolo, Italian Society of Pharmaceutical Medicine, ItalyReviewed by:
Kurt Neumann, Independent researcher, Kerékteleki, HungaryLuis Laranjeira, Eli Lilly, Portugal
Copyright © 2021 Li, Li, Peng, Li and Wan. This is an open-access article distributed under the terms of the Creative Commons Attribution License (CC BY). The use, distribution or reproduction in other forums is permitted, provided the original author(s) and the copyright owner(s) are credited and that the original publication in this journal is cited, in accordance with accepted academic practice. No use, distribution or reproduction is permitted which does not comply with these terms.
*Correspondence: YaMin Li, aminny@csu.edu.cn; XiaoMin Wan, wanxiaomin@csu.edu.cn
†Present address: YaMin Li, The Second Xiangya Hospital, Central South University, Changsha, China