 Pingping Wang1Pin Nie2Yanli Dang2Lifang Wang2Kaiguo Zhu2
 Hongyu Wang3Jiawei Wang2Rumei Liu2
 Jialiang Ren4
 Jun Feng5Haiming Fan6
 Jun Yu 1*and
  Baoying Chen2*
- 1Clinical Experimental Centre, Xi’an International Medical Center Hospital, Xi’an, China
- 2Imaging Diagnosis and Treatment Center, Xi’an International Medical Center Hospital, Xi’an, China
- 3The School of Computer Science and Technology, Xi’an University of Posts and Telecommunications, Xi’an, China
- 4GE Healthcare China, Beijing, China
- 5The School of Information of Science and Technology, Northwest University, Xi’an, China
- 6The School of Medicine, Northwest University, Xi’an, China
Objective: To develop a deep learning model for synthesizing the first phases of dynamic (FP-Dyn) sequences to supplement the lack of information in unenhanced breast MRI examinations.
Methods: In total, 97 patients with breast MRI images were collected as the training set (n = 45), the validation set (n = 31), and the test set (n = 21), respectively. An enhance border lifelike synthesize (EDLS) model was developed in the training set and used to synthesize the FP-Dyn images from the T1WI images in the validation set. The peak signal-to-noise ratio (PSNR), structural similarity (SSIM), mean square error (MSE) and mean absolute error (MAE) of the synthesized images were measured. Moreover, three radiologists subjectively assessed image quality, respectively. The diagnostic value of the synthesized FP-Dyn sequences was further evaluated in the test set.
Results: The image synthesis performance in the EDLS model was superior to that in conventional models from the results of PSNR, SSIM, MSE, and MAE. Subjective results displayed a remarkable visual consistency between the synthesized and original FP-Dyn images. Moreover, by using a combination of synthesized FP-Dyn sequence and an unenhanced protocol, the sensitivity, specificity, positive predictive value (PPV), and negative predictive value (NPV) of MRI were 100%, 72.73%, 76.92%, and 100%, respectively, which had a similar diagnostic value to full MRI protocols.
Conclusions: The EDLS model could synthesize the realistic FP-Dyn sequence to supplement the lack of enhanced images. Compared with full MRI examinations, it thus provides a new approach for reducing examination time and cost, and avoids the use of contrast agents without influencing diagnostic accuracy.
Introduction
Breast cancer has become the most frequently-occurring tumor in women with an increasing incidence (1, 2). Breast magnetic resonance imaging (MRI) examinations have high sensitivity for detecting breast cancer (3–5), and have been recommended for the screening of high-risk groups to reduce breast cancer mortality by the American Cancer Society and the European Society of Breast Imaging (6, 7). However, a traditional full MRI examination protocol includes not only plain scanning and diffusion-weighted image (DWI), but also dynamic-contrast enhanced (DCE) sequences. The long image acquisition times, high cost, and the risk of contrast agent allergy have limited its widespread application for breast cancer screening (8, 9). In order to abbreviate total scan time, Kuhl et al. (10) built an abbreviated MRI protocol with equivalent diagnostic accuracy to the traditional full MRI protocol, in which contrast agent is still requested. Thereafter, Baltzer PA et al. (11, 12) proposed an unenhanced abbreviated breast MRI (u-AB-MRI) protocol, including plain scanning and DWI. This protocol can significantly reduce the scanning time and is free of the contrast agent, but the diagnostic performance may be reduced due to the missing DCE sequence images. Thus, it is urgent to obtain DCE sequence images without actual scanning to compensate for the limitations in the u-AB-MRI protocol.
Generative Adversarial Network (GAN) is a deep learning framework which has been applied to image-to-image translation (13, 14). The new techniques based on the GAN framework can contribute to addressing challenging tasks in medical imaging (15, 16), particularly for converting an image from one modality into the other (17–19), such as synthesizing MRI images from CT images (20, 21). However, the breast MRI images have a complex structure and uneven gray distribution. DCE-MRI, on the other hand, has high spatial resolution and can reflect the morphologic and hemodynamic features of breast lesions (22). Thus, it is challenging to synthesize an enhanced MRI image based on a plain scan image using a GAN model. To address these drawbacks, we propose to build an effective novel method, which can precisely learn the nonlinear mapping from MRI plain scan images to enhanced images, to synthesize realistic enhanced images.
In our study, a deep learning model was developed to synthesize the first phases of dynamic (FP-Dyn) sequence in order to compensate for the paucity of information in unenhanced breast MRI examinations. We demonstrated that the synthesized FP-Dyn sequence combined with an unenhanced protocol had a similar diagnostic value to the traditional full MRI examinations. To our knowledge, this is the first study to attempt to obtain breast enhanced MRI images without scanning, and further preliminarily evaluate the diagnostic performance of the synthesized enhanced images. It may provide a new idea to reduce the cost, examination time, and avoid the use of contrast medium in breast MRI, which is conducive to the popularity of breast MRI.
Materials and Methods
Patient Population
This study retrospectively collected the breast MRI images from 97 patients who underwent MRI examinations between 2019 and 2021 at Xi’an International Medical Center Hospital, and patients were randomly split into a training set (n = 45), a validation set (n = 31) and a test set (n = 21), respectively. The inclusion criteria for the MRI images were as follows: I) image acquisition at 3.0T magnetic field; II) excellent image quality with no motion artifacts. The exclusion criteria were as follows: I) images with an incomplete sequence; II) incomplete clinical data; and III) a history of surgical resection. This research was approved by the Ethics Committee of the Xi’an International Medical Center Hospital and was conducted according to the principles of the Declaration of Helsinki.
MRI Protocols
Image acquisition was performed using the MAGNETOM Prisma 3.0T MRI. The imaging protocol mainly included T1-weighted (T1w), T2-weighted (T2w), DWI, and T1w sequences after contrast administration. Here, the Gd-DTPA (0.1 mmol per kilogram body weight) was intravenously injected at an injection rate of 2mL/s, and then the same amount of normal saline was injected. Furthermore, the scan parameters were as follows: Axial T1w: 176 slices, slice thickness = 1.0 mm; FOV =384×384 mm; TR/TE, 5.66/2.46 ms; matrix = 384×384. Axial T2w: 160 slices, slice thickness = 0.9mm; FOV =360×230 mm; TR/TE, 2000/220ms; matrix = 400×256. Axial gadolinium-enhanced T1W: 176 slices, slice thickness = 1.0 mm; FOV = 384×384 mm; TR/TE, 4.66/1.62 ms; matrix = 384×384. Axial DWI: 35 slices, slice thickness = 4.0 mm; TR/TE, 6100/65ms; FOV = 168×340 mm, b = 0 s/mm2 and 1,000 s/mm2; EPI factor = 84; matrix = 84 ×170; bandwidth = 2262 Hz/pixel.
Data Preprocessing
We used the following steps for data preprocessing. Firstly, the original T1WI and FP-Dyn images in DICOM format were converted to PNG format by using the MicroDicom Viewing software (http://www.microdicom.com/). Then, TIWI images were subtracted from the original FP-Dyn images, and applied a threshold to obtain the contrast agent enhancing areas. Furthermore, using the FP-Dyn images, the edge detail label was obtained through further Canny edge detection. Moreover, the pixel values for each image were scaled into the range [0,1] by using the min-max scaling method. Finally, we expanded the training datasets through the data augmentation strategies, which included rotating, cropping, and mirroring them to improve the performance and robustness of the model (23, 24).
Model Architecture
The enhance border lifelike synthesize (EDLS) model consists of two components: a segmentation network (stage I) and a synthesis network (stage II). The two networks have a similar network structure, including a generator using the U-Net network and a discriminator based on the convolutional neural network, respectively. First, the segmentation network was constructed to segment the potentially contrasted agent enhancing areas of T1WI images. Then, the synthesis network was used to produce the FP-Dyn sequence images from the input T1WI images and the segmentation information. Here, the segmentation information was used as additional information to supervise the contrasted agent enhancing areas in the synthetic images (Figure 1).

Figure 1 The flowchart for synthesizing FP-Dyn sequences by using EDLS. (A) A flowchart for constructing the EDLS model. On stage I, the generator G1 transferred the T1WI image to the images only containing an enhanced area. The D1 discriminator was used to judge the consistency of the synthesized enhanced area image with the original area images. In stage II, synthesized FP-Dyn sequence images were synthesized by a generator G2 from T1WI sequence images and enhanced area images. In addition, the edge loss function was added to ensure the details of the synthesized FP-Dyn sequence image. The loss functions of the EDLS model consist of two parts: L1 Loss and L2 Loss. (B) Showed the structure and detailed parameter information of the generators (G1, G2), and the G1 and G2 had similar structures and parameters. The U-Net was applied to the network architecture of generators, and a deep-supervision strategy was used to optimize the training process.
Furthermore, the Dice loss function was used to train the segmentation network in order to tackle the class imbalance problem in the enhanced area and the non-enhanced area. As shown in formula 1.
Where, Ω indicated the set of pixels in the whole image, s represented the pixel, and p(s) represented the predicted probability for s category by the segmentation network, y(s) represented the true category label of pixel s, and ε denoted the smoothing coefficient.
In the synthesis network, the edge loss function and depth supervision strategy were introduced to solve the problem of blurring of edges and details in the synthesized image. The detailed information was displayed in formula 2-6.
The G and D represented the generator and discriminator respectively. x represented the original T1WI sequence images, xseg was the segmented image corresponding to x, y was the original FP-Dyn sequence image, y_edge represented the y image edge information map obtained by Canny operator detection, lcGAN represented the generation countermeasure loss function, and the loss function llayer_L1 was introduced to further ensure the similarity between the synthesized image and the original image. In addition, to solve the problem of lacking edge detail information in the synthesized FP-Dyn images, we added the edge detail loss function llayer_L2 into the model. Furthermore, the depth supervision network lDS was added into the model for stable convergence. And, the λ1 and λ2 were weighted coefficients and assigned values of 1 and 6 according to the experimental experience, respectively.
Model Training and Testing
The EDLS model training task sought to learn the mapping specifically between T1WI sequence images and FP-Dyn sequence images. Here, the EDLS model was trained on a training set including 3996 pairs of T1WI-FP-Dyn images. We optimized the loss functions by using the Adam optimizer during the training stage, and the model parameters were updated for each training iteration until the model converged. In addition, we implemented all the models with Python 3.6. The TensorFlow framework was used for model construction and evaluation. The software and hardware included CUDA9.0, cuDNN7.6.5, and a Linux server with 2 NVIDIA GTX 1080Ti GPUs.
Following the completion of the model training, the EDLS model was used to synthesize the FP-Dyn images and sequences based on 1226 T1WI images and 25 T1WI sequences in the validation set, respectively. Furthermore, we also synthesized the FP-Dyn sequences using the EDLS model for each patient in the test set.
Conventional GAN Model
We compared the performance of the EDLS model to conventional GAN models, including CycleGAN (25), DC2Anet (26), MR-GAN (27), and Pix2Pix (28). Conventional models were trained and evaluated using the same data set as the EDLS model.
Quantitative Analysis of Model Performance
The model performance was evaluated by using the quantitative index of peak signal-to-noise ratio (PSNR), structural similarity (SSIM), mean square error (MSE) and mean absolute error (MAE) (29). A lower MSE and MAE, or a higher PSNR and SSIM, indicated a better model performance for image synthesis (30).
Subjective Evaluation of Image Quality
The test images, including the synthesized FP-Dyn images and the original FP-Dyn images, were randomly put together. Three radiologists independently discriminated between the synthesized and original FP-Dyn images. In addition, with reference to the original image, the satisfaction of the synthesized images was evaluated by the radiologists using a five-point Likert scale (1 disagree strongly, 2 disagree, 3 no response, 4 agree, and 5 agree strongly). Further, we dichotomized the evaluated results. Scores equal to or greater than 4 were defined as “satisfied”. Scores of 1 to 3 were defined as “dissatisfied”.
Assessment of Diagnostic Value
Three reading modes, including reading mode (a), reading mode (b), and reading mode (c), were designed to evaluate the diagnostic value of the synthesized FP-Dyn sequence. And the reading mode (a) included T1WI, T2WI, DWI, and the synthesized FP-Dyn sequence. The reading mode (b) included the T1WI, T2WI, DWI and the originally scanned FP-Dyn sequence. The reading mode (c) included the T1WI, T2WI, DWI and the total phases of scanned DCE sequences. Then, three experienced breast radiologists independently diagnosed under each of the three modes, respectively. There was a minimum of one month between each of the reading modes. The breast lesions were diagnosed according to the BI-RADS classification. Here, a BI-RADS score greater than 3 was considered positive, while 3 or less was considered negative. We compared the sensitivity, specificity, positive predictive value (PPV), and negative predictive value (NPV) among the afore-mentioned three reading modes, using the pathology results as the gold standard.
Statistical Analysis
In this study, continuous variables were presented as mean and standard deviation, and categorical variables were presented as percentages. The Analysis of Variance (ANOVA) test was used to analyze the performance differences between our model and the conventional GAN models. In addition, the diagnostic consistency among three different reading modes was calculated from the Kappa test. Furthermore, the Kendall test was used to evaluate the consistency of the diagnoses among the radiologists. A two-side P-value less than 0.05 was considered statistically significant. The Holm method was used to adjust the P value between multiple group comparisons. All the statistical tests were performed in R (version 3.6.3, https://www.rproject.org) software.
Results
The Performance of Models
We quantitatively compared the 1226 FP-Dyn images which were respectively synthesized by the EDLS model and the conventional GAN models. Here, the results which were measured by the MAE, MSE, PSRN, and SSIM were summarized in Figure 2. It was easy to see that the performance of the EDLS model was significantly superior to other conventional GAN models. Compared with the Pix2Pix model, the EDLS model produced improvements of more than 2% in SSIM, which played an important role in improving the quality of the synthesized images. Simultaneously, the PSNR had also been significantly improved (P<0.001). In addition, we found that the EDLS model had the lowest MAE and MSE (P<0.001).
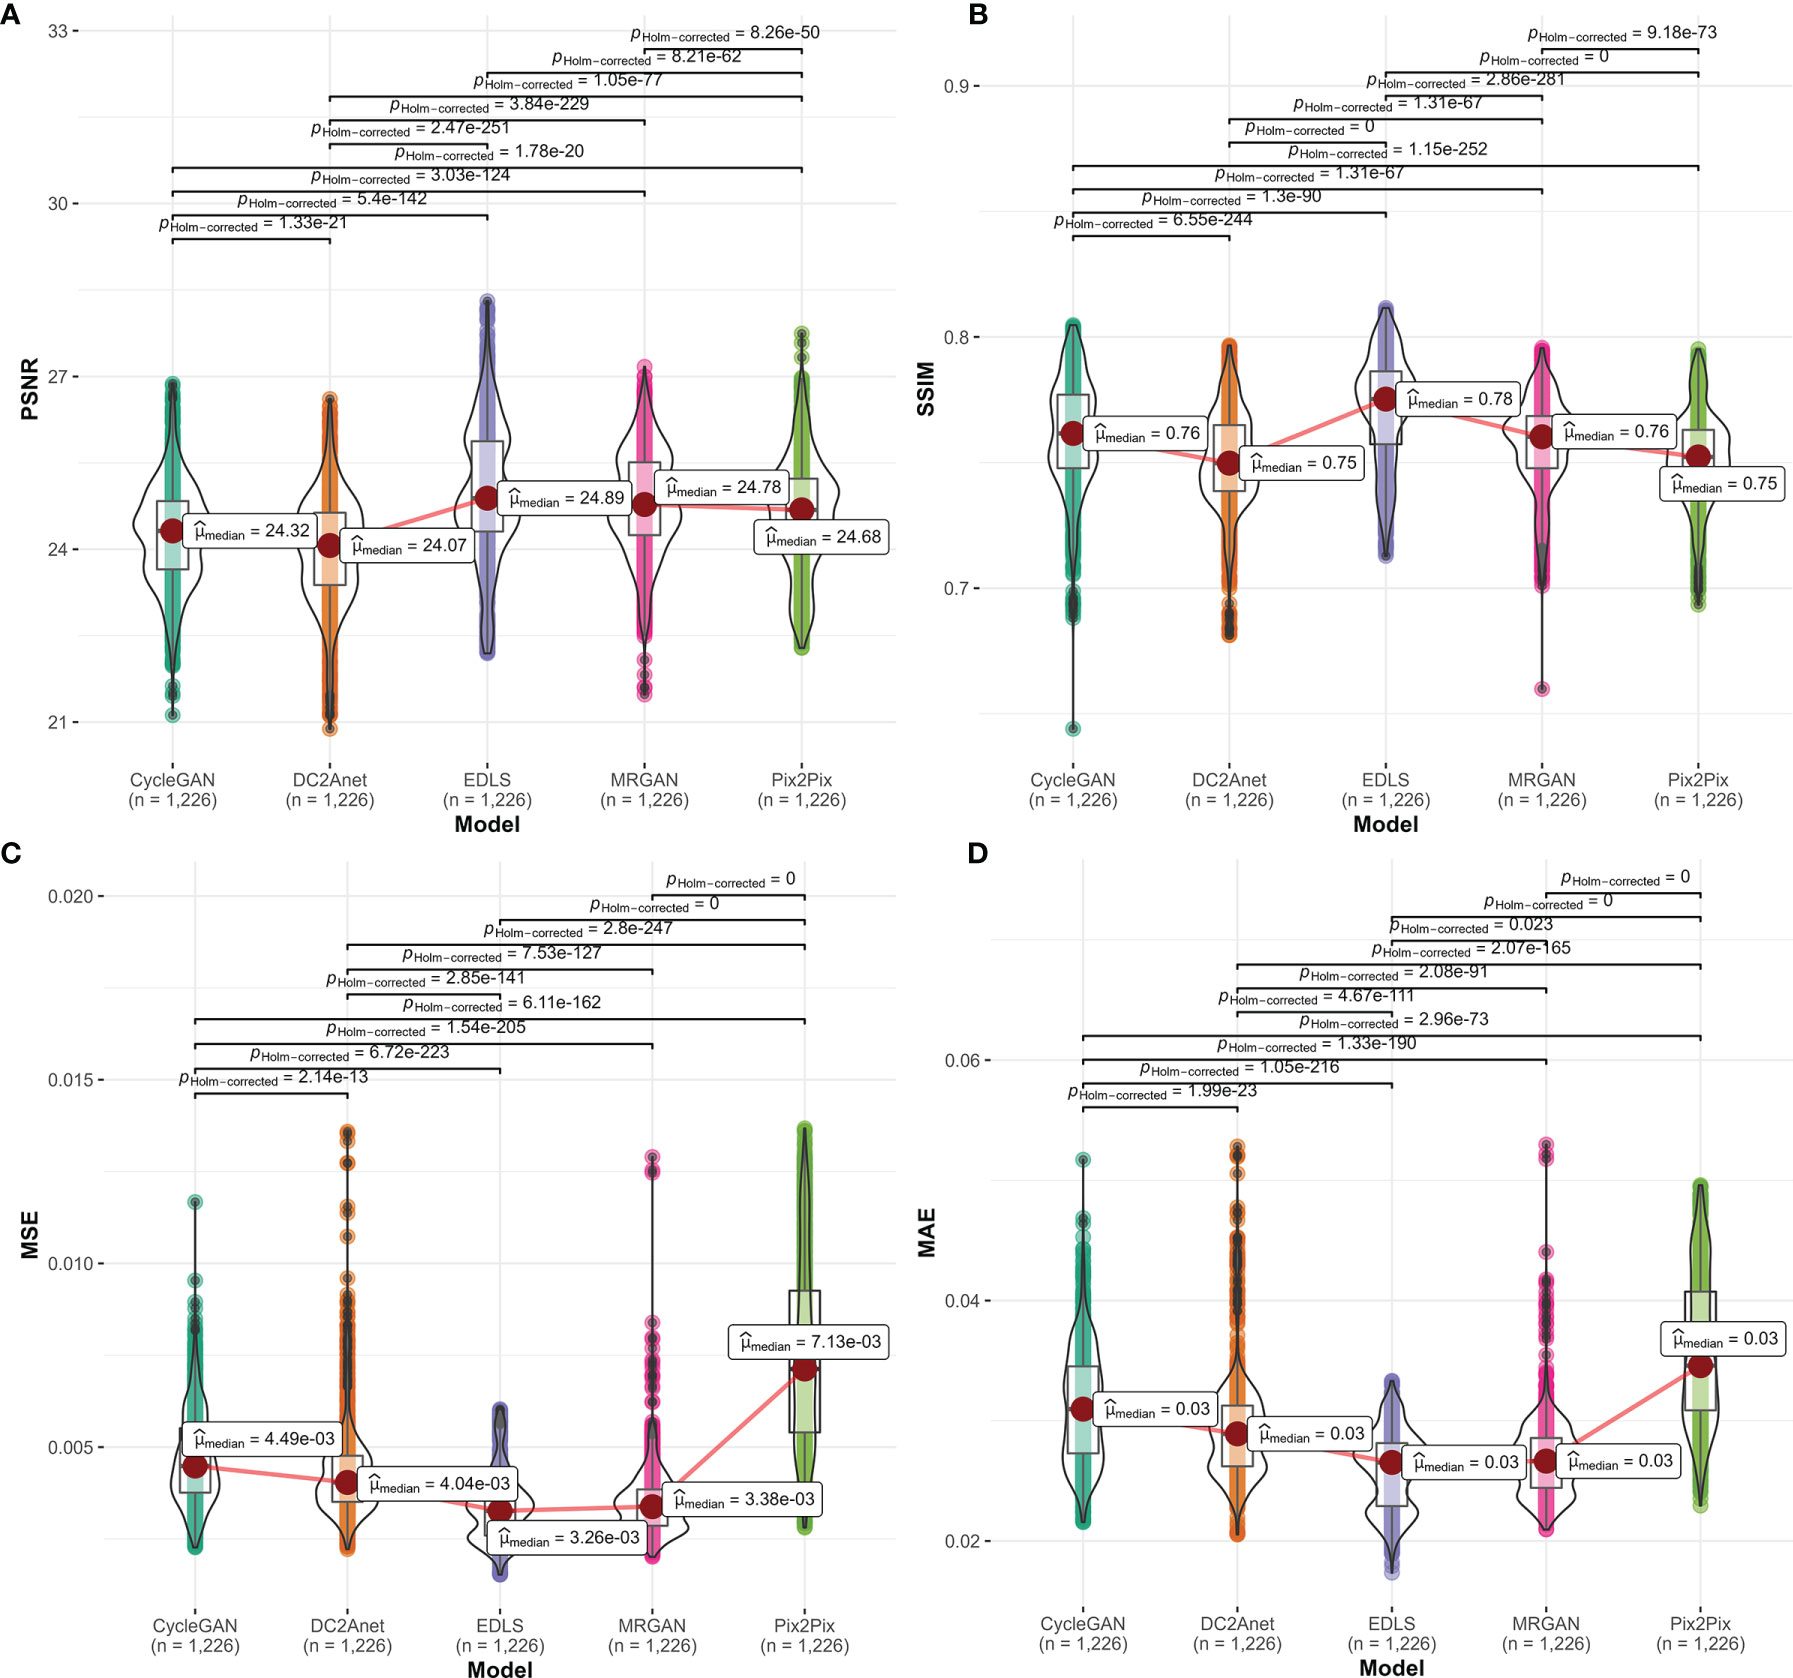
Figure 2 The comparison of the performance between our model and conventional models on (A) PSNR, (B) SSIM, (C) MSE, and (D) MAE metrics. From left to right, the violin plots with a median (orange line) respectively represented CycleGAN, DC2Anet, EDLS, MR-GAN, and Pix2Pix.
The results of PSNR, SSIM, MAE and MSE from the synthesized FP-Dyn sequences in 25 patients were shown in Supplementary Figure 1. The experimental results suggested that the EDLS model had the highest PSNR and SSIM (P<0.001), and had the lowest MAE and MSE (P<0.001), compared with the conventional models (Supplementary Figure 1).
Visual Evaluation Between the Synthesized and Original FP-Dyn Images
The 1226 synthesized FP-Dyn images and 1226 original FP-Dyn images were randomly put together. As seen in Table 1, one radiologist correctly identified images with 52.00% accuracy of 2452 images, and the precision rate for correctly identifying the original FP-Dyn image was 51.20% of 1226 images. In addition, each of the other two radiologists correctly identified images with 56.65% and 53.67% accuracy, and 54.35% and 52.71% precision.
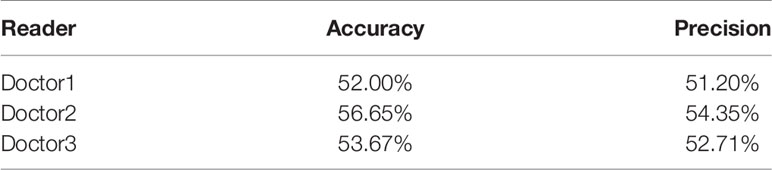
Table 1 The results of the visual evaluation between the synthesized and original FP-Dyn images.
Subjective Quality Evaluation of the Synthesized Images
Qualitative metrics for image quality evaluation were shown in Table 2. And there were no significant differences in subjective image quality scores among the three radiologists. Compared with the original FP-Dyn images, more than 99% of the synthesized images in the shape consistency were good, and the scores were 4 or 5. In addition, the contrast enhancement for synthesized images was also given high scores by the three radiologists. For example, more than 91% of synthesized FP-Dyn images got good scores of 4 or 5 points for great vessels and heart enhancement. And more than 75% of synthesized FP-Dyn images in gland enhancement got good scores of 4 or 5 points. Furthermore, from the evaluation results, we found that the synthesized images were effective for the suppression of motion artifacts.
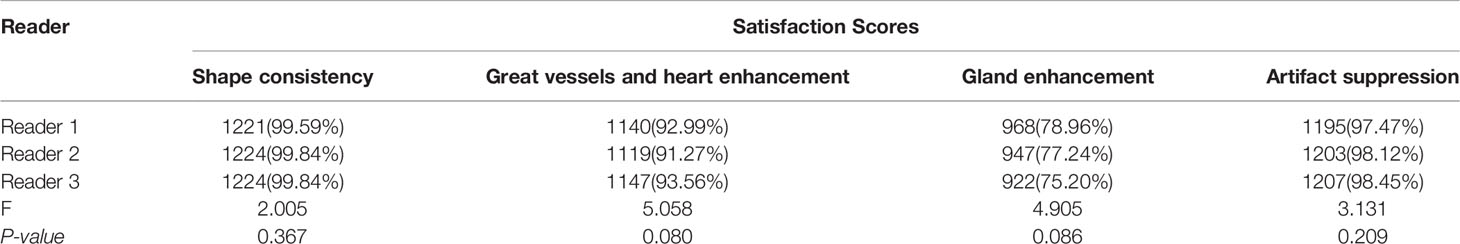
Table 2 The satisfaction results of the subjective scoring of synthesized FP-Dyn images.
In addition, Figure 3 showed an example of the input T1WI images, synthesized FP-Dyn images, original FP-Dyn images, and absolute error images. The absolute error images showed the absolute error between the synthesized FP-Dyn image and the original FP-Dyn image. We could clearly see that the EDLS model had been learning to identify tissues that had similar signal values in T1WI sequences, but had high signals in FP-Dyn sequences, such as tumor tissue, the heart, and great blood vessels. And the FP-Dyn image synthesized by the EDLS model was highly consistent with the original FP-Dyn image and had a similar enhancement in the lesion. However, the images synthesized by the CycleGAN model failed to effectively enhance the lesions. In addition, there were high background pixel errors from the FP-Dyn images which were synthesized by other models, compared with their original images.
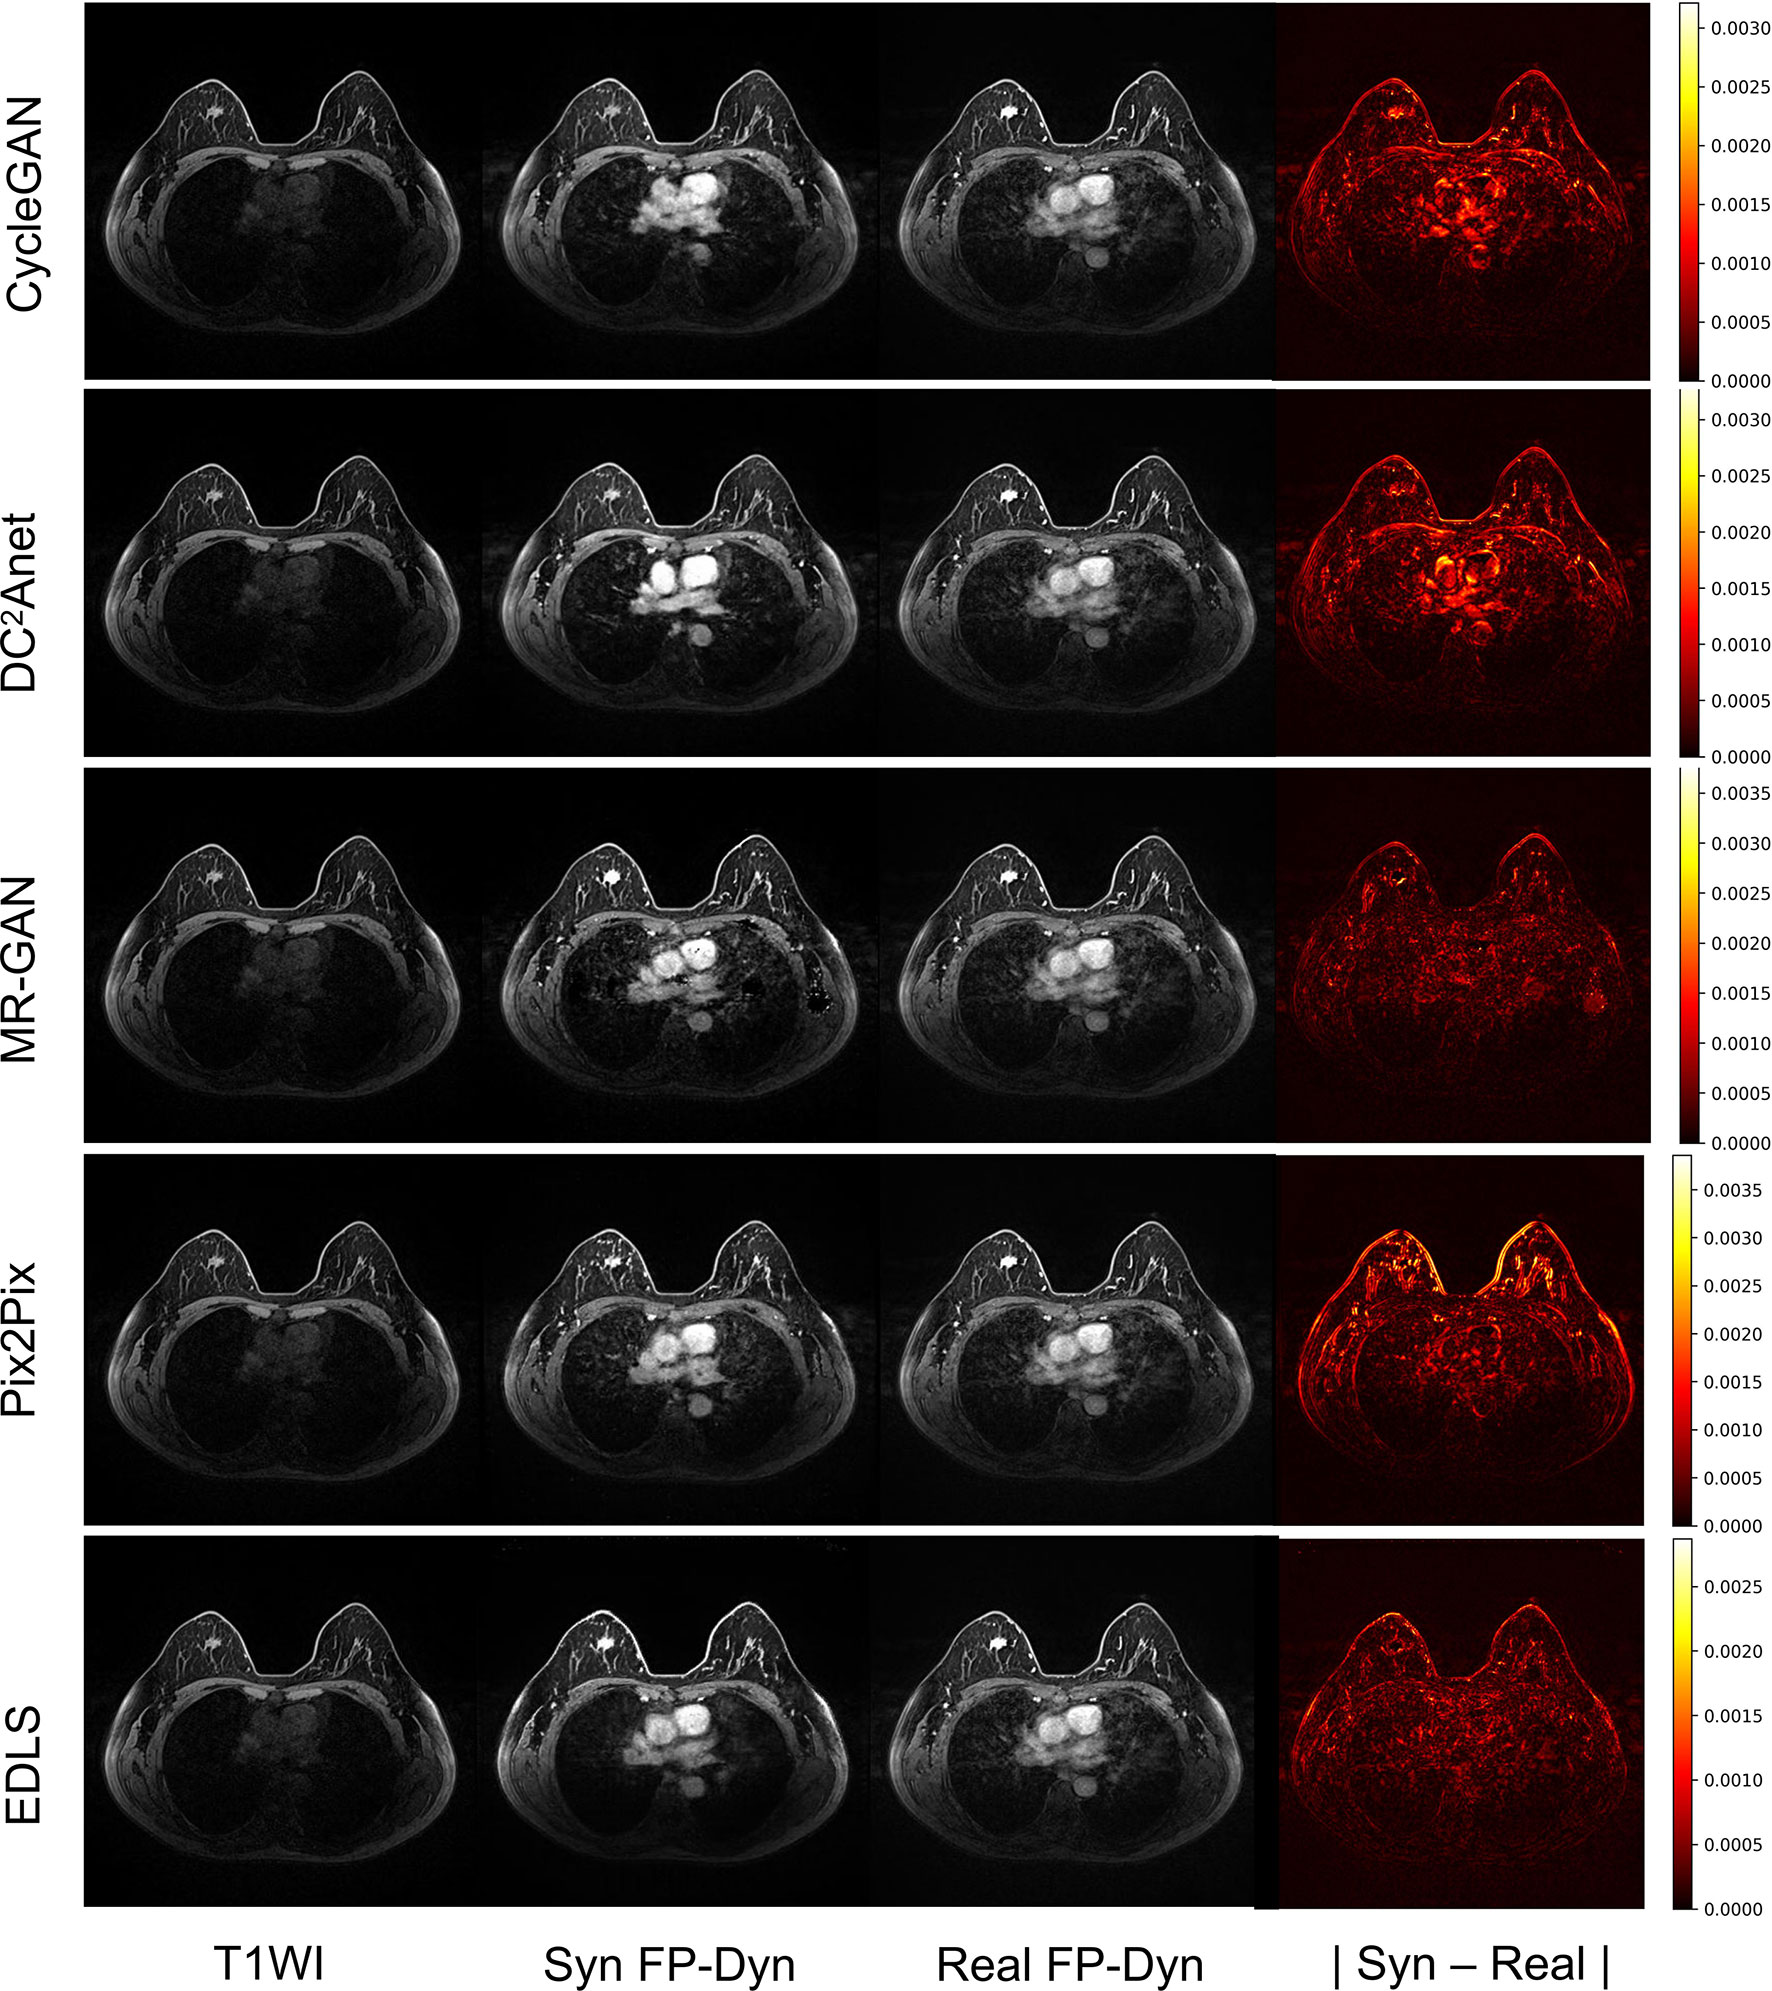
Figure 3 Sample images of the T1WI images, synthesized FP-Dyn images, original FP-Dyn images, and absolute error images. From left to right: T1WI breast MR images, synthesized FP-Dyn images, original FP-Dyn breast MRI, and absolute error images.
The Reconstruction Pixel Error of Synthesized Sequence
We further evaluated the reconstruction error of the synthesized FP-Dyn sequence on the validation set. From Figure 4, we could see that the synthesized FP-Dyn sequence images had a small reconstruction error compared with the original FP-Dyn sequence images. The average MAE on all sequences was 0.027 with a standard deviation of 0.004, and the average MSE on all sequences was 0.003 with a standard deviation of 0.001. In addition, some outliers of reconstruction errors were detected in the statistical boxplot. And we found there were some gland enhancements in the synthesized FP-Dyn images lower than in the original FP-Dyn images. It might be the major reason for the outliers of reconstruction errors in the boxplot.
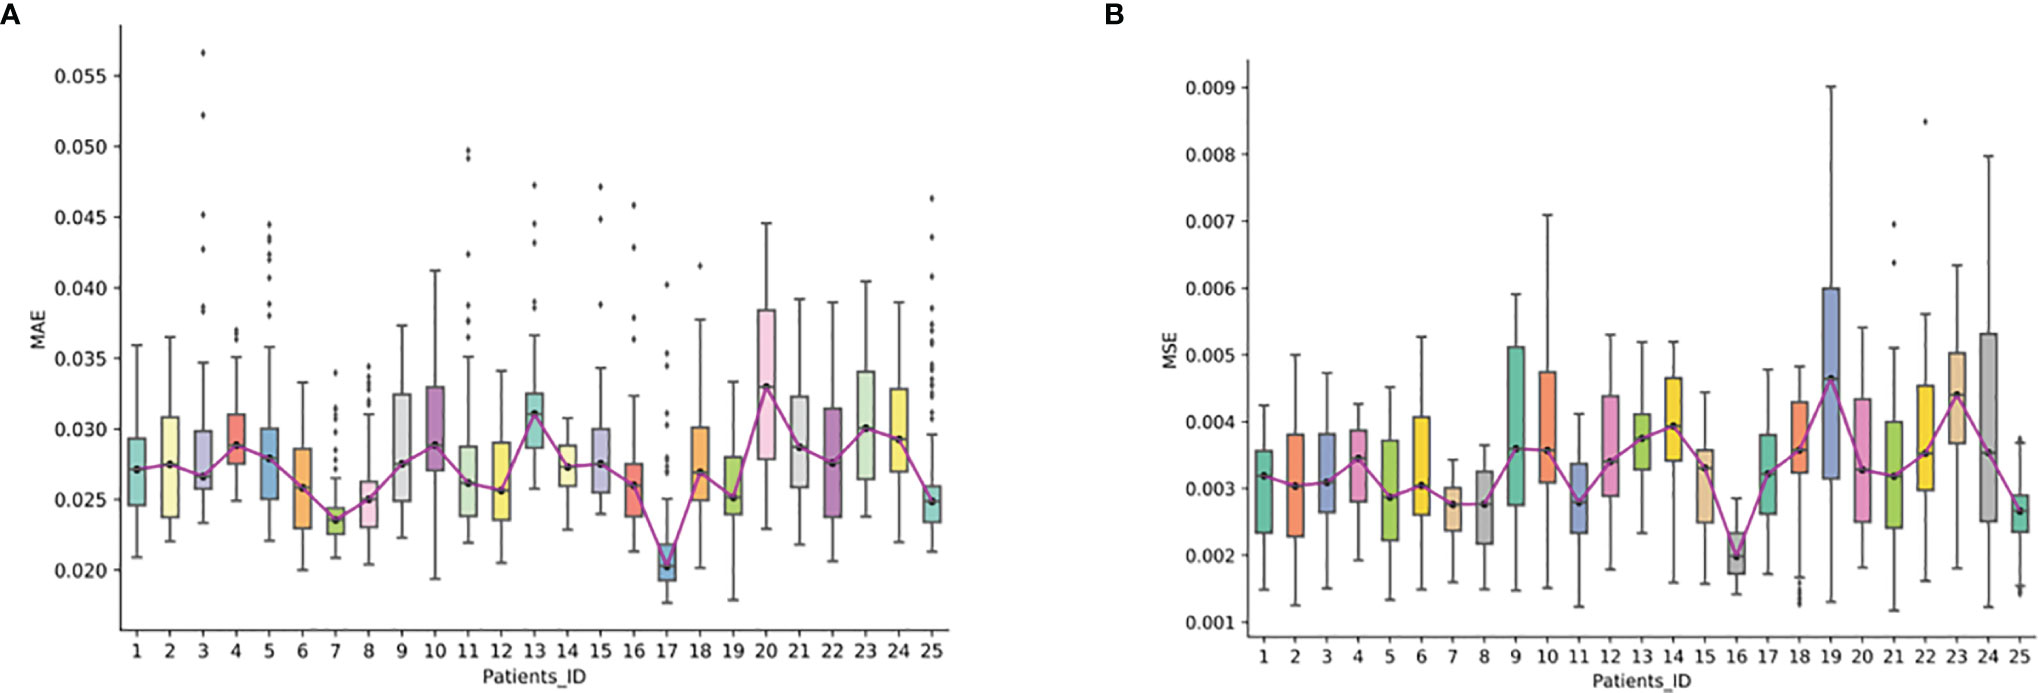
Figure 4 The reconstruction error in synthesized FP-Dyn sequence images. The box plot displayed the data distribution of MAE and MSE of a reconstructed image of the 25 patients, and each of the box plots displayed the data distribution of one patient. (A) displayed the data distribution of MAE of a reconstructed image of the 25 patients, (B) displayed the data distribution of MAE and MSE of a reconstructed image of the 25 patients.
In addition, we assessed the correlation between the synthesized FP-Dyn sequences and the original FP-Dyn sequences for each patient in the validation set, then an overall average for sequence correlations was calculated. Here, we found that there were high positive correlations between the synthesized FP-Dyn sequences and the original FP-Dyn sequences. The overall average of the correlations between the synthesized FP-Dyn sequences and the original FP-Dyn sequences was r = 0.927 ± 0.311 (95% CI: 0.927 to 0.928, P <0.001), (Supplementary Figure 2).
The Diagnostic Value of Synthesized Sequence
We collected a test set of 21 patients who underwent breast MRI examinations and with pathological examination results. Of 11 cases that were diagnosed as benign tumors, 1 case of chronic mastitis, 2 cases of benign epithelial hyperplasia, 2 cases of adenoids, 1 case of fibroadenoma, 1 case of fibroadenoma with adenopathy, 2 cases of fibroadenoma with benign epithelial hyperplasia, and 2 cases of invasive ductal carcinoma without cancer cells in pathology after radiotherapy. The remaining 10 patients had malignant lesions. Of 10 cases that were diagnosed as malignant lesions, 7 cases were non-specific invasive ductal carcinoma, 1 case was non-specific invasive ductal carcinoma with necrosis, and 2 cases were metastatic breast ductal carcinoma. Here, the patients were respectively diagnosed by three experienced breast radiologists using the three-reading mode. The three radiologists had high diagnosis consistency as measured by the Kappa test (Kappa = 0.688, P<0.001).
Based on pathology results, we counted the true-positive (TP), false-negative (FN), false-positive (FP), and true-negative (TN) values diagnosed by the three models, and then the sensitivity, specificity, PPV, and NPV values for each reading mode were then calculated, which were listed in Table 3. The sensitivity, specificity, PPV, and NPV of the three reading modes for breast cancer diagnosis were as follows. The reading mode (a) was 100%, 72.73%, 76.92%, and 100%, respectively. The reading mode (b) was 100%, 63.64%, 71.43%, 100%, respectively. The reading mode (c) was 100%, 72.73%, 76.92%, and 100%, respectively (Table 3).

Table 3 The diagnostic values of the synthesized FP-Dyn sequences for breast lesions.
Importantly, the reading mode (a) and reading mode (b) had the same diagnosis in 20 cases, accounting for 95.24%. The reading mode (a) and reading mode (c) had the same diagnosis results in 19 cases, which accounted for 90.48%. Each of the breast cancer cases both obtained a diagnosis with high BI-RADS scores (4 or 5) by three reading modes, respectively.
Discussion
In this study, we have developed a novel deep learning model, namely EDLS, for synthesizing the FP-Dyn sequence images, which aims to supplement the lack of enhanced images for breast MRI examinations without contrast agents, and then to ensure diagnostic accuracy, lower scanning time, less cost and higher security. The performance of the EDLS model has been verified and proved to be powerful by using two independent data sets, respectively. This result indicates that the EDLS could synthesize high-quality FP-Dyn sequence images, surpassing conventional GAN models. Of note, compared with the conventional models, the lesion enhancement information, edge loss function, and deep-supervision strategies are added to the EDLS model frame, which may be a major reason for the improvement of synthesized FP-Dyn images.
Notably, we found that the radiologists failed to effectively discriminate between the original FP-Dyn image and the synthesized FP-Dyn image because those images were visually similar. Moreover, the subjective evaluation results by the radiologists demonstrated that the synthesized images had similar details to the original images. And there was a low reconstruction pixel error of synthesized FP-Dyn sequence images. Based on those results, it can be concluded that the EDLS model could synthesize a realistic FP-Dyn sequence, which may be useful to compensate for the diagnosis information paucity in unenhanced MRI examinations.
The diagnostic value of synthesized FP-Dyn sequences should be more considered. Here, the patients were diagnosed by three reading modes, respectively, where reading mode (a) included T1WI, T2WI, DWI and the synthesized FP-Dyn sequence, mode (b) included T1WI, T2WI, DWI, and the originally scanned FP-Dyn sequence, and reading mode (c) included T1WI, T2WI, DWI, and the total phase of the scanned DCE sequences. Meaningfully, the specificity and PPV of the reading mode (a) was 72.73%, 76.92%, and was 63.64%, and 71.43% in the reading mode (b). The reading mode (a) had higher specificity and PPV than the reading mode (b). And it was important to note that with the reading mode (a), breast cancer diagnostic sensitivity, specificity, PPV, and NPV were achieved at equivalent levels to those of the reading mode (c). The results indicate that the synthesized FP-Dyn sequences have diagnostic value for breast lesions.
On one hand, synthesizing the FP-Dyn sequences is critical not only for reducing scanning time and cost, but also for effectively supplementing the lack of information in u-AB-MRI and avoiding the adverse reactions of contrast agents. We have demonstrated that the FP-Dyn sequences can be obtained by the EDLS model without the actual scan. According to our statistics, this MRI protocol acquisition time was substantially 10 to 15 minutes, compared with 25 to 30 minutes for the actual enhanced abbreviated MRI protocol, which can effectively reduce the scan time. A shorter scan time makes it easier for patients to undergo MRI examinations. Furthermore, intravenous access is not required in this MRI protocol, which reduces the cost and avoids the adverse reactions of contrast agents, compared with the full MRI protocol. In addition, the synthesized FP-Dyn sequence images exhibit high similarity to the original images and have diagnostic value for breast lesions, which can effectively supplement the lack of information in u-AB-MRI to ensure the breast MRI diagnosis accuracy. On the other hand, we found the synthesized FP-Dyn images had fewer respiratory motion artifacts than scanning images, which are caused by breathing, movement, and heartbeat that are inevitable during MRI scanning (31, 32). Similarly, Enhao Gong et al. (33) demonstrated that motion artifacts have been reduced in synthetic brain MRI images. Therefore, this method could also help to reduce image motion artifacts to improve the quality of MRI images. Besides, in future work, we plan to integrate this model into an existing platform for medical image processing, which can effectively save deployment and maintenance costs.
There were still several limitations to the current study. First, breast cancer is highly heterogeneous (34, 35), and has different imaging manifestations in different molecular types (36). In this study, we merely collected a relatively small dataset from the MAGNETOM Prisma 3.0T MRI scanner to train and test the EDLS model. Furthermore, in our study, an automatic threshold segmentation algorithm was used to binarize the subtracted T1WI-FP-Dyn MRI images to obtain a rough lesion label. Finally, the clinical application value of the EDLS model should be further verified in a prospective study. Meaningfully, we observed that the sensitivity and specificity for diagnosis were similar between synthesized and original FP-Dyn sequences. Thus, we will expand and collect data from multi-centers to improve the accuracy and universality of the model in the future. Meanwhile, the model will be retrained by the multiparametric sequences (T1WI, T2WI, DWI) to synthesize the DCE sequence images. Also, we plan to manually segment the lesion to ensure the accuracy of lesion enhancement. Most importantly, we will conduct a multi-center, prospective study to verify the clinical application value.
In summary, we proposed a novel deep learning model, i.e., the EDLS model, to synthesize FP-Dyn sequence images. We verified that the EDLS model could synthesize the realistic FP-Dyn sequence. Furthermore, the synthesized FP-Dyn sequence combined with an unenhanced protocol demonstrated a similar diagnostic value to the traditional full MRI examination. Compared with full MRI examinations, it may provide a promising idea to compensate for the paucity of information in unenhanced breast MRI examinations, and reduce cost and scanning time, while avoiding contrast agent allergy.
Data Availability Statement
The raw data supporting the conclusions of this article will be made available by the authors, without undue reservation.
Ethics Statement
The studies involving human participants were reviewed and approved by the Ethics Committee of the Xi’an International Medical Center Hospital. The patients/participants provided their written informed consent to participate in this study. Written informed consent was obtained from the individual(s) for the publication of any potentially identifiable images or data included in this article.
Author Contributions
BC and JY designed this study. PW and KZ collected the image data. PW and HW developed the EDLS model and the conventional GAN model. PN, YD, and LW carried out subjective assessments of synthesized FP-Dyn image quality and the diagnosis value. JW, RL, and PN independently discriminated between the synthesized and original FP-Dyn images. JR, JF, and HF contributed to data analysis. All authors contributed to manuscript writing and editing, and approved the final version of the manuscript for submission. In addition, all authors agree to be accountable for the content of the work.
Funding
This work was supported by the Key Research and Development Program of Shaanxi Province, the General Project of Social Development (2020SF-049), and the Xi’an Science and Technology Plan Project [20YXYJ0010 (5)].
Conflict of Interest
Author JR was employed by GE Healthcare China.
The remaining authors declare that the research was conducted in the absence of any commercial or financial relationships that could be construed as a potential conflict of interest.
Publisher’s Note
All claims expressed in this article are solely those of the authors and do not necessarily represent those of their affiliated organizations, or those of the publisher, the editors and the reviewers. Any product that may be evaluated in this article, or claim that may be made by its manufacturer, is not guaranteed or endorsed by the publisher.
Supplementary Material
The Supplementary Material for this article can be found online at: https://www.frontiersin.org/articles/10.3389/fonc.2021.792516/full#supplementary-material
References
1. Siegel RL, Miller KD, PhD AJD. Cancer Statistics, 2018. Cancer J Clin (2018) 68:7–30. doi: 10.3322/caac.21442
2. Sung H, Ferlay J, Siegel RL, Laversanne M, Soerjomataram I, Jemal A, et al. Global Cancer Statistics 2020: GLOBOCAN Estimates of Incidence and Mortality Worldwide for 36 Cancers in 185 Countries. CA Cancer J Clin (2021) 71:209–49. doi: 10.3322/caac.21492
3. Fusco R, Di Marzo M, Sansone C, Sansone M, Petrillo A. Breast DCE-MRI: Lesion Classification Using Dynamic and Morphological Features by Means of a Multiple Classifier System. Eur Radiol Exp (2017) 1:10–0. doi: 10.1186/s41747-017-0007-4
4. Kuhl CK, Strobel K, Bieling H, Leutner C, Schild HH, Schrading S. Supplemental Breast MR Imaging Screening of Women With Average Risk of Breast Cancer. Radiology (2017) 283:361–70. doi: 10.1148/radiol.2016161444
5. Lourenco AP, Donegan L, Khalil H, Mainiero MB. Improving Outcomes of Screening Breast MRI With Practice Evolution: Initial Clinical Experience With 3T Compared to 1.5T. J Magn Reson Imaging (2014) 39:535–9. doi: 10.1002/jmri.24198
6. Saslow D, Boetes C, Burke W, Harms S, Leach MO, Lehman CD, et al. American Cancer Society Guidelines for Breast Screening With MRI as an Adjunct to Mammography. CA Cancer J Clin (2007) 57:75–89. doi: 10.3322/canjclin.57.3.185
7. Monticciolo DL, Newell MS, Moy L, Niell B, Monsees B, Sickles EA. Breast Cancer Screening in Women at Higher-Than-Average Risk: Recommendations From the ACR. J Am Coll Radiol (2018) 15:408–14. doi: 10.1016/j.jacr.2017.11.034
8. Ramalho J, Ramalho M, Jay M, Burke LM, Semelka RC. Gadolinium Toxicity and Treatment. Magn Reson Imaging (2016) 34:1394–8. doi: 10.1016/j.mri.2016.09.005
9. Rose TA, Choi JW. Intravenous Imaging Contrast Media Complications: The Basics That Every Clinician Needs to Know. Am J Med (2015) 128:943–9. doi: 10.1016/j.amjmed.2015.02.018
10. Kuhl CK, Schrading S, Strobel K, Schild HH, Hilgers RD, Bieling HB. Abbreviated Breast Magnetic Resonance Imaging (MRI): First Postcontrast Subtracted Images and Maximum-Intensity Projection-a Novel Approach to Breast Cancer Screening With MRI. J Clin Oncol (2014) 32:2304–10. doi: 10.1200/JCO.2013.52.5386
11. Baltzer PAT, Bickel H, Spick C, Wengert G, Woitek R, Kapetas P, et al. Potential of Noncontrast Magnetic Resonance Imaging With Diffusion-Weighted Imaging in Characterization of Breast Lesions: Intraindividual Comparison With Dynamic Contrast- Enhanced Magnetic Resonance Imaging. Invest Radiol (2018) 53:229–35. doi: 10.1097/RLI.0000000000000433
12. Baltzer PA, Benndorf M, Dietzel M, Gajda M, Camara O, Kaiser WA. Sensitivity and Specificity of Unenhanced MR Mammography (DWI Combined With T2-Weighted TSE Imaging, Uemrm) for the Differentiation of Mass Lesions. Eur Radiol (2010) 20:1101–10. doi: 10.1007/s00330-009-1654-5
13. Goodfellow IJ, Pouget-Abadie J, Mirza M, Xu B, Warde-Farley D, Ozair S, et al. Generative Adversarial Networks. Adv Neural Inf Process Syst (2014) 3:2672–80. doi: 10.1145/3422622
14. Yi X, Walia E, Babyn P. Generative Adversarial Network in Medical Imaging: A Review. Med Image Anal (2019) 58:101552. doi: 10.1016/j.media.2019.101552
15. Kazeminia S, Baur C, Kuijper A, Ginneken R, Navab N, Albarqouni S, et al. Gans for Medical Image Analysis. Artif Intell Med (2020) 109:101938. doi: 10.1016/j.artmed2020.101938
16. Nie D, Trullo R, Lian J, Petitjean C, Ruan S, Wang Q, et al. Medical Image Synthesis With Context-Aware Generative Adversarial Networks. In: Medical Image Computing and Computer Assisted Intervention-MICCAI 2017. Springer, Cham, Switzerland (2017) 10435:417–25. doi: 10.1007/978-3-319-66179-7_48
17. Wolterink JM, Dinkla AM, Savenije MHF, Seevinck PR, van den Berg CAT, Isgum I. Deep MR to CT Synthesis Using Unpaired Data. In: International Workshop on Simulation and Synthesis in Medical Imaging. Springer, Cham, Switzerland (2017) 10557:14–23. doi: 10.1007/978-3-319-68127-
18. Arjovsky M, Chintala S, Bottou L. Wasserstein Generative Adversarial Networks. In: Proceedings of the 34th International Conference on Machine Learning. PMLR (2017) 5:214-23.
19. Johnson J, Alahi A, Fei-Fei L. Perceptual Losses for Original-Time Style Transfer and Super- -Resolution, In: European Conference on Computer Vision. Springer, Cham, Switzerland (2016) 10:694-711. doi:10.1007/978-3-319-46475-6_43
20. Hiasa Y, Otake Y, Takao M, Matsuoka T, Takashima K, Carass A, et al. Cross-Modality Image Synthesis from Unpaired Data Using CycleGAN. In: Simulation and Synthesis in Medical Imaging. SASHIMI. Lecture Notes in Computer Science. Springer, Cham (2018) 11037:31-41. doi:10.1007/978-3-030-00536-8_4
21. Schaefferkoetter J, Yan J, Moon S, Chan R, Ortega C, Metser U, et al. Deep Learning for Whole-Body Medical Image Generation. Eur J Nucl Med Mol Imaging (2021) 10:1–10. doi: 10.1007/s00259-021-05413-0
22. Liang J, Zeng S, Li Z, Kong Y. Intravoxel Incoherent Motion Diffusion-Weighted Imaging for Quantitative Differentiation of Breast Tumors: A Meta-Analysis. Front Oncol (2020) 10:585486. doi: 10.3389/fonc.2020.585486
23. Prasad AS, Heechan Y, Hyongsuk K. Learning Semantic Graphics Using Convolutional Encoder-Decoder Network for Autonomous Weeding in Paddy. Front Plant Sci (2019) 10:1404. doi: 10.3389/fpls.2019.01404
24. Hongliang H, Chi Z, Jie C, Ruizhe G, Luyang C, Yongsheng L, et al. A Hybrid-Attention Nested Unet for Nuclear Segmentation in Histopathological Images. Front Mol Biosci (2021) 8:614174. doi: 10.3389/fmolb.2021.614174
25. Zhu J-Y, Park T, Isola P, Efros AA. Unpaired Image-to-Image Translation Using Cycle-Consistent Adversarial Networks. In: 2017 IEEE International Conference on Computer Vision (ICCV). IEEE, Piscataway, NJ (2017). p. 2242–51. doi: 10.1109/ICCV.2017.244
26. Jin C-B, Kim H, Liu M, Han IH, Cui X. DC2Anet: Generating Lumbar Spine MR Images From CT Scan Data Based on Semi-Supervised Learning. Appl Sci (2019) 9:2521–45. doi: 10.3390/app9122521
27. Jin CB, Kim H, Liu M, Jung W, Cui X. Deep CT to MR Synthesis Using Paired and Unpaired Data. Sensors (2019) 19:2361–72. doi: 10.3390/s19102361
28. Isola P, Zhu JY, Zhou T, Efros AA. Image-to-Image Translation With Conditional Adversarial Networks. In: 2017 IEEE Conference on Computer Vision and Pattern Recognition (CVPR). IEEE, Piscataway, NJ (2017). p. 5967–76. doi: 10.1109/CVPR.2017.632
29. Wang Z, Bovik AC, Sheikh HR, Simoncelli EP. Image Quality Assessment: From Error Visibility to Structural Similarity. IEEE Trans Image Process (2004) 13:600–12. doi: 10.1109/TIP.2003.819861
30. Wang C, Yang G, Papanastasiou G, Tsaftaris SA, Newby DE, Gray C, et al. Dicyc: GAN-Based Deformation Invariant Cross-Domain Information Fusion for Medical Image Synthesis. Inf Fusion (2021) 67:147–60. doi: 10.1016/j.inffus.2020.10.015
31. Lavasani SN, Mostaar A, Ashtiyani M. Automatic Prostate Cancer Segmentation Using Kinetic Analysis in Dynamic Contrast-Enhanced MRI. J Biomed Phys Eng (2018) 8:107–16. doi: 10.22086/jbpe.v0i0.555
32. Dewey M, Schink T, Dewey CF. Claustrophobia During Magnetic Resonance Imaging: Cohort Study in Over 55,000 Patients. J Magnetic Resonance Imaging (2010) 26:1322–7. doi: 10.1002/jmri.21147
33. Gong E, Pauly JM, Wintermark M, Zaharchuk G. Deep Learning Enables Reduced Gadolinium Dose for Contrast-Enhanced Brain MRI. J Magn Reson Imaging (2018) 48:330–40. doi: 10.1002/jmri.25970
34. Keung MYT, Wu Y, Vadgama JV. PARP Inhibitors as a Therapeutic Agent for Homologous Recombination Deficiency in Breast Cancers. J Clin Med (2019) 8:435. doi: 10.3390/jcm8040435
35. Li H, Zhu Y, Burnside ES, Huang E, Drukker K, Hoadley KA, et al. Quantitative MRI Radiomics in the Prediction of Molecular Classifications of Breast Cancer Subtypes in the TCGA/TCIA Data Set. NPJ Breast Cancer (2016) 2:16012. doi: 10.1038/npjbcancer.2016.12
Keywords: generative adversarial network (GAN), images synthesis, breast cancer, deep learning, magnetic resonance imaging (MRI)
Citation: Wang P, Nie P, Dang Y, Wang L, Zhu K, Wang H, Wang J, Liu R, Ren J, Feng J, Fan H, Yu J and Chen B (2021) Synthesizing the First Phase of Dynamic Sequences of Breast MRI for Enhanced Lesion Identification. Front. Oncol. 11:792516. doi: 10.3389/fonc.2021.792516
Received: 11 October 2021; Accepted: 15 November 2021;
Published: 07 December 2021.
Edited by:
Po-Hsiang Tsui, Chang Gung University, TaiwanReviewed by:
Vishnuvarthanan Govindaraj, Kalasalingam University, IndiaWeiwei Zong, Henry Ford Health System, United States
Copyright © 2021 Wang, Nie, Dang, Wang, Zhu, Wang, Wang, Liu, Ren, Feng, Fan, Yu and Chen. This is an open-access article distributed under the terms of the Creative Commons Attribution License (CC BY). The use, distribution or reproduction in other forums is permitted, provided the original author(s) and the copyright owner(s) are credited and that the original publication in this journal is cited, in accordance with accepted academic practice. No use, distribution or reproduction is permitted which does not comply with these terms.
*Correspondence: Baoying Chen, chenby128@163.com; Jun Yu, pclamper@nwu.edu.cn