 Wanli Zhang1,2†
 Ruimeng Yang1,2†
 Fangrong Liang3
 Guoshun Liu1,2
 Amei Chen1,2
 Hongzhen Wu1,2
 Shengsheng Lai4
 Wenshuang Ding5
 Xinhua Wei1,2
 Xin Zhen3*
 Xinqing Jiang1,2*
- 1Department of Radiology, Guangzhou First People’s Hospital, Guangzhou Medical University, Guangzhou, China
- 2Department of Radiology, Guangzhou First People’s Hospital, School of Medicine, South China University of Technology, Guangzhou, China
- 3School of Biomedical Engineering, Southern Medical University, Guangzhou, China
- 4School of Medical Equipment, Guangdong Food and Drug Vocational College, Guangzhou, China
- 5Department of Pathology, Guangzhou First People’s Hospital, School of Medicine, South China University of Technology, Guangzhou, China
Objective: To investigate microvascular invasion (MVI) of HCC through a noninvasive multi-disciplinary team (MDT)-like radiomics fusion model on dynamic contrast enhanced (DCE) computed tomography (CT).
Methods: This retrospective study included 111 patients with pathologically proven hepatocellular carcinoma, which comprised 57 MVI-positive and 54 MVI-negative patients. Target volume of interest (VOI) was delineated on four DCE CT phases. The volume of tumor core (Vtc) and seven peripheral tumor regions (Vpt, with varying distances of 2, 4, 6, 8, 10, 12, and 14 mm to tumor margin) were obtained. Radiomics features extracted from different combinations of phase(s) and VOI(s) were cross-validated by 150 classification models. The best phase and VOI (or combinations) were determined. The top predictive models were ranked and screened by cross-validation on the training/validation set. The model fusion, a procedure analogous to multidisciplinary consultation, was performed on the top-3 models to generate a final model, which was validated on an independent testing set.
Results: Image features extracted from Vtc+Vpt(12mm) in the portal venous phase (PVP) showed dominant predictive performances. The top ranked features from Vtc+Vpt(12mm) in PVP included one gray level size zone matrix (GLSZM)-based feature and four first-order based features. Model fusion outperformed a single model in MVI prediction. The weighted fusion method achieved the best predictive performance with an AUC of 0.81, accuracy of 78.3%, sensitivity of 81.8%, and specificity of 75% on the independent testing set.
Conclusion: Image features extracted from the PVP with Vtc+Vpt(12mm) are the most reliable features indicative of MVI. The MDT-like radiomics fusion model is a promising tool to generate accurate and reproducible results in MVI status prediction in HCC.
Introduction
Hepatocellular carcinoma (HCC), is the fifth most common cancer and third leading cause of cancer-related death worldwide (1). Despite advancements in medical technology leading to great achievements in the treatment of HCC, the prognosis of HCC remains poor, with a 5-year recurrence rate of 70% with hepatectomy and 35% following liver transplantation (2–4). Microvascular invasion (MVI) is defined as the presence of tumor cells in portal veins, large capsule vessels, or in the vascular space lined by endothelial cells (5, 6). Evidence has shown that MVI is an independent predictor of recurrence and poor outcome following surgical hepatic resection (4, 7–9).
Currently, pathological examination is the gold standard for identifying MVI of HCC following operation or biopsy collection. This approach, however, is unreliable in case of sample contamination or for ineffectively done preoperative needle biopsies due to intratumoral heterogeneity (10). Furthermore, needle biopsy may increase the risks of unintended tumor bleeding or implantation metastasis (11). Therefore, there is a pressing demand for an accurate and non-invasive method for early prediction of MVI.
To date, the identified clinical indicators of MVI include: Alpha-fetoprotein (AFP), prothrombin induced by vitamin K absence or antagonist II (PIVKA-II), and other serological markers (12). However, the prediction performances of these markers were unsatisfactory due to poor sensitivity and specificity. Morphological and imaging characteristics such as large tumor size, unsmooth tumor margins, multinodular tumor morphology, rim enhancement on the arterial phase, and peritumoral hypointensity on the hepatobiliary phase of Gadolinium-exthoxybenzyl-diethylenetriamine-pentaacetic (Gd-EOB-DTPA)–enhanced MRI, have also been associated with the presence of MVI (13–18). These characteristics, on the other hand, are easily prone to inter-observer variations (19), as evidenced by the inconsistent interpretations of the conventional CT/MRI images for MVI prediction in previous studies (20, 21).
Radiomics is a new method for disease diagnosis and prognosis prediction. Radiomics have exhibited great potential in predictive/discriminative models by integrating disease-related imaging features with clinical, pathological, and genetic data (22–24). Progress has been made in applying CT or MRI based radiomics for investigating MVI in HCC (25–28). However, most studies only included a single phase of dynamic contrast-enhanced (DCE)-CT or MRI. Exclusion of the other phases is likely to omit useful information which may impair MVI prediction. Also, research has focused mainly on the intratumoral region. Therefore, key image information beyond the tumor core might be lost since MVI often occurs in regions neighboring the tumor/non-tumor interface (6, 29). Image texture from the peripheral liver parenchyma, such as a settled 5mm or 10mm distance from the tumor edge, have shown encouraging predictive ability in MVI (26, 28, 30). To our knowledge, no study has comprehensively reported on MVI predictive performances using different combinations of DCE-CT/MRI phase(s) with varying distances from the tumor margin.
Predictive performance is also closely related to the prediction model (or classifier) used. Different classifiers are built on different mathematical models and thus generate inconsistent performances with the same classification task (31). An ensemble of classifiers, a process analogous to disease diagnosis by a multi-disciplinary team (MDT), produces more reliable and accurate predictions compared with a single classifier (32–34). This study hypothesizes that this principle also applies with the fusion of various predictive models to yield enhanced and reproducible performance in MVI prediction.
The main study objective was to investigate the performance of radiomics analysis for MVI prediction in HCC. This study also aimed to identify the predominant phase(s) and the most relevant tumor periphery range for MVI prediction using noninvasive DCE-CT. Miscellaneous predictive models are established by considering different combinations of phases, tumor peripheral margins, feature selection methods and classifiers. The predictive performances of each model, as well as the final fusion model obtained through a multi-disciplinary team (MDT)-like fusion method, were to be explored.
Materials and Methods
Patient Cohort
This study was approved by the Institutional Review Board of Guangzhou First People’s Hospital and the requirement for informed consent was waived based on the nature of a retrospective study. A total of 212 patients who underwent preoperative DCE-CT for newly diagnosed HCC from January 2016 to April 2020 at Guangzhou First People’s Hospital were considered for inclusion in the study. The inclusion criteria were: 1) Pathologically confirmed HCC; 2) preoperative quadriphasic DCE-CT performed, and 3) complete preoperative lab tests. The exclusion criteria were: 1) Patients who had received anticancer therapy including chemoembolization, radiofrequency ablation, or transcatheter arterial chemoembolization (n=98); and 2) time interval between DCE-CT scan and surgery of more than two weeks (n=3). Finally, a total of 111 HCC patients (MVI positive: n=57 and MVI negative: n=54) were enrolled in this study.
The clinical considerations included: Presence or absence of cirrhosis, hepatitis B or C immunology. While the preoperative tests carried out included: alpha-AFP level, white blood cell (WBC) count, red blood cell (RBC) count, neutrophil count, hemoglobin (Hb) level, serum albumin (ALB), platelet count (PLT), prothrombin time (PT), international normalized ratio (INR), aspartate aminotransferase (AST), serum alanine aminotransferase (ALT), conjugated bilirubin (CB), serum total bilirubin (TB), serum creatinine (Scr), serum alkaline phosphatase (ALP), and determination of Child-Pugh class.
Imaging and Histopathology
Preoperative DCE-CT were performed on multiple scanners with four phases following intravenous injection of the contrast agent, including phase 1- early arterial phase (EAP), 18-25 s; phase 2- late arterial phase (LAP), 35-40 s; phase 3- portal venous phase (PVP), 50-60 s; and phase 4- equilibrium phase (EP) 120-250 s. The detailed imaging parameters are shown in the Supplementary Materials.
All surgical specimens were examined by one pathologist (W.S. Ding, with 14 years of experience in pathological diagnosis of hepatocellular carcinoma) to confirm the MVI status of the resected tumor.
The Volume of Interest Delineation
All images in each phase were stored in DICOM format and anonymized. Delineation of the target volume of interest (VOI) was performed by the ITK-SNAP software (http://www.itksnap.org) on the CT images slice-by-slice on phases 1- 4 (Figure 1). Visible tumor margins were first manually delineated to obtain the volume of tumor core (Vtc). This procedure was conducted by two investigators (W.L Zhang and R.M Yang, with 4 and 15 years of experience in radiological diagnosis, respectively) who lacked prior knowledge of the patients’ MVI status. The conformity of delineated VOIs was measured by the Dice similarity coefficient. The two delineated VOIs with Dice index greater than 0.9 were averaged to yield the final VOI. Discrepancies on the lesion boundary (Dice < 0.9) were resolved by further discussions until mutual consensus were reached. The Vtc was then extended to different distances (2; 4; 6; 8; 10; 12; 14mm) from the tumor margin, to obtain seven VOIs of the tumor periphery (Vpt), which were automatically generated with a morphological dilation algorithm. This process was not entirely isotropic as the expansion would stop on encountering large vessels (vessel caliber ≥2mm), bile ducts, or liver margin. All the manual steps allowed slight adjustment to acquire tailored VOIs for each phase. The VOI delineation was performed on the largest lesion for patients with multiple lesions.
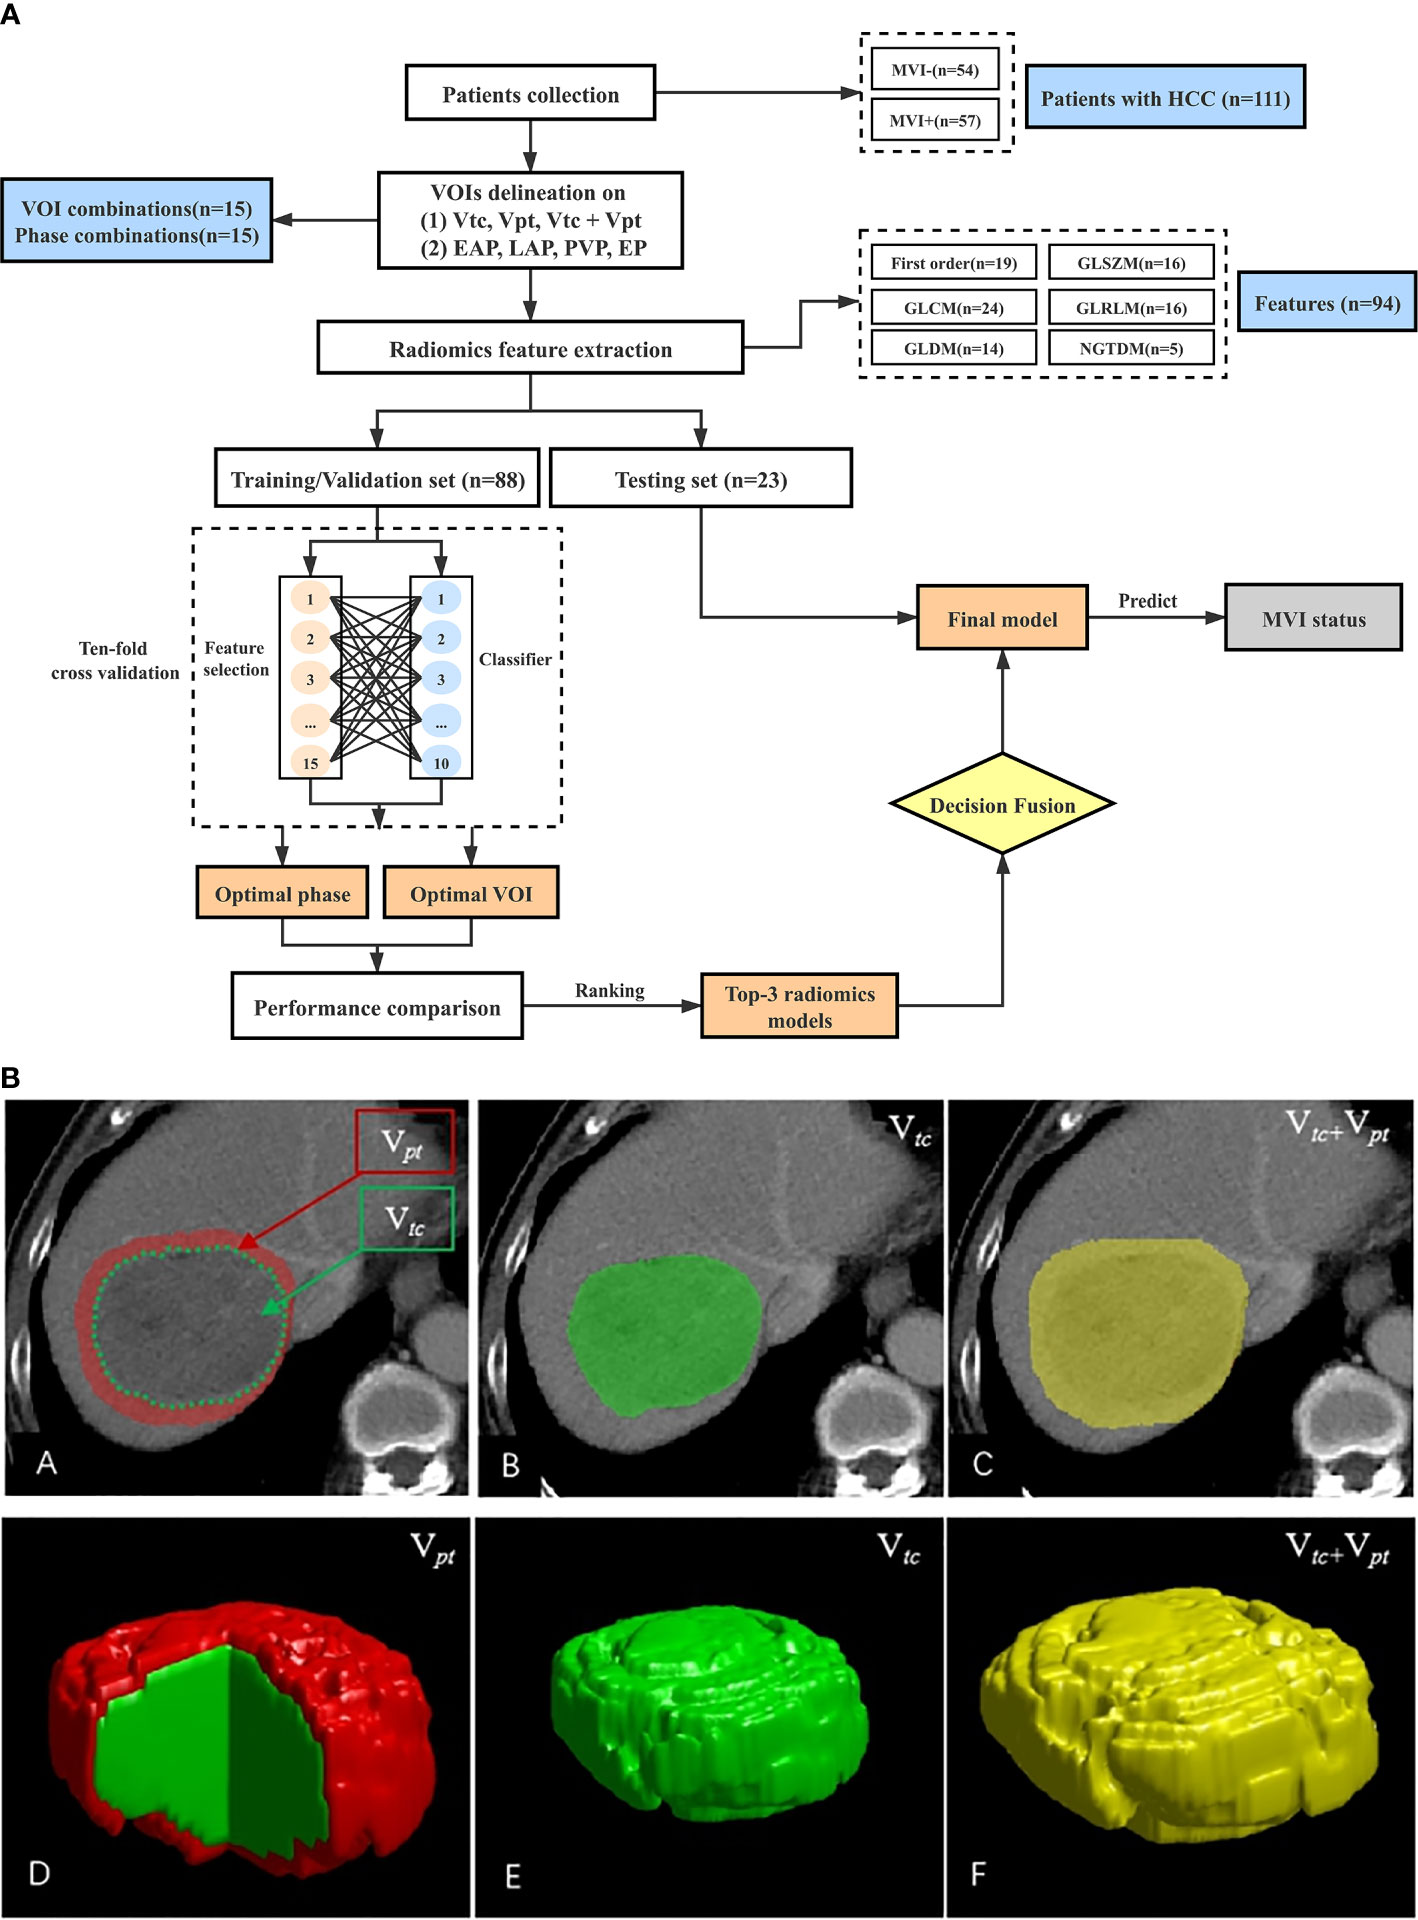
Figure 1 (A) Study workflow. (B) Lesion VOIs delineation illustrated in 2D (first row) and 3D (second row). The Vtc (green) is the tumor core; the Vpt (red) is the peritumor region at a given distance (2; 4; 6; 8; 10; 12; 14 mm) away from the tumor margin; the Vtc + Vpt (yellow) is the combination region of Vtc and Vpt. Vtc, volume of tumor core; Vpt, peripheral tumor regions; Vtc + Vpt, combination of Vtc and Vpt.
Radiomics Feature Extraction and Analysis
Radiomic features were extracted from each VOI using an open-source python package Pyradiomics (https://pyradiomics.readthedocs.io/en/latest/index.html). There were 94 features in total extracted from the candidate features set including: 1) First order features (n=19); 2) gray level co-occurrence matrix (GLCM) features (n=24); 3) gray level size zone matrix (GLSZM) features (n=16); 4) gray level run length matrix (GLRLM) features (n=16); 5) neighboring gray-tone difference matrix (NGTDM) features (n=5); and 6) gray level dependence matrix (GLDM) features (n=14). Please refer to the Pyradiomics documentation (32–34) for their detailed definitions. Feature extractions were performed on each of the four phases, and the corresponding obtained features were combined and categorized into four groups:
1. group 1: features from each phase, termed as (n=94 features for each of the four types);
2. group 2: concatenated features of any two phases, (n=188 features for each of the six types);
3. group 3: concatenated features of any three phases, (n=282 features for each of the four types);
4. group 4: concatenated features of all four phases, (n=376 features) (31).
This resulted in a total of 15 types (4 + 6 + 4 + 1) of different combinations of features, which then served as the input for a specific predictive model.
Multi-Disciplinary Team-Like Prediction Modeling
The patient samples were divided chronologically into a training/validation set (n = 88) and an independent testing set (n = 23). In this research, a typical prediction model was developed on a feature selection strategy and a classifier, and was then cross-validated by a tenfold cross-validation (CV) using the training/validation set (90% training, 10% validation). In each step of the ten-fold CV, a specific feature selection method screened out an optimal subset of the features to train a particular classifier. Fifteen feature selection methods and ten classifiers were investigated and their possible combinations resulted in 150 different prediction models.
The 15 types of features were extracted from different combinations of VOIs (Vtc, Vpt or Vtc +Vpt, note here Vpt is obtained with seven different tumor periphery distances), and then were fed into each of the above mentioned 150 models. We yield totally 33750 (15×150×(1 + 7+7)) models to be compared on the training/validation set. The predictive powers of all the evaluated models were quantified by the area under the receiver operating characteristic (ROC) curve (AUC), accuracy (ACC), sensitivity (SEN), and specificity (SPE).
The best phase and Vpt for MVI status prediction were determined by comparing the AUC values. The top-3 ranked models were identified by ten-fold CV on the training/validation set from the best phase and Vpt. These top-3 ranked models were then fused by two fusion methods, i.e., the plurality voting (PV) and the weighted fusion (WF), to generate the final model that was then verified on the independent testing set.
Each of the top-3 predictive models was regarded as a clinical specialist providing a prediction of MVI. The PV gives a consensus prediction based on the highest number of votes. PV counts the number of decisions for each class and assigns the sample xi to class yg which obtained the highest number of votes. All the classifiers have the same weight regardless of their respective abilities pertaining to effective classification. The final prediction result is calculated as , where the is the i-th classifier ci output on the j-th class yg and L is the number of classifiers. Simply, the PV treats each vote with equal weight, to assume that each specialist has an equal contribution to the final prediction. While the WF assigns different weights to each classifier and integrates the classification results by a linear weighted summl: , where wi is the assigned weight to classifier ci(x) satisfying wi > 0 and . In this paper, the wi is calculated based on the validation accuracy acci of the i-th classifier computed during the training stage:
The gain from model fusion was assessed by the metric: Net Reclassification Improvement (NRI), which is a quantitative measure for evaluating improvements in risk predictions from diagnostic tests and prediction models (Supplementary Materials) (35, 36).
Statistical Analysis
All statistical analyses were conducted using the SPSS 25.0 software (IBM SPSS Corporation, USA) and python 3.6.2 (Python Software Foundation (USA, https://www.python.org/downloads/). Baseline patient characteristics were analyzed via univariate analysis. The categorical variables were presented as numbers and proportions and analyzed via the Chi-square test. Two-sided p values less than 0.05 were considered statistically significant. Comparisons between the 15 feature types were conducted using independent samples Kruskal-Wallis test with Bonferroni correction for adjusting for significant level in pairwise comparison.
Results
Demographics
The study cohort comprised of 57 MVI-positive and 54 MVI-negative patients who met the inclusion criteria. No statistically significant differences were seen in age, sex, presence of cirrhosis, hepatitis B and C virus infection, serum AFP, WBC, RBC, neutrophil count, Hb, ALB, PLT, PT, INR, AST, ALT, CB, TB, Scr, ALP, and Child-Pugh class in the training/validation and independent testing set (Table 1).
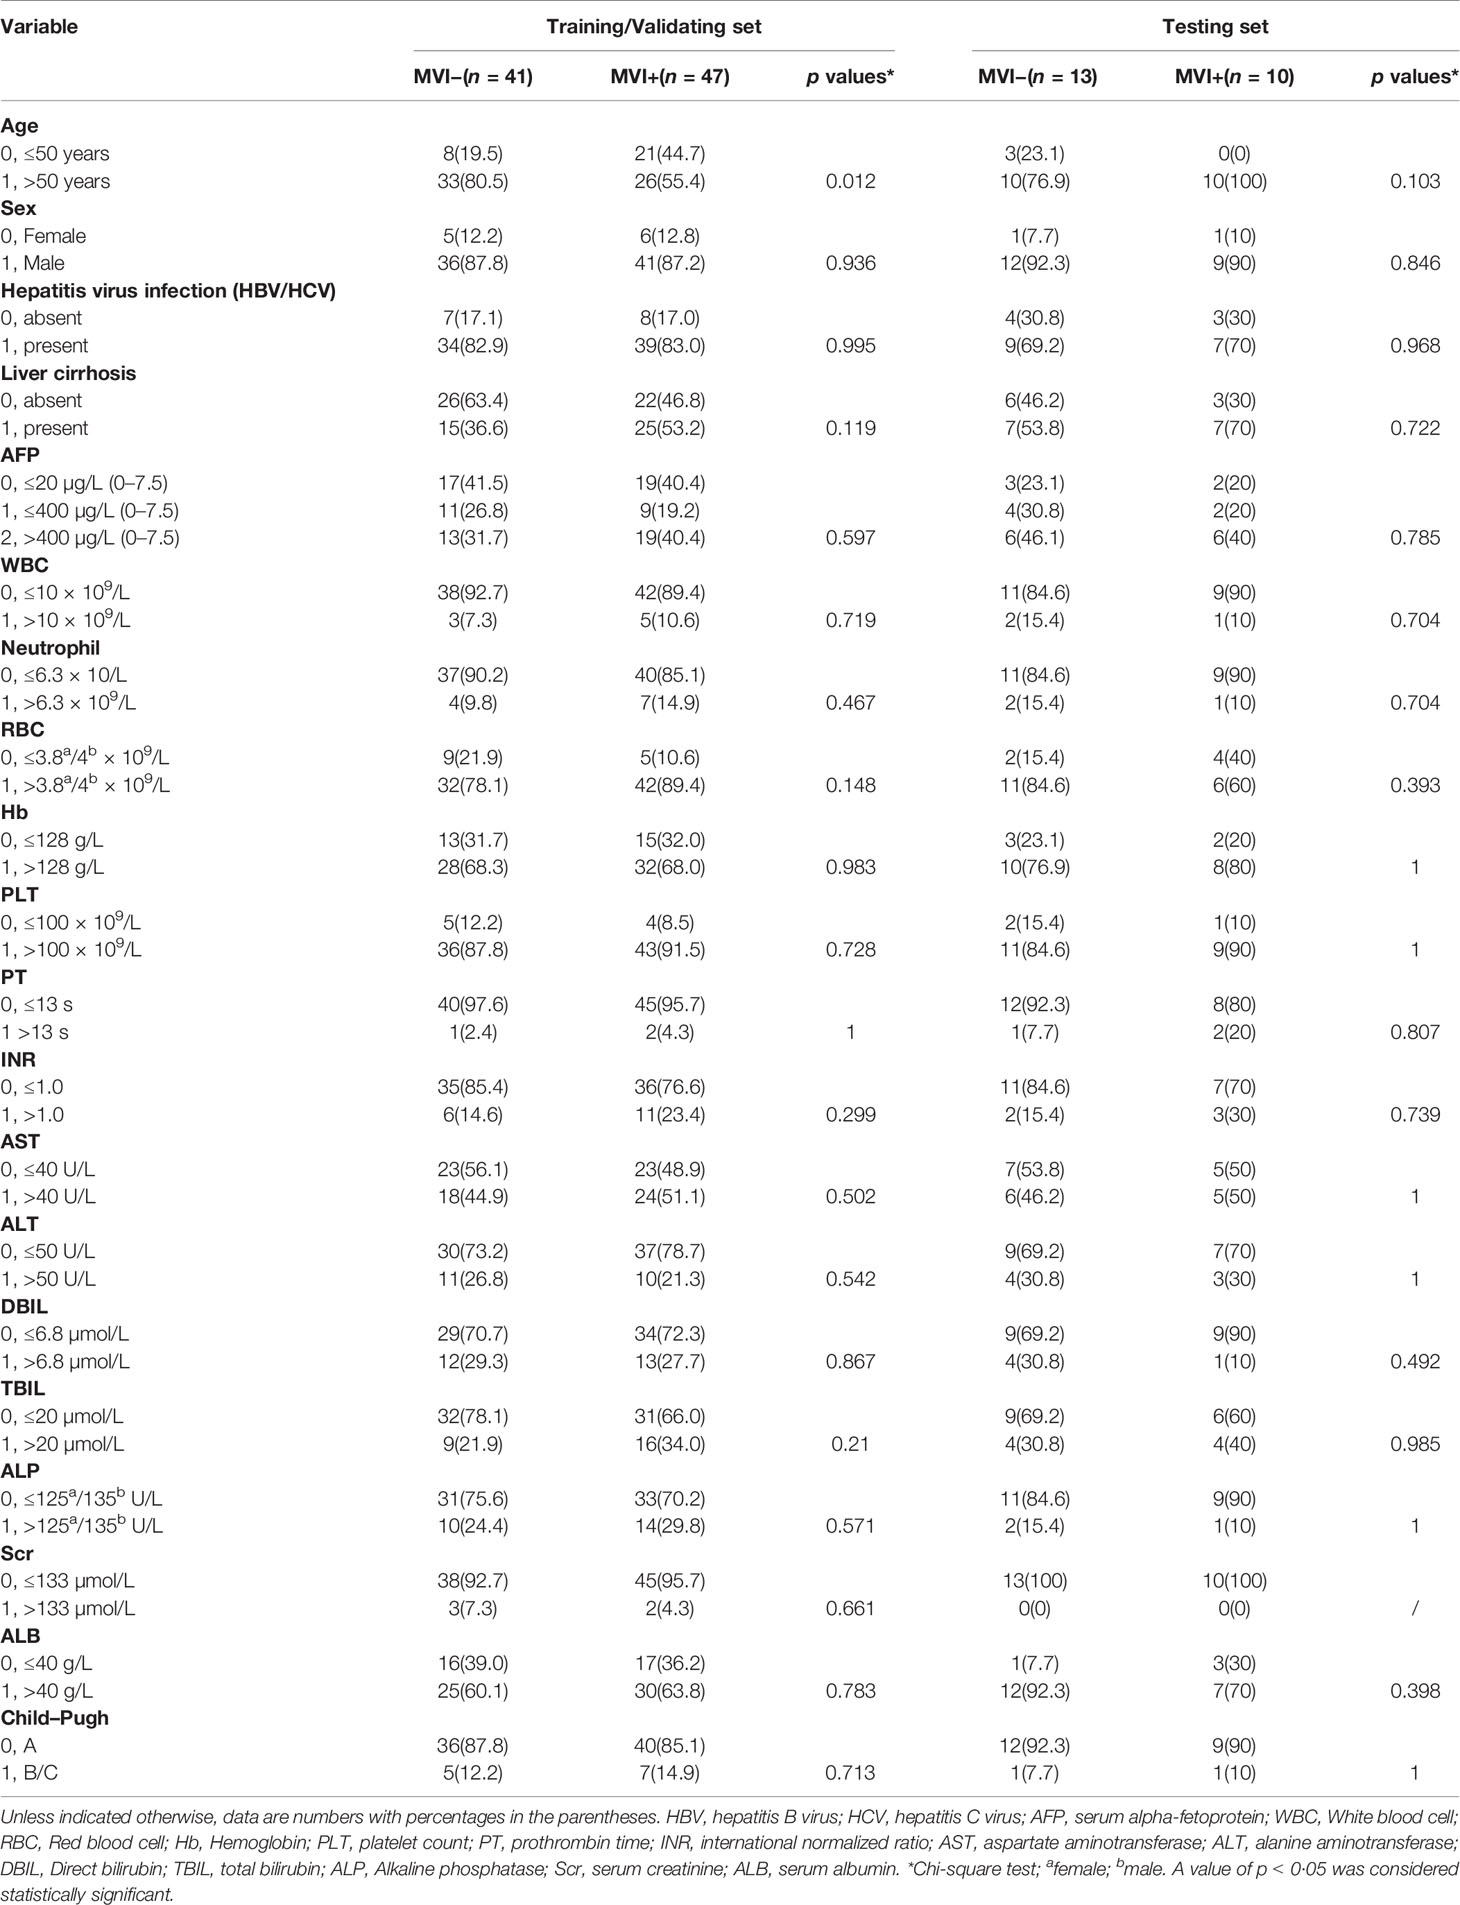
Table 1 Demographics and clinical characteristics.
Radiomics Analysis
Optimal Setting Determination
All the established predictive models were comprehensively compared to determine the optimal phases, tumor periphery, and VOIs combinations. Figure 2 shows the prediction comparison results on 15 phase combinations and three VOIs combinations (Vtc, Vpt and Vtc +Vpt). The AUCs were the mean values averaged for all the seven tumor peripheral distances and all the 150 classifiers. The best performance was seen in (portal venous phase, PVP) and this conclusion was consistent for both Vtc (AUC=0.78) and Vtc +Vpt(AUC=0.82). Models inclusive of the PVP phase had the second ( with Vtc+ Vpt, AUC = 0.78) and third-best ( with Vtc+Vpt, AUC=0.76) performances. In terms of VOIs combinations, the Vpt generally achieved better predictive performance than the Vtc in almost all phasic combinations (except for in ). The Vtc +Vpt had improved prediction as compared with Vtc or Vpt alone in most of the 15 phase. combinations (except in ).
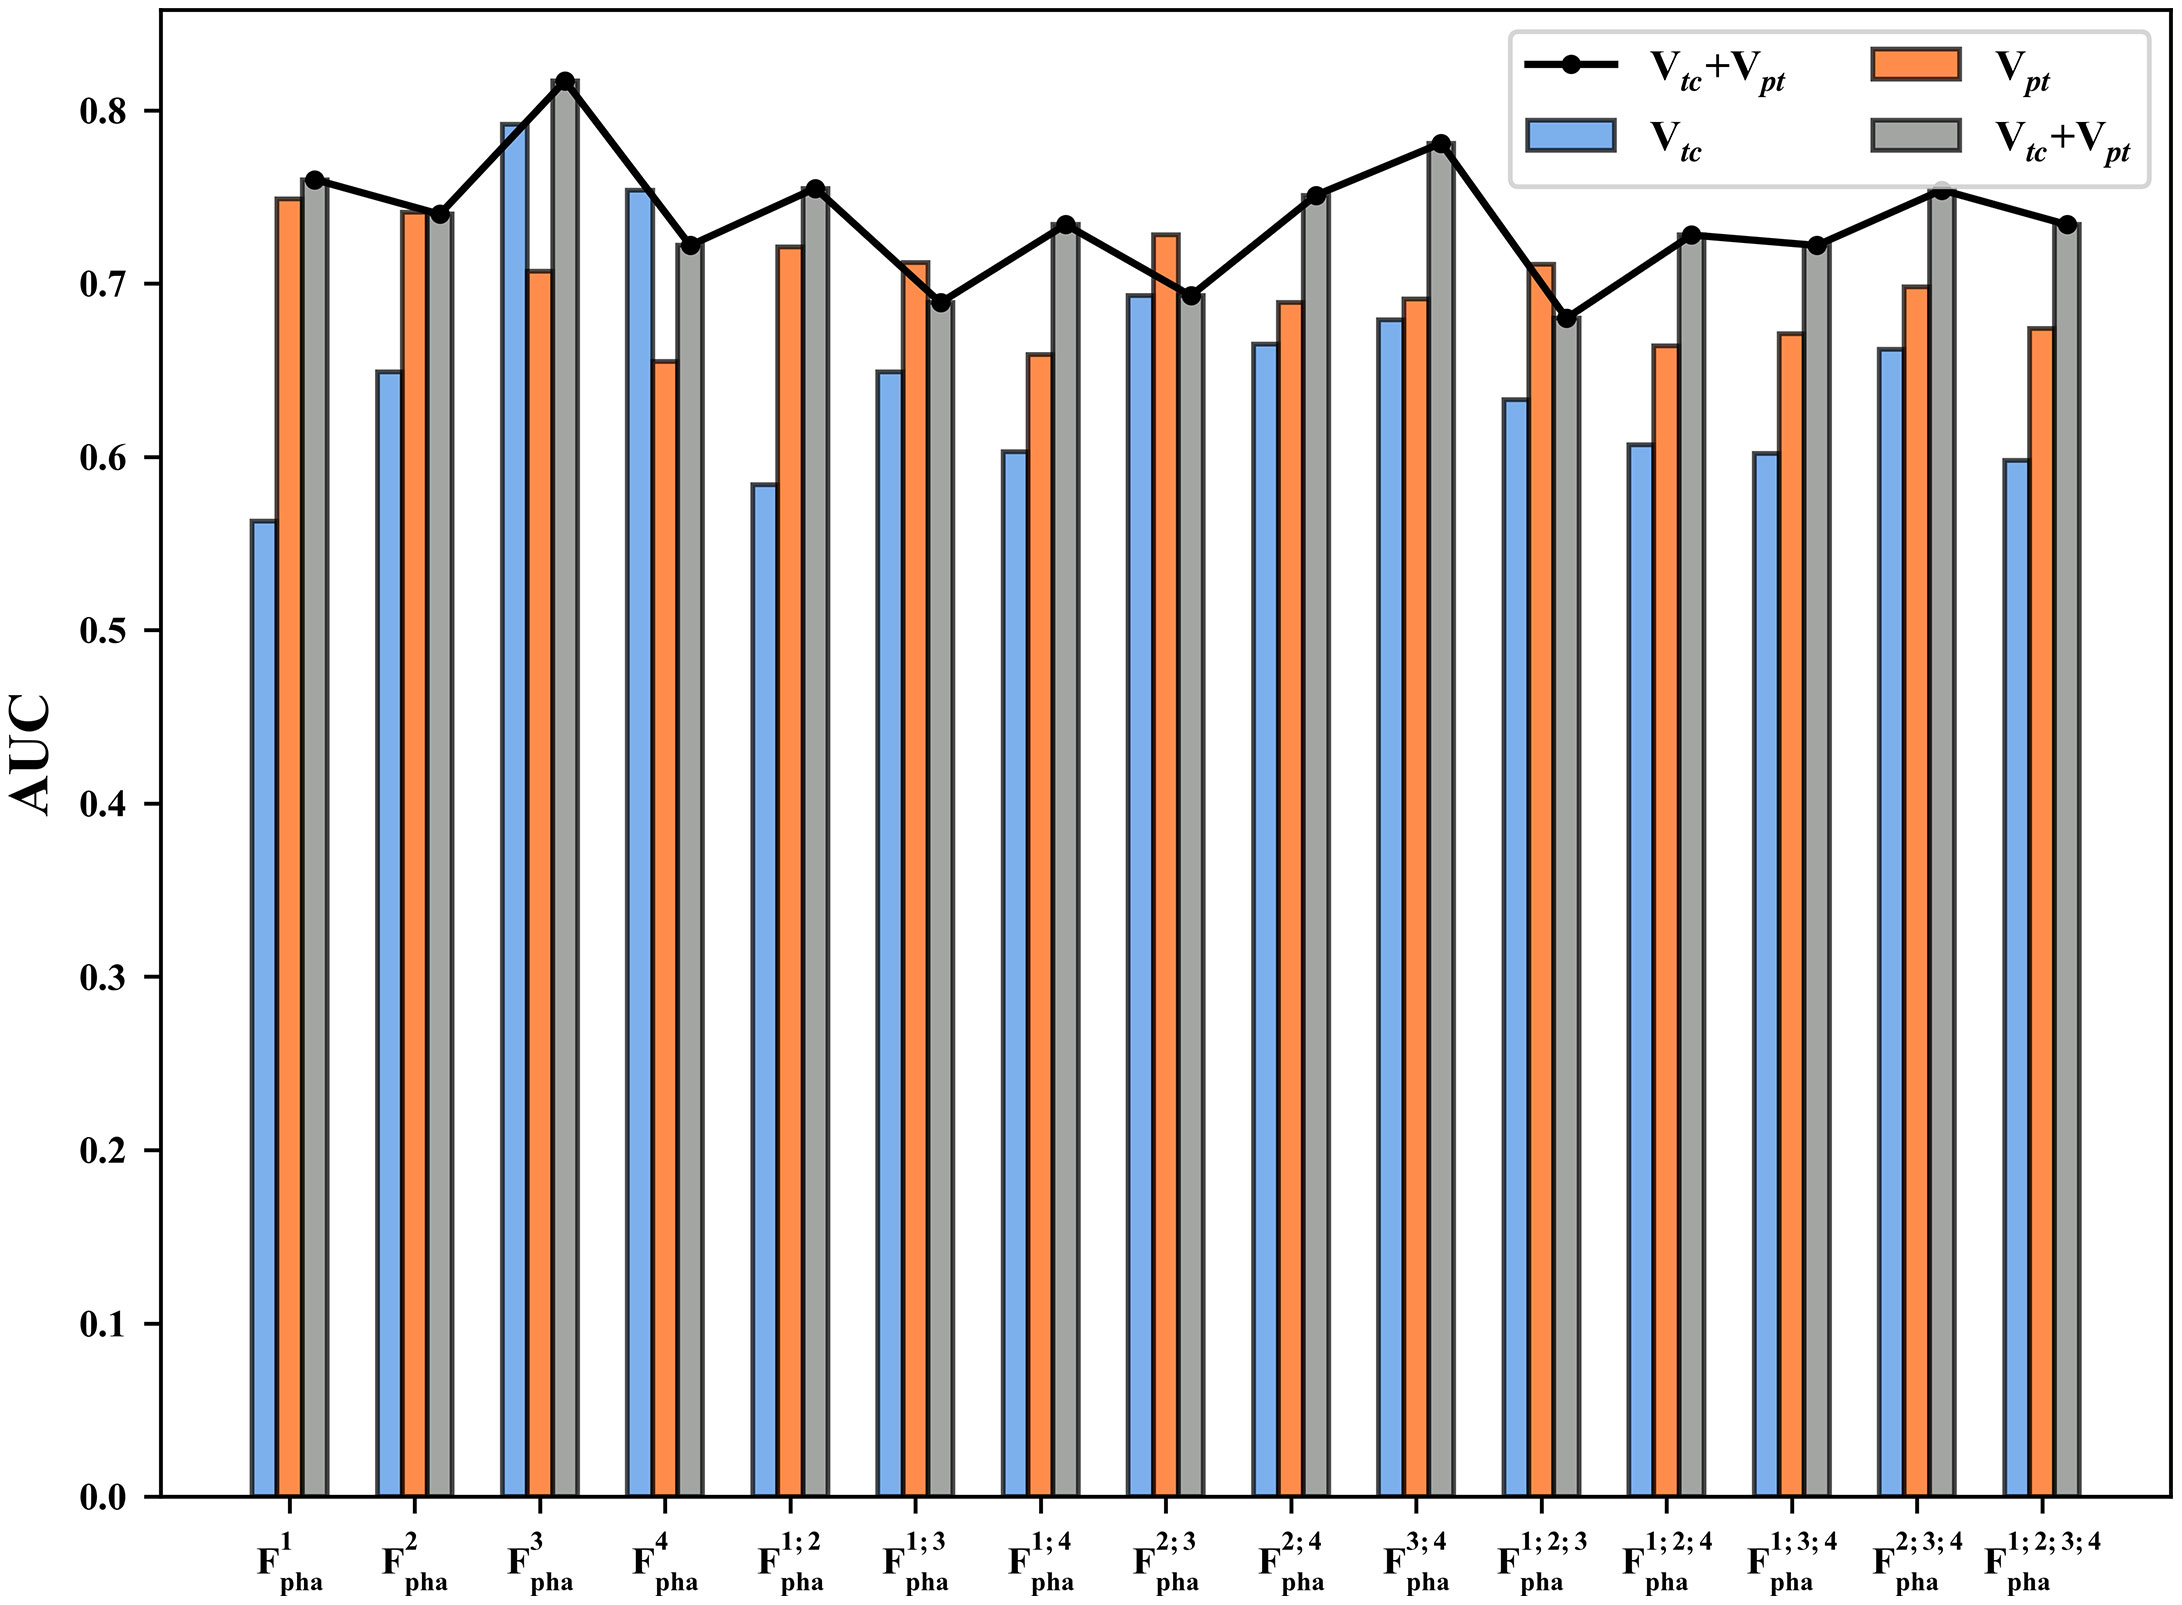
Figure 2 Prediction performance in terms of AUC on 15 phase combinations and 3 VOIs combinations (Vtc, Vpt and Vtc + Vpt). Vtc, volume of tumor core; Vpt, peripheral tumor regions; Vtc + Vpt, combination of Vtc and Vpt; AUC, area under the ROC curve.
Using the optimal phase and VOIs combination (Vtc+ Vpt), the optimal tumor peripheral distance was determined by comparing the predictions on and Vtc+Vpt with the aforementioned seven different peripheral distances. As shown in Figure 3, the predictive accuracy (in terms of the mean AUC averaged over all the 150 classifiers) increased gradually (maximal at 12mm) as larger tumor peripheral distance was involved.
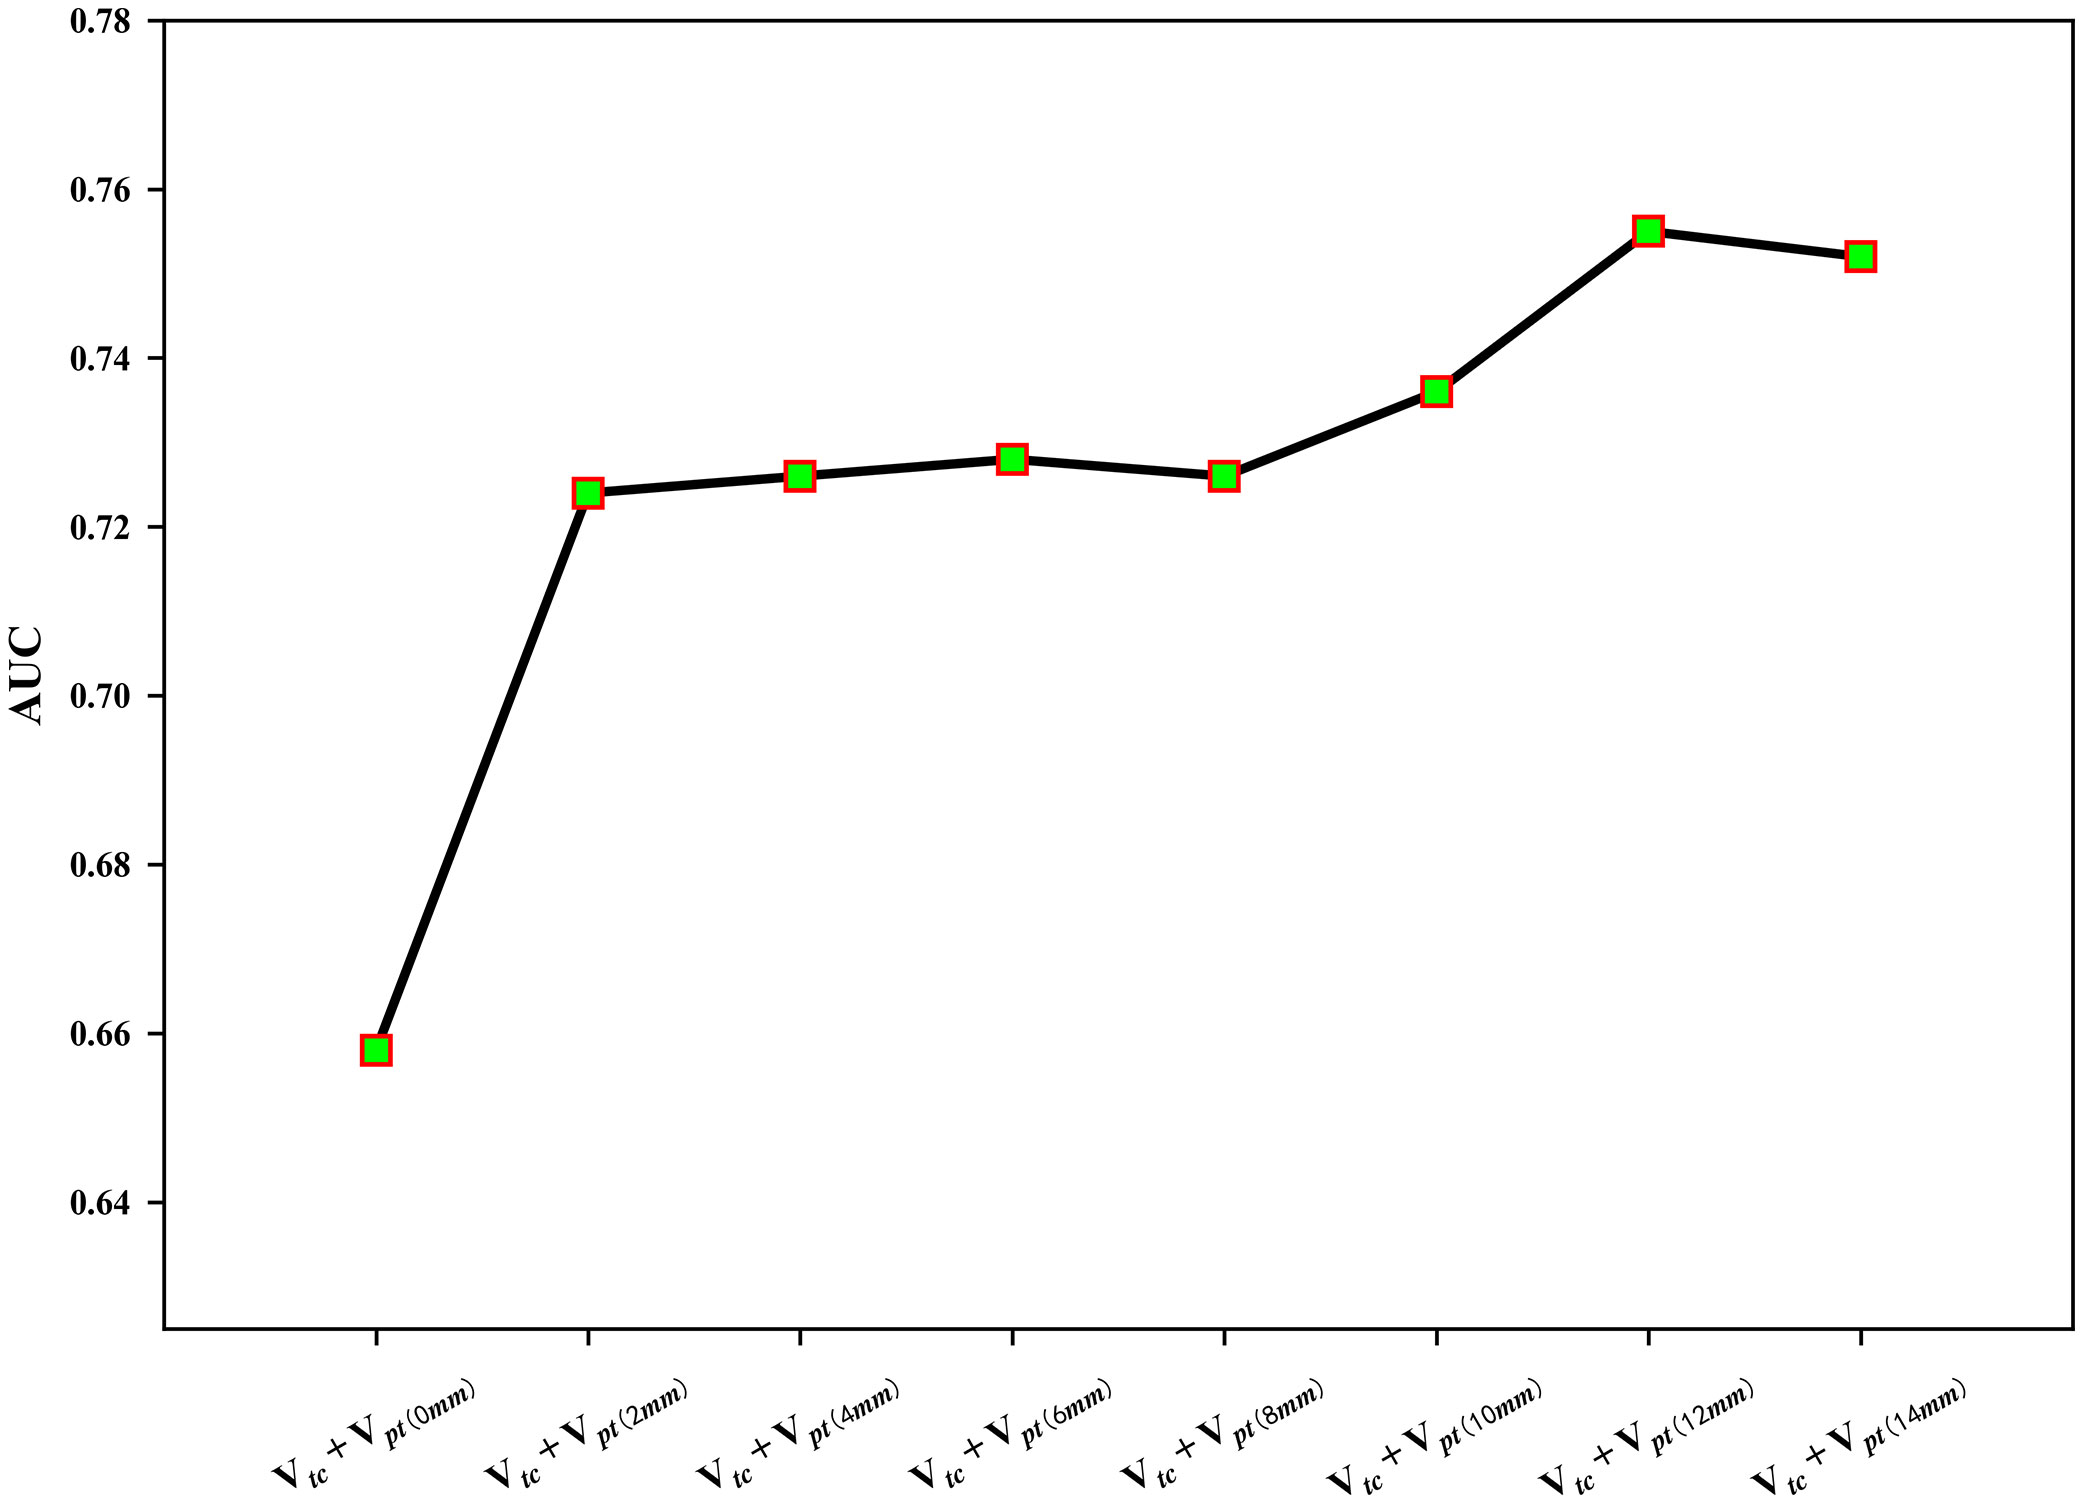
Figure 3 The prediction accuracy (AUC) trend with respect to increasing peripheral distances in Vtc+ Vpt (with ).
Microvascular Invasion Prediction Performance
The training/validation set was cross-validated with features from and Vtc+Vpt (with 12mm tumor peripheral distance) on the 150 prediction models (classifiers + feature selection). The performances of all models were ranked, and the top-3 models were respectively combinations of “Random forest” & “t_score”; “Random forest” & “f_score” and “k-Nearest Neighbor” & “f_score”.
The predictive performances in terms of AUC of the top-3 models were 0.788, 0.776, and 0.775 on the training/validation set (with ten-fold CV), and 0.792, 0.78, and 0.803 respectively on the independent testing set (Table 2). Fusion of the top-3 models further improved the predictive accuracy to AUC = 0.795 with the PV method and AUC=0.811 with the WF method. Comparison between the top-3 models and the two fusion methods were quantified by the NRI metric, with a positive NRI value indicating superiority. It was observed that PV or WF fusion outperformed prediction using any of the top-3 models (lower-left corner in Figure 4).
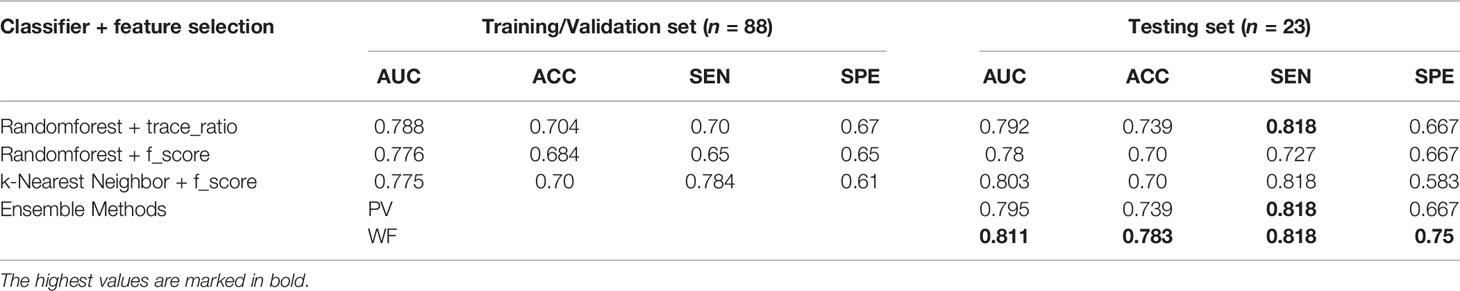
Table 2 Predictive performances of the top-3 models and their fusion on the training/validation and independent testing sets.
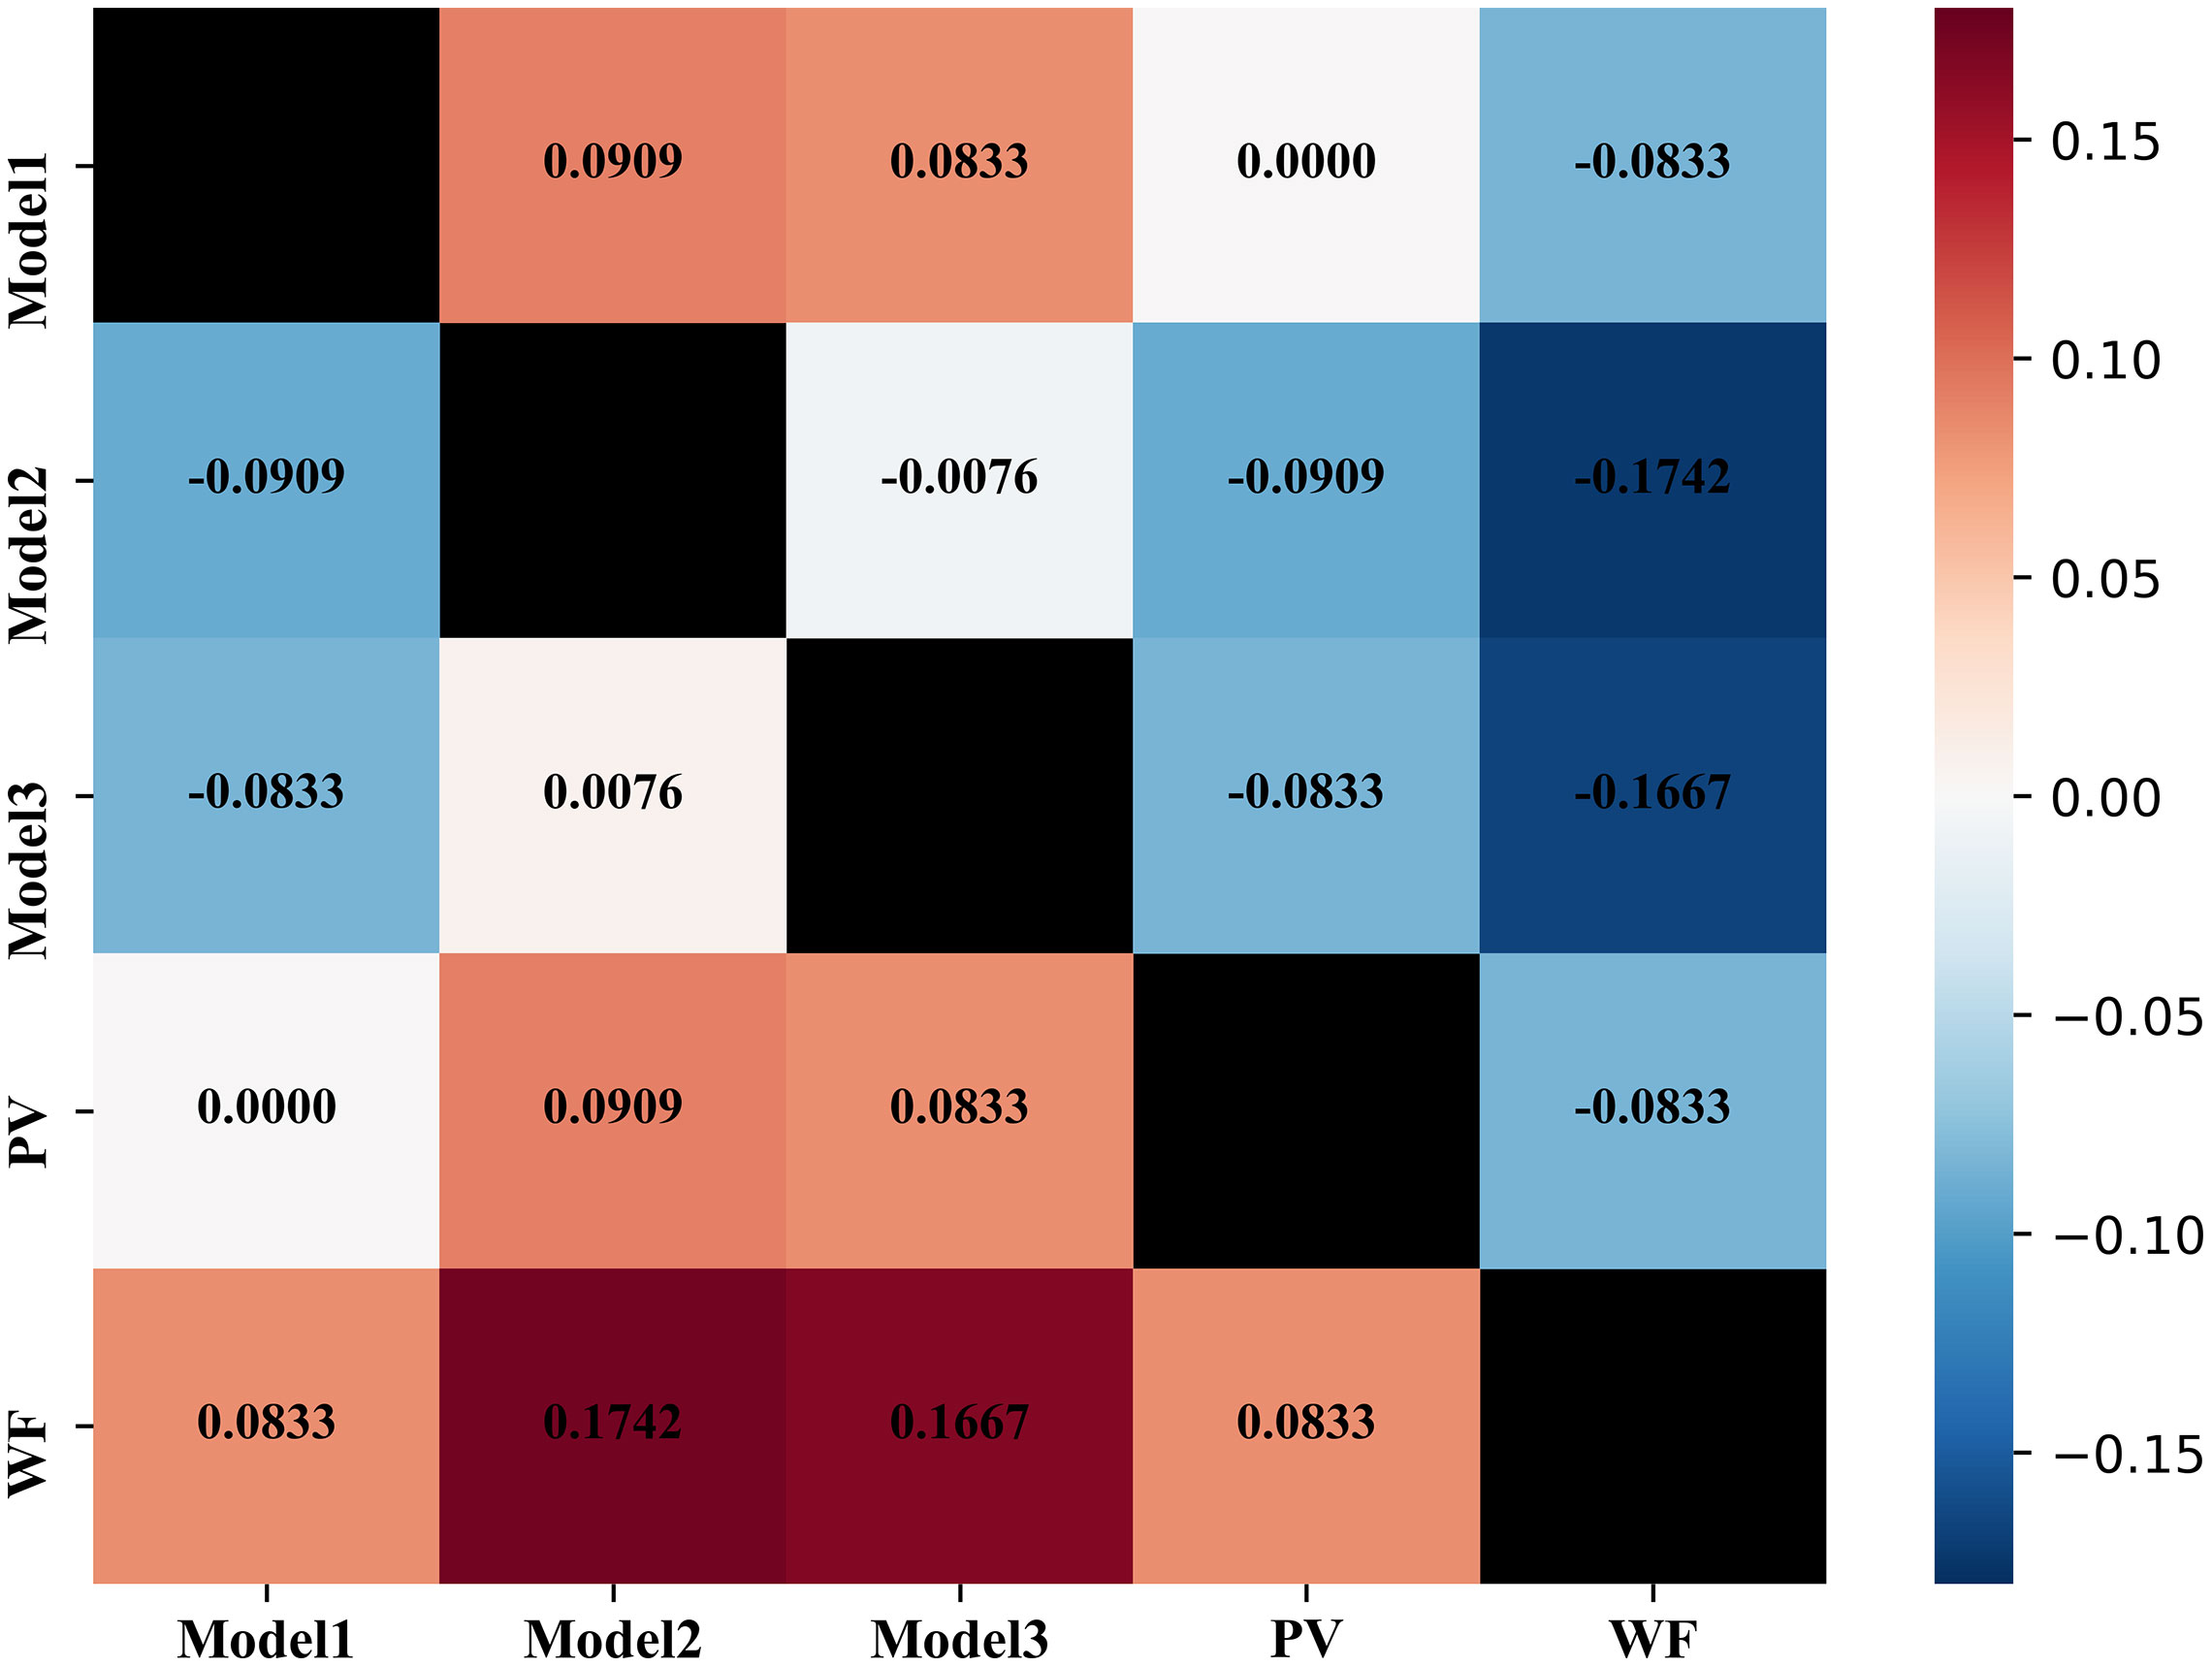
Figure 4 Quantitative comparisons of NRI between different models. Positive (or negative) NRI value indicates superiority (or inferiority). The NRI value in each cell represents the superiority (or inferiority) of a model in the y-axis to a model in the x-axis. NRI, Net Reclassification Improvement.
Top-Ranked Features
We also counted the number of times for each feature (with Vtc+Vpt(12mm)) being selected as the top features in the 150 prediction models using ten-fold CV (Figure 5). The five most frequently selected features included: four first-order features (10th percentile (20%), mean (11.31%), median (11.31%) and root mean square values (11.03%)) as well as one texture feature GLSZM-based Gray Level Non-uniformity Normalized (GLNN) (16.28%).
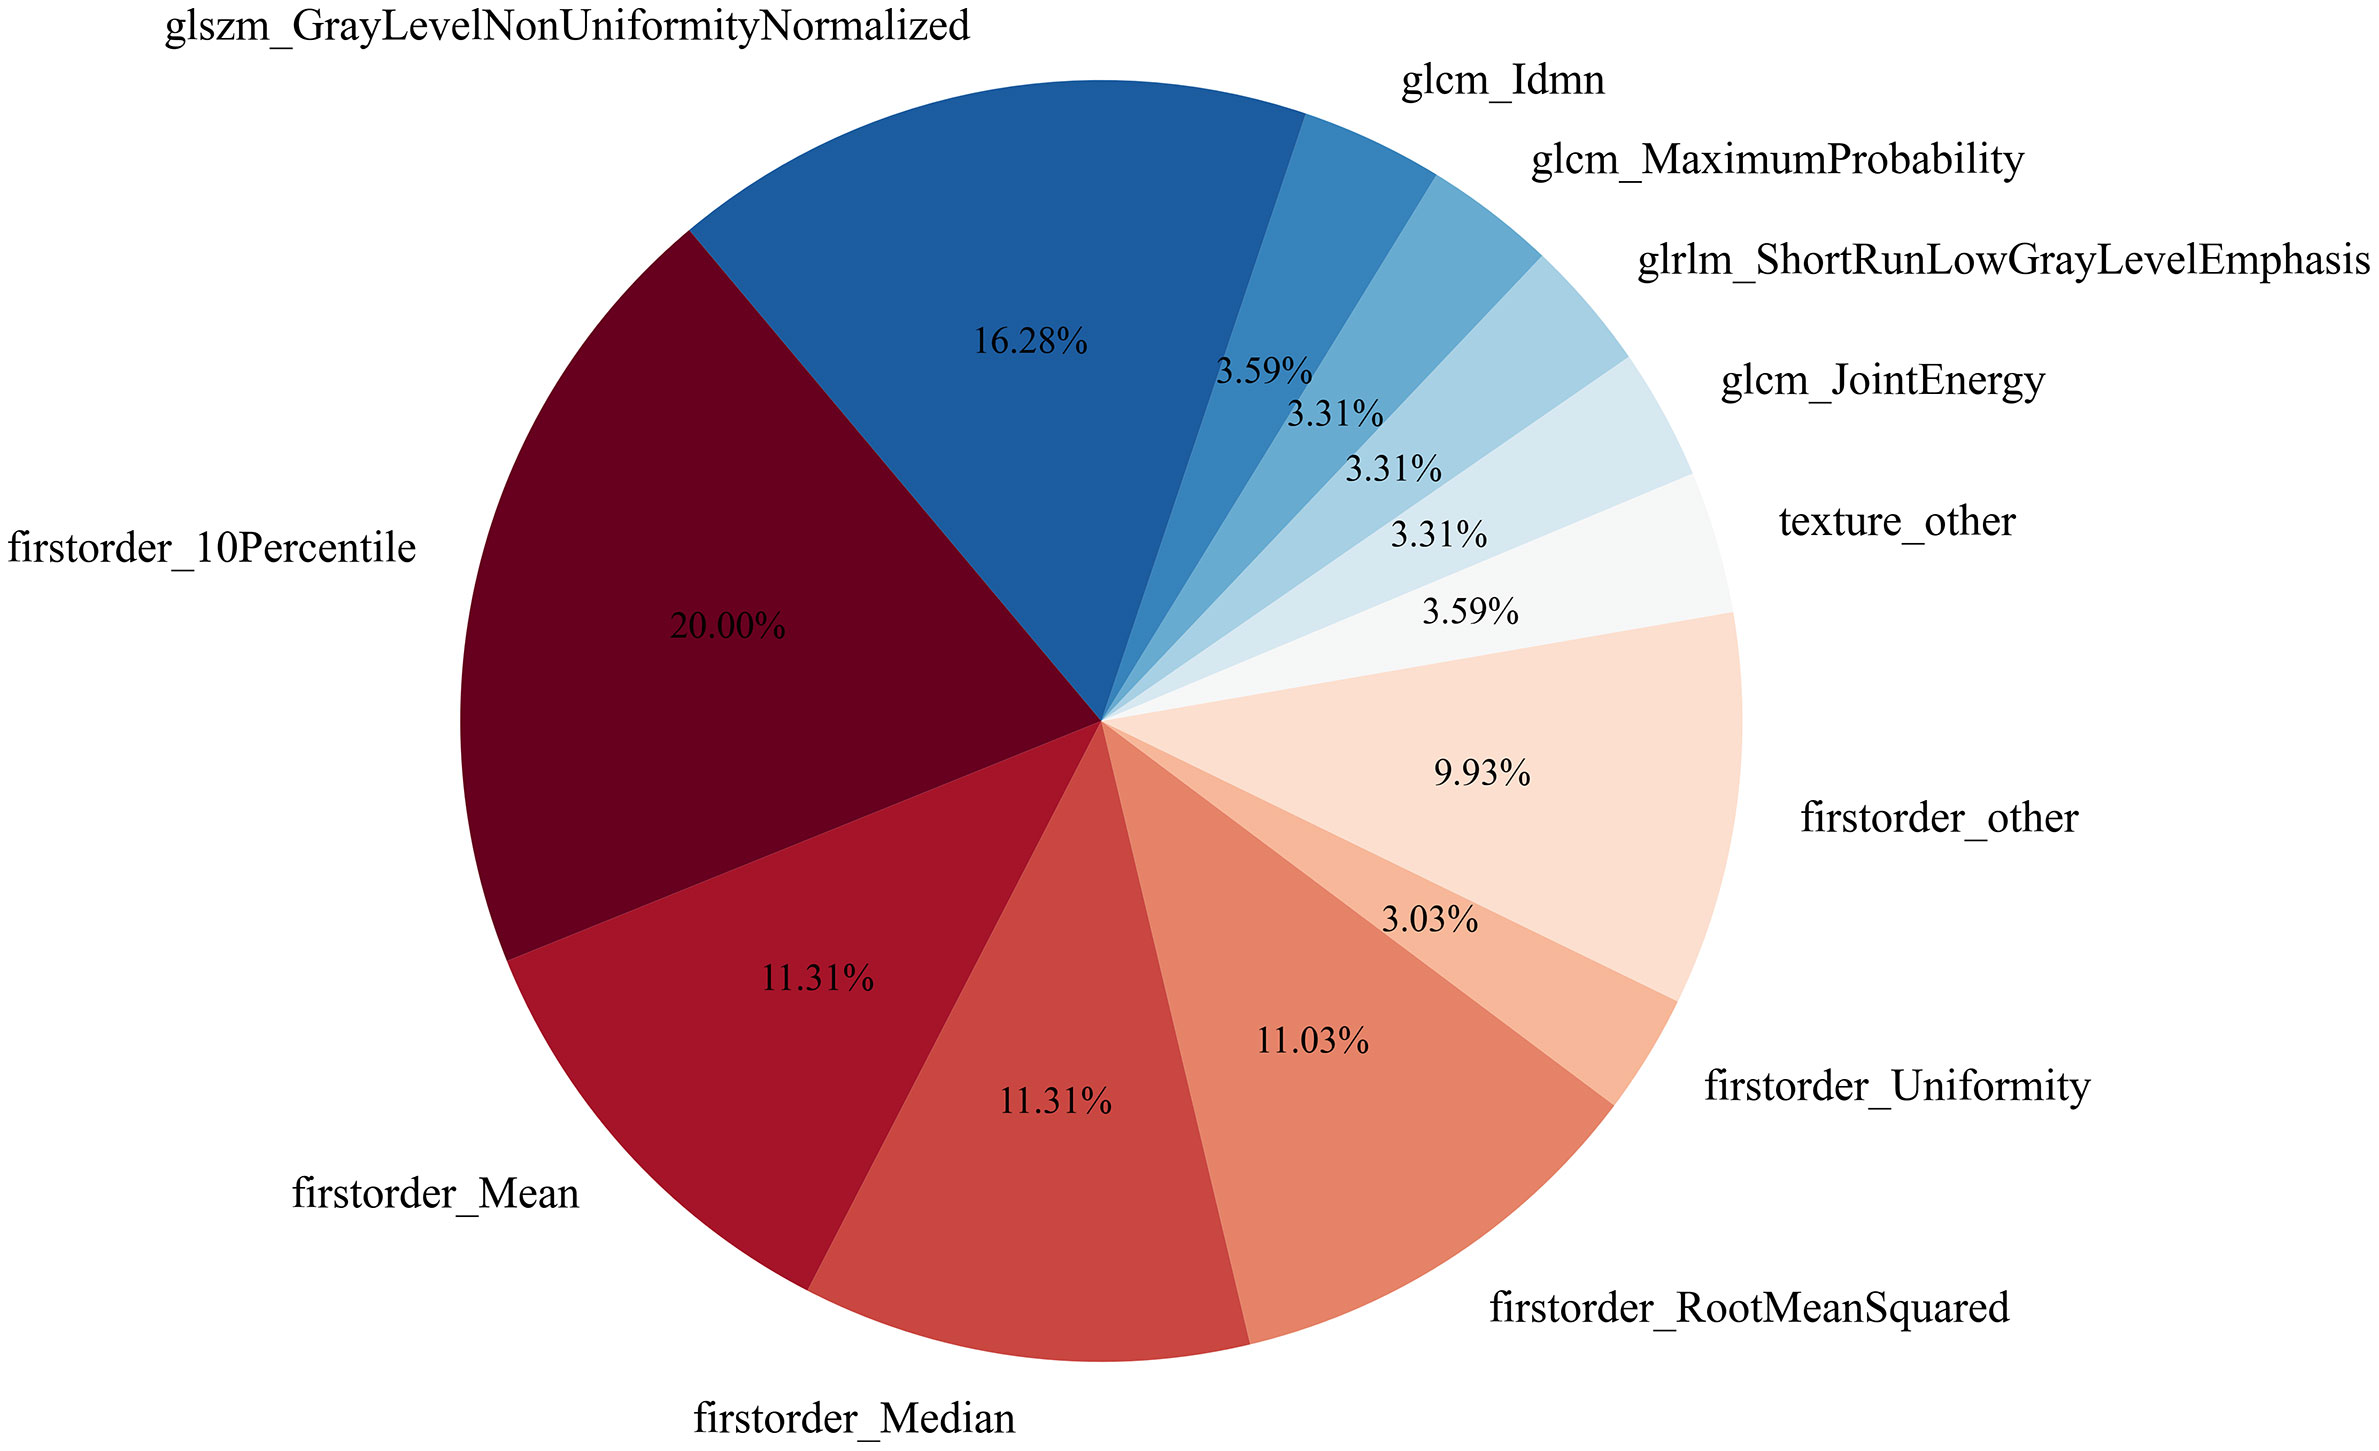
Figure 5 A pie chart showing the number of times (%) of the features in being selected into the top 10 features in the 10-fold cross-validation of all predictive models with AUC > 0.7.
Discussion
Image features extracted from the portal venous phase (PVP) with Vtc+Vpt(12mm) were shown to be the most reliable features for MVI prediction in HCC. An AUC of 0.81 on the independent testing set was achieved by the WF fusion method by integrating the top-3 models ranked from the training/validation set. Also, one GLSZM-based texture feature GLNN and four first-order features were found to be most associated with MVI.
Previous studies using conventional CT/MR imaging reported the common manifestations indicative of positive MVI, as pseudo-capsule, unsmooth tumor margins, rim or peritumoral enhancement in the arterial phase, and peritumoral hypointensity in the hepatobiliary phase. Chou et al. reported that unsmooth tumor margin which has been confirmed to be correlated with pathologically extra nodules, multinodular fusion, or infiltrative margin, is indicative of positive MVI in HCC lesions. A correlation between focal extra nodules on CT images and MVI in the pathologic specimens was also found (20). Research work by Matsui et al. suggested that peritumoral regions had a concentration of tumor drainage vessels which presented as corona enhancement in CT hepatic arteriography (CTHA) and CT arterio-portography (CTAP) (37). Nishie et al. reported that MVI positive HCCs, especially those with lesion diameter < 3 cm, tended to have larger area of peritumoral enhancement (due to peritumoral hemodynamic change) than MVI negative HCCs (38). Although conventional radiological manifestations are known to provide hints regarding MVI status in HCC, inconsistent results have been reported in previous studies (perhaps owing to inter-observer variations) and thus standard diagnostic consensus has not been reached (16, 20).
Indeed, traditional radiological imaging analysis can be integrated with radiomics analysis for prediction modeling. However, radiographic diagnosis confirmed by naked-eye observation is usually limited by one’s visual perception, which is insensitive to subtle image differences. Furthermore, diagnostic performance of traditional radiological imaging analysis is closely related to the radiologist’s clinical experiences and can be easily biased by subjectivity. While radiomics provides an auxiliary alternative for radiologists to explore more hidden image patterns in characterizing diseases. Several studies have attempted to predict MVI status via radiomics analysis on DCE-CT or MRI (26–28, 30, 39, 40). For instance, Ma et al. extracted textural/non-textual features from the DCE-CT arterial phase (AP), PVP, and delay phase (DP) of the tumor core for MVI prediction. The PVP-based radiomics model was reported to achieve an AUC of 0.783 and 0.793 in the training and validation datasets, respectively (27). Similarly, Xu et al. compared radiomic features from the entire-volumetric interest (VOIentire), 50% of the entire tumor volume (VOI50%) and a 5mm annular region neighboring the tumor surface (VOIpenumbra). It was shown that VOIentire and VOIpenumbra (with AUC 0.841 and 0.829 in the training and validation sets respectively) outperformed VOI50% in MVI prediction, which was consistent with this study (28). However, the combinational effect of VOIentire +VOIpenumbra was not addressed. Nebbia et al. used multi-parametric MRI radiomics to predict MVI from the tumor core, at a fixed (10mm) peritumoral region, as well as the tumor core + peritumoral region (39). However, the fixed 10mm peritumoral margin was heuristically proposed which may omit MVI occurring in regions beyond this distance. The HCC pathological specimen collection standard may additionally support this as it includes liver tissue within a 2cm range from the tumor margin (6).
Previous investigations were conducted on a single (or two) DCE CT/MRI AP, PVP, or DP phase(s) and have not addressed the combination of phases (26–28). This study is the first attempt, to our knowledge, to provide a comprehensive analysis aimed at substantiating the predominant role of the PVP phase (27). More diagnostic attention should be emphasized on PVP. Also, EAP had limited contributions to MVI prediction. Exemption of an EAP scan is therefore recommended in routine enhanced CT to reduce the radiation exposure.
One GLSZM-based feature GLNN and four first-order features were shown to exhibit strong predictive capabilities of MVI. The GLNN measures the variability of gray-level intensity values in the image, with a lower value indicating greater similarity in intensity values (41). Our results implied that the MVI positive HCCs are associated with more heterogeneity within the Vtc+Vpt(12mm) than the MVI negative HCCs. This can be explained by the underlying HCC hemodynamic mechanism, that is, tumor cells may implant to the surrounding normal liver parenchyma from the tumor-draining vessels (37, 38). Furthermore, the MVI positive groups demonstrated higher 10th percentile, mean, median and root mean square values. Perhaps, this may be attributed to the hyper-attenuation resulting from excretion of CT contrast agent via the tumoral drainage vessels to the surrounding normal liver parenchyma in PVP.
This study also employed a novel method of using classifier fusion for MVI prediction modeling, such as a process analogous to disease diagnosis by a MDT, produce more reliable and accurate predictions compared with a single classifier. This was based on two reasons: 1) First, there is large performance differences between different classifiers, which has been confirmed in our previous study (31). It is not practical to select a suitable classifier for a given task from a large pool of classifiers, since different classifiers are built on different mathematical grounds; 2) Second, fusion of classifiers has been proved to generate more stable and reproducible classification performance than an individual classifier, and is effective in improving classification/prediction accuracy in decision-making (32, 32, 42–44).
Limitations
Our study has several limitations. First, this was a retrospective and single-center study with a relatively small sample size due to an inclusion requirement of the EAP phase. However, EAP is seldom performed in the local institutions. Future investigations should thus include more participants across different centers to confirm this study’s findings. Secondly, manual VOI delineation is time-consuming and has uncertainties on subsequent radiomics analysis and prediction modeling (45). Semi- or automatic segmentation methods are expected to generate more consistent and reproducible results.
Conclusion
In conclusion, this study demonstrated the feasibility of noninvasive MVI prediction via CT radiomics analysis and a MDT-like fusion-based radiomics prediction modeling. Image features extracted from the portal venous phase on the tumor core and within 12 mm of the tumor peripheral region may be considered as potential quantitative imaging biomarkers.
Data Availability Statement
The original contributions presented in the study are included in the article/Supplementary Material. Further inquiries can be directed to the corresponding authors.
Ethics Statement
Written informed consent was obtained from the individual(s) for the publication of any potentially identifiable images or data included in this article
Author Contributions
WZ, RY, and FL conducted the literature search. WZ, RY, XW, XZ, and XJ designed the study. WZ, GL, WD, and HW collected the data. WZ, RY, XZ, FL, SL, and AC analyzed the data. All authors verified the data. WZ, RY, FL, SL, XZ, and XJ edited the manuscript. RY, XW, XZ, and XJ reviewed the manuscript. All authors contributed to the article and approved the submitted version.
Funding
This study received funding from the National Natural Science Foundation of China (81971574, 81874216, and 81571665), the National Key Research and Development Program of China (2017YFC0112900), the Natural Science Foundation of Guangdong Province, China (2018A030313282), the Guangzhou Science and Technology Project, China (202002030268 and 201904010422), and the Medical Science and Technology Research Project of Guangdong Province (A2019465).
Conflict of Interest
The authors declare that the research was conducted in the absence of any commercial or financial relationships that could be construed as a potential conflict of interest.
Supplementary Material
The Supplementary Material for this article can be found online at: https://www.frontiersin.org/articles/10.3389/fonc.2021.660629/full#supplementary-material
References
1. Bray F, Ferlay J, Soerjomataram I, Siegel RL, Torre LA, Jemal A. Global cancer statistics 2018: GLOBOCAN estimates of incidence and mortality worldwide for 36 cancers in 185 countries. CA Cancer J Clin (2018) 68(6):394–424. doi: 10.3322/caac.21492
2. Marrero JA, Kulik LM, Sirlin CB, Zhu AX, Finn RS, Abecassis MM, et al. Diagnosis, Staging, and Management of Hepatocellular Carcinoma: 2018 Practice Guidance by the American Association for the Study of Liver Diseases. Hepatology (2018) 68(2):723–50. doi: 10.1002/hep.29913
3. Raoul J, Edeline J. Systemic treatment of hepatocellular carcinoma: standard of care in China and elsewhere. Lancet Oncol (2020) 21(4):479–81. doi: 10.1016/S1470-2045(20)30082-6
4. Lee S, Kang TW, Song KD, Lee MW, Rhim H, Lim HK, et al. Effect of Microvascular Invasion Risk on Early Recurrence of Hepatocellular Carcinoma After Surgery and Radiofrequency Ablation. Ann Surg (2020) p:1. doi: 10.1097/SLA.0000000000003268
5. Rodríguez-Perálvarez M, Luong TV, Andreana L, Meyer T, Dhillon AP, Burroughs AK, et al. A Systematic Review of Microvascular Invasion in Hepatocellular Carcinoma: Diagnostic and Prognostic Variability. Ann Surg Oncol (2012) 20(1):325–39. doi: 10.1245/s10434-012-2513-1
6. Cong WM, Bu H, Chen J, Dong H, Zhu YY, Feng LH, et al. Practice guidelines for the pathological diagnosis of primary liver cancer: 2015 update. World J Gastroenterol (2016) 22(42):9279–87. doi: 10.3748/wjg.v22.i42.9279
7. Roayaie S, Blume IN, Thung SN, Guido M, Fiel MI, Hiotis S, et al. A System of Classifying Microvascular Invasion to Predict Outcome After Resection in Patients With Hepatocellular Carcinoma. Gastroenterology (2009) 137(3):850–5. doi: 10.1053/j.gastro.2009.06.003
8. Huang C, Zhu X, Ji Y, Ding G, Shi G, Shen Y, et al. Microvascular invasion has limited clinical values in hepatocellular carcinoma patients at Barcelona Clinic Liver Cancer (BCLC) stages 0 or B. BMC Cancer (2017) 17(1):1–8. doi: 10.1186/s12885-017-3050-x
9. Xu X, Xing H, Han J, Li Z, Lau W, Zhou Y, et al. Risk Factors, Patterns, and Outcomes of Late Recurrence After Liver Resection for Hepatocellular Carcinoma. JAMA Surg (2019) 154(3):209. doi: 10.1001/jamasurg.2018.4334
10. Banerjee S, Wang DS, Kim HJ, Sirlin CB, Chan MG, Korn RL, et al. A computed tomography radiogenomic biomarker predicts microvascular invasion and clinical outcomes in hepatocellular carcinoma. Hepatology (2015) 62(3):792–800. doi: 10.1002/hep.27877
11. Pawlik TM, Gleisner AL, Anders RA, Assumpcao L, Maley W, Choti MA. Preoperative Assessment of Hepatocellular Carcinoma Tumor Grade Using Needle Biopsy. Ann Surg (2007) 245(3):435–42. doi: 10.1097/01.sla.0000250420.73854.ad
12. Lei Z, Li J, Wu D, Xia Y, Wang Q, Si A, et al. Nomogram for Preoperative Estimation of Microvascular Invasion Risk in Hepatitis B Virus–Related Hepatocellular Carcinoma Within the Milan Criteria. JAMA Surg (2016) 151(4):356. doi: 10.1001/jamasurg.2015.4257
13. Chou C, Chen R, Lin W, Ko C, Chen C, Chen Y, et al. Prediction of microvascular invasion of hepatocellular carcinoma: preoperative CT and histopathologic correlation. Am J Roentgenol (1976) (2014) 203(3):W253. doi: 10.2214/AJR.13.10595
14. Reginelli A, Vanzulli A, Sgrazzutti C, Caschera L, Serra N, Raucci A, et al. Vascular microinvasion from hepatocellular carcinoma: CT findings and pathologic correlation for the best therapeutic strategies. Med Oncol (2017) 34(5):1–8. doi: 10.1007/s12032-017-0949-7
15. Hu H, Zheng Q, Huang Y, Huang XW, Lai ZC, Liu J, et al. A non-smooth tumor margin on preoperative imaging assesses microvascular invasion of hepatocellular carcinoma: A systematic review and meta-analysis. Sci Rep (2017) 7(1):1–8. doi: 10.1038/s41598-017-15491-6
16. Renzulli M, Brocchi S, Cucchetti A, Mazzotti F, Mosconi C, Sportoletti C, et al. Can Current Preoperative Imaging Be Used to Detect Microvascular Invasion of Hepatocellular Carcinoma? Radiology (2016) 279(2):432–42. doi: 10.1148/radiol.2015150998
17. Zhang L, Yu X, Wei W, Pan X, Lu L, Xia J, et al. Prediction of HCC microvascular invasion with gadobenate-enhanced MRI: correlation with pathology. Eur Radiol (2020) 30(10):5327–36. doi: 10.1007/s00330-020-06895-6
18. Lee S, Kim SH, Lee JE, Sinn DH, Park CK. Preoperative gadoxetic acid–enhanced MRI for predicting microvascular invasion in patients with single hepatocellular carcinoma. J Hepatol (2017) 67(3):526–34. doi: 10.1016/j.jhep.2017.04.024
19. Huang J, Tian W, Zhang L, Huang Q, Lin S, Ding Y, et al. Preoperative Prediction Power of Imaging Methods for Microvascular Invasion in Hepatocellular Carcinoma: A Systemic Review and Meta-Analysis. Front Oncol (2020) 10:1–13. doi: 10.3389/fonc.2020.00887
20. Chou CT, Chen RC, Lee CW, Ko CJ, Wu HK, Chen YL, et al. Prediction of microvascular invasion of hepatocellular carcinoma by pre-operative CT imaging. Br J Radiol (2012) 85(1014):778–83. doi: 10.1259/bjr/65897774
21. Kim H, Park M, Choi JY, Park YN, Kim M, Kim KS, et al. Can microvessel invasion of hepatocellular carcinoma be predicted by pre-operative MRI? Eur Radiol (2009) 19(7):1744–51. doi: 10.1007/s00330-009-1331-8
22. Aerts HJWL, Velazquez ER, Leijenaar RTH, Parmar C, Grossmann P, Carvalho S, et al. Decoding tumour phenotype by noninvasive imaging using a quantitative radiomics approach. Nat Commun (2014) 5(1):1–8. doi: 10.1038/ncomms5006
23. Kickingereder P, Götz M, Muschelli J, Wick A, Grossmann U, Carvalho S, et al. Large-scale Radiomic Profiling of Recurrent Glioblastoma Identifies an Imaging Predictor for Stratifying Anti-Angiogenic Treatment Response. Clin Cancer Res (2016) 22(23):5765–71. doi: 10.1158/1078-0432.CCR-16-0702
24. Lambin P, Leijenaar RTH, Deist TM, Peerlings J, de Jong EEC, van Timmeren J, et al. Radiomics: the bridge between medical imaging and personalized medicine. Nat Rev Clin Oncol (2017) 14(12):749–62. doi: 10.1038/nrclinonc.2017.141
25. Yang L, Gu D, Wei J, Yang C, Rao S, Wang W, et al. A Radiomics Nomogram for Preoperative Prediction of Microvascular Invasion in Hepatocellular Carcinoma. Liver Cancer (2019) 8(5):373–86. doi: 10.1159/000494099
26. Zhang X, Ruan S, Xiao W, Shao J, Tian W, Liu W, et al. Contrast-enhanced CT radiomics for preoperative evaluation of microvascular invasion in hepatocellular carcinoma: A two-center study. Clin Trans Med (2020) 10(2):1–12. doi: 10.1002/ctm2.111
27. Ma X, Wei J, Gu D, Zhu Y, Feng B, Liang M, et al. Preoperative radiomics nomogram for microvascular invasion prediction in hepatocellular carcinoma using contrast-enhanced CT. Eur Radiol (2019) 29(7):3595–605. doi: 10.1007/s00330-018-5985-y
28. Xu X, Zhang H, Liu Q, Sun S, Zhang J, Zhu F, et al. Radiomic analysis of contrast-enhanced CT predicts microvascular invasion and outcome in hepatocellular carcinoma. J Hepatol (2019) 70(6):1133–44. doi: 10.1016/j.jhep.2019.02.023
29. Poté N, Cauchy Y, Albuquerque M, Cros J, Soubrane O, Bedossa P, et al. Contribution of virtual biopsy to the screening of microvascular invasion in hepatocellular carcinoma: A pilot study. Liver Int (2018) 38(4):687–94. doi: 10.1111/liv.13585
30. Zhang R, Xu L, Wen X, Zhang J, Yang P, Zhang L, et al. A nomogram based on bi-regional radiomics features from multimodal magnetic resonance imaging for preoperative prediction of microvascular invasion in hepatocellular carcinoma. Quant Imaging Med Surg (2019) 9(9):1503–15. doi: 10.21037/qims.2019.09.07
31. Yang R, Wu J, Sun L, Lai S, Xu Y, Liu X, et al. Radiomics of small renal masses on multiphasic CT: accuracy of machine learning–based classification models for the differentiation of renal cell carcinoma and angiomyolipoma without visible fat. Eur Radiol (2020) 30(2):1254–63. doi: 10.1007/s00330-019-06384-5
32. He Q, Li X, Kim DWM, Jia X, Gu X, Zhen X, et al. Feasibility study of a multi-criteria decision-making based hierarchical model for multi-modality feature and multi-classifier fusion: Applications in medical prognosis prediction. Inf Fusion (2020) 55:207–19. doi: 10.1016/j.inffus.2019.09.001
33. Way MJ, Scargle JD, Ali KM, Srivastava AN. Advances in Machine Learning and Data Mining for Astronomy. Boca Raton London New York: CRC Press. (2011) p. 2011928.
34. Wang L, Mo T, Wang X, Chen W, He Q, Li X, et al. A hierarchical fusion framework to integrate homogeneous and heterogeneous classifiers for medical decision-making. Knowledge-Based Syst (2020) 212:106517. doi: 10.1016/j.knosys.2020.106517
35. Alba AC, Agoritsas T, Walsh M, Hanna S, Iorio A, Devereaux PJ, et al. Discrimination and Calibration of Clinical Prediction Models: Users’ Guides to the Medical Literature. JAMA (2017) 318(14):1377–84. doi: 10.1001/jama.2017.12126
36. Leening MJG, Vedder MM, Witteman JCM, Pencina MJ, Steyerberg EW. Net Reclassification Improvement: Computation, Interpretation, and Controversies. Ann Internal Med (2014) 160(2):122–+. doi: 10.7326/M13-1522
37. Matsui O, Kobayashi S, Sanada J, Kouda W, Ryu Y, Kozaka K, et al. Hepatocelluar nodules in liver cirrhosis: hemodynamic evaluation (angiography-assisted CT) with special reference to multi-step hepatocarcinogenesis. Abdominal Imaging (2011) 36(3):264–72. doi: 10.1007/s00261-011-9685-1
38. Nishie A, Yoshimitsu K, Asayama Y, Irie H, Tajima T, Hirakawa M, et al. Radiologic detectability of minute portal venous invasion in hepatocellular carcinoma. Am J Roentgenol (2008) 190(1):81. doi: 10.2214/AJR.07.2810
39. Nebbia G, Zhang Q, Arefan D, Zhao X, Wu S. Pre-operative Microvascular Invasion Prediction Using Multi-parametric Liver MRI Radiomics. J Digital Imaging (2020) 33(6):1376–86. doi: 10.1007/s10278-020-00353-x
40. Feng S, Jia Y, Liao B, Huang B, Zhou Q, Li X, et al. Preoperative prediction of microvascular invasion in hepatocellular cancer: a radiomics model using Gd-EOB-DTPA-enhanced MRI. Eur Radiol (2019) 29(9):4648–59. doi: 10.1007/s00330-018-5935-8
41. van Griethuysen JJM, Fedorov A, Parmar C, Hosny A, Aucoin N, Narayan V, et al. Computational Radiomics System to Decode the Radiographic Phenotype. Cancer Res (2017) 77(21):e104–7. doi: 10.1158/0008-5472.CAN-17-0339
42. Bashir S, Qamar U, Khan FH. IntelliHealth: A medical decision support application using a novel weighted multi-layer classifier ensemble framework. J Biomed Inf (2016) 59:185–200. doi: 10.1016/j.jbi.2015.12.001
43. Wang Q, Zhou Y, Ding W, Zhang Z, Muhammad K, Cao Z. Random Forest with Self-Paced Bootstrap Learning in Lung Cancer Prognosis. ACM Trans Multimedia Comput Commun Appl (2020) 16(1s):1–12. doi: 10.1145/3345314
44. Zhang X, Hu Y, Aouizerat BE, Peng G, Marconi VC, Corley MJ, et al. Machine learning selected smoking-associated DNA methylation signatures that predict HIV prognosis and mortality. Clin Epigenet (2018) 10(1):1–15. doi: 10.1186/s13148-018-0591-z
Keywords: hepatocellular carcinoma, microvascular invasion, dynamic contrast-enhanced computed tomography, radiomics, model fusion
Citation: Zhang W, Yang R, Liang F, Liu G, Chen A, Wu H, Lai S, Ding W, Wei X, Zhen X and Jiang X (2021) Prediction of Microvascular Invasion in Hepatocellular Carcinoma With a Multi-Disciplinary Team-Like Radiomics Fusion Model on Dynamic Contrast-Enhanced Computed Tomography. Front. Oncol. 11:660629. doi: 10.3389/fonc.2021.660629
Received: 29 January 2021; Accepted: 25 February 2021;
Published: 16 March 2021.
Edited by:
Yi Dong, Fudan University, ChinaReviewed by:
Meiyun Wang, Henan Provincial People’s Hospital, ChinaYu-Dong Xiao, Central South University, China
Copyright © 2021 Zhang, Yang, Liang, Liu, Chen, Wu, Lai, Ding, Wei, Zhen and Jiang. This is an open-access article distributed under the terms of the Creative Commons Attribution License (CC BY). The use, distribution or reproduction in other forums is permitted, provided the original author(s) and the copyright owner(s) are credited and that the original publication in this journal is cited, in accordance with accepted academic practice. No use, distribution or reproduction is permitted which does not comply with these terms.
*Correspondence: Xin Zhen, xinzhen@smu.edu.cn; Xinqing Jiang, eyjiangxq@scut.edu.cn
†These authors have contributed equally to this work and share first authorship