 Hande Beklen
 Gizem Gulfidan
 Kazim Yalcin Arga
 Adil Mardinoglu
 Beste Turanli
- 1Department of Bioengineering, Marmara University, Istanbul, Turkey
- 2Centre for Host–Microbiome Interactions, Faculty of Dentistry, Oral & Craniofacial Sciences, King's College London, London, United Kingdom
- 3Science for Life Laboratory, KTH—Royal Institute of Technology, Stockholm, Sweden
- 4Department of Bioengineering, Istanbul Medeniyet University, Istanbul, Turkey
Colorectal cancer (CRC) is one of the most fatal types of cancers that is seen in both men and women. CRC is the third most common type of cancer worldwide. Over the years, several drugs are developed for the treatment of CRC; however, patients with advanced CRC can be resistant to some drugs. P-glycoprotein (P-gp) (also known as Multidrug Resistance 1, MDR1) is a well-identified membrane transporter protein expressed by ABCB1 gene. The high expression of MDR1 protein found in several cancer types causes chemotherapy failure owing to efflux drug molecules out of the cancer cell, decreases the drug concentration, and causes drug resistance. As same as other cancers, drug-resistant CRC is one of the major obstacles for effective therapy and novel therapeutic strategies are urgently needed. Network-based approaches can be used to determine specific biomarkers, potential drug targets, or repurposing approved drugs in drug-resistant cancers. Drug repositioning is the approach for using existing drugs for a new therapeutic purpose; it is a highly efficient and low-cost process. To improve current understanding of the MDR-1-related drug resistance in CRC, we explored gene co-expression networks around ABCB1 gene with different network sizes (50, 100, 150, 200 edges) and repurposed candidate drugs targeting the ABCB1 gene and its co-expression network by using drug repositioning approach for the treatment of CRC. The candidate drugs were also assessed by using molecular docking for determining the potential of physical interactions between the drug and MDR1 protein as a drug target. We also evaluated these four networks whether they are diagnostic or prognostic features in CRC besides biological function determined by functional enrichment analysis. Lastly, differentially expressed genes of drug-resistant (i.e., oxaliplatin, methotrexate, SN38) HT29 cell lines were found and used for repurposing drugs with reversal gene expressions. As a result, it is shown that all networks exhibited high diagnostic and prognostic performance besides the identification of various drug candidates for drug-resistant patients with CRC. All these results can shed light on the development of effective diagnosis, prognosis, and treatment strategies for drug resistance in CRC.
Introduction
Colorectal cancer (CRC) is one of the most lethal types of cancers commonly seen in both men and women. This cancer affects the large intestine in the digestive tract. It is also known as bowel cancer, rectal cancer, and colon cancer. According to the American Cancer Society research, one out of every 23 women in the USA and one out of every 21 men is exposed to this disease (1). According to the database published by the International Agency for Research on Cancer, CRC is the third most common type of cancer found in Turkey and worldwide (GLOBOCAN, 2018) (2). Approximately three-quarters of patients are diagnosed with limited diseases on the intestinal wall or surrounding lymph nodes. Moreover, survival rates and treatment options for CRC may vary depending on a variety of factors including tumor size, location of tumor, and stage of cancer (3).
Over the years, several drugs are developed for the treatment of CRC such as 5-flurouracil, monoclonal antibodies (i.e., bevacizumab, cetuximab) (4), and also combination with 5-fluorouracil/leucovorin with either oxaliplatin (FOLFOX) or irinotecan (FOLFIRI) (5). However, the patients who have advanced CRC are resistant to 5-flurouracil (6). Meanwhile, the development of drug resistance is assumed as one of the major obstacles for cancer therapy. P-glycoprotein (P-gp) (also known as MDR1) is a well-identified membrane transporter protein expressed by the ABCB1 gene. The expression of Multidrug Resistance 1 (MDR1) protein causes chemotherapy failure owing to the efflux of drug molecules out of the cancer cell. MDR1 decreases the drug concentration and causes drug resistance in in vitro experiments (7), and high-level MDR1 protein expression was found in several cancer types such as liver, kidney, and colon (8).
Cancer cells upregulate P-gp expression as an adaptive response to evade chemotherapy-mediated cell death. Not all discovered P-gp inhibitors have passed all phases of the clinical trials (9). Therefore, there is a crucial need for efficient treatment strategies to deliver the best possible medical treatment. Network-based approaches can be used to determine specific biomarkers, potential drug targets, or repurposing approved drugs in drug-resistant cancers (10).
Drug repositioning (DR) is the most promising method for all major problems. DR is the approach for using existing drugs for a new therapeutic purpose; it is a highly efficient and low-cost process (11). Existing drugs have already been approved and have been successful in clinical trials, thus potentially reducing the risk of failure in new cases. Recent reviews mentioned repositioning efforts for drug-resistant CRC (12). Drugs such as citalopram, amantadine, and captopril are repurposed for disease prevention or treatment (13–15). Among them, there are also computational efforts to repurpose drugs for CRC, such as the employment of Functional Module Connectivity Map that repurposes GW-8510, etacrynic acid, ginkgolide A, and 6-azathymine (16).
The aim of this research is to repurpose candidate drugs targeting the MDR1 protein and its co-expression network by using a drug repositioning approach for the treatment of CRC. We first constructed co-expression networks around ABCB1 gene within different network sizes consisting of 50, 100, 150, and 200 edges. We performed drug repositioning by using the reversal of co-expression signatures in CRC for all four co-expression networks. The candidate drugs were also assessed by using molecular docking for determining the potential of physical interactions between the drug and MDR1 protein as a drug target. We also evaluated these four networks whether they show diagnostic or prognostic features in CRC. Lastly, the gene expression profiles of drug-resistant (i.e., oxaliplatin, methotrexate, and SN38) HT29 cell lines were used for repurposing drugs with reversal gene expressions. We showed common drug candidates among the candidates found by using co-expression networks around ABCB1 and the candidates that have reversal gene expression profile in the drug-resistant HT29 cell lines.
Method
Construction of Co-expression Networks
Four co-expression networks including different degrees (edges 50, 100, 150, and 200) of CRC-specific genes which had co-expression with ABCB1 gene were constructed through the data from TCSBN database (17). The parameters for the minimum and the maximum number of nodes (min-1 max-200) were taken as 50 and 200, respectively; the edge pruning parameter (–log10 P) (min-0 max-50) was set to 2. Genes in the networks were classified as downregulated (negative correlation) and upregulated (positive correlation) groups based on the score obtained from the database. In addition, transcription factors (TFs) were determined on the co-expression network. The visualization of networks was constructed using Cytoscape, version 3.7.0 (18).
Gene Set Over-Representation Analyses
The over-representation analyses were performed through the ConsensusPathDB database (19) to identify functional annotations of molecular pathways significantly associated with four gene groups co-expressed with ABCB1 gene. For this analysis, Kyoto Encyclopedia of Genes and Genomes (KEGG) (20), Reactome (21), and BioCarta (22) were preferred as the primary pathway sources. P-values for the pathway analysis were calculated with Fisher's exact test and adjusted p-values were obtained using Benjamini–Hochberg correction (23). The results having adjusted p < 0.05 were considered statistically significant.
Identification of Drug Candidates Through Signature-Based Drug Repositioning
Drug repositioning analysis was performed by targeting genes within the co-expression networks via L1000CDS2 (24) search tool including the Library of Integrated Network-based Cellular Signatures (LINCS) L1000 data (25) by using the knowledge about downregulation and upregulation of genes. Negative correlations (score <0) of genes in networks were used as downregulated genes, whereas positive correlations (score >0) of genes were used as upregulated genes (Supplementary Table 1). The genes within co-expression with p < 10−5 were considered as significant to investigate the drugs. Drug candidates indicating potentially reverse effects for genes in the co-expression network were determined to the treatment of CRC.
Molecular Docking Protocol
The structure of ABCB1 protein was obtained from Protein Data Bank (PDB) (26) with a PDB code of 6QEX and the structures of candidate drugs were obtained from the PubChem database (27). Binding residues including 11 phenylalanine (F72, F303, F314, F336, F732, F759, F770, F938, F942, F983, F994), two leucine (L339, L975), one isoleucine (I306), and one methionine (M949) in the transmembrane domain (TMD) of ABCB1 were taken into account for molecular docking analyses (28), which were carried out through AutoDock Vina software (29) to bind the structures of candidate drugs to binding residues of ABCB1 (TMD). In addition, ligands were also docked to two nuclear-binding domains (NBD) of ABCB1 (30). Binding affinities were detected to determine the significance of the binding after molecular docking.
Collection and Evaluation of Drug-Resistant Data Sets
Data sets related to the drug resistance in CRC were scanned within literature, and two microarray data sets were found to include control cells and methotrexate-, oxaliplatin-, and SN38-resistant cells (31) because ABCB1 is associated with the resistance to these drugs (32–34). Differentially expressed genes (DEGs) were statistically detected in all drug-resistant microarray data sets through the previously published pipeline (35, 36). This pipeline was followed by data normalization with Robust MultiArray Average (37), hypothesis testing by linear models for microarray data (LIMMA) method (38), and controlling the false discovery rate through the Benjamini–Hochberg method (23). DEGs were selected as significant based on adjusted p < 0.05 and downregulated and upregulated genes were determined by the aid of fold change (FC) values with threshold |log2FC| ≥1. Candidate drugs were identified with drug repositioning through the L1000-CDS2 tool based on downregulation or upregulation information. Candidate drugs for each drug-resistant cell line are listed in Supplementary Table 2.
Diagnostic and Prognostic Features of ABCB1 Mediated Co-expression Networks
Principal component analyses (PCA) were performed to each of four gene groups co-expressed with ABCB1 gene. For this purpose, gene expression profiles of FPKM normalized RNA-Seq data set with 644 primary colorectal tumor and 51 matched normal samples were obtained from TCGA. Each simulation was carried out with the randomly chosen 50 normal and 50 tumor samples which have expression data of genes co-expressed with ABCB1 gene. The first two principal components explaining at least 80% of total variance were considered to identify sensitivity and specificity metrics.
Survival analyses were carried out according to the well-established pipeline (39, 40) using FPKM normalized RNA-Seq data originated TCGA data set for determination of the prognostic performance of each edge. The subjects were partitioned into low-risk and high-risk groups according to their prognostic index (PI), also known as the risk score, which is the linear component of the Cox model (PI = β1x1 + β2x2 +… + βpxp, where xi is the expression value of each gene and βi is the coefficient obtained from the Cox fitting). All analyses were performed using the “survival” package in R (version 3.6.1) (https://www.R-project.org/). Kaplan–Meier plots were used for the evaluation of the survival signatures in each edge, and the cut-off for the log-rank p-value was considered as <0.05 to describe statistical significance. Hazard ratio (HR = O1/E1/O2/E2) was calculated for the determination of the significance of the survival plots according to the rate between the relative death rate in group 1 (O1/E1) and the relative death rate in group 2 (O2/E2), where O represents the observed number of deaths and E represents the expected number of deaths.
Results
ABCB1 Mediated Co-expression Networks as Resistance Signatures of CRC and Their Biological Functions
Co-expression networks are one of the major network approaches indicating altered co-expression patterns of genes between two phenotypes. These networks represent significant potential to identify gene clusters associated with the phenotype of interest in many cancer types (41, 42).
In our study, we used co-expression networks around ABCB1 gene to elucidate potential drugs for avoiding drug resistance in CRC. For that purpose, we reconstructed four co-expression networks including different degrees (edges 50, 100, 150, and 200) of CRC-specific genes that demonstrated significant co-expression patterns with ABCB1 gene through the data from TCSBN database (Figure 1).
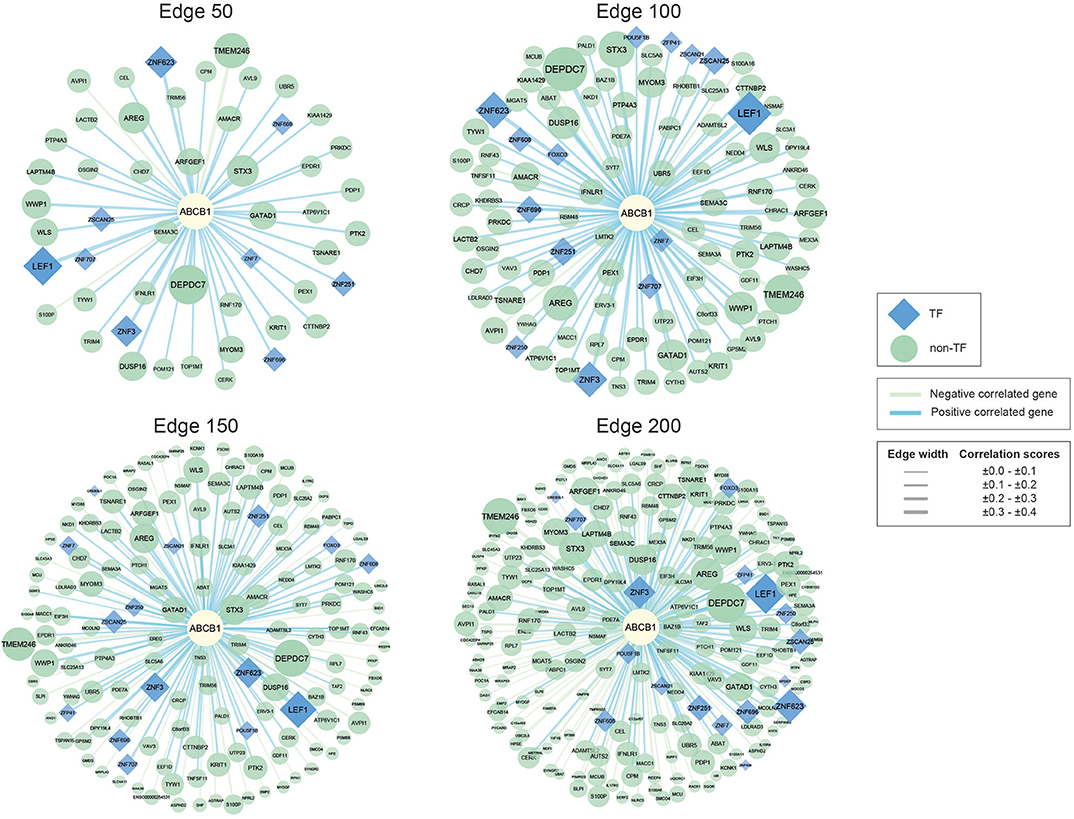
Figure 1. Networks of ABCB1 co-expressed genes. Negatively correlated genes have green edges, whereas positively correlated genes have blue edges. Transcription factors are represented as blue diamonds and edge thickness varies according to the score of the correlation between genes, whereas node size varies based on the p-value of the correlated genes. Transcription factors are represented as blue diamond, and edge thickness varies according to the score of the correlation between genes whereas node size varies according to the statistical significance (i.e., p-value of the correlated genes).
The reconstructed networks were named according to network size (i.e., edges 50, 100, 150, and 200). As the number of interactions increased, the number of negatively correlated genes increased in parallel. In edge 50, 3 negative correlations, 47 positive correlations; in edge 100, 5 negative correlations, 95 positive correlations; in edge 150, 49 negative correlations, 101 positive correlations; and in edge 200, 100 negative correlations, 100 positive correlations were observed.
To elucidate the regulatory mechanisms behind the co-expression patterns of module genes and to evaluate the condition-specific expression pattern alterations, we performed serial analyses to link the key regulators of the networks. Transcription factors were already existing with the networks; 9 of the genes were encoding TFs in edge 50, 14 of the genes were encoding TFs in edge 100, 15 of the genes were encoding TFs in edge 150, and 17 of the genes were encoding TFs in edge 200 (Supplementary Table 3).
Gene set over-representation analysis of the edge 50, 100, 150, and 200 networks were performed to determine significant biological pathways comprising these gene sets (Figure 2). The common pathways among all the number of co-expressed genes were ubiquitin-mediated proteolysis, interleukin signaling, and cytosolic sensors of pathogen-associated DNA. Particularly, interleukin signaling has been reported as involving multidrug resistance of different cancer types as well as CRC (43).
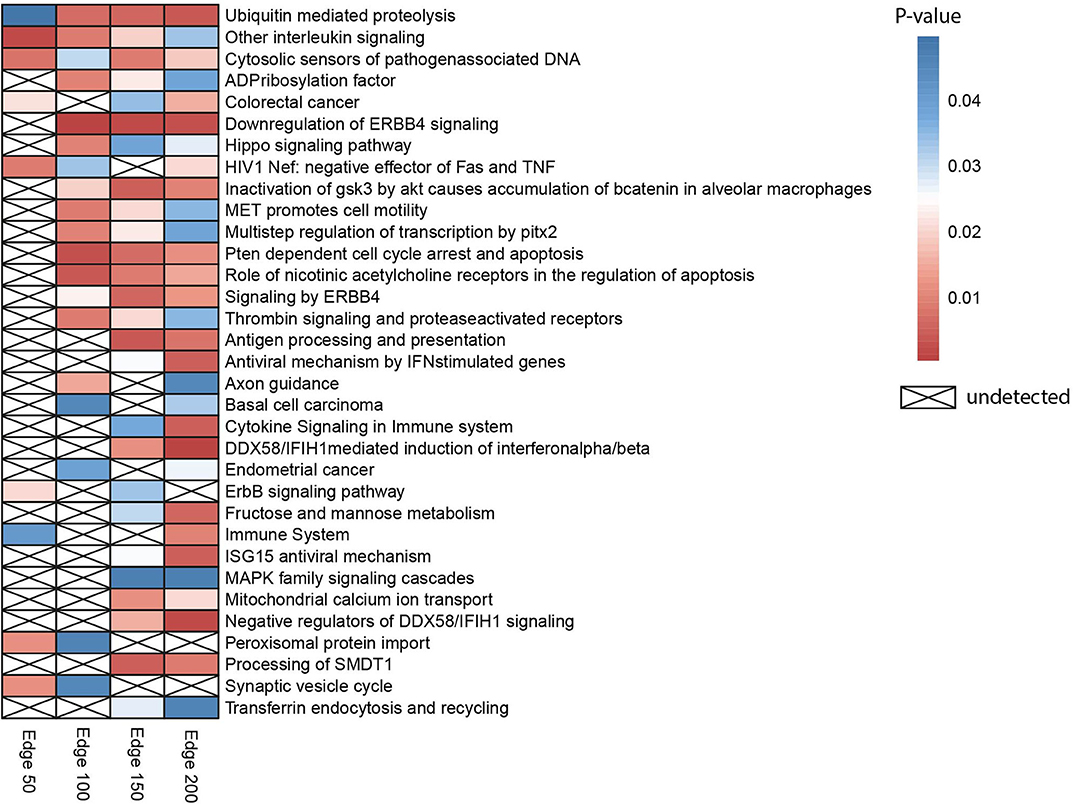
Figure 2. Heatmap indicating biological pathways in which co-expressed genes involved based on the over-representation analysis. Each cell on the heatmap was colored according to the p-value of genes in each co-expression network. If the pathway is not detected, it was indicated with a cross.
Besides, the pathway related to CRC was detected when the three different numbers of edges were examined. The pathway ubiquitin-mediated proteolysis, antigen processing and presentation, MAPK family signaling cascades, ErbB signaling pathway, and Hippo signaling pathway were also previously reported as pathways associated to drug resistance (44).
PCA was performed to identify the diagnostic performance of the correlated genes. As shown in Figure 3, the correlated genes demonstrated promising performance to be considered for diagnostic purposes. These genes exhibited distinctive features between 50 control and 50 tumor samples. Sensitivity, specificity, and diagnostic odds ratio (DOR) metrics were calculated considering the two most significant principal components. Sensitivity and specificity values were determined as 100 and 100% for edge 50, 9% and 96% for edge 100, 100 and 100% for edge 150, and finally 98 and 100% for edge 200. All gene sets exhibited high diagnostic performance (sensitivity ≥0.92, specificity ≥0.98, DOR ≥276).
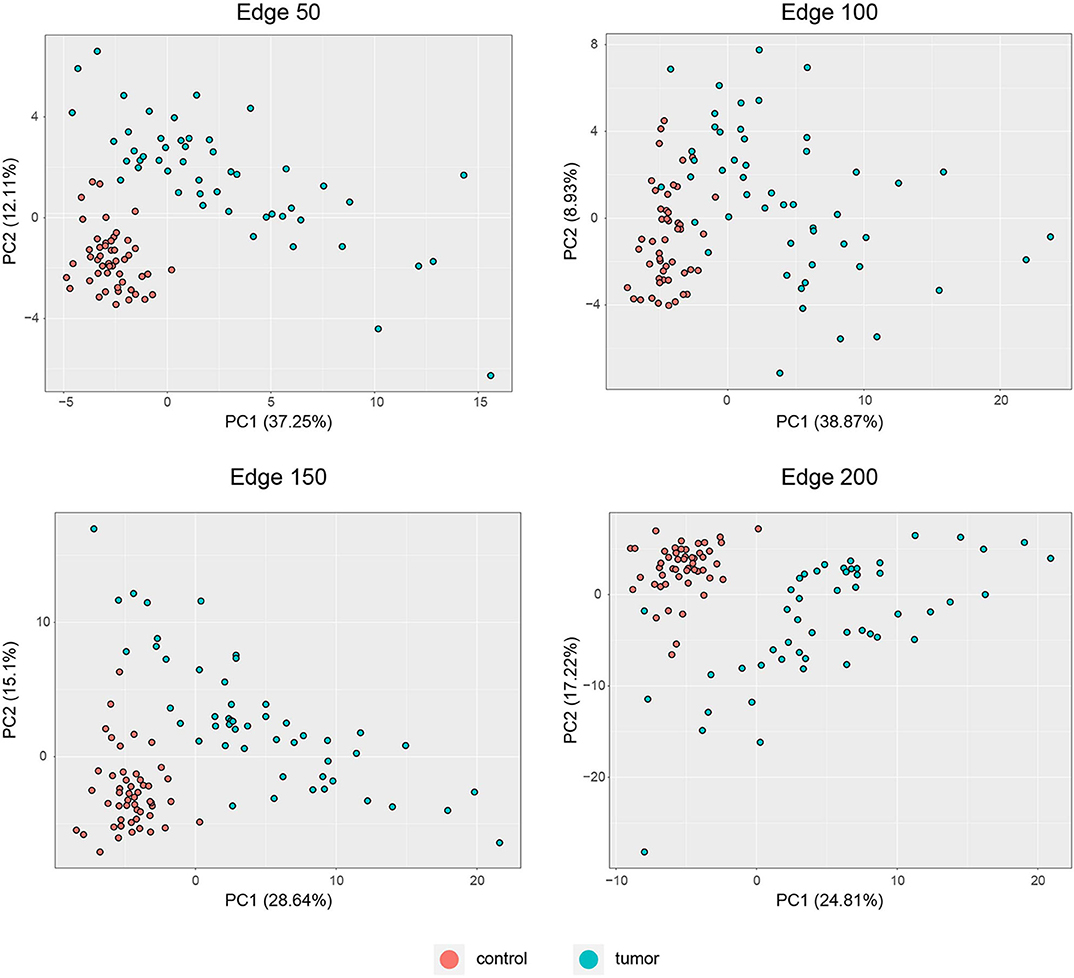
Figure 3. PCA plots for each co-expression network. Red dots represent healthy colorectal samples, whereas blue dots represent colorectal tumor samples. Variances explained by the principal components are indicated in axis titles for all plots.
Survival analysis was also performed by partitioning patients into low-risk and high-risk groups according to the expression levels of each gene in the network, and p-values and hazard ratios (HRs) were found to evaluate the prognostic power for all networks (Figure 4). In edge 50, p-value and HR were 0.0012 and 1.773, respectively. As the network size increased, both the statistical significance and the HRs were improved. Edge 200 presented a p-value and HR of 2 × 10⁻⁵ and 2.214, respectively.
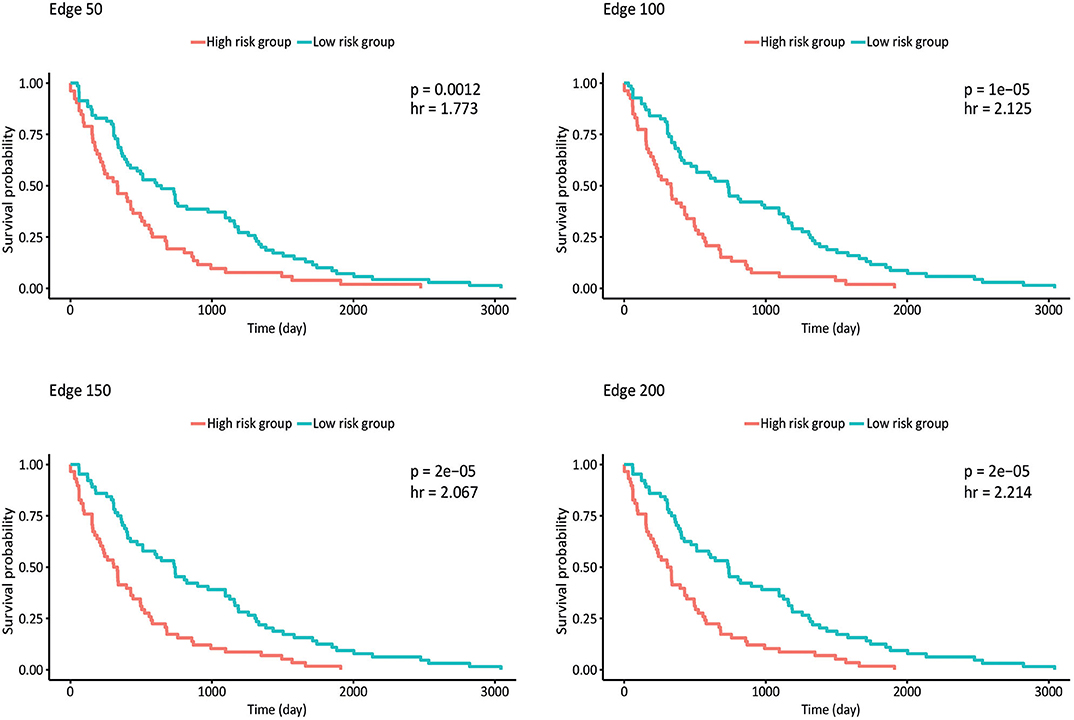
Figure 4. Kaplan–Meier plots estimating survival of patients for correlated networks indicating p-value and hazard ratio on each curve.
Identification of Potential Repositioning Drugs and Molecular Docking Simulations
By reconstructing the ABCB1 gene–mediated co-expression networks, our main goal was to identify the potential therapeutic targets and candidate drugs. Through employing a drug repositioning methodology, here, we aimed to propose hypotheses with drugs used outside of oncology but tentatively promising in cancer as in previous studies (45, 46).
Therefore, L1000CDS2 was used to find appropriate drugs with reversal effects on the gene expression profiles in CRC. As a result, 45 drugs for edge 50, 41 drugs for edge 100, 39 drugs for edge 150, and 44 drugs for edge 200 were determined (Figure 5 and Supplementary Table 4). Eight of the candidate drugs were antineoplastic agents, such as celastrol, rottlerin, withaferin A, amsacrine, teniposide, geldanamycin, sunitinib, and vorinostat, which are known for the treatment of various diseases such as acute lymphoblastic leukemia, stomach cancer, and pancreatic cancer; two of the potential drugs (arachidonyl trifluoro-methyl ketone and cycloheximide) were neuroprotective agents. Furthermore, seven drugs (importazole, AG 957, NCGC00182353-01, brazilin, NCGC00181381-01, PD 407824, and Ro 28-1675) with inhibitor activity were also proposed as novel candidates for CRC in this study. Among those, importazole is a transport receptor importin-β (47) and AG 957 is a protein tyrosine kinase inhibitor (48). Moreover, brazilin is a NF-kappaB inhibitor (49) and PD 407824, a hepatoprotective agent, is known as Wee1/Chk1 inhibitor (50), whereas Ro 28-1675 is known as glucokinase activator (51). However, the action mechanisms of NCGC00182353-01 and NCGC00181381-01 were not identified yet (Supplementary Table 5).
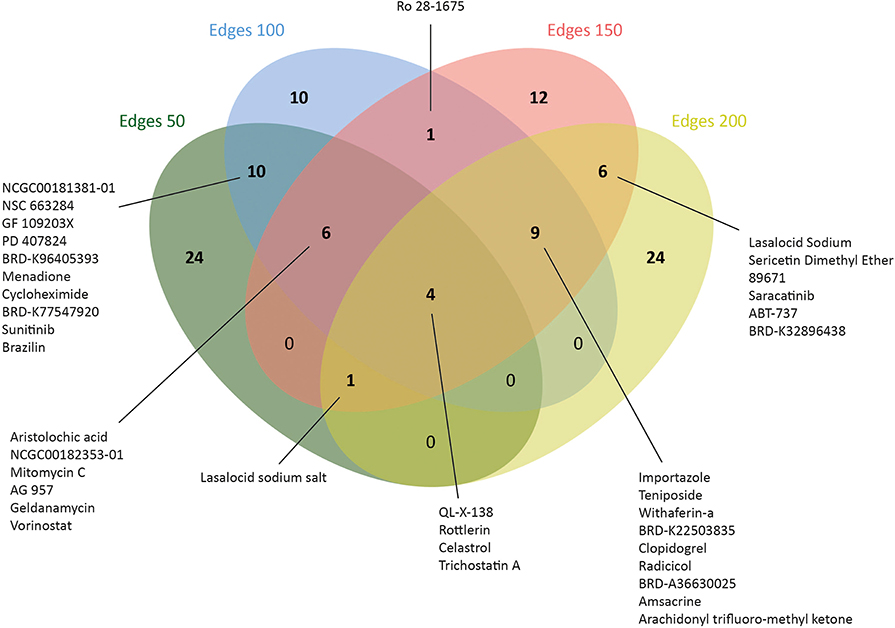
Figure 5. Number of drugs that were identified via drug repositioning for each co-expressed network.
The traditional path of drug development, that is, finding a proper drug target, identifying a potential drug, and setting up experimental assays to test the efficiency of the proposed drug, is a time-consuming and high-cost process. However, molecular docking, which simulates the binding affinity of a drug in three-dimensional structure of a drug target, can be implemented as a higher resolution simulation method (52) and is accepted as the most useful method to predict the binding affinity of the drug–target complex with minimum free energy (53).
We performed molecular docking simulations on three different domains of ABCB1: the ATP binding sites (NBD1 and NBD2) and TMD, which is the site of substrate recognition and translocation (54). The binding activities estimated by molecular docking simulations are shown in Figure 6.
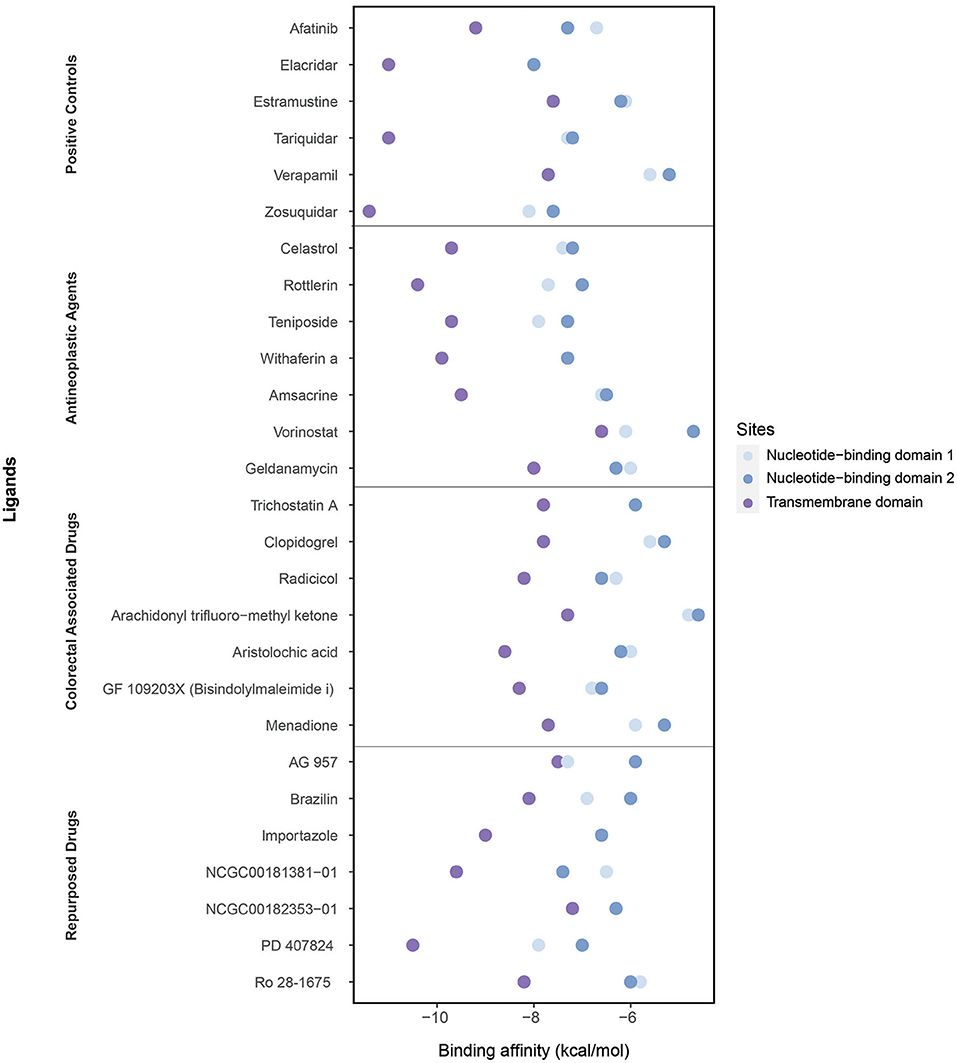
Figure 6. Binding affinities of ligands (the positive controls, antineoplastic agents, colorectal associated, and repurposed drugs) estimated through the molecular docking simulations considering three domains: the nucleotide-binding domain 1, nucleotide-binding domain 2, and transmembrane domain.
As the positive controls, the well-known ABCB1 inhibitors afatinib, elacridar, estramustine, tariquidar, verapamil, and zosuquidar were used. Afatinib, estramustine, and zosuquidar were antineoplastic agents, elacridar was an acridonecarboxamide derivative, tariquidar was an anthranilamide derivative, and verapamil was an antihypertensive calcium blocker channel. The binding affinities of afatinib, elacridar, tariquidar, and zosuquidar on TMD were −9.2, −11, −11, and −11.4 kcal/mol, respectively, which were significantly high compared with those for estramustine (−7.6 kcal/mol) and verapamil (−7.7 kcal/mol). Although the binding affinities of the ligands were lower in NBDs (when compared with those in TMD), the highest results were obtained in elacridar (NBD1: −8 kcal/mol, NBD2: −8 kcal/mol), tariquidar (NBD1: −7.3 kcal/mol, NDB2 −7.2 kcal/mol), and zosuquidar (NBD1: −8.1 kcal/mol, NBD2: −7.6 kcal/mol) (Supplementary Table 6). On the contrary, while focusing on the antineoplastic agents, we obtained the high binding affinities by docking at TMD with the colorectal associated drugs and repurposed drugs (Supplementary Table 4). Overall, TMD came into prominence as a promising site for ligand binding to inhibit ABCB1.
The high binding affinities of these drugs were rottlerin (−10.4 kcal/mol), withaferin A (−9.9 kcal/mol), teniposide (−9.7 kcal/mol), and celastrol (−9.7 kcal/mol) in antineoplastic agents section; aristolochic acid (−8.6 kcal/mol), GF 109203X (−8.3 kcal/mol), and radicicol (−8.2 kcal/mol) inside of colorectal associated section; and finally when we look at the novel drugs, the high binding affinities of these drugs were PD 407824 (−10.5 kcal/mol), NCGC00181381-01 (−9.6 kcal/mol), importazole (−9 kcal/mol), Ro 28-1675 (−8.2 kcal/mol), and brazilin (−8.1 kcal/mol) in repurposed drugs section. As a comparison of these novel drugs with positive controls, brazilin, importazole, NCGC00181381-01, PD 407824, and Ro 28-1675 showed that the importance of repurposed drugs reversing the effect of caused by ABCB1 (Figure 7). Moreover, it was investigated that the targetability of co-expressed TFs that regulate ABCB1 by the potential drugs with possible drug-resistant reversal effect in ABCB1. the protein structures were investigated for 17 TFs determined on the co-expression network, however, only two of them (FOXO3 and SPDEF) were found as having a structure for molecular docking analysis. All drugs indicated in Figure 7 were docked on these two TFs and binding affinities were given in Supplementary Table 7.
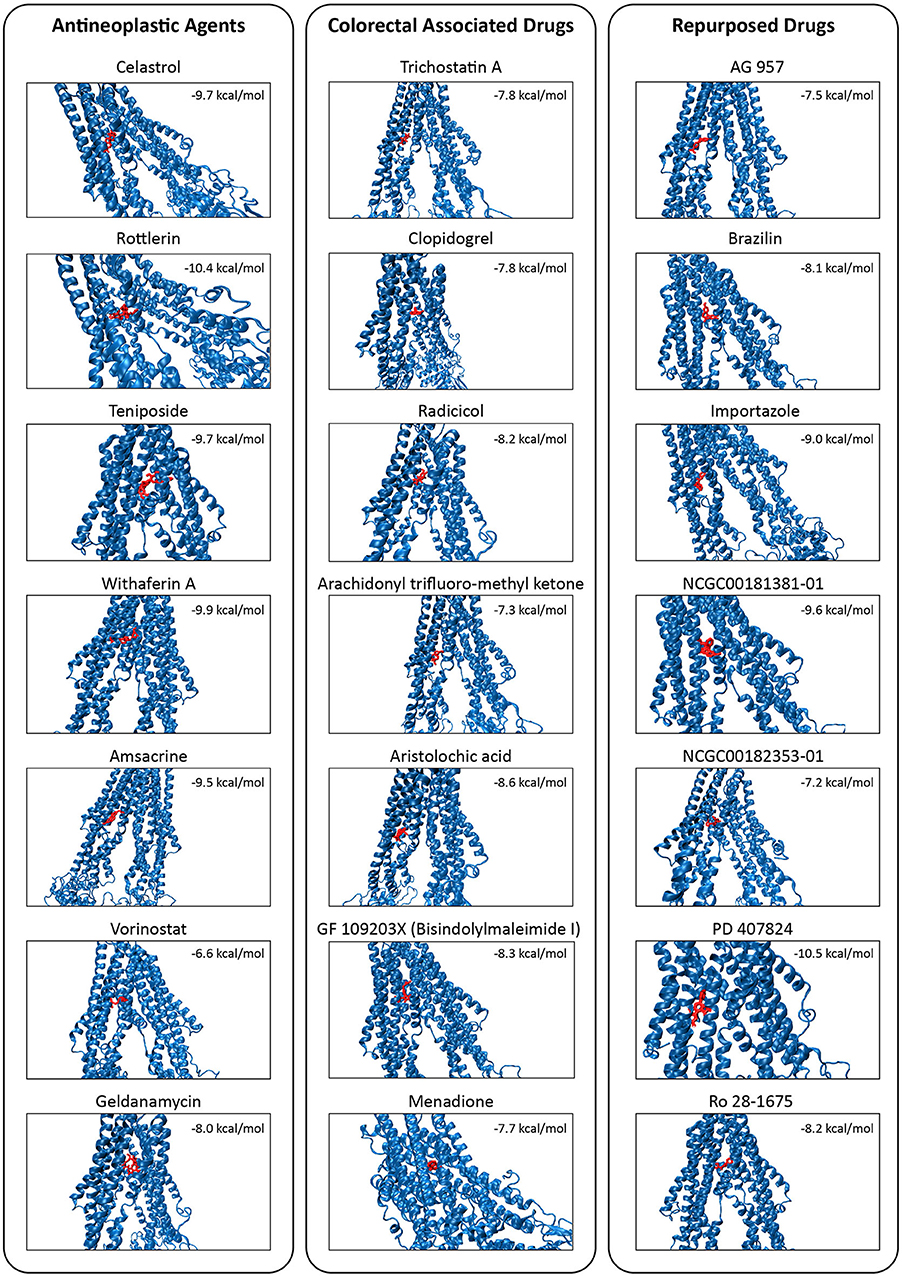
Figure 7. Molecular docking simulations of the candidate drugs (shown in red) on TMD of the MDR1 protein (shown in blue). Binding affinity for each protein-drug docking was indicated.
The Cross-Validation of Repurposed Drugs Using Transcriptomic Codes of Drug-Resistant HT29 Cells
An in silico cross-validation study was performed using transcriptome data for genes co-expressed with ABCB1 in drug-resistant HT29 cells. We acquired transcriptome datasets of oxaliplatin-resistant, methotrexate-resistant, and SN38-resistant HT29 cancer cell lines (Table 1). After analyzing DEGs in resistant cell lines, we queried these gene expressions for drug repositioning by L1000-CDS2 as same as we performed within co-expressed modules. All drugs offering reversal expression patterns against drug-resistant cell lines are listed in Supplementary Table 2. A comparison of these drugs with the drug candidates previously identified through co-expression networks presented common signatures as illustrated in Figure 8.
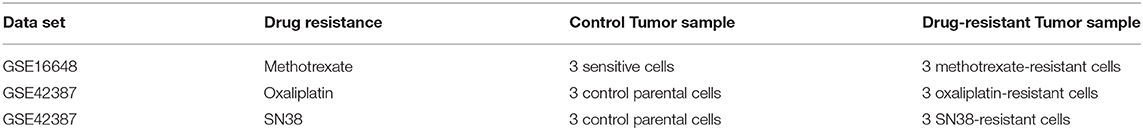
Table 1. Information about the data sets used for the identification of DEGs and candidate repurposed drugs.
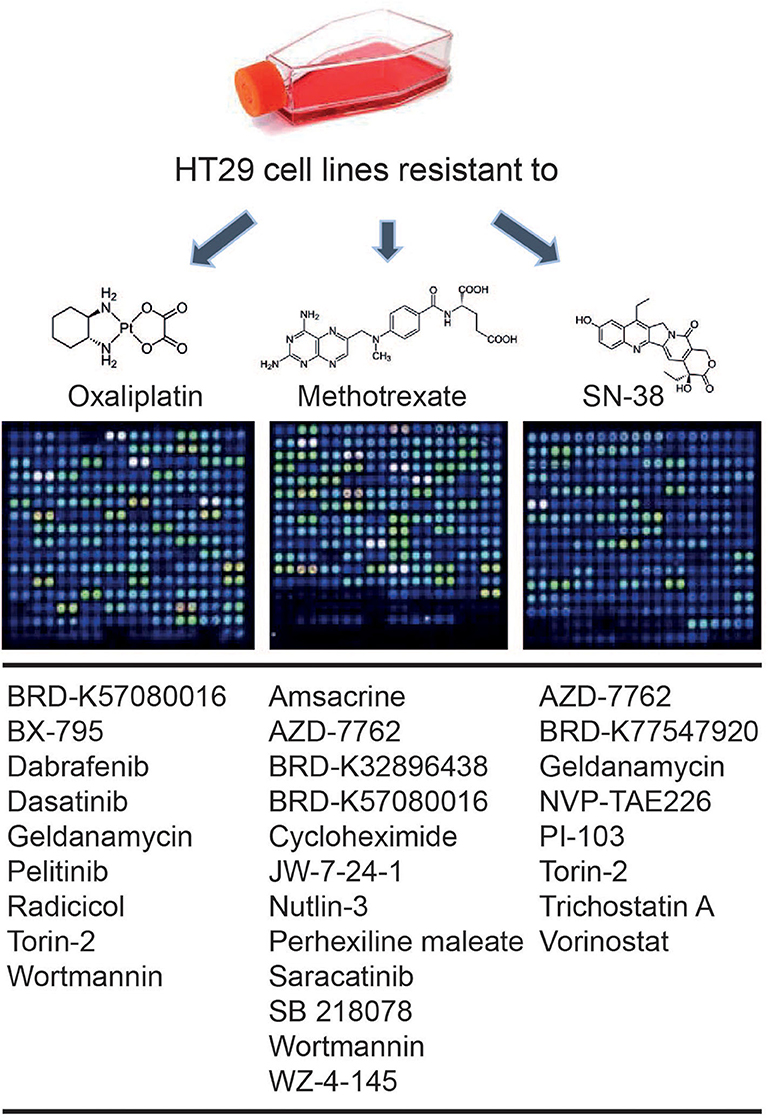
Figure 8. Drugs identified throughout the study in both methods: drug repurposing through (1) ABCB1 mediated co-expression networks and (2) gene expression profiling in drug-resistant colorectal cancer cell lines.
Discussion
Drug resistance in cancer becomes more challenging in cancer therapy today. There are many underlying mechanisms of resistance parallel to the number of patients with cancer because each cancer case has its characteristics leading to various tumor progression or eventually death (55).
As same as others, drug-resistant colon cancer is still an obstacle for effective therapy and novel therapeutic strategies are urgently needed. Hence, investigation on the underlying mechanisms conferring drug resistance, as well as the development of safe and effective reversing agents by targeting these mechanisms, will play a pivotal role in the successful chemotherapy for colon cancer (56). To improve the current understanding of the MDR-1-related drug resistance in colorectal cancer, we explored gene co-expression networks around ABCB1 gene and repurposed candidate drugs for the treatment of CRC. The candidate drugs were also assessed by using molecular docking for determining the potential of physical interactions between the drug and MDR1 protein as a drug target. We also evaluated the diagnostic or prognostic features of co-expressed gene networks in CRC. Considering gene expression profiles in drug-resistant (i.e., oxaliplatin, methotrexate, SN38) HT29 cell lines, another drug repositioning strategy was applied to identify drugs that demonstrate a reversal effect on the transcriptomic reprogramming in CRC. All these results can shed light on the development of effective diagnosis, prognosis, and treatment strategies for drug resistance in CRC.
As one of the reasons for the resistance problem in patients with cancer, MDR-1 protein has been chosen as a target in this study. To improve the current understanding of the MDR-1-related drug resistance in CRC, we explored gene co-expression networks around ABCB1 gene encoding the MDR-1 protein. Disease co-expression networks in cancer are mainly used to explore systems biomarkers for exploring prognosis and treatment strategies (41, 42, 57).
Moreover, co-expression networks in different cancer types were applied not only for insights in cancer biology but also for drug repositioning (58). In this study, we outline a roadmap for tackling the problem of resistance by using co-expression networks for the first time to the best of our knowledge.
Our approach differs from previous drug repositioning studies in several respects. First, we use ABCB1 mediated co-expression network with different edge numbers which enable robust and sensitive detection of gene co-expression modules even around this protein whereas previous studies were only focused on MDR-1 protein as a drug target to overcome drug-resistance problem (59, 60).
Second, we applied the drug repositioning strategy by seeking a reversed expression effect of the disease condition. In previous studies, the differentially expressed genes were determined and used as a query for determining reversal expression patterns induced by drugs (45, 46, 61). Our input data for drug repositioning has an essential difference although we utilized a familiar strategy. Instead of using differential expressed genes, we employed positively and negatively correlated genes for ABCB1 protein as a proxy.
Lastly, our approach is independent of healthy samples and only focused on CRC-associated transcriptome data. Several previous studies focused on co-expression patterns in cancer as opposed to the normal transcriptome represented by healthy tissue samples. Although intuitive, such a strategy is prone to exclusion of disease-related modules that only superficially resemble normal ones (62, 63).
It should be noted that co-expression studies focusing on only a subset of genes rather than the entire transcriptome has an advantage from a computational perspective into translational science. This is caused by the fact that large networks are technically challenging for translational science into the clinic. Therefore, the use of robust co-expression modules in drug repositioning or biomarker studies is also another promising way of the current study.
Our findings emphasize the value of studying co-expression modules to overcome drug resistance and to exploit this knowledge for suggesting potential therapeutics. Such an approach is fundamentally different from the currently common drug repositioning studies with its starting point. Results can be employed either determining mechanisms underlying MDR-1 mediated drug resistance in CRC or it can be exploited to anticipate the new repurposed drugs for the treatment. Moreover, it can provide a complementary strategy for biomarker discovery in drug-resistant cancers as well as therapy options.
Data Availability Statement
The datasets presented in this study can be found in online repositories. The names of the repository/repositories and accession number(s) can be found in the article/Supplementary Material.
Author Contributions
BT designed the study. HB and GG performed the analyses and wrote the manuscript. BT, AM, and KA revised and contributed to the manuscript. All authors contributed to the article and approved the submitted version.
Funding
This work was supported by the Knut and Alice Wallenberg Foundation.
Conflict of Interest
The authors declare that the research was conducted in the absence of any commercial or financial relationships that could be construed as a potential conflict of interest.
Supplementary Material
The Supplementary Material for this article can be found online at: https://www.frontiersin.org/articles/10.3389/fonc.2020.01273/full#supplementary-material
References
1. Rahib L, Smith BD, Aizenberg R, Rosenzweig AB, Fleshman JM, Matrisian LM. Projecting cancer incidence and deaths to 2030: the unexpected burden of thyroid, liver, and pancreas cancers in the United States. Cancer Res. (2014) 74:2913–21. doi: 10.1158/0008-5472.CAN-14-0155
2. Bray F, Ferlay J, Soerjomataram I, Siegel RL, Torre LA, Jemal A. Global cancer statistics 2018: GLOBOCAN estimates of incidence and mortality worldwide for 36 cancers in 185 countries. CA Cancer J Clin. (2018) 68:394–424. doi: 10.3322/caac.21492
3. Bradlow L, Carruba G. Special issue: cancer OMICS. Omi A J Integr Biol. (2011) 15:91–2. doi: 10.1089/omi.2011.01ed
4. Mauricio MM. Modern strategies in cancer study: drug repositioning in colorectal cancer treatment. Nov Approaches Cancer Study. (2019) 2:212–6. doi: 10.31031/NACS.2019.02.000544
5. Neugut AI, Lin A, Raab GT, Hillyer GC, Keller D, O'Neil DS, et al. FOLFOX and FOLFIRI use in stage IV colon cancer: analysis of SEER-medicare data. Clin Colorectal Cancer. (2019) 18:133–40. doi: 10.1016/j.clcc.2019.01.005
6. Douillard JY, Cunningham D, Roth AD, Navarro M, James RD, Karasek P, et al. Irinotecan combined with fluorouracil compared with fluorouracil alone. As first-line treatment for metastatic colorectal cancer: a multicentre randomised trial. Lancet. (2000) 355:1041–7. doi: 10.1016/S0140-6736(00)02034-1
7. Linn SC, Giaccone G. MDR1/P-glycoprotein expression in colorectal cancer. Eur J Cancer. (1995) 31:1291–4. doi: 10.1016/0959-8049(95)00278-Q
8. Gottesman MM, Pastan IH. The role of multidrug resistance efflux pumps in cancer: revisiting a JNCI publication exploring expression of the MDR1 (P-glycoprotein) gene. J Natl Cancer Inst. (2015) 107:4–6. doi: 10.1093/jnci/djv222
9. Robinson K, Tiriveedhi V. Perplexing Role of P-Glycoprotein in Tumor Microenvironment. Front Oncol. (2020) 10:265. doi: 10.3389/fonc.2020.00265
10. Turanli B, Altay O, Borén J, Turkez H, Nielsen J, Uhlen M, et al. Systems biology based drug repositioning for development of cancer therapy. Semin Cancer Biol. (in press) (2019) doi: 10.1016/j.semcancer.2019.09.020
11. Xue H, Li J, Xie H, Wang Y. Review of drug repositioning approaches and resources. Int J Biol Sci. (2018) 14:1232–44. doi: 10.7150/ijbs.24612
12. Nowak-Sliwinska P, Scapozza L, Altaba AR i. Drug repurposing in oncology: compounds, pathways, phenotypes and computational approaches for colorectal cancer. Biochim Biophys Acta. (2019) 1871:434–54. doi: 10.1016/j.bbcan.2019.04.005
13. Van Noort V, Schölch S, Iskar M, Zeller G, Ostertag K, Schweitzer C, et al. Novel drug candidates for the treatment of metastatic colorectal cancer through global inverse gene-expression profiling. Cancer Res. (2014) 74:5690–9. doi: 10.1158/0008-5472.CAN-13-3540
14. Díaz-Carballo D, Acikelli AH, Klein J, Jastrow H, Dammann P, Wyganowski T, et al. Therapeutic potential of antiviral drugs targeting chemorefractory colorectal adenocarcinoma cells overexpressing endogenous retroviral elements. J Exp Clin Cancer Res. (2015) 34:1–13. doi: 10.1186/s13046-015-0199-5
15. Koh SL, Ager EI, Costa PLN, Malcontenti-Wilson C, Muralidharan V, Christophi C. Blockade of the renin-angiotensin system inhibits growth of colorectal cancer liver metastases in the regenerating liver. Clin Exp Metastasis. (2014) 31:395–405. doi: 10.1007/s10585-014-9635-8
16. Chung FH, Chiang YR, Tseng AL, Sung YC, Lu J, Huang MC, et al. Functional Module Connectivity Map (FMCM): a framework for searching repurposed drug compounds for systems treatment of cancer and an application to colorectal adenocarcinoma. PLoS ONE. (2014) 9:e86299. doi: 10.1371/journal.pone.0086299
17. Lee S, Zhang C, Arif M, Liu Z, Benfeitas R, Bidkhori G, et al. TCSBN: a database of tissue and cancer specific biological networks. Nucleic Acids Res. (2018) 46:D595–600. doi: 10.1093/nar/gkx994
18. Shannon P, Markiel A, Ozier O, Baliga NS, Wang JT, Ramage D, et al. Cytoscape: a software Environment for integrated models of biomolecular interaction networks. Genome Res. (2003) 13:2498–504. doi: 10.1101/gr.1239303
19. Kamburov A, Stelzl U, Lehrach H, Herwig R. The ConsensusPathDB interaction database: 2013 update. Nucleic Acids Res. (2013) 41:D793–800. doi: 10.1093/nar/gks1055
20. Kanehisa M, Furumichi M, Tanabe M, Sato Y, Morishima K. KEGG: new perspectives on genomes, pathways, diseases and drugs. Nucleic Acids Res. (2017) 45:D353–61. doi: 10.1093/nar/gkw1092
21. Croft D, O'Kelly G, Wu G, Haw R, Gillespie M, Matthews L, et al. Reactome: a database of reactions, pathways and biological processes. Nucleic Acids Res. (2011) 39:D691–7. doi: 10.1093/nar/gkq1018
22. Nishimura D. BioCarta. Biotech Softw Internet Rep. (2001) 2:117–20. doi: 10.1089/152791601750294344
23. Benjamini Y, Hochberg Y. Controlling the false discovery rate: a practical and powerful approach to multiple testing. J R Stat Soc Ser B. (1995) 57:289–300. doi: 10.1111/j.2517-6161.1995.tb02031.x
24. Duan Q, Reid SP, Clark NR, Wang Z, Fernandez NF, Rouillard AD, et al. L1000CDS2: LINCS L1000 characteristic direction signatures search engine. npj Syst Biol Appl. (2016) 2:1–12. doi: 10.1038/npjsba.2016.15
25. Campillos M, Kuhn M, Gavin AC, Jensen LJ, Bork P. Drug target identification using side-effect similarity. Science. (2008) 321:263–6. doi: 10.1126/science.1158140
26. Berman HM, Battistuz T, Bhat TN, Bluhm WF, Bourne PE, Burkhardt K, et al. The protein data bank. Acta Crystallogr Sect D Biol Crystallogr. (2002) 58:899–907. doi: 10.1107/S0907444902003451
27. Kim S, Chen J, Cheng T, Gindulyte A, He J, He S, et al. PubChem 2019 update: improved access to chemical data. Nucleic Acids Res. (2019) 47:D1102–9. doi: 10.1093/nar/gky1033
28. Vahedi S, Chufan EE, Ambudkar SV. Global alteration of the drug-binding pocket of human P-glycoprotein (ABCB1) by substitution of fifteen conserved residues reveals a negative correlation between substrate size and transport efficiency. Physiol Behav. (2017) 143:53–64. doi: 10.1016/j.bcp.2017.07.014
29. Trott O, Olson AJ. AutoDock Vina: improving the speed and accuracy of docking with a new scoring function, efficient optimization, and multithreading. J Comput Chem. (2010) 31:455–61. doi: 10.1002/jcc.21334.AutoDock
30. Kim Y, Chen J. Molecular structure of human P-glycoprotein in the ATP-bound, outward-facing conformation. Science. (2018) 359:915–9. doi: 10.1126/science.aar7389
31. Barrett T, Wilhite SE, Ledoux P, Evangelista C, Kim IF, Tomashevsky M, et al. NCBI GEO: archive for functional genomics data sets - Update. Nucleic Acids Res. (2013) 41:D991–5. doi: 10.1093/nar/gks1193
32. Jiang B, Yan LJ, Wu Q. ABCB1 (C1236T) polymorphism affects P-glycoprotein-mediated transport of methotrexate, doxorubicin, actinomycin D, and etoposide. DNA Cell Biol. (2019) 38:485–90. doi: 10.1089/dna.2018.4583
33. Ghanbarian M, Afgar A, Yadegarazari R, Najafi R, Teimoori-Toolabi L. Through oxaliplatin resistance induction in colorectal cancer cells, increasing ABCB1 level accompanies decreasing level of miR-302c-5p, miR-3664-5p and miR-129-5p. Biomed Pharmacother. (2018) 108:1070–80. doi: 10.1016/j.biopha.2018.09.112
34. Goldwirt L, Beccaria K, Carpentier A, Farinotti R, Fernandez C. Irinotecan and temozolomide brain distribution: a focus on ABCB1. Cancer Chemother Pharmacol. (2014) 74:185–93. doi: 10.1007/s00280-014-2490-0
35. Calimlioglu B, Karagoz K, Sevimoglu T, Kilic E, Gov E, Arga KY. Tissue-specific molecular biomarker signatures of type 2 diabetes: an integrative analysis of transcriptomics and protein-protein interaction data. Omi A J Integr Biol. (2015) 19:563–73. doi: 10.1089/omi.2015.0088
36. Kori M, Gov E, Arga KY. Molecular signatures of ovarian diseases: insights from network medicine perspective. Syst Biol Reprod Med. (2016) 62:266–82. doi: 10.1080/19396368.2016.1197982
37. Bolstad BM, Irizarry RA, Åstrand M, Speed TP. A comparison of normalization methods for high density oligonucleotide array data based on variance and bias. Bioinformatics. (2003) 19:185–93. doi: 10.1093/bioinformatics/19.2.185
38. Smyth GK. Linear models and empirical bayes methods for assessing differential expression in microarray experiments. Stat Appl Genet Mol Biol. (2004) 3:Article3. doi: 10.2202/1544-6115.1027
39. Aguirre-Gamboa R, Gomez-Rueda H, Martínez-Ledesma E, Martínez-Torteya A, Chacolla-Huaringa R, Rodriguez-Barrientos A, et al. SurvExpress: an online biomarker validation tool and database for cancer gene expression data using survival analysis. PLoS ONE. (2013) 8:e74250. doi: 10.1371/journal.pone.0074250
40. Gulfidan G, Turanli B, Beklen H, Sinha R, Arga KY. Pan-cancer mapping of differential protein-protein interactions. Sci Rep. (2020) 10:3272. doi: 10.1038/s41598-020-60127-x
41. Gov E, Arga KY. Differential co-expression analysis reveals a novel prognostic gene module in ovarian cancer. Sci Rep. (2017) 7:1–10. doi: 10.1038/s41598-017-05298-w
42. Aydin B, Arga KY. Co-expression network analysis elucidated a core module in association with prognosis of nonfunctioning non-invasive human pituitary adenoma. Front Endocrinol (Lausanne). (2019) 10:361. doi: 10.3389/fendo.2019.00361
43. Ghandadi M, Sahebkar A. Interleukin-6: A Critical Cytokine in Cancer Multidrug Resistance. Curr Pharm Des. (2016) 22:518–26. doi: 10.2174/1381612822666151124234417
44. Sun T, Zhao Q, Zhang C, Cao L, Song M, Maimela NR, et al. Screening common signaling pathways associated with drug resistance in non-small cell lung cancer via gene expression profile analysis. Cancer Med. (2019) 8:3059–71. doi: 10.1002/cam4.2190
45. Turanli B, Zhang C, Kim W, Benfeitas R, Uhlen M, Arga KY, et al. Discovery of therapeutic agents for prostate cancer using genome-scale metabolic modeling and drug repositioning. EBioMedicine. (2019) 42:386–96. doi: 10.1016/j.ebiom.2019.03.009
46. Turanli B, Karagoz K, Bidkhori G, Sinha R, Gatza ML, Uhlen M, et al. Multi-omic data interpretation to repurpose subtype specific drug candidates for breast cancer. Front Genet. (2019) 10:420. doi: 10.3389/fgene.2019.00420
47. Soderholm JF, Bird SL, Kalab P, Sampathkumar Y, Hasegawa K, Uehara-Bingen M, et al. Importazole, a small molecule inhibitor of the transport receptor importin-β. ACS Chem Biol. (2011) 6:700–8. doi: 10.1021/cb2000296
48. Anafi M, Gazit A, Gilon C, Ben-Neriah Y, Levitzki A. Selective interactions of transforming and normal abl proteins with ATP, tyrosine-copolymer substrates, and tyrphostins. J Biol Chem. (1992) 267:4518–23.
49. Weinmann D, Mueller M, Walzer SM, Hobusch GM, Lass R, Gahleitner C, et al. Brazilin blocks catabolic processes in human osteoarthritic chondrocytes via inhibition of NFKB1/p50. J Orthop Res. (2018) 36:2431–8. doi: 10.1002/jor.24013
50. Feng L, Cook B, Tsai SY, Zhou T, LaFlamme B, Evans T, et al. Discovery of a small-molecule BMP sensitizer for human embryonic stem cell differentiation. Cell Rep. (2016) 15:2063–75. doi: 10.1016/j.celrep.2016.04.066
51. Haynes NE, Corbett WL, Bizzarro FT, Guertin KR, Hilliard DW, Holland GW, et al. Discovery, structure-activity relationships, pharmacokinetics, and efficacy of glucokinase activator (2 R)-3-cyclopentyl-2-(4-methanesulfonylphenyl)-N- thiazol-2-yl-propionamide (RO0281675). J Med Chem. (2010) 53:3618–25. doi: 10.1021/jm100039a
52. Li YY, Jones SJ. Drug repositioning for personalized medicine. Genome Med. (2012) 4:27. doi: 10.1186/gm326
53. Kumar S, Kumar S. “Molecular docking: a structure-based approach for drug repurposing,” In: Roy K, editor. In Silico Drug Design. Cambridge, MA: Academic Press (2019). p. 161–89. doi: 10.1016/b978-0-12-816125-8.00006-7
54. Szöllosi D, Rose-Sperling D, Hellmich UA, Stockner T. Comparison of mechanistic transport cycle models of ABC exporters. Biochim Biophys Acta. (2018) 1860:818–32. doi: 10.1016/j.bbamem.2017.10.028
55. Vasan N, Baselga J, Hyman DM. A view on drug resistance in cancer. Nature. (2019) 575:299–309. doi: 10.1038/s41586-019-1730-1
56. Hu T, Li Z, Gao CY, Cho CH. Mechanisms of drug resistance in colon cancer and its therapeutic strategies. World J Gastroenterol. (2016) 22:6876. doi: 10.3748/wjg.v22.i30.6876
57. Kori M, Gov E, Arga KY. Novel genomic biomarker candidates for cervical cancer as identified by differential co-expression network analysis. Omi A J Integr Biol. (2019) 23:261–73. doi: 10.1089/omi.2019.0025
58. Ivliev AE T, Hoen PAC, Borisevich D, Nikolsky Y, Sergeeva MG. Drug repositioning through systematic mining of gene coexpression networks in cancer. PLoS ONE. (2016) 11:e0165059. doi: 10.1371/journal.pone.0165059
59. Chen J, Ding Z, Peng Y, Pan F, Li J, Zou L, et al. HIF-1α inhibition reverses multidrug resistance in colon cancer cells via downregulation of MDR1/P-Glycoprotein. PLoS ONE. (2014) 9:e98882. doi: 10.1371/journal.pone.0098882
60. Aires V, Colin DJ, Doreau A, Pietro A, Di Heydel JM, Artur Y, et al. P-glycoprotein 1 affects chemoactivities of resveratrol against human colorectal cancer cells. Nutrients. (2019) 11:2098. doi: 10.3390/nu11092098
61. Li X, Turanli B, Juszczak K, Kim W, Arif M, Sato Y, et al. Classification of clear cell renal cell carcinoma based on PKM alternative splicing. Heliyon. (2020) 6:e03440. doi: 10.1016/j.heliyon.2020.e03440
62. Choi JK, Yu U, Yoo OJ, Kim S. Differential coexpression analysis using microarray data and its application to human cancer. Bioinformatics. (2005) 21:4348–55. doi: 10.1093/bioinformatics/bti722
Keywords: colorectal cancer, drug repositioning, multi-drug resistance, P-glycoprotein, co-expression networks, multi-drug resistance protein
Citation: Beklen H, Gulfidan G, Arga KY, Mardinoglu A and Turanli B (2020) Drug Repositioning for P-Glycoprotein Mediated Co-Expression Networks in Colorectal Cancer. Front. Oncol. 10:1273. doi: 10.3389/fonc.2020.01273
Received: 16 April 2020; Accepted: 19 June 2020;
Published: 13 August 2020.
Edited by:
Xiaoju Wang, University of Michigan, United StatesReviewed by:
Zhe-Sheng Chen, St. John's University, United StatesYuqi Yang, St. John's University, United States
Copyright © 2020 Beklen, Gulfidan, Arga, Mardinoglu and Turanli. This is an open-access article distributed under the terms of the Creative Commons Attribution License (CC BY). The use, distribution or reproduction in other forums is permitted, provided the original author(s) and the copyright owner(s) are credited and that the original publication in this journal is cited, in accordance with accepted academic practice. No use, distribution or reproduction is permitted which does not comply with these terms.
*Correspondence: Adil Mardinoglu, adilm@scilifelab.se; Beste Turanli, beste.turanli@medeniyet.edu.tr
†These authors have contributed equally to this work