 Arturas Ziemys1
 Michelle Kim2
 Alexander M. Menzies3,4,5
 James S. Wilmott4
 Georgina V. Long3,4,5
 Richard A. Scolyer4,5,6
 Larry Kwong7
 Ashley Holder1,8
 Genevieve Boland2*
- 1Department of Nanomedicine, Houston Methodist Research Institute, Houston, TX, United States
- 2Department of Surgery, Massachusetts General Hospital, Boston, MA, United States
- 3Department of Medical Oncology, Westmead Hospital, Westmead, NSW, Australia
- 4Melanoma Institute of Australia, The University of Sydney, Sydney, NSW, Australia
- 5Sydney Medical School, The University of Sydney, Sydney, NSW, Australia
- 6Department of Tissue Pathology and Diagnostic Oncology, Royal Prince Alfred Hospital and New South Wales Health Pathology, Camperdown, NSW, Australia
- 7University of Texas MD Anderson Cancer Center, Houston, TX, United States
- 8Department of Surgery, Houston Methodist Hospital, Houston, TX, United States
Metastatic melanoma is one of the most immunogenic malignancies due to its high rate of mutations and neoantigen formation. Response to BRAF inhibitors (BRAFi) may be determined by intratumoral immune activation within melanoma metastases. To evaluate whether CD8+ T cell infiltration and distribution within melanoma metastases can predict clinical response to BRAFi, we developed a methodology to integrate immunohistochemistry with automated image analysis of CD8+ T cell position. CD8+ distribution patterns were correlated with gene expression data to identify and quantify “hot” areas within a tumor. Furthermore, the relative activation of CD8+cells, based on transcriptomic analysis, and their relationship to other CD8+ T cells and non-CD8+ cells within the tumor suggested a less crowded distribution of cells around activated CD8+ T cells. Furthermore, the relative activation of these CD8+ T cells was associated with improved clinical outcomes and decreased tumor cell proliferation. This study demonstrates the potential of digital pathomics to incorporate immune cell spatial distribution within metastases and RNAseq analysis to predict clinical response to BRAF inhibition in metastatic melanoma.
Introduction
The immune system is known to play a critical role in cancer pathogenesis, prognosis, and response to therapy (1–3). Indeed, activation of the immune system is critical for initiating tumor cell recognition and death, with or without therapy (4). However, immune response to cancer varies widely from patient to patient, and the extent to which this variation correlates with successful treatment remains a complex question that depends on the type of therapy given, the pre-therapy tumor microenvironment, and the neoantigens that are available for immune cell recognition (5). Due in part to a high mutation and neoantigen formation rate, metastatic melanoma is one of the most highly immunogenic cancers with the ability to induce adaptive immune responses (6), making it an ideal cancer type in which to address the role of immune cells in therapy responsiveness.
Although the high immunogenicity of melanoma has led to its widespread success in being treated with immune checkpoint inhibitors (7), the role of the immune system in targeted therapy is less well-defined. Despite data suggesting immunotherapy after BRAF inhibitor (BRAFi) therapy is associated with a lower response rate (8, 9), there are data suggesting that early treatment changes with BRAFi may actually improve antitumor immune responses (10, 11) and expression of tumor antigens (12) suggesting a cooperative interplay between initial BRAFi-induced changes and intratumoral immune activation (13, 14). Relevantly, high pre-treatment immune signatures were recently identified to correlate with tumor regression in melanoma patients undergoing BRAFi therapy (15), based on reverse phase protein array (RPPA) and RNA sequencing analyses, suggesting that immune signatures might serve as baseline biomarkers for response to BRAFi. Nevertheless, it remains unclear how this knowledge can be translated into the clinical setting. We propose that cytopathologic assessments are practical approaches, but the initial suggestive biomarker findings must first be validated (16).
Here, we have analyzed tumor-associated cytotoxic T cell localization and density in metastatic melanoma tumors prior to BRAFi therapy. Utilizing immunohistochemistry (IHC), we explored the idea that not only cell densities, but also the spatial positioning of CD8+ T cells and tumor cells within samples might correlate with clinical outcomes. We showcase the use of automated cell position detection software with machine learning algorithms to achieve deep statistical analyses of metastases prior to treatment with targeted therapy. Assessment of RNAseq data in conjunction with IHC nominated several genes with previously undescribed correlations between cellular distribution/density, CD8+ cell localization, and clinical outcomes. Furthermore, analysis of known CD8+ cell activation markers relative to known exhaustion markers revealed correlations with clinical outcomes that were independent of CD8+ cell density.
Materials/Methods
Patient Cohort/Samples
Fifty-two patients with metastatic melanoma treated at two institutions were included for analysis: Massachusetts General Hospital (MGH) and the Melanoma Institute Australia (MIA). Patients included were > 18 years, had a diagnosis of metastatic melanoma (unresectable stage III or stage IV), and were treated with targeted therapy at standardly approved doses. IRB approval was obtained at each institution prior to study enrollment and written informed consent was obtained from patients prior to analysis. Accessible tumors amenable for biopsy were sampled from metastatic sites prior to treatment with BRAFi or combination BRAFi plus MEK-inhibitor (MEKi). A separate informed consent document was signed for all additional procedures. Patient characteristics are in Supplemental Table 1.
Immunohistochemistry
Slides of patients with a known BRAF V600E mutation were obtained from the Massachusetts General Hospital (n = 17) and the Melanoma Institute Australia (n = 35) and underwent staining for CD8+ T cells at pre-treatment time points. Slides were scanned using the NDP Nanozoomer HT (Hamamatsu Photonics). After formal dermatopathology review, the whole slide images were digitized using the Hamamatsu NDP viewer and tumor area was annotated. Whole slide images (.npdi) and corresponding tumor annotations (.xml) were imported to Definiens Tissue Studio (Definiens, Inc). Nuclei were segmented using hematoxylin stain and simulated membrane. We identified CD8+ cells, which were DAB or AP Red positive cells. For further spatial analysis, x- and y-coordinates of each individual cell were exported, cell spatial analysis was accomplished as described in the integrative data analysis section.
Sequencing of mRNA
Transcriptome sequencing principles and its utility to assess gene expression have been previously described (17). Data was generated based on Illumina chemistry with mean sequencing quality = 37, library insert size = 150 bp, mapping rate = 99%, and expression profiling efficiency = 0.79 as previously described (15). RNA-seq data were previously deposited in the European Genome-phenome Archive (EGA S00001000992).
Integrative Data Analysis
Cartesian coordinates of CD8+ and other (cells other than CD8+; referred as non-CD8+ cells or NC) cells were used to calculate a CD8+ cell density heatmap with a 100 μm grid in a tissue tessellation process, as illustrated in Figures 1, 2. Non-tissue grid areas were excluded from analysis. By using CD8+ heatmaps, tissue areas with highest CD8+ cell density were designated as “hot” areas and the percentage of this “hot” area relative to the entire tissue area on the grid was designated as %HOT. Next, spatial and descriptive statistics of CD8+ cells were separately analyzed in the entire tissue grid and in %HOT area and then correlated with clinical outcomes and RNAseq data. Cell spatial distribution analysis was accomplished with custom scripts in Python (www.python.org) and libraries numpy (numpy.org; ver. 1.17) and scipy (www.scipy.org; ver. 1.4).
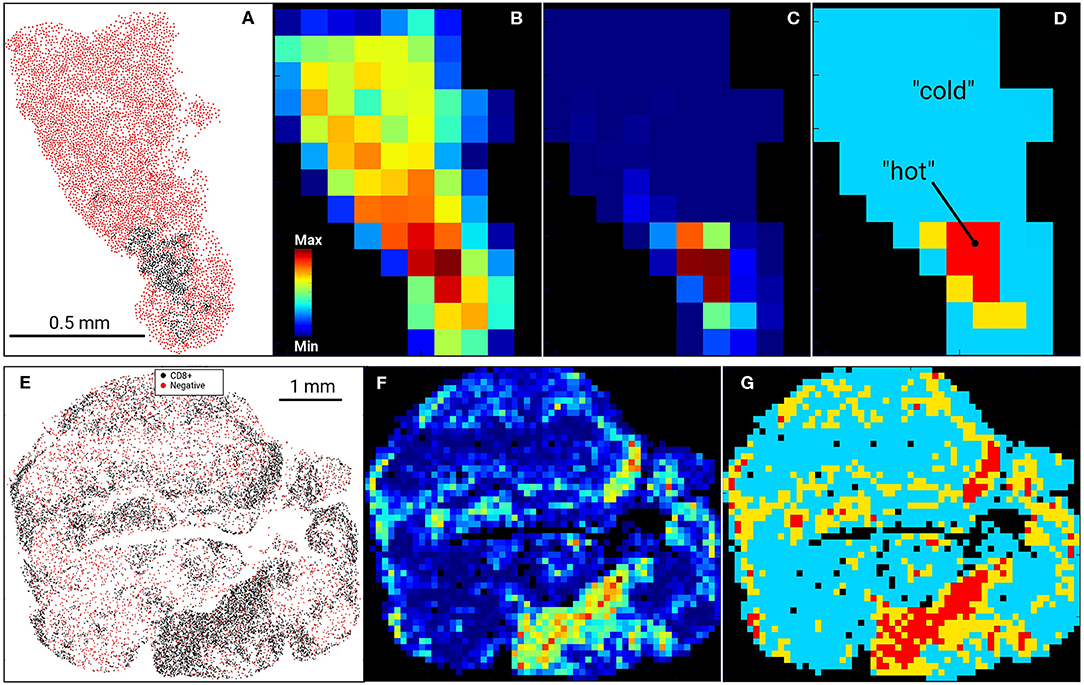
Figure 1. Digital Imaging Analysis. Examples of US (top row, A–D) and AU (bottom row, E–G) tissue samples and processing. Input data (A–US cohort; E–AU cohort) were tessellated into a rectangular 100 μm grid and cell heatmaps were calculated for all cells (B) or CD8+ cell density (C,F). CD8+ heatmaps were used to segment tissue into CD8+-cold (low density) and CD8+-hot (high density) areas, where %HOT and %COLD denotes the area fractions of tissues corresponding to CD8+-hot and cold segments relative to the entire tissue heatmap (D,G). (D) designates “hot” as red, “cold” as blue and thus %HOT = (area of “hot segments)/(area of all segments of tissue on grid).
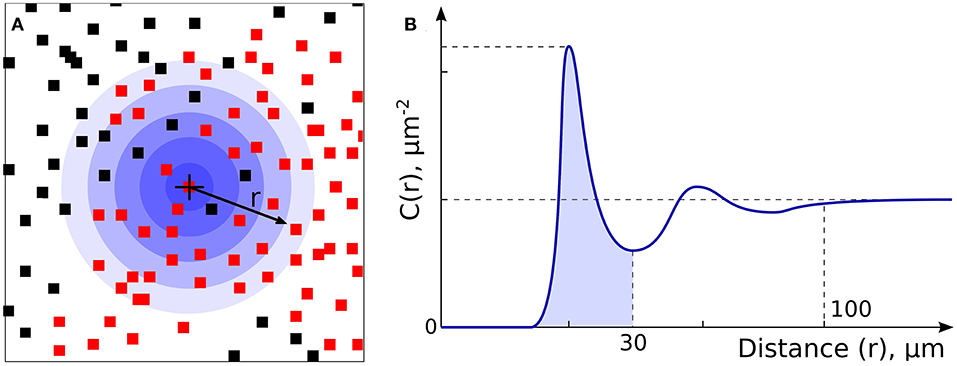
Figure 2. Non-CD8+ and T cell Spatial Relationships. (A) Non-CD8+ cells (NCs, black dots) and T cells (red dots) were analyzed to allow assessment of density and spatial relationships. (B) Analysis of radial cell concentration, C(r), allows assessment of the concentration of cells of certain type around CD8+ or NC.
All gene expression data (~55,000 genes) of patients from RNAseq analysis was correlated to clinical outcomes and spatial CD8 properties with a Python script. All genes were used because the ratio of genes may define biological state of CD8 cell for which we have to rely on all available gene expression data. Each correlation instance was accomplished by using numpy Python library and its numpy.corrcoef() function, which calculated Pearson correlation coefficients. Because the function returns a correlation coefficient matrix, only the non-diagonal elements were used to characterize the correlation between a gene transcription and other clinical characteristics. Then, the calculated correlation tables were assembled in LibreOffice (www.libreoffice.org). “The statistical significance for plotted correlations was calculated based on student's t-test statistics using SigmaPlot software (systatsoftware.com/products/sigmaplot/).
Results
Digital Imaging Allows Single-Cell Resolution of Non-CD8+ Cells (NCs) and Tumor-Infiltrating CD8+ Cells
In our previous work (15), RNA levels of CD8A and CD8B (markers of cytolytic T cells) in tumors from patients prior to initiating BRAFi therapy demonstrated a positive correlation with eventual tumor regression after treatment. To validate this data at the protein level, we utilized immunohistochemistry to assess non-CD8+ cell (NC) and CD8+ cell densities in pre-treatment biopsies from two separate melanoma cohorts, one from the Massachusetts General Hospital (US) and one from Melanoma Institute Australia (AU). Slides were digitally scanned and CD8+-negative cells (NCs) and CD8+-positively-staining cells were identified and assigned positional coordinates, creating a tissue-specific heatmap amenable to deep statistical assessment. Figure 1 provides examples of US and AU slides and processing. Using the cell coordinates (Figures 1A,E), samples were tessellated in a rectangular grid, allowing us to calculate the means and standard deviations of cell densities. Furthermore, this allowed the creation of cell heatmaps (Figures 1B,C,F) and automatically segmented tissue into “CD8+-cold” and “CD8+-hot” areas (Figures 1D,G). Non-labeled cell (NC) and CD8+ T cells were enumerated and evaluated for cellular density relationships and spatial distribution across the tumors (Figure 2). The initial analysis focused on enumeration of cellular populations, dividing samples into non CD8+ cells (NCs) and CD8+ T cells for comparison across the two cohorts.
CD8+ Spatial Distribution Is a Clinically Meaningful Parameter and Reflects Patient-Specific Tumoral Heterogeneity
Our initial analysis of CD8+ cell counts did not show correlation with clinical outcome measures including RECIST response, progression-free survival (PFS), or overall survival (OS) in either cohort (Supplemental Figure 1). We therefore explored other potential factors that could explain the lack of concordance between CD8+ T cell enumeration via IHC and our RNAseq correlations of T cell markers with clinical outcomes (15). We hypothesized that the spatial distribution of CD8+ T cell might be a statistically useful parameter rather than considering only CD8+ cell counts. Specifically, we noted that some samples showed foci of high density, clustered CD8+ T cells vs. other samples that had more diffuse patterns of CD8+ T cells. Given that pockets of dense cytolytic activity may produce different outcomes compared to CD8+ T cells with a more sparse and uniform localization, we proceeded to systematically examine density and localization of T cells within the samples. When samples were examined for both intra-cohort and intra-patient CD8+ heterogeneity, we found that CD8+ cell densities were similar in the two cohorts (Figure 3A). Intra-patient heterogeneity in CD8+ densities were more pronounced than inter-group variability (Figure 3A). In other words, there was a wide diversity in high-density CD8+ clusters vs. diffuse CD8+ T cell distribution patterns within individual patient tissue samples as compared to within cohorts. However, there is a significant difference in the mean intra-patient variability between the US and Australian (AU) cohorts of patients (Figure 3B). This finding suggests that CD8+ cells are distributed inhomogeneously and that this inhomogeneity is variable from patient to patient, making it a clinically meaningful parameter for further correlation analyses (18). It is clear that there are differences in BRAF mutation rates that vary geographically [i.e., higher rates of V600K/R vs. V600E in Australia, likely reflecting differential UV exposure (18, 26)]. In our cohort, 30% of the Australian patients had a BRAF V600K mutation, as compared to 12.5% of the MGH cohort. It is apparent that this higher UV exposure in the Australian cohorts can impact tumor mutational burden, number of tumor infiltrating lymphoctyes (TIL), and subsequent response to therapy. Overall, the Australian cohort may demonstrate differences in TIL, which will impact CD8+ variability and variability as seen in Figure 3.
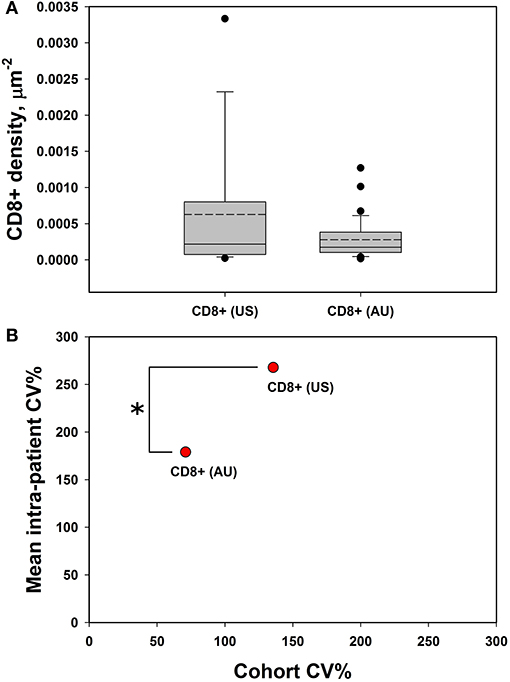
Figure 3. CD8+ cells demonstrate high intra-tumoral heterogeneity. (A) CD8+ cell densities are similar across the US and AU cohorts. (B) There was greater intra-patient heterogeneity than cohort heterogeneity across both cohorts (AU and US cohorts differ by intra-patient CV%; p = 0.014 by student's t-test), suggesting that CD8+ cell density may be a meaningful clinical variable for analysis. *p < 0.05, CV = coefficient of variance.
A Scoring System for T Cell Density and Spatial Distribution Allows Global Assessment of “Hot” and “Cold” Areas of a Tumor
The terms %COLD and %HOT were then used to denote the proportion of the tumor corresponding to the CD8+ depleted (“cold”) and CD8+-enriched “hot” areas. In summary, our approach allows us to investigate not only overall CD8+ infiltration, but also its heterogeneity and the pattern of local non CD8+ cell (NC) and CD8+ cell neighborhoods within individual tumors. Using our novel algorithm, each sample was segmented into CD8+-cold (low density) and CD8+-hot (high density) areas, and %HOT and %COLD were defined to denote the corresponding tissue area fractions (Figure 4). The segmentation algorithm enabled us to examine the CD8+ cell local microenvironment in greater depth (Figure 4A). The analysis starts with individual CD8+ cells and calculates cell-cell distances and radial cell concentration profiles. CD8+ cells are tightly surrounded by as much as 90% of other CD8+ cells (red) within CD8+-hot tissue areas and up to 95% non CD8+ cells (NC) in cold areas (blue). We find that %HOT is loosely correlated with CD8+ cell density (Figure 4B) and correlates with CD8+ T cell infiltration variance, supporting it as a readout of CD8+ heterogeneity (Figure 4C).
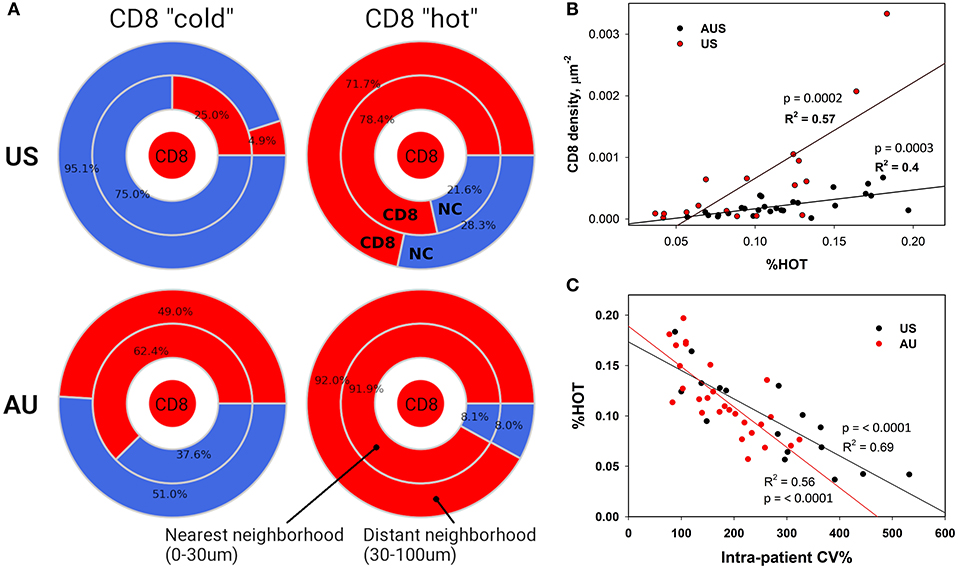
Figure 4. Neighborhood Analysis Defines CD8+ “Hot” and “Cold” Regions. (A) Cellular composition surrounding CD8+ cells was calculated for CD8+ hot and cold tissue segments. The numbers represent calculated percentages of cells (red – CD8+, blue – negative or “other” cells) composing the immediate (0–30 μm) and distant (30–100 μm) neighborhoods of CD8+ cells. (B) These densely packed CD8+ “hot” areas also correlate with higher numbers of infiltrating CD8+ cells and (C) lower CD8+ intra-patient heterogeneity.
Increased Relative T Cell Activation via Paired IHC and RNAseq Analysis Is Associated With Improved Clinical Outcomes
We sought to understand if there are underlying properties of CD8+ infiltration in melanoma metastases that could affect clinical outcomes of BRAFi treatment; however, our initial analysis did not reveal any substantial support for this hypothesis. In fact, there was a lack of strong positive correlations between clinical outcomes and the absolute number of infiltrated CD8+ cells. However, following this unexpected result, we recognized our analysis may not characterize the functional status of CD8+ cells. Clearly, the immunological viability depends not only on the density of CD8+ cells but also on the biological activity of CD8+ cells, namely activation vs. exhaustion. Thus, we analyzed our RNAseq data for commonly accepted gene signatures of CD8+ activation (CD69, HLA-DRA, HL-DRB1, CD25/IL2RA, CD134/OX40, CD134/ILA) and exhaustion (PD1, T-bet, EOMES, Tim3, LAG3, CTLA4, TIGIT) (19). The activation gene panel was expanded to include granzymes (GZMA, GZMB) and interferon-gamma (INGγ), as the gene expression products responsible for the cytotoxic function of CD8+ cells (Figure 5A). The gene expression in both activated and exhaustion panels were positively correlated with CD8+ density in melanoma metastases, as illustrated by the activation marker CD25 and the Exhaustion marker T-bet (Figure 5B). These results are not unexpected and serve as an internal control, suggesting these gene signatures represent a true CD8+ cell population. However, gene expression for individual activation or exhaustion markers did not correlate with survival.
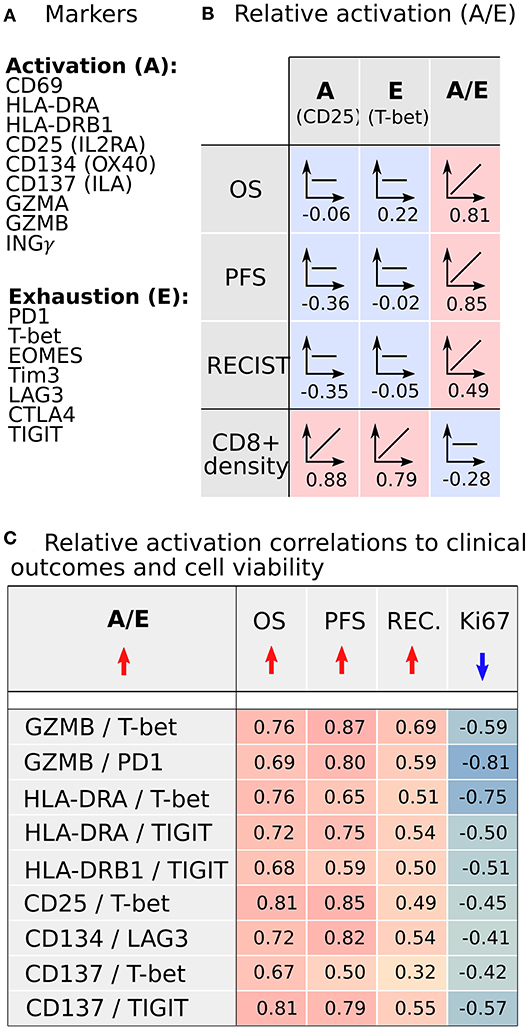
Figure 5. CD8+ activation and exhaustion transcriptome analysis from metastases demonstrates that increased relative CD8+ activation (A/E) correlates with improved clinical outcomes following BRAFi. (A) Transcriptomic signals of established CD8+ activation and exhaustion genes were analyzed. (B) Expression of individual activation or exhaustion genes correlated with CD8+ cell density but not clinical outcomes. However, the ratio of activation to exhaustion gene expression (A/E; CD8+ relative activation) directly correlated with clinical outcomes and was independent of CD8+ infiltration density. (C) Nine A/E ratios demonstrated better clinical outcomes (OS, PFS, RECIST) with increased A/E and reduced melanoma cell proliferation (Ki67).
Since the functional status of CD8+ cells depends on the balance between activation and exhaustion, we analyzed the activation-exhaustion ratio (A/E), which we termed the Relative Activation, for the aforementioned A/E gene pairs. With this approach, we incorporated the effect of tumor-infiltrating immune cells in a more complete manner. Each relative activation was directly correlated to OS, suggesting that specific activation and exhaustion marker pairs are strongly related to clinical outcomes (Figure 5C). A/E correlation analysis indicated that the increasing A/E ratios (increasing activation, decreasing exhaustion, or both) was associated with reduced cell proliferation based on Ki67 staining (Figure 5C) and with increased OS (Figure 5C; range of R = 0.67–0.81), PFS (R = 0.50–0.87), and RECIST (R = 0.32–0.69) after BRAFi therapies in the US cohort. Interestingly, relative activation of GZMB showed strong inverse correlations to NC packing, including around CD8+ cells (Figure 6), suggesting that spatial distribution of activated CD8+ cells relative to other CD8+ cells and negative cells may affect lethality of cytotoxic T cells, specifically that suppressive effects of exhausted CD8+ cells may decrease the cytotoxicity of activated CD8+ T cells (CTL), despite these CTLs being in close proximity to negative cells that undoubtedly include tumor cells. While this data supports a direct correlation between clinical outcomes, transcriptome, and cellular spatial organization in tumors, there are limitations to the conclusions that can be made from our study. Notably, identifying whether cellular spatial organization or gene expression is the most significant factor in determining not only activity of CD8+ cells but also clinical outcomes necessitates a larger future investigation to assess causality.
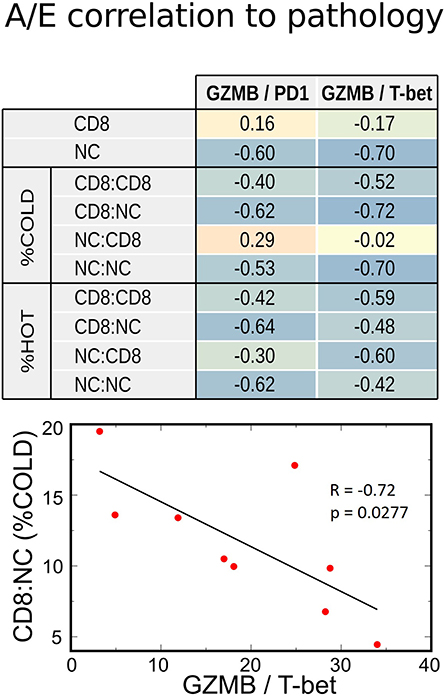
Figure 6. Correlations between transcriptome and IHC spatial immune profiling. Increasing relative CD8+ activation (represented by GZMB/PD1 or GZMB/T-bet ratios) strongly correlated with decreased Negative Cell (NC) density, especially in metastases with poor CD8+ infiltration (%COLD). This inverse correlation was also noted with NC clustering among themselves (NC:NC) and around CD8 + cells (CD8:NC). Therefore, a high CD8+ A/E ratio was associated with lower density of cell packing in tumors.
Discussion
In this study, we probed the question of whether unbiased analysis of non CD8+ cell (NC) and CD8+ cytopathologic characteristics can provide prognostic information relating to melanoma clinical responses to BRAF-inhibitor therapy, similar to approaches that have been used to assess the role of spatial distribution of CD8+ cells in the clinical outcome of patients with treatment-naive melanoma (20). In that work, spatial location of CD8+ cells but not relative percentage was directly correlated with overall and disease-free survival. The authors proposed that anti-cancer immune response requires direct interactions between CD8+ cells and malignant melanocytes, a justification for the meticulous image analysis to describe the distances between cells and provide a more complete representation of the intratumoral immune microenvironment. Besides melanoma, studies of other tumor types have suggested the importance of immune cell spatial distribution in clinical outcome. One study of pancreatic cancer tissue samples identified that increased T-cell infiltration (high vs. low), and also specifically cytotoxic T cell infiltration, was associated with increased overall survival (21). Furthermore, the proximity of cytotoxic T cells to cancer cells significantly correlated with increased overall survival. That study specifically noted that markers of T-cell activation could provide additional insight into the response to immunotherapy of pancreatic cancer compared to melanoma. By overlapping RNAseq data with IHC and computational image processing analysis, another study of both pancreatic cancer and head and neck squamous cell carcinoma primary tumor samples concluded that immune context could be used to predict therapeutic responses (22). Likewise, we identified that CD8+ distribution patterns (i.e., amount of “hot” tumor) correlate with gene expression data in the same cohort. These simple cytopathologic characteristics may serve as statistically robust parameters and create an early blueprint for how such parameters can be calculated and applied using machine-learning algorithms for detection, mapping, and quantification of immune cell infiltrates in melanoma metastases. In future studies, we envision applying this approach (i.e., %HOT) to larger panels of tumor and immune cell markers and with additional defining parameters such as location relative to the tumor-stromal borders.
Other studies have also demonstrated the importance of evaluating the phenotype of immune cells along with spatial distribution. In a study of primary melanoma tumors with spatial analysis of immune infiltration, another group similarly concluded that specifically activated cytotoxic T cells were prognostic, thus supporting our hypothesis that the activation status plays a critical role in clinical outcomes (23). In non-small cell lung cancer tumor samples, Barua et al. identified infiltration of Tregs, but not absolute CD8+ cells, to be a negative clinical marker yet increased infiltration of CD8+ cytotoxic T cells were capable of mitigating this effect (24). Similar to our findings that CD8+ density did not correlate with clinical outcomes and that relative activation may be a better prognostic marker, a study of pancreas tumors suggested that higher %Treg rather than absolute numbers of T cells was associated with decreased survival (25). Moreover, we similarly identified correlations between increased CD8+ activation/exhaustion ratio (Relative CD8+ activation) in melanoma metastases and improved survival and RECIST following BRAFi therapy, as well as decreased cell proliferation (Ki67 expression), suggesting that T cell activation status may not only predict clinical outcomes but also survival following BRAFi. Our results also underscore that the complexity of the tumor microenvironment necessitates combination variables including future studies with analysis of other immune cells within the tumor to develop a predictive spatial image biomarker.
Overall, these findings support the hypothesis that the immune system is a vital component in determining the effectiveness of targeted therapies on patient outcomes. Comprehensive studies are needed to dissect the immune contribution and identify potential synergistic immune-agonist approaches to combination therapy. In conclusion, through integration of two distinct data sets examining IHC staining of CD8+ cells in the setting of BRAF V600 mutant patients treated with MAPK-targeted therapy, we demonstrated that the absolute number of CD8+ T cells infiltrating into a melanoma metastasis does not strongly correlate with clinical outcomes, while density and spatial relationships offer biologically meaningful insights. Limitations of our study include gene expression data being available only for the US cohort and the inclusion of non-CD8+ immune cells in the “other” cells in our spatial analysis. However, our study is unique for its focus on metastatic melanoma tissue samples and on the comprehensive approach of spatial distribution and immune cell activation to predict response to BRAFi. The relative cell-cell distribution statistics can provide relationships to clinical outcomes and the cell transcriptome that were previously unappreciated, reinforcing the importance of multidisciplinary approaches to not only the rational design of patient therapies but also research discovery, even in the metastatic setting. Our study represents a step toward the incorporation of spatial coordinates to study the behavior and potential prognostic ability of tumor-infiltrating immune cells.
Data Availability Statement
The datasets generated for this study can be found in the European Genome-Phenome Archive (EGA EGAS00001000992).
Ethics Statement
The studies involving human participants were reviewed and approved by Dana Farber Harvard Cancer Center, Protocol 11-181 (PI: Boland). The patients/participants provided their written informed consent to participate in this study.
Author Contributions
AZ led the imaging and RNAseq analysis, assisted in manuscript preparation and writing. MK was involved in data interpretation and manuscript writing. AM was responsible for material acquisition and data generation. JW, GL, and RS were material contributors and involved in manuscript preparation. LK was involved in hypothesis generation, data generation and interpretation, and manuscript preparation. AH was integral in data analysis and interpretation and manuscript preparation. GB was responsible for experimental planning, data generation, material contributions, data analysis, and manuscript preparation.
Funding
This work was supported by funding from the Adelson Medical Research Foundation. This work was also supported by a National Health and Medical Research Council of Australia (NHMRC) Program Grant and NHMRC Practitioner Fellowship grant program. Support from Melanoma Institute Australia and The Ainsworth Foundation is also gratefully acknowledged.
Conflict of Interest
RS has received fees for professional services from Merck Sharp & Dohme, GlaxoSmithKline Australia, Bristol-Myers Squibb, Dermpedia, Novartis Pharmaceuticals Australia Pty Ltd, Myriad, NeraCare and Amgen. GB has sponsored research agreements with Takeda Oncology, Olink Proteomics, and Palleon Pharmaceuticals. GB has received fees for professional services from Novartis, NW Biotherapeutics, and Nektar Therapeutics. GL has served as an advisor or consultant to Aduro, Amgen, Bristol-Myers Squibb, Mass-Array, Merck, MSD, Novartis, OncoSec Medical, Pierre Fabre, Roche, and Sandoz. AM has served on advisory boards for BMS, MSD, Novartis, Roche, Pierre-Fabre.
The remaining authors declare that the research was conducted in the absence of any commercial or financial relationships that could be construed as a potential conflict of interest.
Acknowledgments
Assistance from colleagues at Melanoma Institute Australia, Royal Prince Alfred Hospital, Sydney, Australia is gratefully acknowledged.
Supplementary Material
The Supplementary Material for this article can be found online at: https://www.frontiersin.org/articles/10.3389/fonc.2020.00757/full#supplementary-material
Abbreviations
RNA, ribonucleic acid; CD8, cluster of differentiation factor 8; RPPA, reverse phase protein array; RNAseq, ribonucleic acid sequencing; DAB - 3,3′, Diaminobenzidine; mRNA, messenger ribonucleic acid; NC, CD8+ negative cells; RECIST, Response evaluation criteria in solid tumors; PFS, progression free survival; OS, overall survival; A/E, activation to exhaustion ratio.
References
1. Dunn GP, Old LJ, Schreiber RD. The three Es of cancer immunoediting. Annu Rev Immunol. (2004) 22:329–60. doi: 10.1146/annurev.immunol.22.012703.104803
2. Jochems C, Schlom J. Tumor-infiltrating immune cells and prognosis: the potential link between conventional cancer therapy and immunity. Exp Biol Med. (2011) 236:567–79. doi: 10.1258/ebm.2011.011007
3. Galon J, Pages F, Marincola FM, Thurin M, Trinchieri G, Fox BA, et al. The immune score as a new possible approach for the classification of cancer. J Transl Med. (2012) 10:1. doi: 10.1186/1479-5876-10-1
4. Salman T. Spontaneous tumor regression. J Oncol Sci. (2016) 2:1–4. doi: 10.1016/j.jons.2016.04.008
5. Jenkins RW, Barbie DA, Flaherty KT. Mechanisms of resistance to immune checkpoint inhibitors. Br J Cancer. (2018) 118:9–16. doi: 10.1038/bjc.2017.434
6. Zeuthen J, Dzhandzhugazyan K, Hansen MR, Kirkin AF. The immunogenic properties of human melanomas and melanoma-associated antigens recognized by cytotoxic T lymphocytes. Bratisl Lek Listy. (1998) 99:426–34.
7. Tawbi HA, Forsyth PA, Algazi A, Hamid O, Hodi FS, Moschos SJ, et al. Combined nivolumab and ipilimumab in melanoma metastatic to the brain. N Engl J Med. (2018) 379:722–30. doi: 10.1056/NEJMoa1805453
8. Ackerman A, Klein O, Mcdermott DF, Wang W, Ibrahim N, Lawrence DP, et al. Outcomes of patients with metastatic melanoma treated with immunotherapy prior to or after BRAF inhibitors. Cancer. (2014) 120:1695–701. doi: 10.1002/cncr.28620
9. Ascierto PA, Margolin K. Ipilimumab before BRAF inhibitor treatment may be more beneficial than vice versa for the majority of patients with advanced melanoma. Cancer. (2014) 120:1617–9. doi: 10.1002/cncr.28622
10. Ilieva KM, Correa I, Josephs DH, Karagiannis P, Egbuniwe IU, Cafferkey MJ, et al. Effects of BRAF mutations and BRAF inhibition on immune responses to melanoma. Mol Cancer Ther. (2014) 13:2769–83. doi: 10.1158/1535-7163.MCT-14-0290
11. Wilmott JS, Long GV, Howle JR, Haydu LE, Sharma RN, Thompson JF, et al. Selective BRAF inhibitors induce marked T-cell infiltration into human metastatic melanoma. Clin Cancer Res. (2012) 18:1386–94. doi: 10.1158/1078-0432.CCR-11-2479
12. Frederick DT, Piris A, Cogdill AP, Cooper ZA, Lezcano C, Ferrone CR, et al. BRAF inhibition is associated with enhanced melanoma antigen expression and a more favorable tumor microenvironment in patients with metastatic melanoma. Clin Cancer Res. (2013) 19:1225–31. doi: 10.1158/1078-0432.CCR-12-1630
13. Hugo W, Shi H, Sun L, Piva M, Song C, Kong X, et al. Non-genomic and immune evolution of melanoma acquiring MAPKi resistance. Cell. (2015) 162:1271–85. doi: 10.1016/j.cell.2015.07.061
14. Knight DA, Ngiow SF, Li M, Parmenter T, Mok S, Cass A, et al. Host immunity contributes to the anti-melanoma activity of BRAF inhibitors. J Clin Invest. (2013) 123:1371–81. doi: 10.1172/JCI66236
15. Kwong LN, Boland GM, Frederick DT, Helms TL, Akid AT, Miller JP, et al. Co-clinical assessment identifies patterns of BRAF inhibitor resistance in melanoma. J Clin Invest. (2015) 125:1459–70. doi: 10.1172/JCI78954
16. Gnjatic S, Bronte V, Brunet LR, Butler MO, Disis ML, Galon J, et al. Identifying baseline immune-related biomarkers to predict clinical outcome of immunotherapy. J Immunother Cancer. (2017) 5:44. doi: 10.1186/s40425-017-0243-4
17. Torres-Garcia W, Zheng S, Sivachenko A, Vegesna R, Wang Q, Yao R, et al. PRADA: pipeline for RNA sequencing data analysis. Bioinformatics. (2014) 30:2224–6. doi: 10.1093/bioinformatics/btu169
18. Menzies AM, Haydu LE, Carlino MS, Azer MW, Carr PJ, Kefford RF, et al. Inter- and intra-patient heterogeneity of response and progression to targeted therapy in metastatic melanoma. PLoS ONE. (2014) 9:e85004. doi: 10.1371/journal.pone.0085004
19. Anderson AC, Joller N, Kuchroo VK. Lag-3, Tim-3, and TIGIT: co-inhibitory receptors with specialized functions in immune regulation. Immunity. (2016) 44:989–1004. doi: 10.1016/j.immuni.2016.05.001
20. Donizy P, Biecek P, Kaczorowski M, Halon A, Maciejczyk A, Matkowski R. Contrary effect of two types of spatial distribution (diffuse versus marginal) of CD8-positive lymphocytes on clinical outcome in melanoma patients. Int J Clin Exp Pathol. (2016) 9:8415–23. Available online at: http://www.ijcep.com/files/ijcep0029449.pdf
21. Carstens JL, Correa De Sampaio P, Yang D, Barua S, Wang H, Rao A, et al. Spatial computation of intratumoral T cells correlates with survival of patients with pancreatic cancer. Nat Commun. (2017) 8:15095. doi: 10.1038/ncomms15095
22. Tsujikawa T, Kumar S, Borkar RN, Azimi V, Thibault G, Chang YH, et al. Quantitative multiplex immunohistochemistry reveals myeloid-inflamed tumor-immune complexity associated with poor prognosis. Cell Rep. (2017) 19:203–17. doi: 10.1016/j.celrep.2017.03.037
23. Gartrell RD, Marks DK, Hart TD, Li G, Davari DR, Wu A, et al. Quantitative analysis of immune infiltrates in primary melanoma. Cancer Immunol Res. (2018) 6:481–93. doi: 10.1158/2326-6066.CIR-17-0360
24. Barua S, Fang P, Sharma A, Fujimoto J, Wistuba I, Rao AUK, et al. Spatial interaction of tumor cells and regulatory T cells correlates with survival in non-small cell lung cancer. Lung Cancer. (2018) 117:73–9. doi: 10.1016/j.lungcan.2018.01.022
25. Ino Y, Yamazaki-Itoh R, Shimada K, Iwasaki M, Kosuge T, Kanai Y, et al. Immune cell infiltration as an indicator of the immune microenvironment of pancreatic cancer. Br J Cancer. (2013) 108:914–23. doi: 10.1038/bjc.2013.32
Keywords: melanoma, targeted therapy (TT), immune infiltrate, spatial analysis, RNAseq
Citation: Ziemys A, Kim M, Menzies AM, Wilmott JS, Long GV, Scolyer RA, Kwong L, Holder A and Boland G (2020) Integration of Digital Pathologic and Transcriptomic Analyses Connects Tumor-Infiltrating Lymphocyte Spatial Density With Clinical Response to BRAF Inhibitors. Front. Oncol. 10:757. doi: 10.3389/fonc.2020.00757
Received: 29 February 2020; Accepted: 21 April 2020;
Published: 14 May 2020.
Edited by:
Suzie Chen, Rutgers, The State University of New Jersey, United StatesReviewed by:
Anna Bianchi-Smiraglia, University at Buffalo, United StatesGagan Chhabra, University of Wisconsin-Madison, United States
Copyright © 2020 Ziemys, Kim, Menzies, Wilmott, Long, Scolyer, Kwong, Holder and Boland. This is an open-access article distributed under the terms of the Creative Commons Attribution License (CC BY). The use, distribution or reproduction in other forums is permitted, provided the original author(s) and the copyright owner(s) are credited and that the original publication in this journal is cited, in accordance with accepted academic practice. No use, distribution or reproduction is permitted which does not comply with these terms.
*Correspondence: Genevieve Boland, gmboland@partners.org