Bone and Lean Mass Loss and Cognitive Impairment for Healthy Elder Adults: Analysis of the Nutrition and Health Survey in Taiwan 2013–2016 and a Validation Study With Structural Equation Modeling
 Sheng-Feng Lin
 Yen-Chun Fan
 Wen-Harn Pan
 Chyi-Huey Bai
- 1Department of Public Health, School of Medicine, College of Medicine, Taipei Medical University, Taipei, Taiwan
- 2School of Public Health, College of Public Health, Taipei Medical University, Taipei, Taiwan
- 3Department of Emergency Medicine, Taipei Medical University Hospital, Taipei, Taiwan
- 4Department of Critical Care Medicine, Taipei Medical University Hospital, Taipei, Taiwan
- 5Institute of Biomedical Sciences, Academia Sinica, Taipei, Taiwan
- 6Nutrition Research Center, Taipei Medical University Hospital, Taipei, Taiwan
Purpose: Bone and lean mass loss and cognitive impairment are prevalent in elder adults and have been hypothesized to share a potential link.
Methods: This nationwide cross-sectional study systemically sampled elder adults aged ≥65 years and conducted the door-to-door survey. The causal diagrams help to decide which covariates were included in the generalized linear mixed models (GLMMs). The structural equation modeling (SEM) was performed for the validation.
Results: A total of 535 participants were enrolled and categorized into the normal (67.3%), mild cognitive impairment (18.3%), and dementia groups (14.4%). With increasing in the severity of cognitive impairment, the bone marrow density and lean mass consistently showed the trend of decreasing values. In the GLMMs, a significant association existed between the decrease of the bone mineral density (BMD) and the Mini-Mental State Examination (MMSE) (β = 5.819 scores per g/cm2 decrease, p = 0.0305) with adjustment of the age, sex, and physical activity. The SEM models confirmed that the MMSE was significantly and directly predicted by the age (β = 0.1363, p = 0.0003) and BMD (β = 0.1251, p = 0.0006) independently and indirectly predicted by lean mass (β = 0.1138, p = 0.0003) through the bone density path.
Conclusion: In conclusion, an independent association between bone loss and cognitive impairment was existed rather than the confounding effect and the decrease of lean mass indirectly contributed to cognitive impairment by influencing the bone density.
Introduction
Skeletal deficit and muscle loss have emerged as major issues for elder adults (1–3). Several reports have documented the comorbidity of osteopenia and osteoporosis in patients with dementia (4–6). Bone loss has also been reported for sharing a distinctive connection to cognitive impairment (7). The mechanical unloading of the skeleton has been proposed to cause loss of bone mass in patients with aging (8). In addition, decreased physical activity (9), fragility, and sarcopenia (10) may also directly or indirectly contribute to bone loss in elder patients with dementia. Collectively, the connection between the boss loss and cognitive impairment is not easily elucidated and possibly as a result of confounding by related various factors.
Physiologists proposed a paradigm that bone remodeling and energy metabolism are coregulated through the brain–bone axis (11–13). The skeleton is a metabolically active system and undergoes bone resorption and bone formation in whole life (14). Investigation into the brain–bone axis began with an emphasis on leptin (15), a hormone secreted by the adipose cells with remarkable effects in the brain for coregulation of the appetite and bone accrual (12, 16). Low levels of leptin have been reported in Alzheimer's disease (16, 17). Moreover, the lean mass has been found in a major source of neurotrophic factors for preventing cognitive impairment (18). Accordingly, two correlated factors of bone and lean mass are needed to be considered simultaneously to explore the relationship between body composition and cognitive impairment in a statistical model. However, most of the epidemiological studies (4, 19–27) only considered one of the two correlated factors at a time. An epidemiological study investigating the link between the bone and lean mass cognitive impairment in elder adults, while effectively controlling multiple contributing factors is warranted.
In statistical analysis, one of the major challenges to investigating the influential factors on cognitive impairment is that the numerous variables, including age, physical activity, bone mass, and lean mass, are correlated with each other. With respect to the methodological advances and software development, a structural equation modeling (SEM) permits the illustration of the relationship among many factors (28, 29). The flexibility of SEM allows its application in a cross-sectional study and other research designs (28). While the causal relationship cannot be obtained from a cross-sectional study, a directed acyclic graph (DAG) provides a simple way to demonstrate the relationships between the variables and to evaluate if confounding was present in the model (30).
The National Nutrition and Health Survey in Taiwan (NAHSIT) 2005–2008 described that osteoporosis was estimated to affect one-fourth of the general population in Taiwan (31). A recent 2018 report indicated that the incidence and prevalence of osteoporosis in Taiwan were similar to those in most of the Western countries with aging populations as well (32). In this study, we like to investigate whether an association exists between cognitive impairment and bone loss in our community-based elder participants by using the latest survey data NAHSIT 2013–2016. We adopted two novel approaches: (1) using DAGs to identify the confounding variables that are needed to be adjusted in the conventional regression analysis and (2) conducting an SEM to validify the best model constructed by a DAG.
Methods
Study Design and Data Collection
The nationwide cross-sectional data were collected through the NAHSIT from January 1, 2013, to December 31, 2017, covering 359 townships or the city districts in Taiwan. The systematic sampling of the participants was classified into the eight strata by the characteristics of the population density, geographical area, and dietary habits. The door-to-door visits were carried out to obtain information of age, sex, body mass index (BMI), and physical activity by the trained interviewers. Mobile dual-energy X-ray absorptiometry (DXA) was performed to obtain the body composition parameters and the bone mineral density (BMD) in each specific body region. Based on the WHO definition, we defined osteoporosis as a BMD T-score (in g/cm2) of ≤2.5 at the femoral neck or the lumbar spine in those aged 65 years and older. The DXA device (Prodigy, GE Healthcare Lunar, Wisconsin, USA) was used. Elder participants aged ≥65 years who agreed to complete the physical assessment were enrolled. Besides, the lipid profiles, vitamin A, and vitamin D were measured in the centralized laboratory. This study was approved by the Institutional Review Board on Biomedical Science Research, Academia Sinica, Taiwan (AS-IRB01-13067) and the Research Ethics Committee, National Health Research Institutes, Taiwan (EC1020110). Informed consent was acquired from the participants.
Cognitive Assessment
The diagnosis for dementia due to all the causes was following the guideline by the National Institute on Aging-Alzheimer's Association workgroups. Taiwanese version of the Mini-Mental State Examination (MMSE) (33) assessment was performed by the trained interviewers. The participants were categorized into the normal cognition, mild cognitive impairment (MCI), and dementia groups according to the previous literature. First, the participants with the MMSE scores of 27–30 (≥9 education years) and of 26–30 (<9 education years) were classified into normal cognition. Second, the participants with the MMSE scores of 24–26 (≥9 education years) and of 23–25 (<9 education years) were classified into MCI. Third, the participants with the MMSE scores of 14–23 (≥9 education years) and of 11–22 (<9 education years) were classified into moderate dementia. Finally, the participants with the MMSE scores of 0–13 (≥9 education years) and of 0–10 (<9 education years) were classified into severe dementia (33).
Causal Diagram
The DAGs were plotted by background knowledge (Figure 1). In Model 1, the unbiased causal path between bone loss and cognitive impairment was plotted with adjustment of age and sex. In Model 2, the causal path was plotted with adjustment of age, sex, and physical activity. In Model 3, the causal path was plotted with adjustment of the age, sex, physical activity, vitamin D, and total lean mass. The DAGs were produced by the DAGitty version 3.0 software (University of Lübeck, Germany).
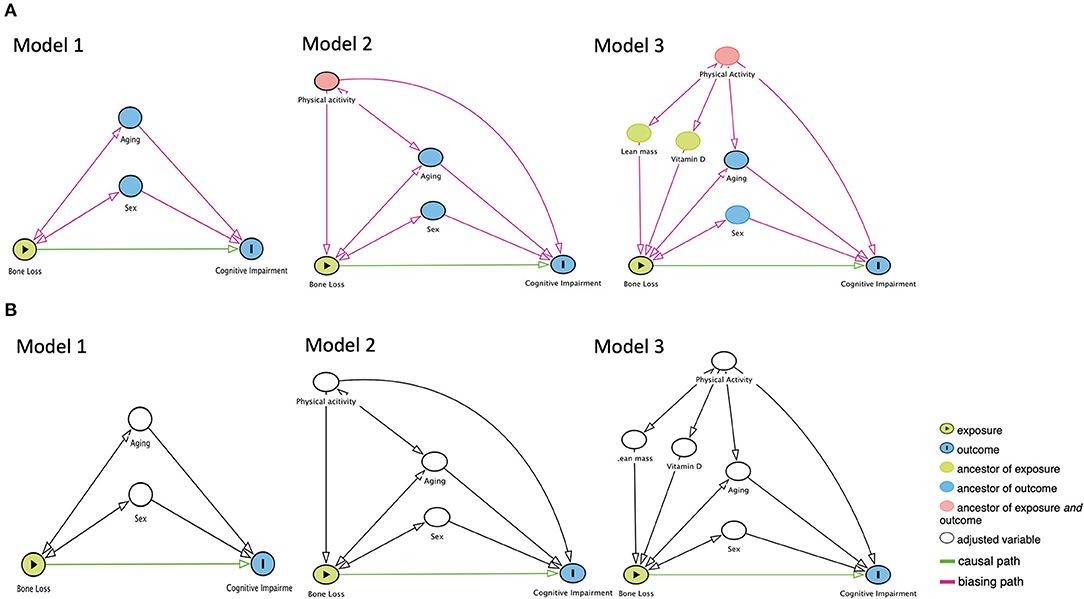
Figure 1. The proposed directed acyclic graphs between bone loss and cognitive impairment. (A) Models of the no adjustment of confounders. (B) Models of the adjustment of confounders.
Statistical Analysis
The continuous and discrete variables were analyzed through the ANOVA and chi-squared test, respectively. The p-trend for the three cognitive groups was estimated by the generalized linear models for continuous variables and the Cochran–Armitage trend test for the discrete variable. We used the DAGs to decide which covariates were adjusted and put them into the multivariable model for obtaining the unbiasing results. The generalized linear mixed models (GLMMs) with the random intercept and unstructured covariance matrix were applied, with the MMSE scores being dependent variables and with total BMD (unadjusted model); with total BMD, age, and sex (in Model 1); with total BMD, age, sex, and physical activity (in Model 2); or with total BMD, age, sex, physical activity, vitamin D, and total lean mass (in Model 3) being independent variables. The model fit statistics of the Akaike information criterion (AIC) and the Schwarz information criterion (SIC) were used to select the best model. For the AIC and the SIC, a lower score indicates a better model (34). The statistical significance was defined as two-tailed p < 0.05. All the statistical analyses were performed by using SAS 9.4 (Cary, North Carolina, USA). In the subgroup analysis by gender, the GLMMs with the above settings were applied. Required sample sizes for the subgroup analysis were estimated by specifying an α error of 0.05, a power (1-β) of 0.80, the number of covariates of 5, and the R2 values obtained in the unadjusted model.
Validation Study
To examine the relationship between bone loss and cognitive impairment in Models 1 to 3, we employed the SEM. For explaining the SEM fit, we focused on the chi-squared test, comparative fit index (CFI), and standardized root mean square residual (SRMR). The chi-squared test for the SEM with p < 0.05 was defined as a good model fit. The values of the CFI and SRMR ≥ 0.90 and the SEM < 0.80 were considered as acceptable levels of fit, respectively (35–37). For the assessment of the direct effects, β coefficient of < 0.05 was considered to be unmeaningful, β coefficient of 0.05–0.09 was small but meaningful, β coefficient of 0.10–0.24 was moderate, and β coefficient of ≥ 0.25 was large. For the assessment of the indirect effects, β coefficient of < 0.003 was unmeaningful, β coefficient of 0.003–0.010 was small but meaningful, β coefficient of 0.010–0.060 was moderate, and β coefficient of ≥ 0.060 was large (38).
Results
Demographic Characteristics
The flowchart of enrolling the elder participants in this cross-sectional study is shown in Figure 2. A total of 535 elder participants who completed the assessment were enrolled (Table 1). The average MMSE scores for the normal cognition, MCI, and dementia groups were 28.5 ± 1.2, 24.7 ± 1.0, and 12.8 ± 9.6 (p <0.0001, p-trend < 0.0001), respectively. In these three groups, the average ages were 71.3 ± 5.6, 73.2 ± 7.0, and 75.1 ± 6.8 (p < 0.0001, p-trend < 0.0001) and the education years were 9.5 ± 4.9, 8.2 ± 4.3, and 5.7 ± 4.2 (p < 0.0001, p-trend < 0.0001), respectively. Dementia and MCI groups had more female participants compared to the normal cognition. No significant difference in BMI was observed among these three groups.
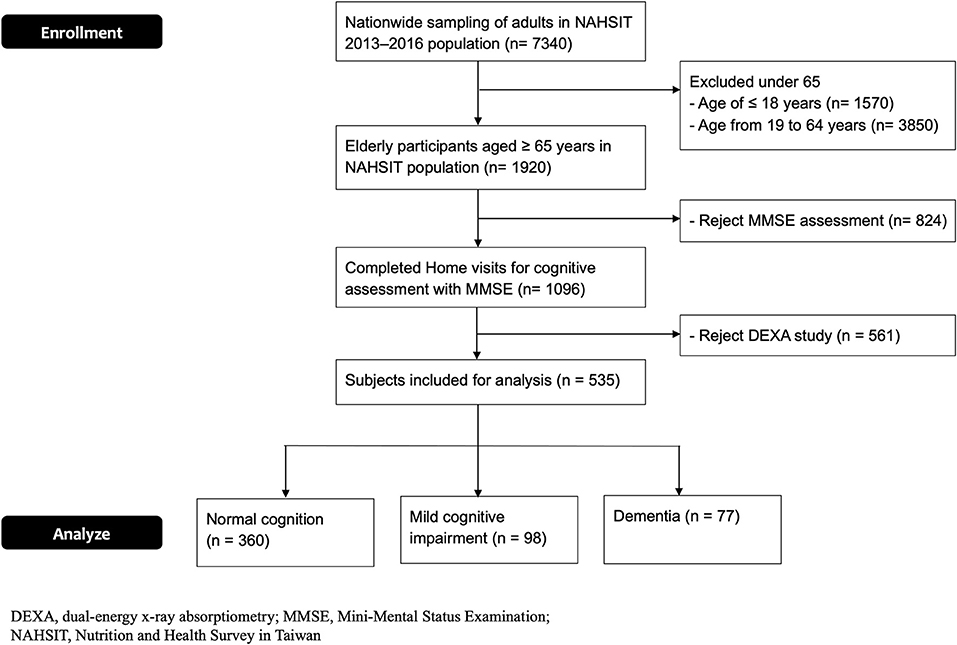
Figure 2. Flowchart of the study.
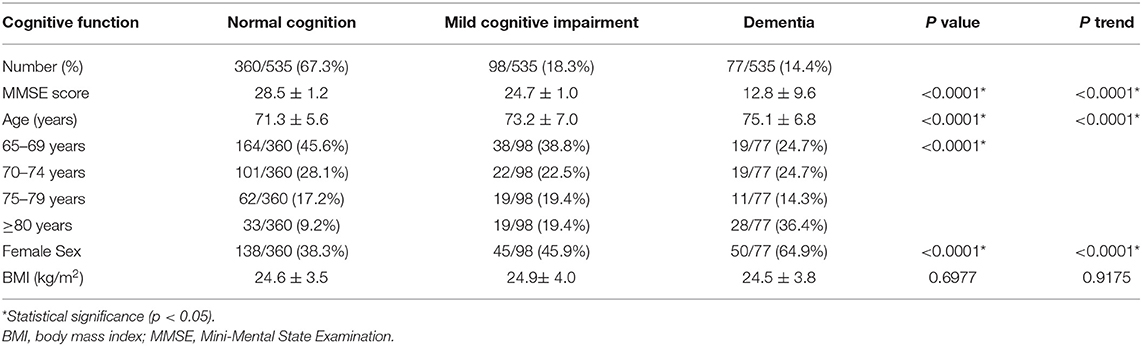
Table 1. Demographic characteristics of the three cognitive groups (N = 535).
Bone Marrow Density and Osteoporosis
The measurements of BMD in the whole body and specific body regions for the three cognitive groups are shown in Table 2. With increasing in the cognitive impairment, the whole-body BMD revealed the decreasing values (1.102 ± 0.136, 1.096 ± 0.136, 1.013 ± 0.139 g/cm2, p < 0.0001, p-trend < 0.0001) among the normal cognition, MCI, dementia groups, respectively. Besides, BMD also showed the trend of decreasing values consistently in the upper extremities (p = 0.0005, p-trend = 0.0016), lower extremities (p < 0.0001, p-trend < 0.0001), spine (p < 0.0001, p trend < 0.0001), trunk area (p < 0.0001, p-trend < 0.0001), and femoral neck (p < 0.0001, p-trend < 0.0001), respectively. On the basis of the WHO definition, osteoporosis was more prevalent in the older adults with more severe cognitive impairment [normal cognition: 15.8%, MCI: 23.5%, and dementia groups: 32.5%, respectively (p = 0.0022, p-trend = 0.0005)]. The prevalence of osteoporosis in the overall participants was 19.6% (105/535).
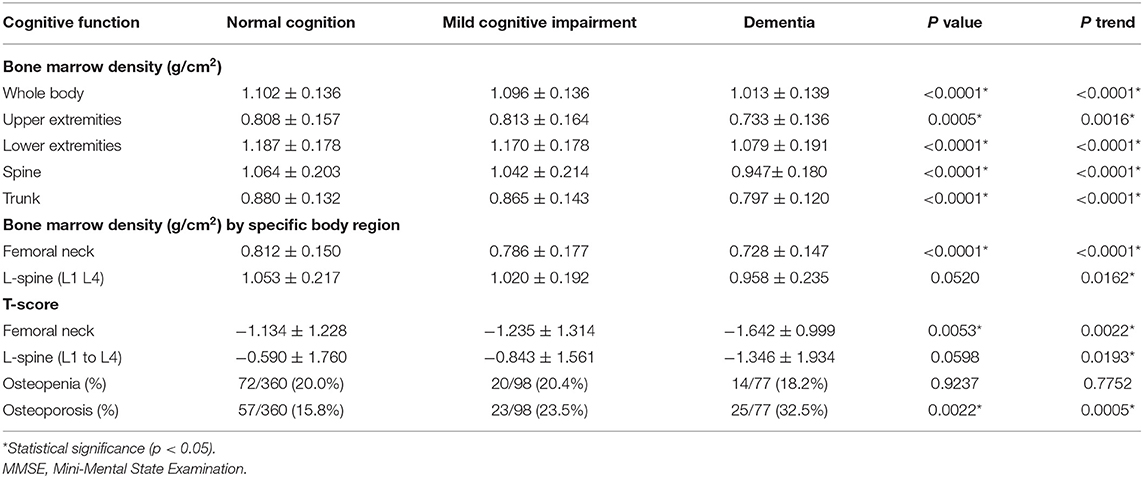
Table 2. Dual-energy X-ray absorptiometry (DXA) measurements for bone marrow density in the three cognitive groups.
Body Composition, Physical Activity, and Laboratory Tests
For body composition parameters (Table 3), the total lean mass was decreasing significantly with increasing in the cognitive impairment (40.79 ± 7.38, 39.14 ± 7.38, 37.21 ± 7.17 kg, p = 0.0006, p-trend < 0.0001). The lean mass in the arms (p = 0.0047, p-trend = 0.0011), trunk (p = 0.0047, p-trend = 0.0011), android (p = 0.0045, p-trend = 0.0012), gynoid (p < 0.0001, p-trend < 0.0001), and legs (p = 0.0045, p-trend = 0.0012) revealed as the same trend as lean mass in whole body. For fat mass, the three cognitive groups showed no significant differences among them. For physical activity (Table 4), the MCI group showed a little higher activity, but no significant differences were found in the three groups. The laboratory tests of the lipid profiles, ferritin, vitamin A, and vitamin D showed no significant differences among the three cognitive groups as well (Table 4).
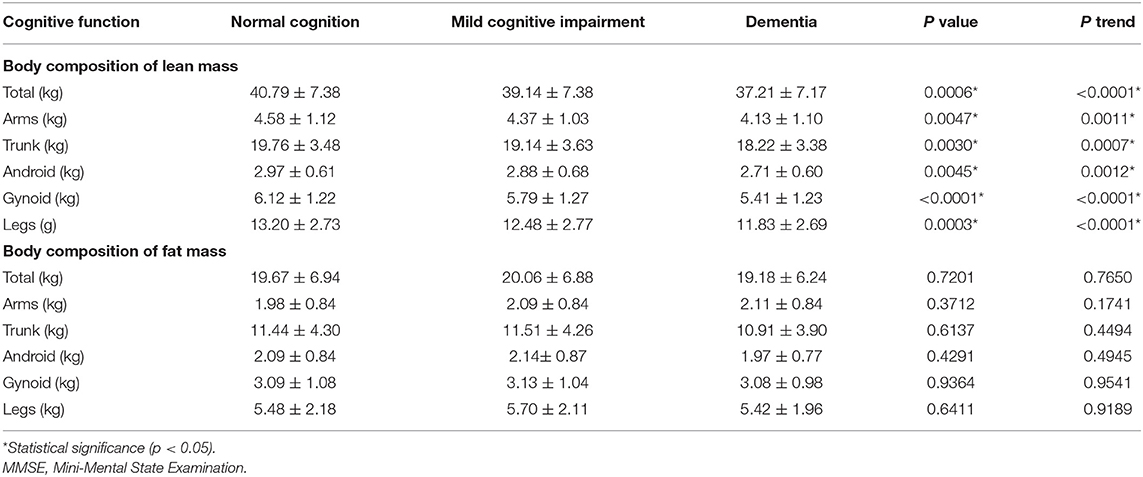
Table 3. Dual-energy X-ray absorptiometry measurements for body composition in the three cognitive groups.
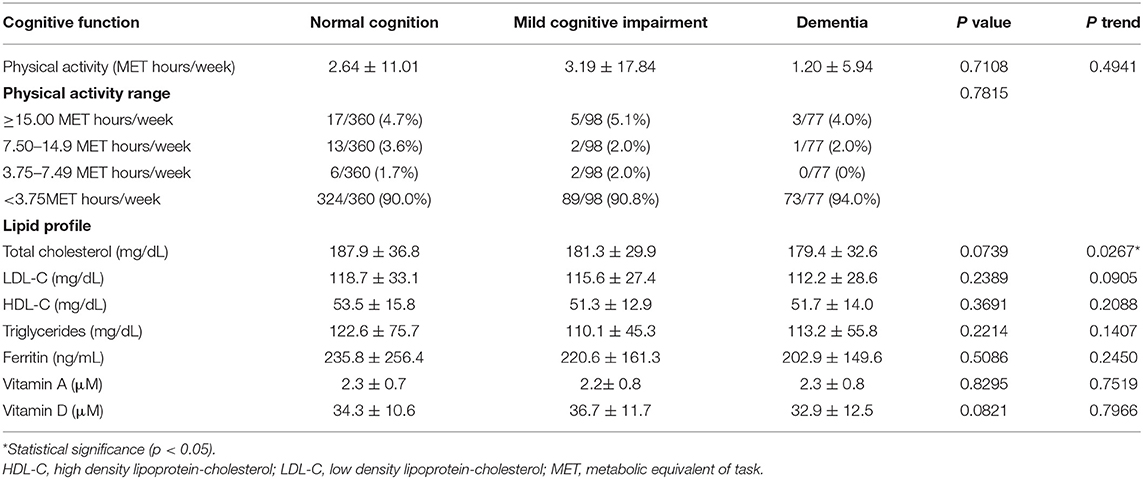
Table 4. Physical activity of the three cognitive groups.
Associations Between Bone Loss and Cognitive Impairment
The regression analysis of the GLMMs is presented in Table 5. In the unadjusted models, decrease of total BMD showed significantly decrease of the MMSE score (β = 8.479 per g/cm2 decrease, SE = 2.072, p < 0.0001). In Model 1, the significant association between total BMD and the MMSE score remained with adjustment of the age and sex (β = 5.792 per g/cm2 decrease, SE = 2.681, p = 0.0312). In Model 2, this significant association was persisted even if adjustment of the age, sex, and physical activity (β = 5.819 per g/cm2 decrease, SE = 2.682, p = 0.0305). In Model 3, no statistically significant association between the bone loss (β = 5.884 per g/cm2 decrease, SE = 3.092, p = 0.0576) and cognitive impairment was found with adjustment of the age, sex, physical activity, vitamin D, and total lean mass. In comparison to Models 1 and 2, Model 3 with the lowest values of the AIC (3014.11) and the SIC (3010.11) was considered the best model, which was furtherly used for the validation with an SEM.
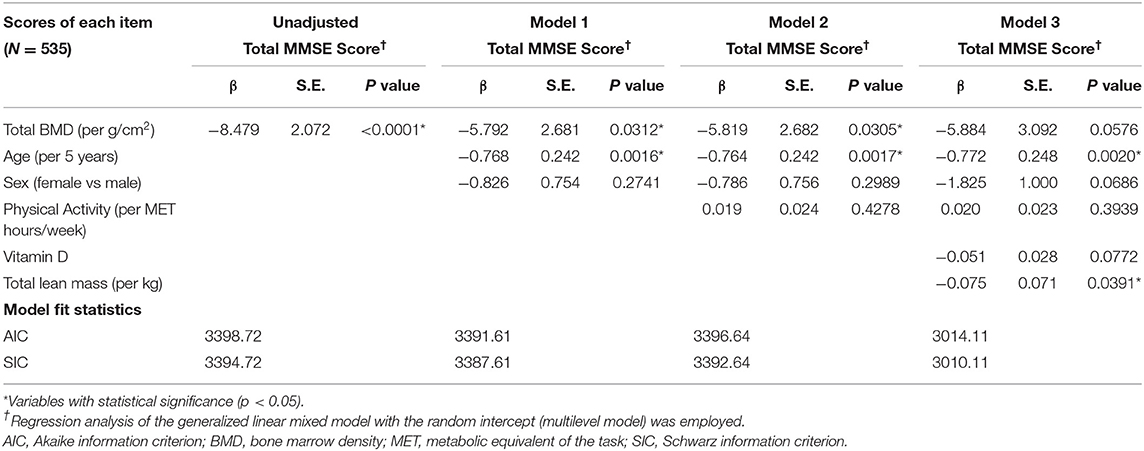
Table 5. Generalized linear mixed model estimates of the Mini-Mental State Examination (MMSE).
There was no sex difference observed in the GLMMs (Supplementary Table S1). In the unadjusted models, decrease of total BMD showed significantly decrease of the MMSE score in the males (β = 6.926 per g/cm2 decrease, SE = 2.986, p = 0.0211) and in the females (β = 9.857 per g/cm2 decrease, SE = 4.778, p = 0.0403), respectively. After adjustment for the age, physical activity, vitamin D, and total lean mass, a decrease of total BMD showed a reduction of the MMSE but without statistically significant. However, the sample size in the subgroup analysis by gender was inadequate (Supplementary Table S2). This study had 535 participants and out of them, 302 were males and 233 were females. The minimum sample size was 421 to attain an α error of 0.05 and apower (1-β) of 0.80 in the GLMMs with five covariates.
Validation With Structural Equation Modeling
In this study, the final SEM for the variables of age, bone mass, lean mass, vitamin D, physical activity, and the MMSE scores were plotted (Figure 3). This model also showed acceptable levels of fit [chi-squared test 22.75 with degrees of freedom of 5 (p =0.0004), CFI: 0.97, adjusted CFI: 0.93, SRMR: 0.06]. The standardized effects for the direct, indirect, and total effects were listed (Supplementary Tables S3–S5). In the direct paths, the predictive model confirmed that the MMSE score was significantly and moderately predicted by age (β = 0.1363, p = 0.0003) and bone mass (β = 0.1251, p = 0.0006) by total BMD. In the indirect paths, the MMSE score was significantly and strongly predicted by lean mass (β = 0.1138, p = 0.0003).
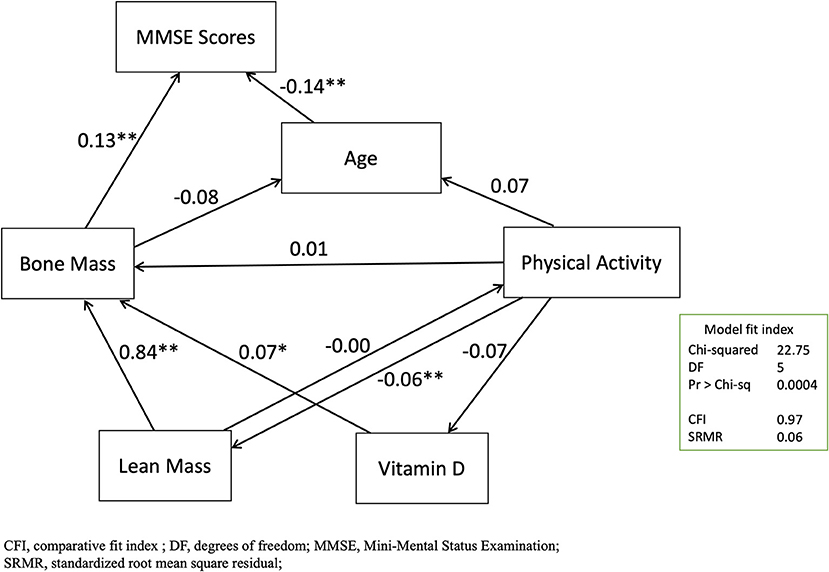
Figure 3. Graphical presentation of the structural equation modeling. *p < 0.05, **p < 0.01.
Discussion
This study examined the association between bone mass and cognitive function for ethnic Asian elder adults in Taiwan. We found that bone loss was independently associated with cognitive impairment in the primary analysis with the GLMMs. The association between bone mass and cognitive function was not simply the confounding effect of age or change of body composition. These findings were reproducible and confirmed by our separate validation study with SEM.
An earlier hospital-based study, using a nationwide health insurance database for the patients in Taiwan who were diagnosed as having osteoporosis and related fractures [the International Classification of Diseases-9-Clinical Modification (ICD-9-CM) codes 733.0 and 733.1], revealed a 1.4-fold relative risk of developing dementia (39). Another similar study conducted in Germany that analyzed patients who had osteoporosis-related fractures (the ICD-10 codes M80 and M81) from 1993 to 2012 revealed that the patients with osteoporosis had a 1.2–1.3-fold higher risk of developing dementia (6). This study extended and confirmed that the association between bone mass and cognitive impairment existed in both the hospital-based and community-based populations. In addition, the participants in this study were noninstitutionalized healthy elder adults. This indicated that bone health should be emphasized before elder adults developed obvious symptoms and signs of cognitive impairment.
Researchers have previously hypothesized that dementia and osteoporosis share mechanisms or are linked in other forms. In the SEM models, we found that the age and bone density individually directly predicted the MMSE score. This should be compatible with the unadjusted Model 1 and Model 2 in the regression analyses with the GLMMs. Therefore, we inferred that age and BMD were independently associated with cognitive impairment. On the other hand, BMD was not significantly associated with the MMSE score in Model 3 with adjustment of the vitamin D and lean mass. Additionally, lean mass was found significantly associated with the MMSE score in Model 3. In the SEM models, we found that the MMSE score was strongly and indirectly predicted by lean mass. These indirect paths from the lean mass to bone density, in the negative sense, should explain the attenuated association between BMD and the MMSE score by the GLMMs in Model 3. Additionally, we determined the SEM with acceptable fit with the three indicators of chi-squared test, CFI, and SRMR. Despite the root mean square error of approximation (RMSEA) was commonly used, we have the three main reasons that prefer SRMR to RMSEA: (1) SRMR is more accurate than RMSEA across small-to-large sample sizes (36, 40), (2) SRMR produces less type I error than RMSEA (36), and (3) RMSEA is more likely to overreject the true population models by using the proposed cutoff criteria (41). Thus, we determined to use the three indicators, including the chi-squared test, CFI, and SRMR, to have an overall judgment of the good model fit.
The representative sampling of the community-based elder participants in this study should also be our strength. Proportions or prevalence of normal cognition, MCI, and dementia were similar to another nationwide population-based cross-sectional survey of cognitive impairment in Taiwan (42, 43). This study also had some limitations. First, owing to the cross-sectional design, we could not directly obtain the causal relationship between bone loss and cognitive impairment. However, with the SEM models, we may infer the most reasonable causal paths between bone loss and cognitive impairment. Second, the NAHSIT study focused on surveying the nutritional status of the elder participants and contained no more advanced genetic biomarkers. Third, this study had inadequate sample sizes in the subgroup analysis by gender. Though the overall analysis exhibited consistent results in both the males and females (Supplementary Table S1), larger sample size was required to confidently conclude no gender difference between the bone loss and cognitive impairment (Supplementary Table S2). Fourth, since this study aimed to survey the health status in the community population, the participants with higher health awareness were with higher willingness to complete all the assessments. A healthy volunteer bias possibly occurred and, therefore, the association between bone loss and cognitive impairment could be underestimated in this study. While the prevalence of osteoporosis in this study was 19.6%, the prevalence of osteoporosis by the National Health Insurance Research Database (NHIRD) of Taiwan, a real-world health database with coverage of > 99.9% residents in Taiwan (44), was from 17.4 to 25.0% (32). Our prevalence of MCI and dementia was similar to the prevalence by the NHIRD of Taiwan (42). Additionally, to ensure the representativeness for the total population in Taiwan, the NAHSIT 2013–2016 adopted the stratified sampling design by the characteristics of population density (with consideration of age and sex distribution) and geographical area. The enrollment protocol of the latest NAHSIT 2013–2016 (45) and the previous NAHSIT 2005–2008 (46) has been previously published. Consequently, we considered that the representative of the enrolled participants was not threatened.
In conclusion, these results support the association between bone loss and cognitive impairment for the older adults that were present and not simply a confounding effect from aging. The decrease of lean mass may indirectly affect cognitive impairment by influencing bone density. Further studies focus on exploring the biological plausibility that should be more convincing.
Data Availability Statement
The datasets presented in this article are not readily available because the NAHSIT 2013–2016 study was managed by the Health Promotion and Administration (HPA), Ministry of Health and Welfare, Taiwan. With legal restrictions imposed by the government of Taiwan on the distribution of the personal health data in relation to the Personal Information Protection Act, request for data needs a formal proposal to the Health and Welfare Data Science Center (HWDC), Ministry of Health and Welfare, Taiwan, and therefore the data was not publicly available. Requests to access the datasets should be directed to Ministry of Health and Welfare, Taiwan, https://www.mohw.gov.tw/np-126-2.html.
Ethics Statement
The studies involving human participants were reviewed and approved by Institutional Review Board on Biomedical Science Research, Academia Sinica, Taiwan; Research Ethics Committee, National Health Research Institutes, Taiwan. The patients/participants provided their written informed consent to participate in this study.
Author Contributions
S-FL, Y-CF, W-HP, and C-HB contributed to the conception and design of the study, acquisition, analysis, and interpretation of the data. S-FL wrote the first draft of the article. All authors contributed to the article and approved the submitted version.
Funding
This study was funded by the Health Promotion Administration (HPA), Ministry of Health and Welfare, Taiwan (reference number: MOHW108-HPAH-114-134703 and MOHW109-HPA-H-114-144702), and by the Ministry of Science and Technology, Taiwan, in the form of a grant awarded to CHB (reference number: MOST 107-2314-B-038-072-MY3 and MOST 110-2314-B038-056-MY3). The content of this research may not represent the opinion of the Health Promotion Administration, Ministry of Health and Welfare, Taiwan.
Conflict of Interest
The authors declare that the research was conducted in the absence of any commercial or financial relationships that could be construed as a potential conflict of interest.
Publisher's Note
All claims expressed in this article are solely those of the authors and do not necessarily represent those of their affiliated organizations, or those of the publisher, the editors and the reviewers. Any product that may be evaluated in this article, or claim that may be made by its manufacturer, is not guaranteed or endorsed by the publisher.
Supplementary Material
The Supplementary Material for this article can be found online at: https://www.frontiersin.org/articles/10.3389/fnut.2021.747877/full#supplementary-material
References
1. Padilla Colón CJ, Molina-Vicenty IL, Frontera-Rodríguez M, García-Ferré A, Rivera BP, Cintrón-Vélez G, et al. Muscle and bone mass loss in the elderly population: advances in diagnosis and treatment. J Biomed (Syd). (2018) 3:40–9. doi: 10.7150/jbm.23390
2. Dionyssiotis Y. Sarcopenia in the elderly. Eur Endocrinol. (2019) 15:13–4. doi: 10.17925/EE.2019.15.1.13
3. Haasum Y, Fastbom J, Fratiglioni L, Johnell K. Undertreatment of osteoporosis in persons with dementia? A population-based study. Osteoporos Int. (2012) 23:1061–8. doi: 10.1007/s00198-011-1636-8
4. Zhou R, Zhou H, Rui L, Xu J. Bone loss and osteoporosis are associated with conversion from mild cognitive impairment to Alzheimer's disease. Curr Alzheimer Res. (2014) 11:706–13. doi: 10.2174/1567205011666140812115818
5. Amouzougan A, Lafaie L, Marotte H, Dènariè D, Collet P, Pallot-Prades B, et al. High prevalence of dementia in women with osteoporosis. Joint Bone Spine. (2017) 84:611–4. doi: 10.1016/j.jbspin.2016.08.002
6. Kostev K, Hadji P, Jacob L. Impact of Osteoporosis on the Risk of Dementia in Almost 60,000 Patients Followed in General Practices in Germany. J Alzheimers Dis. (2018) 65:401–7. doi: 10.3233/JAD-180569
7. Frame G, Bretland KA, Dengler-Crish CM. Mechanistic complexities of bone loss in Alzheimer's disease: a review. Connect Tissue Res. (2020) 61:4–18. doi: 10.1080/03008207.2019.1624734
8. Epstein S, Inzerillo AM, Caminis J, Zaidi M. Disorders associated with acute rapid and severe bone loss. J Bone Miner Res. (2003) 18:2083–94. doi: 10.1359/jbmr.2003.18.12.2083
9. Oppl B, Michitsch G, Misof B, Kudlacek S, Donis J, Klaushofer K, et al. Low bone mineral density and fragility fractures in permanent vegetative state patients. J Bone Miner Res. (2014) 29:1096–100. doi: 10.1002/jbmr.2122
10. Ogawa Y, Kaneko Y, Sato T, Shimizu S, Kanetaka H, Hanyu H. Sarcopenia and Muscle Functions at Various Stages of Alzheimer Disease. Front Neurol. (2018) 9:710. doi: 10.3389/fneur.2018.00710
11. Haberland M, Schilling AF, Rueger JM, Amling M. Brain and bone: central regulation of bone mass. A new paradigm in skeletal biology. J Bone Joint Surg Am. (2001) 83:1871–6. doi: 10.2106/00004623-200112000-00016
12. Karsenty G, Oury F. The central regulation of bone mass, the first link between bone remodeling and energy metabolism. J Clin Endocrinol Metab. (2010) 95:4795–801. doi: 10.1210/jc.2010-1030
13. Kelly RR, Sidles SJ, LaRue AC. Effects of neurological disorders on bone health. Front Psychol. (2020) 11:612366. doi: 10.3389/fpsyg.2020.612366
14. Kenkre JS, Bassett J. The bone remodelling cycle. Ann Clin Biochem. (2018) 55:308–27. doi: 10.1177/0004563218759371
15. Ducy P, Amling M, Takeda S, Priemel M, Schilling AF, Beil FT, et al. Leptin inhibits bone formation through a hypothalamic relay: a central control of bone mass. Cell. (2000) 100:197–207. doi: 10.1016/S0092-8674(00)81558-5
16. Paz-Filho G, Wong ML, Licinio J. The procognitive effects of leptin in the brain and their clinical implications. Int J Clin Pract. (2010) 64:1808–12. doi: 10.1111/j.1742-1241.2010.02536.x
17. McGuire MJ, Ishii M. Leptin dysfunction and Alzheimer's disease: evidence from cellular, animal, and human studies. Cell Mol Neurobiol. (2016) 36:203–17. doi: 10.1007/s10571-015-0282-7
18. Sui SX, Williams LJ, Holloway-Kew KL, Hyde NK, Pasco JA. Skeletal muscle health and cognitive function: a narrative review. Int J Mol Sci. (2020) 22:255. doi: 10.3390/ijms22010255
19. Nourhashémi F, Andrieu S, Gillette-Guyonnet S, Reynish E, Albarède JL, Grandjean H, et al. Is there a relationship between fat-free soft tissue mass and low cognitive function? Results from a study of 7,105 women. J Am Geriatr Soc. (2002) 50:1796–801. doi: 10.1046/j.1532-5415.2002.50507.x
20. Wirth R, Smoliner C, Sieber CC, Volkert D. Cognitive function is associated with body composition and nutritional risk of geriatric patients. J Nutr Health Aging. (2011) 15:706–10. doi: 10.1007/s12603-011-0089-2
21. Kilgour AH, Ferguson KJ, Gray CD, Deary IJ, Wardlaw JM, MacLullich AM, et al. Neck muscle cross-sectional area, brain volume and cognition in healthy older men: a cohort study. BMC Geriatr. (2013) 13:20. doi: 10.1186/1471-2318-13-20
22. Burns JM, Johnson DK, Watts A, Swerdlow RH, Brooks WM. Reduced lean mass in early Alzheimer disease and its association with brain atrophy. Arch Neurol. (2010) 67:428–33. doi: 10.1001/archneurol.2010.38
23. Abellan van Kan G, Rolland Y, Gillette-Guyonnet S, Gardette V, Annweiler C, Beauchet O, et al. Gait speed, body composition, and dementia. The EPIDOS-Toulouse cohort. J Gerontol A Biol Sci Med Sci. (2012) 67:425–32. doi: 10.1093/gerona/glr177
24. Sui SX, Williams LJ, Holloway-Kew KL, Hyde NK, Anderson KB, Tembo MC, et al. Skeletal muscle density and cognitive function: a cross-sectional study in men. Calcif Tissue Int. (2021) 108:165–75. doi: 10.1007/s00223-020-00759-3
25. Kang HG, Park HY Ryu HU, Suk SH. Bone mineral loss and cognitive impairment: the PRESENT project. Medicine (Baltimore). (2018) 97:e12755. doi: 10.1097/MD.0000000000012755
26. Zhou R, Deng J, Zhang M, Zhou HD, Wang YJ. Association between bone mineral density and the risk of Alzheimer's disease. J Alzheimers Dis. (2011) 24:101–8. doi: 10.3233/JAD-2010-101467
27. Loskutova N, Honea RA, Vidoni ED, Brooks WM, Burns JM. Bone density and brain atrophy in early Alzheimer's disease. J Alzheimers Dis. (2009) 18:777–85. doi: 10.3233/JAD-2009-1185
28. Kwok OM, Cheung MWL, Jak S, Ryu E, Wu JY. Editorial: Recent advancements in structural equation modeling (SEM): from both methodological and application perspectives. Front Psychol. (2018) 9:1936. doi: 10.3389/fpsyg.2018.01936
29. Beran TN, Violato C. Structural equation modeling in medical research: a primer. BMC Res Notes. (2010) 3:267. doi: 10.1186/1756-0500-3-267
30. Tennant PWG, Murray EJ, Arnold KF, Berrie L, Fox MP, Gadd SC, et al. Use of directed acyclic graphs (DAGs) to identify confounders in applied health research: review and recommendations. Int J Epidemiol. (2021) 50:620–32. doi: 10.1093/ije/dyaa213
31. Lin YC, Pan WH. Bone mineral density in adults in Taiwan: results of the Nutrition and Health Survey in Taiwan 2005-2008 (NAHSIT 2005–2008). Asia Pac J Clin Nutr. (2011) 20:283–91. doi: 10.6133/apjcn.2011.20.2.18
32. Chen FP, Huang TS, Fu TS, Sun CC, Chao AS, Tsai TL. Secular trends in incidence of osteoporosis in Taiwan: a nationwide population-based study. Biomed J. (2018) 41:314–20. doi: 10.1016/j.bj.2018.08.001
33. Shyu YI, Yip PK. Factor structure and explanatory variables of the Mini-Mental State Examination (MMSE) for elderly persons in Taiwan. J Formos Med Assoc. (2001) 100:676–83.
34. Dziak JJ, Coffman DL, Lanza ST Li R, Jermiin LS. Sensitivity and specificity of information criteria. Brief Bioinform. (2020) 21:553–65. doi: 10.1093/bib/bbz016
35. Shi D, Lee T, Maydeu-Olivares A. Understanding the model size effect on SEM fit indices. Educ Psychol Meas. (2019) 79:310–34. doi: 10.1177/0013164418783530
36. Shi D, Maydeu-Olivares A, Rosseel Y. Assessing fit in ordinal factor analysis models: SRMR vs. RMSEA. Struct Equ Model. (2020) 27:1–15. doi: 10.1080/10705511.2019.1611434
37. Shi D, Maydeu-Olivares A. The effect of estimation methods on SEM fit indices. Educ Psychol Meas. (2020) 80:421–45. doi: 10.1177/0013164419885164
38. Gunzler D, Chen T, Wu P, Zhang H. Introduction to mediation analysis with structural equation modeling. Shanghai Arch Psychiatry. (2013) 25:390–4. doi: 10.3969/j.issn.1002-0829.2013.06.009
39. Chang KH, Chung CJ, Lin CL, Sung FC, Wu TN, Kao CH. Increased risk of dementia in patients with osteoporosis: a population-based retrospective cohort analysis. Age (Dordr). (2014) 36:967–75. doi: 10.1007/s11357-013-9608-x
40. Pavlov G, Maydeu-Olivares A, Shi D. Using the standardized root mean squared residual (SRMR) to assess exact fit in structural equation models. Educ Psychol Meas. (2021) 81:110–30. doi: 10.1177/0013164420926231
41. Hu Lt, Bentler PM. Cutoff criteria for fit indexes in covariance structure analysis: conventional criteria versus new alternatives. Struct. Equ. Model. (1999) 6:1–55. doi: 10.1080/10705519909540118
42. Sun Y, Lee HJ, Yang SC, Chen TF, Lin KN, Lin CC, et al. A nationwide survey of mild cognitive impairment and dementia, including very mild dementia, in Taiwan. PLoS ONE. (2014) 9:e100303. doi: 10.1371/journal.pone.0100303
43. Fuh JL, Wang SJ. Dementia in Taiwan: past, present, and future. Acta Neurol Taiwan. (2008) 17:153–61. doi: 10.29819/ANT.200809.0001
44. Hsieh CY, Su CC, Shao SC, Sung SF, Lin SJ, Kao Yang YH, et al. Taiwan's National Health Insurance Research Database: past and future. Clin Epidemiol. (2019) 11:349–58. doi: 10.2147/CLEP.S196293
45. Lin SF, Fan YC, Chou CC, Pan WH, Bai CH. Body composition patterns among normal glycemic, pre-diabetic, diabetic health Chinese adults in community: NAHSIT 2013-2016. PLoS ONE. (2020) 15:e0241121. doi: 10.1371/journal.pone.0241121
Keywords: bone loss, bone marrow density, cognitive impairment, dementia, osteoporosis
Citation: Lin S-F, Fan Y-C, Pan W-H and Bai C-H (2021) Bone and Lean Mass Loss and Cognitive Impairment for Healthy Elder Adults: Analysis of the Nutrition and Health Survey in Taiwan 2013–2016 and a Validation Study With Structural Equation Modeling. Front. Nutr. 8:747877. doi: 10.3389/fnut.2021.747877
Received: 27 July 2021; Accepted: 13 September 2021;
Published: 13 October 2021.
Edited by:
Lucie Geurts, International Life Sciences Institute Europe, BelgiumReviewed by:
Guoyuan Qi, University of Arizona, United StatesBruno Pietro Imbimbo, Chiesi Farmaceutici, Italy
Copyright © 2021 Lin, Fan, Pan and Bai. This is an open-access article distributed under the terms of the Creative Commons Attribution License (CC BY). The use, distribution or reproduction in other forums is permitted, provided the original author(s) and the copyright owner(s) are credited and that the original publication in this journal is cited, in accordance with accepted academic practice. No use, distribution or reproduction is permitted which does not comply with these terms.
*Correspondence: Chyi-Huey Bai, baich@tmu.edu.tw