 Guillaume Bonnier1*
 Benedicte Maréchal2,3Mário João Fartaria2,3Pavel Falkowskiy2,3
 José P. Marques4Samanta Simioni5Myriam Schluep6Renaud Du Pasquier6
 Jean-Philippe Thiran3Gunnar Krueger7
 Cristina Granziera1,6
- 1A.A. Martinos Center for Biomedical Imaging, Massachusetts General Hospital, Harvard Medical School, Charlestown, MA, United States
- 2Advanced Clinical Imaging Technology (HC CMEA SUI DI BM PI), Siemens Healthcare, Lausanne, Switzerland
- 3Signal Processing Laboratory 5 LTS5, École Polytechnique Fédérale de Lausanne, Lausanne, Switzerland
- 4Donders Centre for Cognitive Neuroimaging, Radbound University, Nijmegen, Netherlands
- 5Neuropsychology, Institution de Lavigny, Denens, Switzerland
- 6Neurology Service and Neuroimmunology Laboratory, Department of Clinical Neurosciences, Centre Hospitalier Universitaire Vaudois, University of Lausanne, Lausanne, Switzerland
- 7Siemens Medical Solutions USA IM MR COL NEZ, Burlington, MA, United States
Objective: Quantitative and semi-quantitative MRI (qMRI) metrics provide complementary specificity and differential sensitivity to pathological brain changes compatible with brain inflammation, degeneration, and repair. Moreover, advanced magnetic resonance imaging (MRI) metrics with overlapping elements amplify the true tissue-related information and limit measurement noise. In this work, we combined multiple advanced MRI parameters to assess focal and diffuse brain changes over 2 years in a group of early-stage relapsing-remitting MS patients.
Methods: Thirty relapsing-remitting MS patients with less than 5 years disease duration and nine healthy subjects underwent 3T MRI at baseline and after 2 years including T1, T2, T2* relaxometry, and magnetization transfer imaging. To assess longitudinal changes in normal-appearing (NA) tissue and lesions, we used analyses of variance and Bonferroni correction for multiple comparisons. Multivariate linear regression was used to assess the correlation between clinical outcome and multiparametric MRI changes in lesions and NA tissue.
Results: In patients, we measured a significant longitudinal decrease of mean T2 relaxation times in NA white matter (p = 0.005) and a decrease of T1 relaxation times in the pallidum (p < 0.05), which are compatible with edema reabsorption and/or iron deposition. No longitudinal changes in qMRI metrics were observed in controls. In MS lesions, we measured a decrease in T1 relaxation time (p-value < 2.2e−16) and a significant increase in MTR (p-value < 1e−6), suggesting repair mechanisms, such as remyelination, increased axonal density, and/or a gliosis. Last, the evolution of advanced MRI metrics—and not changes in lesions or brain volume—were correlated to motor and cognitive tests scores evolution (Adj-R2 > 0.4, p < 0.05). In summary, the combination of multiple advanced MRI provided evidence of changes compatible with focal and diffuse brain repair at early MS stages as suggested by histopathological studies.
Introduction
Relapsing-remitting multiple sclerosis (RRMS) is a chronic progressive disease that evolves through clinical relapses and subclinical inflammation and degeneration (1). To date, there is no cure for RRMS but a number of treatments substantially reduce the frequency of clinical relapses and the extent of local inflammation and brain volume loss (2). Conventional magnetic resonance imaging (cMRI), such as T1- and T2-weighted magnetic resonance imaging (MRI), provides essential metrics to measure local pathology (lesion number and volume), inflammatory activity, and severe tissue loss in the central nervous system (3). Yet, cMRI measures exhibit low sensitivity to diffuse brain alterations, do not provide metrics to differentiate inflammatory demyelination from brain remodeling and repair (4), and only partially correlate with patients function and disability (5). To overcome the limitations of cMRI, a number of non-conventional MRI techniques have been studied in MS patients, including Magnetization Transfer Imaging (MTI), Diffusion Tensor Imaging Susceptibility MRI, and MR relaxometry (5).
Among non-conventional MRI techniques, quantitative MRI (qMRI) probes the brain microstructure through standardized physical parameters that are directly linked to the biological and/or pathological properties of the tissue where they are measured (6). Besides, the combination of multiple qMRI metrics allow to amplify the true tissue-related information and limit their inherent measurement noise, thanks to the overlapping information that qMRI provide (7, 8). In fact, qMRI contrasts are influenced by the same tissue properties (i.e., micro/macromolecules, i.e., within axons, myelin, cells, intracellular/extracellular water, iron), though they exhibit different sensitivity to each of them (6, 9, 10). T1 relaxometry is highly sensitive to the tissue structural organization and free-water protons (11, 12): T1 rt increases when there is a loss of tissue structural organization/density (13, 14), and/or when free-water content increases. T1 rt also moderately decreases with an increase of iron content in the brain tissue (15). T2 rt is highly sensitive to free-water content, although it is also affected by the presence of macromolecules and iron. Both an accumulation of free water and a loss of macromolecules will increase T2 rt, while iron will decrease it (16). As well, the T2* transverse rt exhibit high sensitivity to free-water content and it is particularly sensitive to the presence of iron (17). An increase of T2* suggests a loss of macromolecules, while a decrease indicates an increase of iron or macromolecular compounds. Finally, the metrics obtained with MTI are very sensitive to variation of large molecular aggregates like lipids and proteins in myelin or cellular membranes (18, 19) so that they decrease when the amount of macromolecules decreases (i.e., in demyelination and/or cell loss) and/or the free water increases (i.e., edema) (20). Specific patterns of changes in T1, T2, T2* relaxation times, and magnetization transfer measures may be optimal to quantify brain abnormalities and their evolution in MS patients. For example, an increase in T1 and T2 relaxation times may suggest either a water accumulation (edema) or a loss of myelin/axon. A concomitant strong decrease in MTR will point at the latter phenomenon (myelin/axon loss), whereas a mild MTR decrease or no MTR changes are more typical of an increase in extracellular water (6). Combining multiple qMRI techniques in a clinically compatible protocol is challenging (e.g., due to motion, scan time, reproducibility, etc.) but there are currently ongoing efforts toward fast and reproducible protocols applying combined and accelerated acquisitions (21–23), synthetic computation of qMRI metrics (22) and qMRI fingerprinting (24).
To date, a number of cross-sectional studies [for review, see Ref. (5, 25)]—including some from our group (26–28)—leveraged the information obtained by multiple qMRI contrasts to describe brain inflammation and degeneration in MS patients. However, only few applied this approach to study longitudinal brain changes in patients with MS (29, 30) and reported the concomitant changes of multiple qMRI metrics [myelin water fraction, MTR, T1, and T2 relaxometry (29) and MTR and fractional anisotropy/diffusivities (30)] in black-holes and brain connectivity.
In this work, we have developed an automated MRI framework combining T1, T2, and T2* relaxometry with MTI (hereafter referred as qMRI) in order to (i) assess the potential of a combination of multiple qMRI parameters to quantify and interpret the evolution over 2 years of focal and diffuse pathology in a cohort of early RRMS patients and (ii) predict patients clinical outcome.
Materials and Methods
Population and Clinical Assessment
We enrolled 36 RRMS patients and 18 HC who had a baseline MRI study and 30 RRMS patients and 9 HC came back for a MRI follow-up study at 2 years ± 1 week after baseline. Data from seven patients were discarded because of (i) artifacts such as motion or ringing, which were identified by visual inspection in one or more datasets or (ii) because of missing data. Cognitive assessment was performed in patients at both time-points and in HC at baseline.
Inclusion criteria for patients were definite MS diagnosis according to the revised diagnostic criteria (31), less than 5 years disease duration at enrollment, age comprised between 20 and 70 years old and no other neurological or psychiatric diseases. For healthy controls, inclusion criteria were the absence of neurological, psychiatric, or systemic disease and age between 20 and 70 years old. Table 1 reports the population demographics and clinical characteristics. Eighty-seven percent of the patients were under immunomodulatory treatment (high-dosage IFN beta or fingolimod) for at least 3 months at the first time-point (TP1) and 97% at 2-year follow-up (TP2). Treated patients remained on the same treatment for the entire duration of the study. No patient had received corticosteroid therapy within the 3 months preceding the enrollment and follow-up MRI.
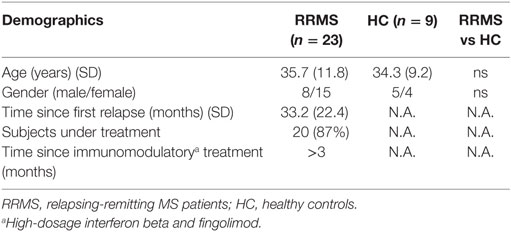
Table 1. Population demographics.
The study was approved by the Ethic committee of the Lausanne University Hospital (CHUV). All participants gave written informed consent prior to enrollment.
Clinical Assessment
At both time-points, each subject underwent neurocognitive, behavioral, motor, and disability examination by a certified neurologist (Cristina Granziera), as specified in Table 2. To reduce training effects, we administered one different version per time-point out of the two parallel batteries available for the Brief Repeatable Battery of Neuropsychological Tests (BRB-N) (32).
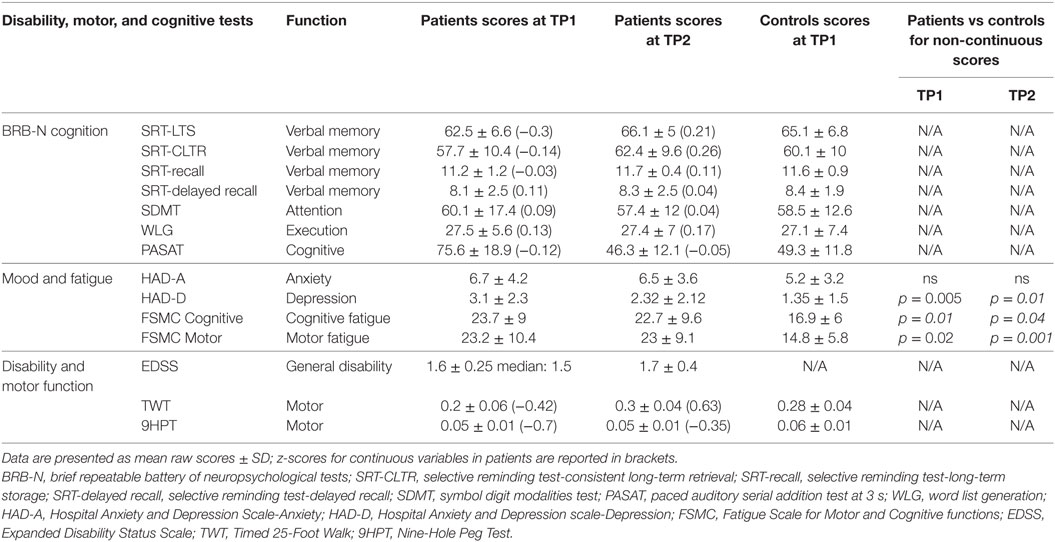
Table 2. Clinical scores.
Magnetic Resonance Imaging
At both time-points, all subjects underwent a MRI protocol, including relaxometry, magnetization transfer, and structural MRI, as previously performed (26–28) and reported in detail in Table 3. T2* maps were obtained using an in-house correction method based on an estimated B1 field map, and MTR maps were computed using the following formula: MTR = (M0 − MT)/M0 where M0 and MT are the images acquired without and with MT pulse, respectively. Total scan time for T1, T2, T2* relaxometry, and MTR was ~23 min. Figure 1 shows an example of T1, T2, T2*, and MTR maps of a control and a patient at time-point 1 and 2.
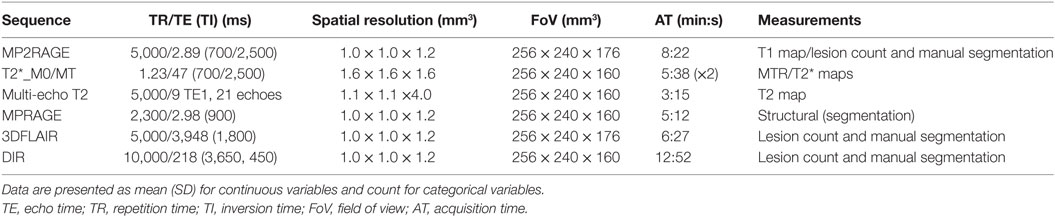
Table 3. Magnetic resonance imaging protocol.
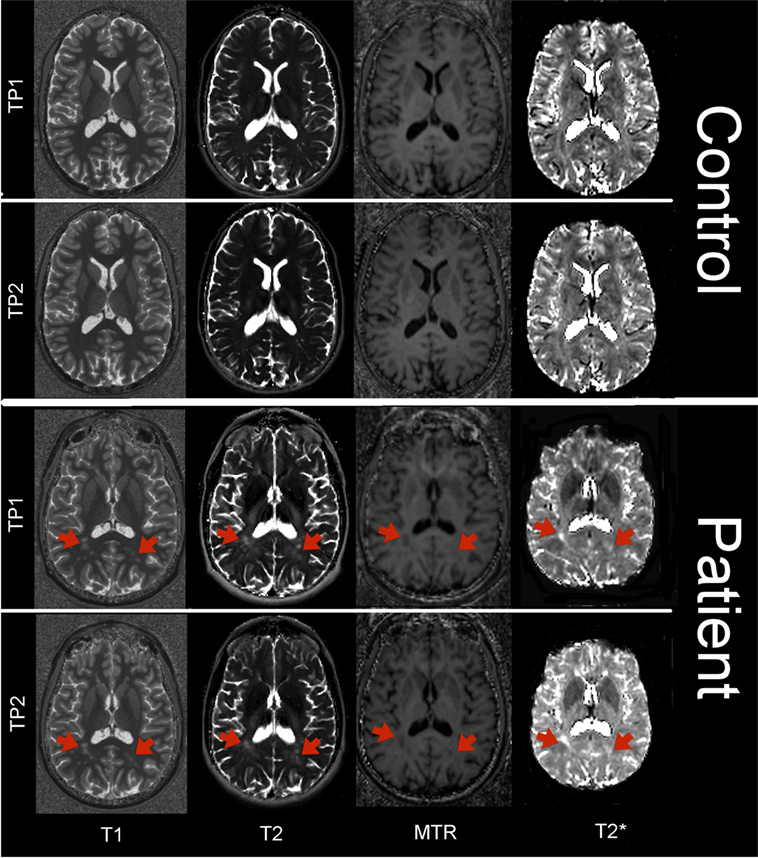
Figure 1. Axial view of T1 map, T2 map, T2* map, and MTR in a control and in a patient at time-point 1 and 2. Red arrows point at the location of MS lesions.
MRI Post-Processing and Lesions Segmentation
For each subject, all images were registered in the MP2RAGE space using Elastix c++ library (33). Morphobox (34) was used to segment tissues and regions of interest (ROIs) on MPRAGE images for both time-points. The following ROIs were automatically segmented at both time-points: white matter, cortical gray matter, thalamus, and basal ganglia (caudate, putamen, and globus pallidus). Lesions were manually segmented by consensus on 3D FLAIR, DIR, and MP2RAGE images at both time-points by a radiologist (5 years of experience) and a neurologist (10 years of experience), as previously performed (26, 27). MS lesions were also manually classified as WM, GM, and mixed WM/GM lesions. Normal-appearing (NA) tissue was obtained in each ROI by subtracting the lesions mask. Lobar segmentation was obtained using Morphobox (34). Two-timepoint percentage brain volume change (PBVC) was estimated using Structural Image Evaluation, using Normalisation of Atrophy (35), which is part of FSL https://fsl.fmrib.ox.ac.uk/fsl/fslwiki. All volumetric measurements were normalized by the total intracranial volume.
Lesions z-Scores and Lesions Classification
In the all cohort of 18 healthy controls, we calculated the mean T1, T2, and T2* rt and MTR in the gray and white matter components of the segmented ROIs. Then, we calculated a z-score for each lesion for all parametric maps at both time-points to quantify the deviation of each specific MR metric (e.g., T1) in MS lesions from the distribution of the same signal in the corresponding healthy tissue in controls:
where ZT1 corresponds to the lesion z-score, v to the lesion voxels, N to a normalization term, IT1 to the T1 quantitative map, μT1 to the mean, and σT1 the SD of the T1 relaxation in the lobe Ll and tissue Tl (i.e., WM or GM) in the controls group, corresponding to the lesion location and type. We considered the distribution in the healthy tissue corresponding to the lobe where lesions are located because previous studies reported lobar variations of qMRI parameters (36, 37).
WM, GM, and mixed WM/GM lesions were classified in four classes according to the evolution of their volume across time-points as previously reported (38): (i) stable, (ii) enlarged (increase of at least 50% of lesion volume between time-points), (iii) shrunken (decrease of at least 50% of lesion volume between time-points), and (iv) resolved.
Statistical Analysis
Cross-sectional Analysis between Patients and Controls at Baseline
Clinical Scores
All patients’ neurocognitive scores were standardized using z-scores computed from mean and SD of 18 HC clinical scores. Behavioral scores and disability scores were compared between patients and controls at baseline and follow-up using a student t-test.
qMRI in Lesions and NA Tissue
An analysis of variance (ANOVA) with age as covariate was performed to compared differences between mean T1, T2, T2*, and MTR in lesions in MS patients to healthy tissue in controls at baseline. ANOVA with age as covariate was also used to assess the presence of differences at baseline between mean T1, T2, T2*, and MTR in NAWM, NAGM, and basal ganglia tissue in patients vs controls.
Longitudinal Analysis in Patients and Controls
qMRI Evolution in NA Tissue
First, we performed a global omnibus test (F-test) to assess the interaction between group (patients and controls) and timepoint.
Then, we performed paired repeated measures ANOVA with age and gender as covariate in the patients and control group in order to assess the following H0 hypotheses:
H0-1: there are no differences in the mean T1, T2, T2*, MTR in NAGM and NAWM between TP1 and TP2.
H0-2: there are no differences in the mean T1, T2, T2*, MTR in the thalamus, and basal ganglia (caudate, putamen, and pallidus) between TP1 and TP2.
Correction for multiple comparisons was performed using Bonferroni (H0-1:2 regions, 4 contrasts = 8 tests; H0-2:4 regions, 4 contrasts = 16 tests).
Brain Volume Evolution
To assess differences in PBVC between time-points in patients and controls, we used an ANOVA with age and gender as covariate.
qMRI z-Scores and Volume Evolution in Lesions
We analyzed the changes in lesions z-scores and lesion volumes by performing a paired t-test between TP1 and at TP2. To assess changes in lesions z-scores, we calculated T1, T2, T2*, and MTR z-scores in the TP1 lesion mask and the same region in TP2 images. Paired t-tests were applied separately to WM, GM, and mixed lesions to evaluate whether qMRI parameters evolved differently across different lesion types. Correction for multiple comparisons was performed using Bonferroni (3 lesion types, 4 contrasts = 12 tests).
Analysis of Tp1 qMRI Metrics in Lesions with Different Volumetric Evolution at Follow-up
We performed ANOVA to compare the mean T1, T2, T2*, and MTR z-scores at TP1 across lesions with different volumetric evolution (i.e., stable, enlarged, shrunken, resolved). ANOVA were applied separately to WM, GM, and mixed lesions. We also combined the ANOVA with Tukey tests to find which lesion class was significantly different from the others. Correction for multiple comparisons was performed using Bonferroni (3 lesion types, 4 contrasts = 12 tests).
Longitudinal Analysis of Clinical Scores in Patients
We evaluated the evolution of clinical scores by performing paired t-test between patients clinical scores (z-cores for continues variables and raw scores for the others) at TP1 and at TP2.
Regression Analysis between qMRI and Clinical Scores Evolution
A multivariate linear regression of clinical scores evolution was performed using a general linear model with qMRI measurements that significantly evolved over time as regressors and clinical z-scores/test scores that significantly changed between time-points as predicted variables. Based on the results of the longitudinal analysis of NA tissue and lesions, we selected the following regressors: (i) T2 mean variation between time-points in NAWM; (ii) mean T1, T2, T2*, and MTR lesions z-score variation between time-points; and (iii) mean lesions volume variations between time-points. Though the lesions volume did not show significant changes between time-points, we added it to compare its contribution to the regression with qMRI measurements. Age and gender were used as covariates. Clinical z-scores were adapted using Box–Cox transformation to satisfy model assumption for normality.
We used a backward stepwise approach to select the best prediction model for each dependent variable (clinical z-scores/tests evolution). Bonferroni correction was applied for multiple comparisons (3 clinical z-scores evolution tested). “Leave-one-out” cross validation (LOOV) was used to assess the prediction quality and robustness of each model.
All regression analyses were performed using R software (http://www.R-project.org).
Results
Cross-sectional Analysis between Patients and Controls at Baseline
At baseline, we measured a highly significant difference between lesions and healthy tissue for all qMRI metrics (p < 1e−10). Also, at baseline, no significant differences were observed between mean qMRI metrics in NAWM, NAGM, and basal ganglia in patients vs controls.
Differences in cognitive scores at baseline (TP1) and follow-up (TP2) were reported as z-scores in Table 2. As to behavioral scores, at baseline MS patients exhibited a higher depression (p = 0.005) and cognitive (p = 0.01) and motor (p = 0.02) fatigue compared to healthy subjects. At follow-up, MS patients had still higher depression (p = 0.01) and cognitive (p = 0.04) and motor (p = 0.001) fatigue compared to healthy subjects.
Longitudinal Analysis in Patients and Controls
qMRI Evolution in NA Tissue
The F-test did not show any significant interaction between group (patients/controls) and time-points (time-point 1 and 2). The F-test also revealed a significant higher T1 in patients compared to controls at both time-point (p = 0.02), Figure 2.
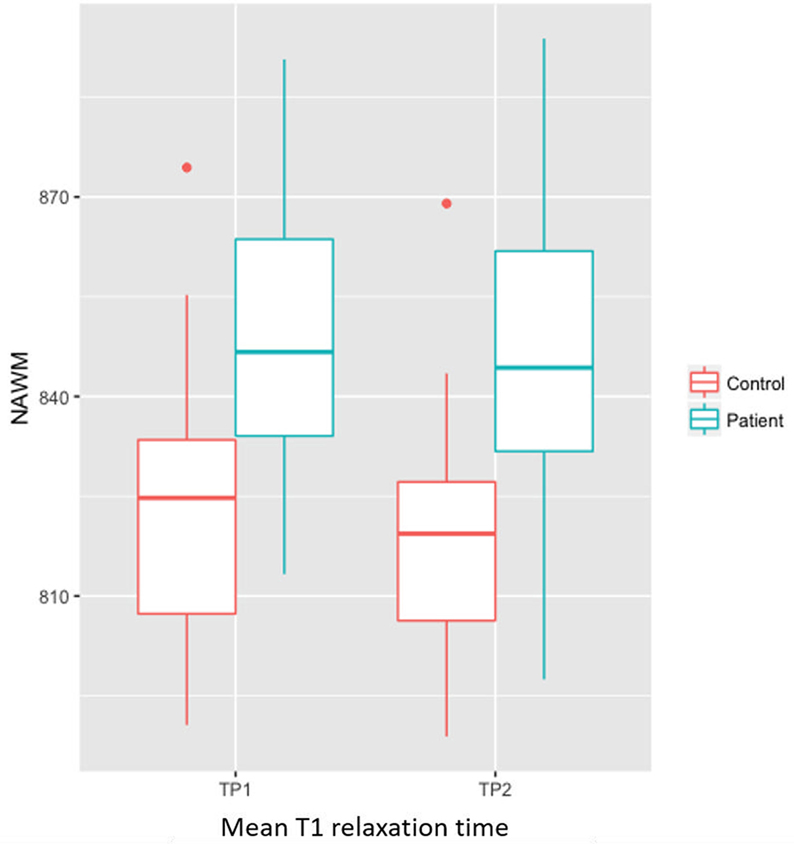
Figure 2. Bar plot showing significant higher T1 in NAWM of patients compared to controls at both time-point (p = 0.02).
In patients, we measured a significant longitudinal decrease in T2 relaxation times in NAWM (p = 0.002, T2TP1 = 83.4 ± 5.6 ms, T2TP2 = 82.6 ± 5.3 ms), thalamus (p = 0.01, T2TP1 = 89.2 ± 4.4 ms, T2TP2 = 87.1 ± 4.8 ms), pallidum (p = 0.01, T2TP1 = 64.7 ± 6 ms, T2TP2 = 63.6 ± 5 ms) and putamen (p = 0.0004, T2TP1 = 75.4 ± 2.7 ms, T2TP2 = 74.2 ± 2.5 ms), and a decrease in T1 relaxation times in the pallidum (p = 0.04, T1TP1 = 945 ± 883 ms, T1TP2 = 935 ± 1020 ms), Table 4 and Figure 3. No longitudinal differences were observed in the control group (NAWM: T2TP1 = 82.4 ms, T2TP2 = 82.0 ms; pallidum: T2TP1 = 64.6 ms, T2TP2 = 63.7 ms; T1TP1 = 931 ms, T1TP2 = 913 ms).
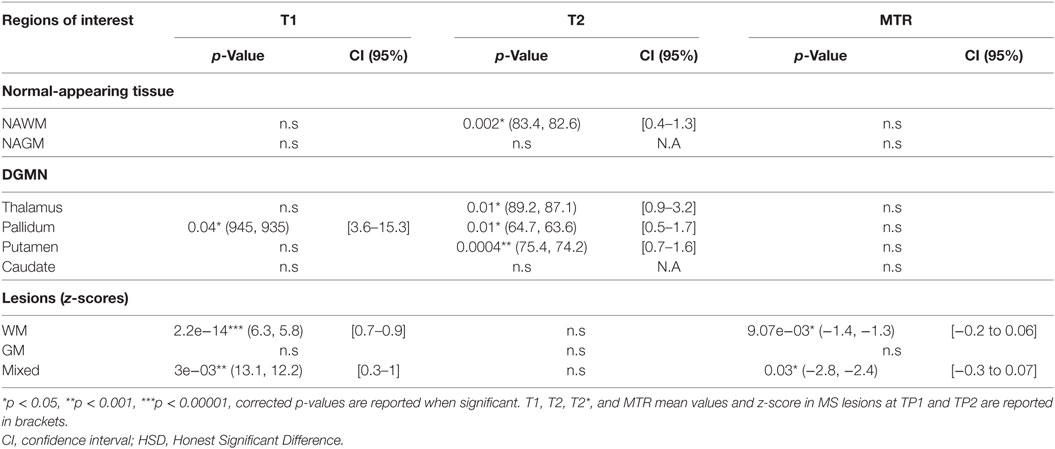
Table 4. Longitudinal analysis results of patients.
Figure 3. Mean T2 relaxation times in NAWM and pallidum of MS patients, at both time-points (left). Mean T1 relaxation times in pallidum of MS patients (right).
Brain Volume Evolution
No significant changes in PBVC were observed between patients and controls over 2 years (p = 0.4).
qMRI z-Scores and Volume Evolution in Lesions
MS lesions showed a global decrease in MTR and increase in T1 (p = 8e−6 and p < 1e−15).
Seventy-five percent (75%) of the lesions were WM lesions (548 lesions), 22% were mixed WM/GM lesions (160 lesions), and 3% were GM lesions (25 lesions).
In both WM and mixed WM/GM lesions, we found significant changes in T1 and MTR z-scores between time-points. WM lesions showed a significant decrease in T1 z-scores (p-value < 1e−10, zTP1 = 6.3 ± 1.5, zTP2 = 5.8 ± 1.6), as well as a significant increase in MTR z-score (p-value = 9.07e−3, zTP1 = −1.4 ± 0.5, zTP2 = −1.3 ± 0.5). Similarly, mixed lesions showed a significant decrease in T1 z-score (p-value = 3e−3, zTP1 = 13.1 ± 5.8, zTP2 = 12.2 ± 6.4) and an increase of MTR z-score (p-value = 0.03, zTP1 = −2.8 ± 1.4, zTP2 = −2.4 ± 1.6), Table 4 and Figure 4.
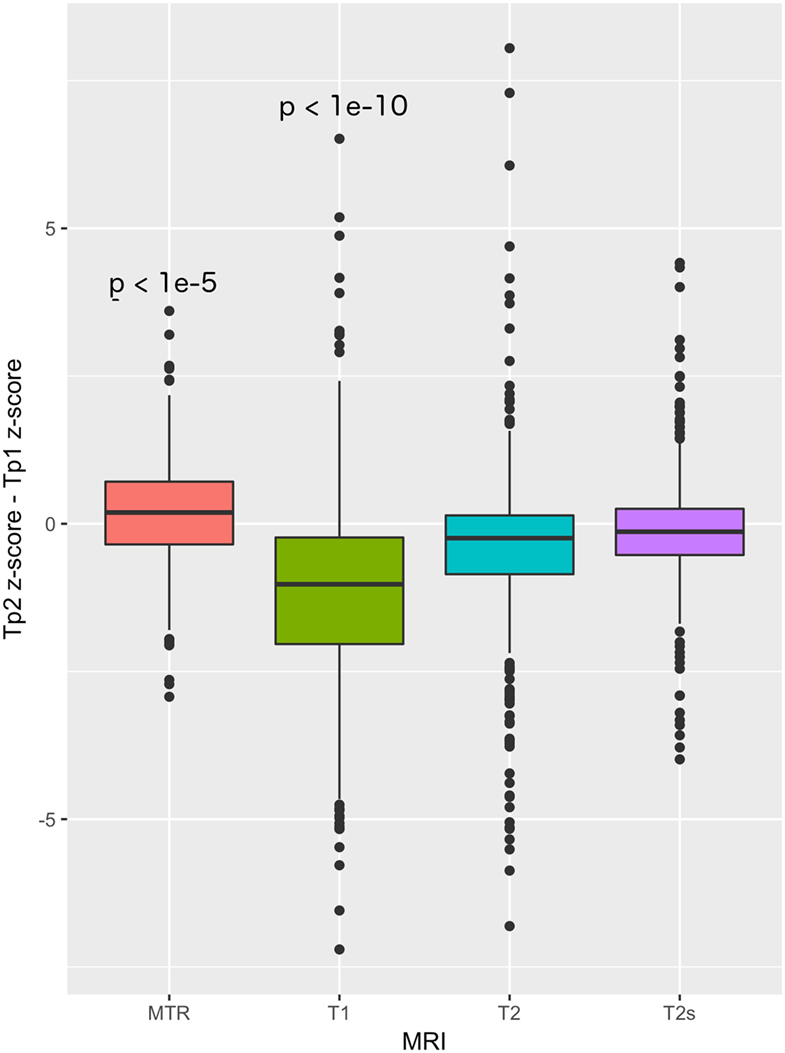
Figure 4. T1, T2, T2*, and MTR z-scores differences between baseline and follow-up in MS lesions.
Analysis of qMRI at Tp1 in Lesions with Different Volumetric Evolution
Over 2 years follow-up, 75% of lesions remained stable (548 lesions), 13% were enlarged (99 lesions), 1% was shrunken (8 lesions), and 11% were resolved (78 lesions).
At TP1, we measured a significant difference in T1 (p = 0.024), T2 (p = 0.004), T2* (p = 0.0012), and MTR (p = 0.01) z-scores between stable, shrunken, resolved, and enlarged WM lesions.
At TP1, WM resolved lesions showed a significantly lower T1 (p = 0.005) and T2* (p = 0.002) z-scores and a higher MTR z-score (p = 0.007) compared to WM stable lesions. WM shrunken lesions exhibited a significantly higher T2 z-scores compared to WM stable (p = 0.0003), enlarged (p = 0.0004) and resolved lesions (p = 0.0001), Table 5 and Figure 5.
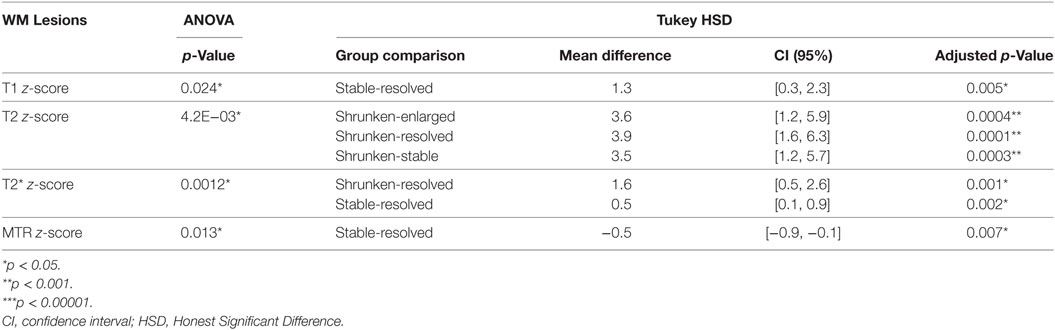
Table 5. Analysis of variance (ANOVA) and Tukey HSD test on Tp1 QMRI z-scores across lesions groups.
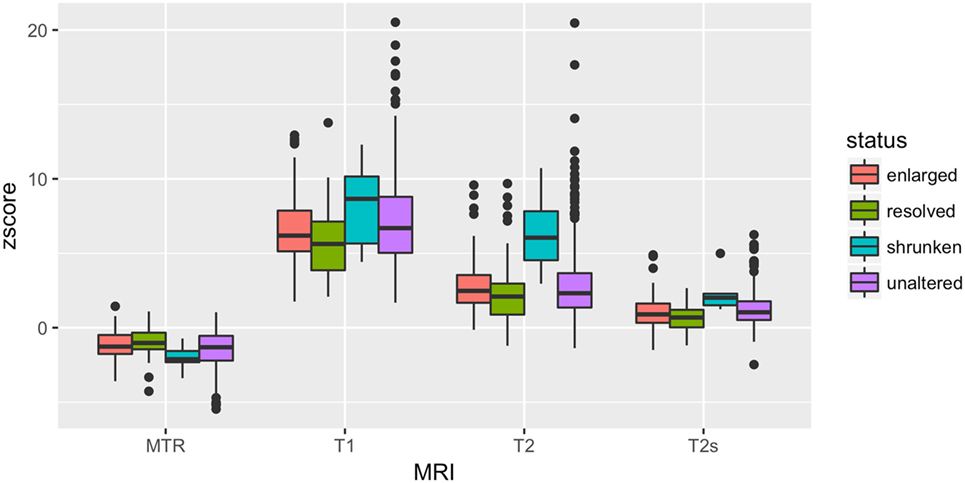
Figure 5. At baseline, T1, T2, T2* and MTR z-scores differences among stable, enlarged shrunken and resolved WM lesions.
No differences were found for GM and mixed lesions.
Longitudinal Analysis of Clinical Scores in Patients
At time-point 2 compared to time-point 1, we measured a significant decrease in (i) MSFC Timed 25-foot Walk-TWT (p = 5.838e−05), as well as a significant increase in (i) selective reminding test—long-term storage (SRT-CLTR, p = 0.04), and an increase in (ii) t selective reminding test—consistent long-term retrieval (SRT-LTS, p = 0.02) z-scores.
Regression Analysis between qMRI and Clinical Scores Evolution
General linear model using stepwise regression revealed strong associations between qMRI features and clinical scores variations between time-points, confirmed by a leave-one-out cross validation (i) baseline T2, T2*, and MTR z-scores variations in lesions and T2 variation in NAWM were significantly correlated with changes in deambulation (MSFC-TWT score, adjusted R2: 0.49, p = 0.013; LOO Spearman correlation score: 0.5), Figure 6A; and (ii) baseline T1, T2, and T2* z-scores variations in lesions were significantly correlated with changes in selective reminding test—long-term storage (BRB-N-CLTR z-score, adjusted R2: 0.48, p = 0.007; LOO Spearman correlation score: 0.52), Figure 6B.
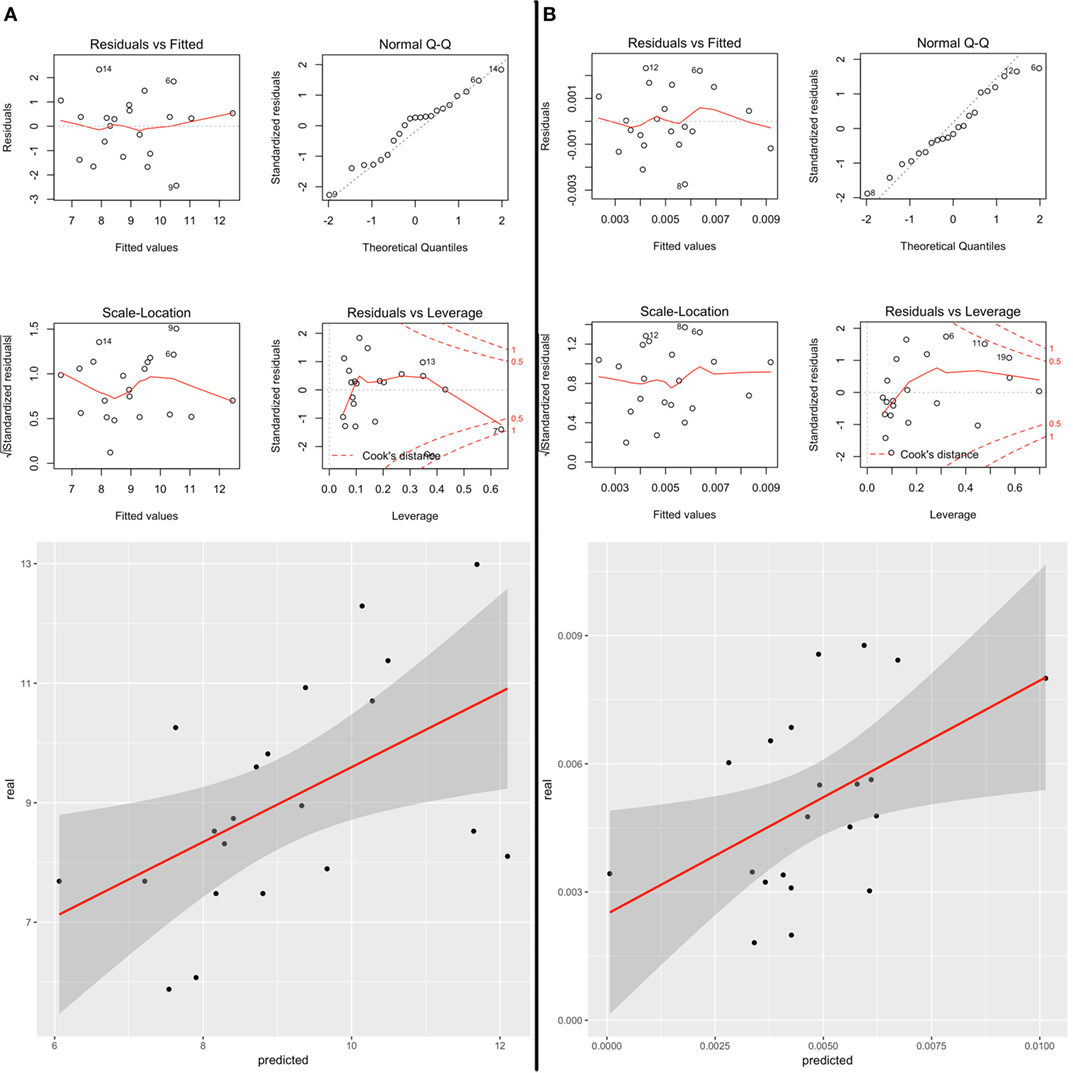
Figure 6. (A) Correlation between predicted and real measurements of (A) SRT-CLTR z-score and (B) TWT after leave-one-out cross validation. (B) Diagnostic plots shows: (i) residuals function of fitted values (upper left), (ii) the hypothesis of normal distribution of the errors with QQplot (upper right), (iii) that the variance in the Residuals does not change as a function of z-score (bottom left), (iv) and the presence of outliers with Residuals function of Leverage (bottom right).
Discussion
Our study shows that the combination of multiple qMRI metrics is sensitive to 2-year changes in brain pathology in a group of early-stage MS patients on therapy, suggesting a decrease in NAWM inflammation as well as repair processes in lesions. Besides, our work provides evidence that multiple qMRI metrics at baseline are strongly and differently related to patients’ motor and cognitive function at two year follow-up.
To date, there are very few studies that combined qMRI metrics to study the evolution of MS pathology over time and none applied T1, T2, T2* relaxometry, and MTR. A small number of longitudinal studies in MS patients applied either MTR (39–42) or T2* relaxometry maps (43). These works showed a progressive increase in MTR over time in subgroups of lesions [i.e., nearly 20% of acute lesions according to Chen et al. (40)] and a decrease in T2* rt in the basal ganglia (43) in MS patients, who were followed-up between 1 and 4 years. Changes in MTR and T2* rt were interpreted as remyelination in lesions and iron accumulation in basal ganglia; however, these interpretations may have been misleading because an increase in MTR and a decrease in T2* might be also due to a decrease in water content, i.e., edema reabsorption (20, 26).
Recent developments in MRI technology have made it possible to acquire multiple advanced MRI contrasts in scan times compatible with clinical research, thereby increasing sensitivity and specificity to brain pathology (21, 26, 27, 44). By combining multiple MR metrics and leveraging their biophysical properties, we have previously studied the pathology of MS lesions, NA tissue and brain connectivity (26, 28) and proposed a new classification of MS lesions (27). Here, we have developed an automated qMRI framework to monitor disease evolution in early MS patients.
Despite the absence of volumetric changes in the majority of lesions (75%), qMRI showed a concomitant significant decrease in T1 relaxation times and an increase of MTR suggesting repair mechanisms such as remyelination, increase in axonal density and/or gliosis (18, 45). Future studies combining qMRI with diffusion MRI may allow discriminating between gliotic or axonal/myelin restauration by exploiting the information on tissue anisotropy provided by the diffusion contrast.
The few lesions that disappeared at 2-year follow-up (resolved lesions) exhibited higher MTR and lower T1 and T2* rt at baseline than lesions that did not change in volume. While higher MTR may indicate at the time higher free-water content (i.e., more pronounced edema due to active inflammation) or higher higher myelin/axonal bound water (i.e., higher myelination/axonal density), the concomitant lower T1/T2* rt point at the latter pathophysiological explanation. In fact, the presence of edema would have increased—not decreased—both T1 and T2* rt (6).
Also, lesions that significantly decreased in volume at 2-year follow-up (shrunken lesions), evidenced a significant higher T2 rt at baseline compared to stable and other lesions, possibly related to higher inflammatory processes (i.e., high presence of extracellular water) or higher cellular infiltration (i.e., lower intracellular water). The absence of significant differences at baseline between lesions that enlarge at follow-up and other lesions suggests that the lesion microstructural properties as measured by qMRI is not predictive of lesion growth in this cohort of patients.
These findings provide new evidence that qMRI may be used as baseline biomarker of lesion evolution and extend current literature reporting that lesions with modest MTR decrease compared to healthy tissue are more likely to undergo partial or complete recovery (18, 46).
The study of NA tissue revealed a mild but significant longitudinal decrease in T2 rt in NAWM and a decrease of both T2 and T1 rt in the pallidum, whereas no longitudinal changes were observed in healthy subjects for all aMRI parameters. On one hand, these data provide evidence of the stability of qMRI in control subjects. On the other hand, our results suggest that—in our cohort of early MS patients with minimal clinical deficits—there is a longitudinal decrease in overall inflammation, i.e., due to lower microglia activation in patients on therapy (47) and/or iron accumulation (16). Overall these findings suggest that qMRI metrics may help defining the underpinnings of disease evolution in MS patients and provide new biomarkers of disease impact over time in the absence of significant brain volume changes.
Last, lesions and NAWM characteristics, as measured with qMRI, appeared to be strongly related to motor and cognitive changes at 2-year follow-up, whereas lesion volume did not. These results extend the evidence obtained in a previous cross-sectional study from our group, where a number of cognitive functions exhibited high correlations with lesion and NA tissue properties measured with qMRI (26). MS patients improved their motor and cognitive function over 2 years: while on one hand, cognitive improvement may be attributed to learning despite we adopted an adapted test for longitudinal assessment, the presence of both cognitive and motor improvement in a very homogeneous cohort of early-stage RRMS patients on therapy may well indicate compensatory plasticity.
The study suffers from some limitations. First, we studied a cohort of patients and healthy controls of moderate/small size. Future study should aim at confirming our findings in larger populations and extend them to more advanced disease stages. Second, since we studied a cohort of early-stage MS patients, we do not have histological data to corroborate our findings; therefore, we interpreted our results based upon the biophysical properties of the MR signals (6) and upon a number of previous publications using single contrasts parametric MRI and histopathology [for review see Ref. (48)]. However, though histological data might be valuable to assess changes in myelin and axons, postmortem experiments in patients will not provide any direct information about the presence of extracellular water accumulation (i.e., edema), as we do in the current study. To note, the only one study that—to our knowledge—attempted at correlating ex vivo T1/T2 relaxation times and MTR with histopathological metrics evinced the limits of ex vivo MRI to measure the complexity of phenomena influencing the MRI signal in vivo (49). Last, another potential limitation of our work is that the applied T2 relaxometry maps had a lower resolution than the other maps, which could have decreased the sensitivity to lesions and NA tissue pathology.
In summary, we have shown that combining different MR parameters allows increasing pathological specificity to ongoing damage even at early MS stages and provide metrics that predict patients motor and cognitive function at 2 years follow-up. In the future, we will assess the sensitivity of qMRI metrics to larger and more heterogeneous patients cohorts, we will establish the sensitivity of qMRI metrics to different therapy regimens as well as work on the development of “personalized” qMRI assessments.
Ethics Statement
The study was approved by the Ethic Committee of the Lausanne University Hospital (CHUV); all participants gave written informed consent prior to participation.
Author Contributions
Study design (CG and GK); collection, analysis, and interpretation of data (GB, BM, MF, JM, MS, GK, CG, and PF); writing of the report and decision to submit the paper for publication (GB, BM, JM, SS, MS, RP, J-PT, GK, and CG).
Conflict of Interest Statement
GK and BM are Siemens Healthcare employees. The other authors have nothing to disclose.
The reviewer EP and handling editor declared their shared affiliation, and the handling editor states that the process nevertheless met the standards of a fair and objective review.
Funding
The Swiss National Science Foundation under grants PZ00P3_131914/11, P00P2-123438. The Swiss MS Society and the Societé Académique Vaudoise. The funding sources had no role in study design; in the collection, analysis, and interpretation of data; in the writing of the report or in the decision to submit the paper for publication.
References
1. Noseworthy JH, Lucchinetti C, Rodriguez M, Weinshenker BG. Multiple sclerosis. N Engl J Med (2000) 343:938–52. doi:10.1056/NEJM200009283431307
2. Ransohoff RM, Hafler DA, Lucchinetti CF. Multiple sclerosis – a quiet revolution. Nat Rev Neurol (2015) 11:134–42. doi:10.1038/nrneurol.2015.14
3. Ceccarelli A, Bakshi R, Neema M. MRI in multiple sclerosis: a review of the current literature. Curr Opin Neurol (2012) 25:402–9. doi:10.1097/WCO.0b013e328354f63f
4. Absinta M, Sati P, Reich DS. Advanced MRI and staging of multiple sclerosis lesions. Nat Rev Neurol (2016) 12:358–68. doi:10.1038/nrneurol.2016.59
5. Enzinger C, Barkhof F, Ciccarelli O, Filippi M, Kappos L, Rocca MA, et al. Nonconventional MRI and microstructural cerebral changes in multiple sclerosis. Nat Rev Neurol (2015) 11:676–86. doi:10.1038/nrneurol.2015.194
6. Helms G. Tissue properties from quantitative MRI. In: Brain Mapping. Toga AW, editor. Waltham: Academic Press (2015). p. 287–94.
7. Weiskopf N, Mohammadi S, Lutti A, Callaghan MF. Advances in MRI-based computational neuroanatomy: from morphometry to in-vivo histology. Curr Opin Neurol (2015) 28:313–22. doi:10.1097/WCO.0000000000000222
8. Groeschel S, Hagberg GE, Schultz T, Balla DZ, Klose U, Hauser TK, et al. Assessing white matter microstructure in brain regions with different myelin architecture using MRI. PLoS One (2016) 11:e0167274. doi:10.1371/journal.pone.0167274
9. Stuber C, Morawski M, Schafer A, Labadie C, Wahnert M, Leuze C, et al. Myelin and iron concentration in the human brain: a quantitative study of MRI contrast. Neuroimage (2014) 93(Pt 1):95–106. doi:10.1016/j.neuroimage.2014.02.026
10. Callaghan MF, Helms G, Lutti A, Mohammadi S, Weiskopf N. A general linear relaxometry model of R1 using imaging data. Magn Reson Med (2015) 73:1309–14. doi:10.1002/mrm.25210
11. Malcolm HL. Spin Dynamics: Basics of Nuclear Magnetic Resonance. 2nd ed. New York: Wiley-Blackwell (2008).
12. Deoni SC. Magnetic resonance relaxation and quantitative measurement in the brain. Methods Mol Biol (2011) 711:65–108. doi:10.1007/978-1-61737-992-5_4
13. Eickhoff S, Walters NB, Schleicher A, Kril J, Egan GF, Zilles K, et al. High-resolution MRI reflects myeloarchitecture and cytoarchitecture of human cerebral cortex. Hum Brain Mapp (2005) 24:206–15. doi:10.1002/hbm.20082
14. Goubran M, Hammond RR, de Ribaupierre S, Burneo JG, Mirsattari S, Steven DA, et al. Magnetic resonance imaging and histology correlation in the neocortex in temporal lobe epilepsy. Ann Neurol (2015) 77:237–50. doi:10.1002/ana.24318
15. Ogg RJ, Steen RG. Age-related changes in brain T1 are correlated with iron concentration. Magn Reson Med (1998) 40:749–53. doi:10.1002/mrm.1910400516
16. Schenker C, Meier D, Wichmann W, Boesiger P, Valavanis A. Age distribution and iron dependency of the T2 relaxation time in the globus pallidus and putamen. Neuroradiology (1993) 35:119–24. doi:10.1007/BF00593967
17. Langkammer C, Krebs N, Goessler W, Scheurer E, Ebner F, Yen K, et al. Quantitative MR imaging of brain iron: a postmortem validation study. Radiology (2010) 257:455–62. doi:10.1148/radiol.10100495
18. Deloire-Grassin MS, Brochet B, Quesson B, Delalande C, Dousset V, Canioni P, et al. In vivo evaluation of remyelination in rat brain by magnetization transfer imaging. J Neurol Sci (2000) 178:10–6. doi:10.1016/S0022-510X(00)00331-2
19. Mottershead JP, Schmierer K, Clemence M, Thornton JS, Scaravilli F, Barker GJ, et al. High field MRI correlates of myelin content and axonal density in multiple sclerosis – a post-mortem study of the spinal cord. J Neurol (2003) 250:1293–301. doi:10.1007/s00415-003-0192-3
20. Vavasour IM, Laule C, Li DK, Traboulsee AL, MacKay AL. Is the magnetization transfer ratio a marker for myelin in multiple sclerosis? J Magn Reson Imaging (2011) 33:713–8. doi:10.1002/jmri.22441
21. Weiskopf N, Suckling J, Williams G, Correia MM, Inkster B, Tait R, et al. Quantitative multi-parameter mapping of R1, PD(*), MT, and R2(*) at 3T: a multi-center validation. Front Neurosci (2013) 7:95. doi:10.3389/fnins.2013.00095
22. Callaghan MF, Mohammadi S, Weiskopf N. Synthetic quantitative MRI through relaxometry modelling. NMR Biomed (2016) 29:1729–38. doi:10.1002/nbm.3658
23. Metere R, Kober T, Moller HE, Schafer A. Simultaneous quantitative MRI mapping of T1, T2* and magnetic susceptibility with multi-echo MP2RAGE. PLoS One (2017) 12:e0169265. doi:10.1371/journal.pone.0169265
24. Rieger B, Zimmer F, Zapp J, Weingartner S, Schad LR. Magnetic resonance fingerprinting using echo-planar imaging: joint quantification of T1 and T2 * relaxation times. Magn Reson Med (2016). doi:10.1002/mrm.26561
25. Filippi M, Preziosa P, Rocca MA. Microstructural MR imaging techniques in multiple sclerosis. Neuroimaging Clin N Am (2017) 27:313–33. doi:10.1016/j.nic.2016.12.004
26. Bonnier G, Roche A, Romascano D, Simioni S, Meskaldji D, Rotzinger D, et al. Advanced MRI unravels the nature of tissue alterations in early multiple sclerosis. Ann Clin Transl Neurol (2014) 1:423–32. doi:10.1002/acn3.68
27. Bonnier G, Roche A, Romascano D, Simioni S, Meskaldji DE, Rotzinger D, et al. Multicontrast MRI quantification of focal inflammation and degeneration in multiple sclerosis. Biomed Res Int (2015) 2015:569123. doi:10.1155/2015/569123
28. Romascano D, Meskaldji DE, Bonnier G, Simioni S, Rotzinger D, Lin YC, et al. Multicontrast connectometry: a new tool to assess cerebellum alterations in early relapsing-remitting multiple sclerosis. Hum Brain Mapp (2015) 36:1609–19. doi:10.1002/hbm.22698
29. Vavasour IM, Li DK, Laule C, Traboulsee AL, Moore GR, Mackay AL. Multi-parametric MR assessment of T(1) black holes in multiple sclerosis: evidence that myelin loss is not greater in hypointense versus isointense T(1) lesions. J Neurol (2007) 254:1653–9. doi:10.1007/s00415-007-0604-x
30. Bodini B, Cercignani M, Toosy A, De Stefano N, Miller DH, Thompson AJ, et al. A novel approach with “skeletonised MTR” measures tract-specific microstructural changes in early primary-progressive MS. Hum Brain Mapp (2014) 35:723–33. doi:10.1002/hbm.22196
31. Polman CH, Reingold SC, Banwell B, Clanet M, Cohen JA, Filippi M, et al. Diagnostic criteria for multiple sclerosis: 2010 revisions to the McDonald criteria. Ann Neurol (2011) 69:292–302. doi:10.1002/ana.22366
32. Boringa JB, Lazeron RH, Reuling IE, Ader HJ, Pfennings L, Lindeboom J, et al. The brief repeatable battery of neuropsychological tests: normative values allow application in multiple sclerosis clinical practice. Mult Scler (2001) 7:263–7. doi:10.1177/135245850100700409
33. Klein S, Staring M, Murphy K, Viergever MA, Pluim JP. elastix: a toolbox for intensity-based medical image registration. IEEE Trans Med Imaging (2010) 29:196–205. doi:10.1109/TMI.2009.2035616
34. Schmitter D, Roche A, Marechal B, Ribes D, Abdulkadir A, Bach-Cuadra M, et al. An evaluation of volume-based morphometry for prediction of mild cognitive impairment and Alzheimer’s disease. Neuroimage Clin (2015) 7:7–17. doi:10.1016/j.nicl.2014.11.001
35. Smith SM, Zhang Y, Jenkinson M, Chen J, Matthews PM, Federico A, et al. Accurate, robust, and automated longitudinal and cross-sectional brain change analysis. Neuroimage (2002) 17:479–89. doi:10.1006/nimg.2002.1040
36. Hasan KM, Walimuni IS, Kramer LA, Frye RE. Human brain atlas-based volumetry and relaxometry: application to healthy development and natural aging. Magn Reson Med (2010) 64:1382–9. doi:10.1002/mrm.22515
37. West J, Blystad I, Engstrom M, Warntjes JB, Lundberg P. Application of quantitative MRI for brain tissue segmentation at 1.5 T and 3.0 T field strengths. PLoS One (2013) 8:e74795. doi:10.1371/journal.pone.0074795
38. Moraal B, Wattjes MP, Geurts JJ, Knol DL, van Schijndel RA, Pouwels PJ, et al. Improved detection of active multiple sclerosis lesions: 3D subtraction imaging. Radiology (2010) 255:154–63. doi:10.1148/radiol.09090814
39. Laule C, Vavasour IM, Whittall KP, Oger J, Paty DW, Li DK, et al. Evolution of focal and diffuse magnetisation transfer abnormalities in multiple sclerosis. J Neurol (2003) 250:924–31. doi:10.1007/s00415-003-1115-z
40. Chen JT, Collins DL, Atkins HL, Freedman MS, Arnold DL; Canadian MS/BMT Study Group. Magnetization transfer ratio evolution with demyelination and remyelination in multiple sclerosis lesions. Ann Neurol (2008) 63:254–62. doi:10.1002/ana.21302
41. van den Elskamp IJ, Knol DL, Vrenken H, Karas G, Meijerman A, Filippi M, et al. Lesional magnetization transfer ratio: a feasible outcome for remyelinating treatment trials in multiple sclerosis. Mult Scler (2010) 16:660–9. doi:10.1177/1352458510364630
42. Brown RA, Narayanan S, Arnold DL. Imaging of repeated episodes of demyelination and remyelination in multiple sclerosis. Neuroimage Clin (2014) 6:20–5. doi:10.1016/j.nicl.2014.06.009
43. Khalil M, Langkammer C, Pichler A, Pinter D, Gattringer T, Bachmaier G, et al. Dynamics of brain iron levels in multiple sclerosis: a longitudinal 3T MRI study. Neurology (2015) 84:2396–402. doi:10.1212/WNL.0000000000001679
44. Reich DS, Smith SA, Zackowski KM, Gordon-Lipkin EM, Jones CK, Farrell JA, et al. Multiparametric magnetic resonance imaging analysis of the corticospinal tract in multiple sclerosis. Neuroimage (2007) 38:271–9. doi:10.1016/j.neuroimage.2007.07.049
45. Schmierer K, Scaravilli F, Altmann DR, Barker GJ, Miller DH. Magnetization transfer ratio and myelin in postmortem multiple sclerosis brain. Ann Neurol (2004) 56:407–15. doi:10.1002/ana.20202
46. Dousset V, Grossman RI, Ramer KN, Schnall MD, Young LH, Gonzalez-Scarano F, et al. Experimental allergic encephalomyelitis and multiple sclerosis: lesion characterization with magnetization transfer imaging. Radiology (1992) 182:483–91. doi:10.1148/radiology.182.2.1732968
47. Kasper LH, Reder AT. Immunomodulatory activity of interferon-beta. Ann Clin Transl Neurol (2014) 1:622–31. doi:10.1002/acn3.84
48. Watanabe T, Frahm J, Michaelis T. In vivo brain MR imaging at subnanoliter resolution: contrast and histology. Magn Reson Med Sci (2016) 15:11–25. doi:10.2463/mrms.2015-0048
Keywords: magnetization transfer imaging, relaxometry, advanced magnetic resonance imaging techniques, multiple sclerosis, relapsing-remitting, brain repair
Citation: Bonnier G, Maréchal B, Fartaria MJ, Falkowskiy P, Marques JP, Simioni S, Schluep M, Du Pasquier R, Thiran J-P, Krueger G and Granziera C (2017) The Combined Quantification and Interpretation of Multiple Quantitative Magnetic Resonance Imaging Metrics Enlightens Longitudinal Changes Compatible with Brain Repair in Relapsing-Remitting Multiple Sclerosis Patients. Front. Neurol. 8:506. doi: 10.3389/fneur.2017.00506
Received: 12 May 2017; Accepted: 08 September 2017;
Published: 27 September 2017
Edited by:
Maria Assunta Rocca, San Raffaele Hospital (IRCCS), ItalyReviewed by:
Elisabetta Pagani, San Raffaele Hospital (IRCCS), ItalyMenno Michiel Schoonheim, VU University Medical Center, Netherlands
Copyright: © 2017 Bonnier, Maréchal, Fartaria, Falkowskiy, Marques, Simioni, Schluep, Du Pasquier, Thiran, Krueger and Granziera. This is an open-access article distributed under the terms of the Creative Commons Attribution License (CC BY). The use, distribution or reproduction in other forums is permitted, provided the original author(s) or licensor are credited and that the original publication in this journal is cited, in accordance with accepted academic practice. No use, distribution or reproduction is permitted which does not comply with these terms.
*Correspondence: Guillaume Bonnier, gbonnier@mailfence.com