Local connections of layer 5 GABAergic interneurons to corticospinal neurons
- 1 Department of Morphological Brain Science, Graduate School of Medicine, Kyoto University, Kyoto, Japan
- 2 Japan Science and Technology Agency, Core Research for Evolutional Science and Technology, Tokyo, Japan
- 3 Department of Genetic and Behavioral Neuroscience, Gunma University Graduate School of Medicine, Maebashi, Japan
In the local circuit of the cerebral cortex, GABAergic inhibitory interneurons are considered to work in collaboration with excitatory neurons. Although many interneuron subgroups have been described in the cortex, local inhibitory connections of each interneuron subgroup are only partially understood with respect to the functional neuron groups that receive these inhibitory connections. In the present study, we morphologically examined local inhibitory inputs to corticospinal neurons (CSNs) in motor areas using transgenic rats in which GABAergic neurons expressed fluorescent protein Venus. By analysis of biocytin-filled axons obtained with whole-cell recording/staining in cortical slices, we classified fast-spiking (FS) neurons in layer (L) 5 into two types, FS1 and FS2, by their high and low densities of axonal arborization, respectively. We then investigated the connections of FS1, FS2, somatostatin (SOM)-immunopositive, and other (non-FS/non-SOM) interneurons to CSNs that were retrogradely labeled in motor areas. When close appositions between the axon boutons of the intracellularly labeled interneurons and the somata/dendrites of the retrogradely labeled CSNs were examined electron-microscopically, 74% of these appositions made symmetric synaptic contacts. The axon boutons of single FS1 neurons were two- to fourfold more frequent in appositions to the somata/dendrites of CSNs than those of FS2, SOM, and non-FS/non-SOM neurons. Axosomatic appositions were most frequently formed with axon boutons of FS1 and FS2 neurons (approximately 30%) and least frequently formed with those of SOM neurons (7%). In contrast, SOM neurons most extensively sent axon boutons to the apical dendrites of CSNs. These results might suggest that motor outputs are controlled differentially by the subgroups of L5 GABAergic interneurons in cortical motor areas.
Introduction
An important piece of the motor execution signal is transmitted from the cerebral cortex to the spinal cord by corticospinal projection neurons (CSNs), which are densely located in layer (L) 5 of motor areas. When CSNs are labeled by injection of retrograde tracers into the spinal cord in rats, many labeled neurons are continuously found in L5 from the primary motor (M1) area of the lateral agranular field to the hindlimb (HL) and forelimb (FL) areas of the lateral granular field (Wise and Jones, 1977; Leong, 1983; Miller, 1987; Killackey et al., 1989). Although the FL/HL areas are often recognized as the primary somatosensory area, the threshold of intracortical microstimulation for evoking somatic movement is as low in the HL area and the medial part of the FL area as in the M1 area. Thus, the FL/HL areas are considered mixed areas for the motor and sensory information processing of the FL and HL (Hall and Lindholm, 1974; Donoghue and Wise, 1982; Sanderson et al., 1984; Frost et al., 2000).
Neocortical GABAergic interneurons are classified on the basis of morphological, electrophysiological, and molecular properties (Cauli et al., 1997; DeFelipe, 1997; Markram et al., 2004; Rudy et al., 2011). In the rat neocortex, immunohistochemical, and electrophysiological studies established that cortical GABAergic interneurons are divided into at least four distinct subgroups: (1) parvalbumin (PV)-producing, fast-spiking (FS) neurons; (2) somatostatin (SOM)-producing neurons containing Martinotti cells; (3) neurons expressing one or more chemical markers including calretinin, vasoactive intestinal polypeptide (VIP), cholecystokinin, corticotropin-releasing factor, and choline acetyltransferase; and (4) α-actinin-expressing neurogliaform cells exhibiting late-spiking characteristics (Eckenstein and Baughman, 1984; Kosaka et al., 1987; Rogers, 1992; DeFelipe, 1993; Chedotal et al., 1994; Kawaguchi and Kubota, 1996, 1997; Bayraktar et al., 1997; Gonchar and Burkhalter, 1997; Kawaguchi and Kondo, 2002; Uematsu et al., 2008; Kubota et al., 2011). It is accepted that the third group is more heterogeneous than the others, as various chemical markers are partially co-expressed with each other in single interneurons. Furthermore, the composition of GABAergic interneuron subgroups is dependent on the cortical layer of the rat neocortex (Gonchar and Burkhalter, 1997; Uematsu et al., 2008; Kubota et al., 2011; Ma et al., 2011). In L5 of the rodent cortex, 50–70% and 20–30% of L5 interneurons are FS neurons and SOM-producing neurons (SOM neurons), respectively. The majority of the remaining interneurons belong to the third group (non-FS/non-SOM neurons in the present study; Gonchar and Burkhalter, 1997; Uematsu et al., 2008; Ma et al., 2011), as α-actinin-expressing neurons are distributed mainly in superficial layers and very sparsely in L5 (Uematsu et al., 2008; Ma et al., 2011).
When animals execute their movements, excitatory neurons including CSNs in the motor areas work in collaboration with inhibitory interneurons, suggesting that the cortical local circuit finely modulates the motor output signal (Matsumura et al., 1991, 1992; Beloozerova et al., 2003; Georgopoulos and Stefanis, 2007; Merchant et al., 2008; Isomura et al., 2009). It is thus important to understand how neighboring excitatory and inhibitory neurons connect to CSNs in local circuits of the motor areas. In rodents, CSNs have been shown to receive strong excitatory connections from L3–5 pyramidal neurons (Kaneko et al., 1994, 2000; Cho et al., 2004b; Anderson et al., 2010). However, the direct connections of inhibitory interneurons to CSNs have not been studied in detail. In the present study, we examined the relationship between axon varicosities, or boutons, of L5 interneurons with dendrites and cell bodies of CSNs, because L5 interneurons were previously reported to exert the greatest inhibitory control over L5 pyramidal neurons (Katzel et al., 2011). By morphological analysis, we divided L5 FS neurons into two types, FS1 and FS2, in terms of axonal arborization. We then examined the local connections of FS1, FS2, SOM, and non-FS/non-SOM interneurons to CSNs by combining retrograde visualization of CSNs (Kaneko et al., 1996, 2000; Cho et al., 2004b) with whole-cell recording/labeling of interneurons in the motor areas of adult transgenic rats that expressed fluorescent protein Venus under the control of the promoter for vesicular GABA transporter (VGAT; Uematsu et al., 2008).
Materials and Methods
Animals
Fifty-six VGAT-Venus transgenic B line rats (Uematsu et al., 2008; postnatal days 56–70) were used. Experiments were conducted in accordance with the guidelines of the Committee for Animal Care and Use of the Graduate School of Medicine, Kyoto University. All efforts were made to minimize the suffering and number of animals used in the present study.
Immunohistochemistry of GABAergic Interneuron Markers
Six transgenic rats were deeply anesthetized with chloral hydrate (70 mg/100 g body weight) and perfused transcardially with 200 ml of 10 mM phosphate-buffered 0.85% saline (PBS; pH 7.4), followed by 200 ml of 4% formaldehyde, 75%-saturated picric acid, and 0.1 M Na2HPO4 (pH 7.0; adjusted with NaOH). The brains were removed, cut into several blocks, and post-fixed with the same fixative above for 4 h at 4°C. For immunostaining of GABA, 0.1% glutaraldehyde was added to the fixative used for perfusion. After cryoprotection with 30% sucrose in PBS, the blocks were cut into 30-μm-thick sections on a freezing microtome. The sections were immunolabeled for GABA, PV, and SOM as reported previously (Hioki et al., 2004). Briefly, the sections were incubated with anti-GABA rabbit antibody (1:1000, A2052; Sigma, St. Louis, MO, USA), mouse monoclonal anti-PV IgG (1:8000, P-3088; Sigma) or rat anti-SOM IgG (1:250, MAB354; Chemicon, Temecula, CA, USA) in PBS containing 0.3% Triton X-100 and 0.02% sodium merthiolate (PBS-X) and further incubated with 5 μg/ml AlexaFluor (AF) 594-conjugated goat antibody to rabbit IgG (A-11037; Invitrogen, Eugene, OR, USA), to mouse IgG (A-11032), or to rat IgG (A-11007). Fluorescence was observed and photographed under epifluorescence microscope Axiophot (Zeiss, Oberkochen, Germany) with appropriate filter sets: Venus, 450–490 nm for excitation and 514–565 nm for emission; and AF594, 530–585 and ≥615 nm, or under a confocal laser-scanning microscope LSM 5 Pascal (Zeiss) with appropriate sets of laser beams: Venus, 488 nm for excitation and 505–530 nm for emission; and AF594, 543 and ≥560 nm.
Injection of Retrograde Tracer, Whole-cell Recording/labeling, and Fixation
Rats were anesthetized by ether inhalation and intraperitoneal injection of chloral hydrate (35 mg/100 g body weight). Three microliters of 10% tetramethylrhodamine–dextran amine (TMR–DA, MW 3000; D-3308; Invitrogen) dissolved in 0.1 M citrate–NaOH, pH 3.0 (Kaneko et al., 1996), was injected into the corticospinal tract in the dorsal funiculus at the upper cervical segments of the spinal cord by pressure through a glass micropipette attached to Picospritzer III (Parker Hannifin Corporation, General Valve Division, Fairfield, NJ, USA).
After survival for 2–3 days, the rats were reanesthetized by intraperitoneal injection of chloral hydrate (70 mg/100 g body weight), perfused transcardially with 100 ml of the following cutting solution at room temperature, and decapitated. The cutting solution was composed of (in mM) 147 N-methyl-D-glucamine, 20 HEPES, 1 KCl, 1.3 KH2PO4, 2.5 MgSO4, 1 CaCl2, 10 glucose (pH was adjusted to 7.4 by HCl), which were helpful to obtain viable slices from adult rodent brain (Tanaka et al., 2008). The brains were quickly removed and cut frontally into 500-μm-thick slices in cutting solution at room temperature using a Linear Slicer Pro 7 (Dosaka EM, Kyoto, Japan). Immediately after the cutting, the slices were incubated at 20 ± 1°C on a nylon mesh for at least 30 min in 95% O2/5% CO2-saturated artificial cerebrospinal fluid (ACSF) containing (in mM) 125 NaCl, 2.5 KCl, 1.25 NaH2PO4, 1 MgSO4, 2 CaCl2, 26 NaHCO3, 20 glucose, 4 lactic acid, 2 pyruvic acid, and 0.4 ascorbic acid (pH 7.4, 315 mOsm/l; Galarreta and Hestrin, 2002), and then transferred to a recording chamber set at 30 ± 1°C and perfused with ACSF. Recording pipettes were made with a puller P97 (Sutter, Novato, CA, USA) and filled with (in mM) 130 K-methylsulfate, 6.3 KCl, 10 HEPES, 20 Na2-phosphocreatine, 0.2 EGTA, 4 Mg-ATP, 0.3 Na2-GTP, and 0.5% biocytin (Sigma; pH 7.3, 295 mOsm/l; Galarreta and Hestrin, 2002), resulting in the resistance of 5–10 MΩ and liquid junction potential of 12 mV. Under the fluorescence microscope, we recorded Venus-expressing neurons (Figures 1C,C′) in L5 of the motor areas that contained many retrogradely TMR-labeled CSNs. The responses of impaled neurons to current injections were recorded with a current-clamp amplifier (Intracellular Recording Amplifier Model IR-183; NeuroData Instruments, New York, NY, USA), and the data were stored in a computer through an analog-digital converter (PowerLab; AD Instruments, Castle Hill, Australia). At the end of the experiments, the slices were fixed for 20 h at 25°C in 0.1 M sodium phosphate (pH 7.0) containing 3% formaldehyde, 0.03% glutaraldehyde, and 75%-saturated picric acid.
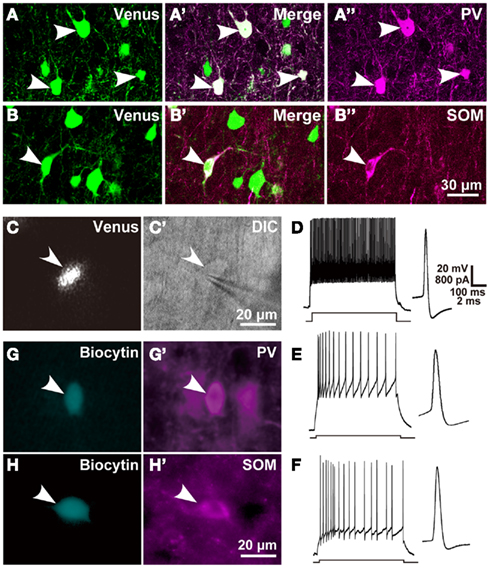
Figure 1. Chemical and electrical properties of L5 GABAergic interneurons in the motor areas. (A–B″) Almost all PV- and SOM immunopositive L5 neurons expressed Venus in the motor areas of VGAT-Venus transgenic rats. (C,C′) A Venus-expressing cell was attached and recorded with a patch electrode (arrowhead). (D–F) Left traces show the responses of L5 FS neurons, SOM neurons, and non-FS/non-SOM neurons, respectively, to 500-ms-long depolarizing current pulse injection. Right traces display the shape of action potential, where a passive component was subtracted from the raw trace (Kaneko et al., 1995). (G–H′) Arrowheads indicate biocytin-labeled GABAergic interneurons (G,H) that were immunoreactive for PV (G′) or SOM (H′). DIC, differential interference contrast microscopy. Scale bar in (B″) applies to (A–B″), that in (C′) to (C,C′), that in (D) to (D–F), and that in (H′) to (G–H′).
Visualization of Recorded Neurons and Retrogradely Labeled CSNs
After cryoprotection with 30% sucrose in PBS, the slices were further cut into 30-μm-thick sections on a freezing microtome. The sections were separately incubated as described in Table 1. After the staining, the sections were mounted on gelatin-coated glass slides, washed in tapping water, dried up, cleared in xylene, and coverslipped with organic mounting medium MX (Matsunami; Kishiwada, Japan). When necessary, cytoarchitecture was examined by counterstaining for Nissl with 0.2% cresyl violet after removal of glass covers. The sources of antibodies and reagents used in the steps were as follows; avidin-biotinylated peroxidase complex (ABC-Elite, Vector, Burlingame, CA, USA); Marina Blue-conjugated NeutrAvidin (Invitrogen); affinity-purified anti-TMR rabbit antibody (Kaneko et al., 1996); biotinylated anti-rabbit IgG goat antibody (BA-1000, Vector); diaminobenzidine-4 HCl (DAB; Dojindo, Kumamoto, Japan); biotinylated tyramine (BT; Kuramoto et al., 2009); glucose oxidase (GO; Nacalai Tesque, Kyoto, Japan); Tris–aminophenylmethane (TAPM; Nacalai Tesque); p-cresol (Sigma). Three hours after incubation in the step (3), the sections were examined under epifluorescence microscope Axiophot with the filter set for Marina Blue (359–371 nm for excitation and 397–490 nm for emission) to determine which section contained the cell body of the intracellularly labeled neuron. The mouse monoclonal anti-PV IgG (1:8000) or rat anti-SOM IgG (1:250) was added into the incubation well containing the section with the FS or non-FS neuron cell body, respectively. After further incubation for at least 8 h, the section containing the cell body was incubated for 1 h with 5 μg/ml AF594-conjugated goat antibody to mouse IgG or to rat IgG. The section was observed again under the epifluorescence microscope with the filter sets for AF594 (530–585-nm excitation and ≥615-nm emission) and Marina Blue to determine whether intracellularly labeled neurons expressed PV or SOM. The section was then incubated again for 4 h with 0.5 μg/ml anti-TMR rabbit antibody to recover detectability of TMR immunoreactivity in the steps (6)–(10) in Table 1. After these additional steps, the sections were returned to the step (4).
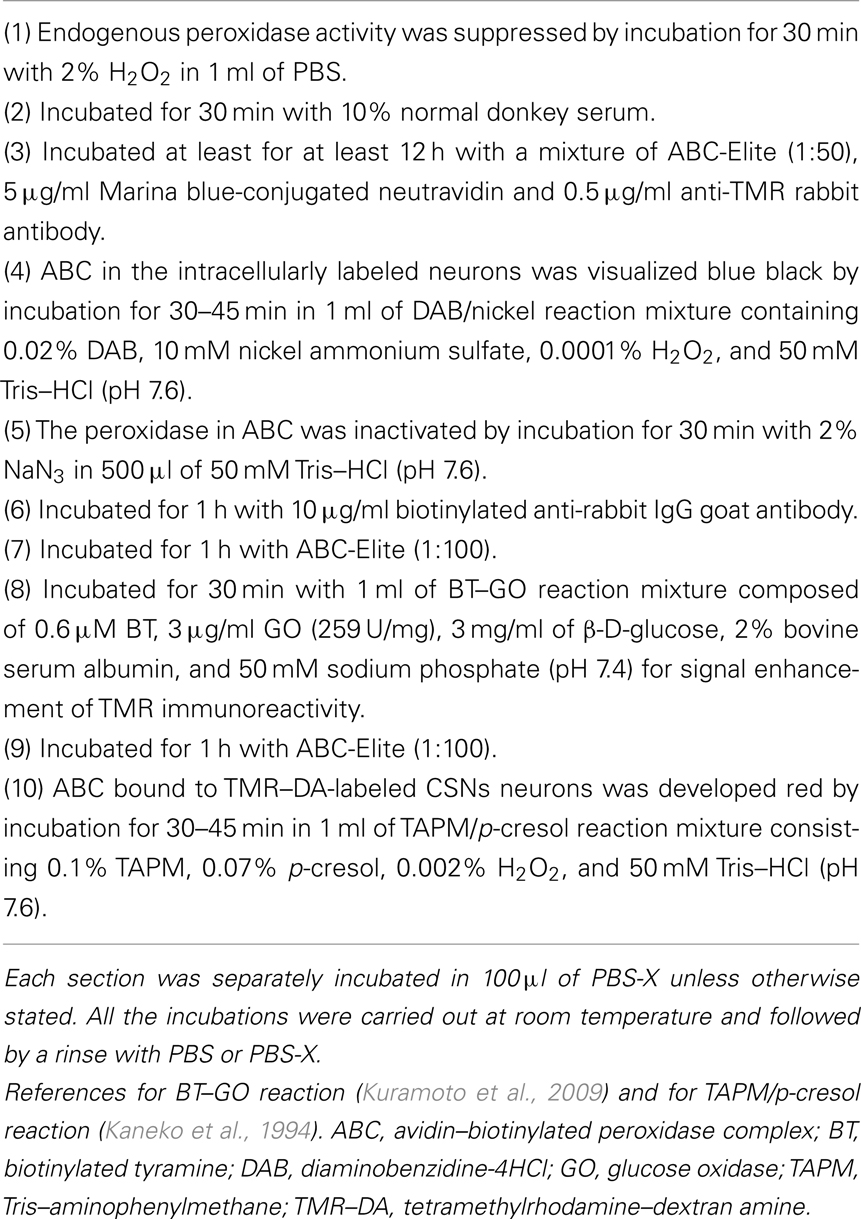
Table 1. Incubation steps of the sections for fluorescence and light microscopies.
Electron Microscopy
The electron microscopic examination was performed as reported previously (Kaneko et al., 2000; Cho et al., 2004b). Briefly, after intracellular labeling with biocytin, the slices were fixed at 4°C overnight with 2% paraformaldehyde and 0.1% glutaraldehyde in 0.1 M sodium phosphate (pH 7.4). The slices were embedded in low temperature-melting gelatin (12.5% in PBS; Nacalai Tesque). After solidified by cooling and post-fixed at 4°C for 3 h with 4% paraformaldehyde and 75%-saturated picric acid in 0.1 M sodium phosphate (pH 7.0), the slice in the gelatin blocks was further cut into 50-μm-thick sections with a Microslicer (Dosaka EM).
The endogenous peroxidase activity in the sections was suppressed by incubation with H2O2 [Table 1, step (1)] and the sections were incubated for 30 min with 10% normal donkey serum (NDS) in PBS. The following incubations were carried out at 4°C in PBS containing 10% NDS and 0.2% Photoflo (FUJIFILM, Tokyo, Japan) unless otherwise stated. After overnight incubation with a mixture of ABC-Elite (1:100) and 0.5 μg/ml affinity-purified anti-TMR rabbit IgG, the bound ABC was visualized blue black by peroxidase reaction in the DAB/nickel reaction mixture [as described in Table 1, step (4)]. After inactivation of the peroxidase in ABC with NaN3 [Table 1, step (5)], the sections were incubated for 4 h with 10 μg/ml biotinylated anti-rabbit IgG goat antibody and subsequently for 4 h with ABC-Elite (1:50). The bound ABC in the sections were developed brown for 20–40 min at room temperature in the DAB reaction mixture containing with 0.02% DAB and 0.001% H2O2 in 50 mM Tris–HCl (pH 7.6). The sections were post-fixed with 1% osmium tetraoxide in 0.1 M phosphate buffer, stained with 1% uranyl acetate, dehydrated in ethanol series, and flat-embedded in epoxy-resin Luveak (Nacalai Tesque). Once the resin was polymerized, the tissue samples were cut into ultrathin sections (70 nm) on an ultramicrotome Reichert-Nissei Ultracut S (Leica, Vienna, Austria). The ultrathin sections were mounted on one-pore grids and examined with an electron microscope H-7650 (Hitachi, Tokyo, Japan). We used the tilting apparatus coupled with rotation in the electron-microscopic observation, and the maximum tilting angle was ±45°.
Morphological Reconstruction of Single GABAergic Interneuron and Analysis of Close Appositions between Their Axon Boutons and the Dendrites of CSNs
The cell body, dendrites, and axons of intracellularly stained GABAergic interneurons were reconstructed under a microscope attached with camera lucida apparatus. During the reconstruction of the axon collaterals, we examined, frequently changing the focus of the microscopic with a 40× (N.A. = 0.95) or 100× (N.A. = 1.4, oil immersion) Plan Apo objective lens (Nikon, Tokyo, Japan), whether or not the axon boutons were closely apposed to the dendritic processes of retrogradely labeled CSNs. Axon boutons located between the slice surface and the intracellularly labeled cell body (usually 50–70 μm deep from the slice surface) were not included in the present analyses, because the brain tissue near the slice surface was largely damaged.
To examine the distribution of axon boutons of FS neurons three-dimensionally, the axon boutons were plotted by using Neurolucida (MicroBrightField, Williston, VT, USA) installed on microscope VANOX (Olympus, Tokyo, Japan) with a 40× objective lens (PLAN Apo, N.A. = 0.95) and a 30″ monitor. The histogram of the axon bouton density of FS neurons was fitted with a mixture curve of Gaussian distributions by the maximum likelihood estimation using a program written in software Igor Pro 5.0 (WaveMetrics Inc., Lake Oswego, OR, USA). A unimodal, bimodal or trimodal fitting curve was selected on the basis of the Bayesian Information Criterion (BIC) for parameters (Schwarz and Schmitz, 1997).
Statistics
When we compared all pairs between the three or four interneuron subgroups, we used Tukey’s post hoc multiple comparison test following one-way analysis of variance (ANOVA) or chi-square test with Bonferroni correction (Tables 2 and 4; Figure 7). For comparison in FS neuron group, we used two-tailed t-test or Bonferroni multiple comparison test following two-way ANOVA (Table 3; Figure 2). Each statistic and p-value was calculated with Prism 5.0 (Graphpad Software, San Diego, CA, USA).
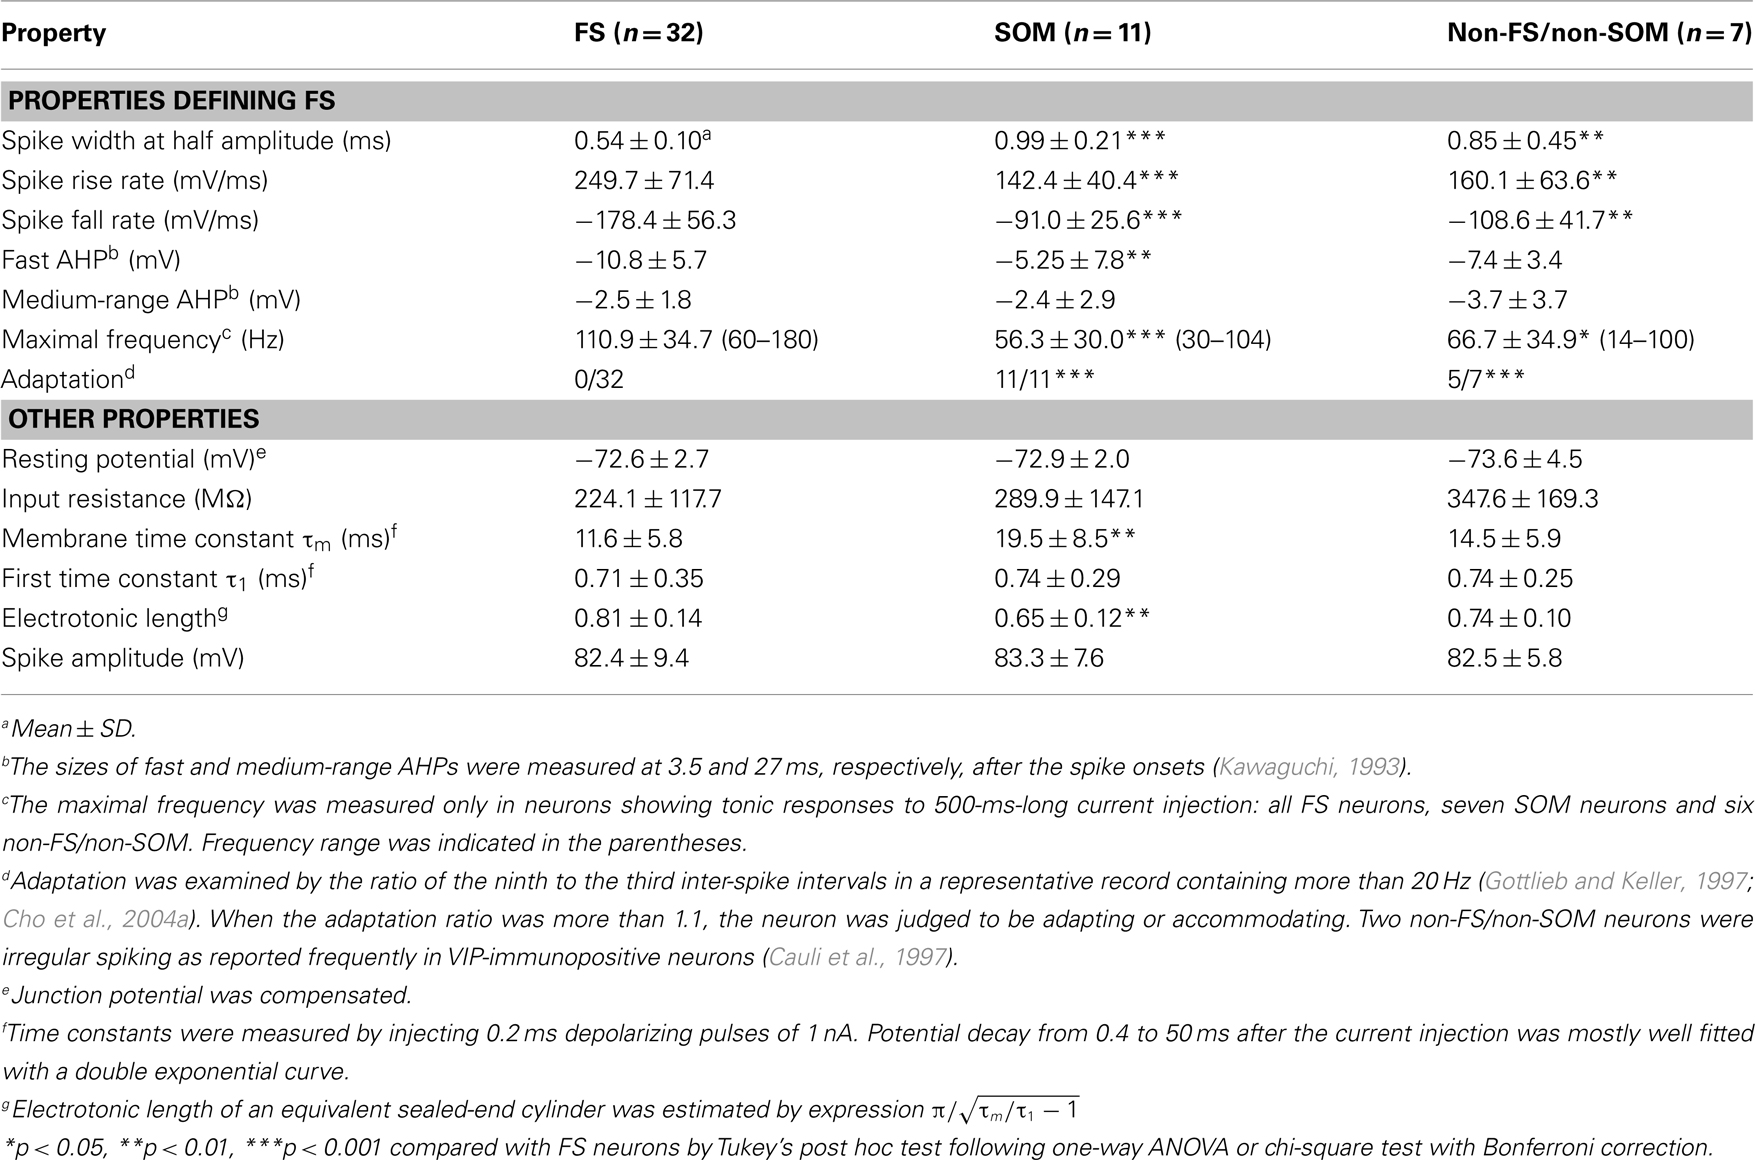
Table 2. Electrical properties of each subgroup of GABAergic interneurons.
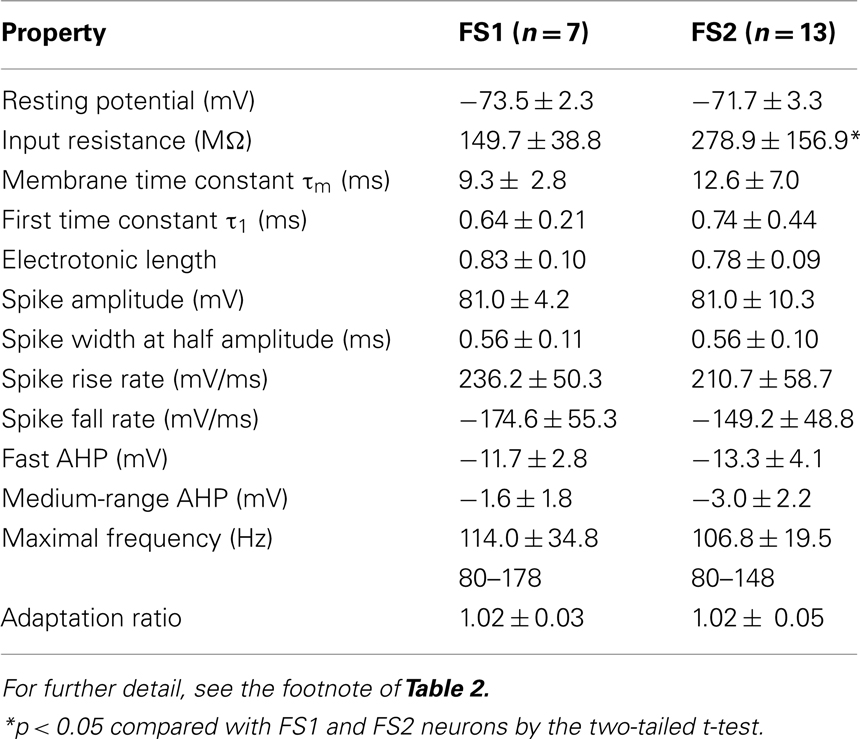
Table 3. Electrical properties of FS1 and FS2 neurons.
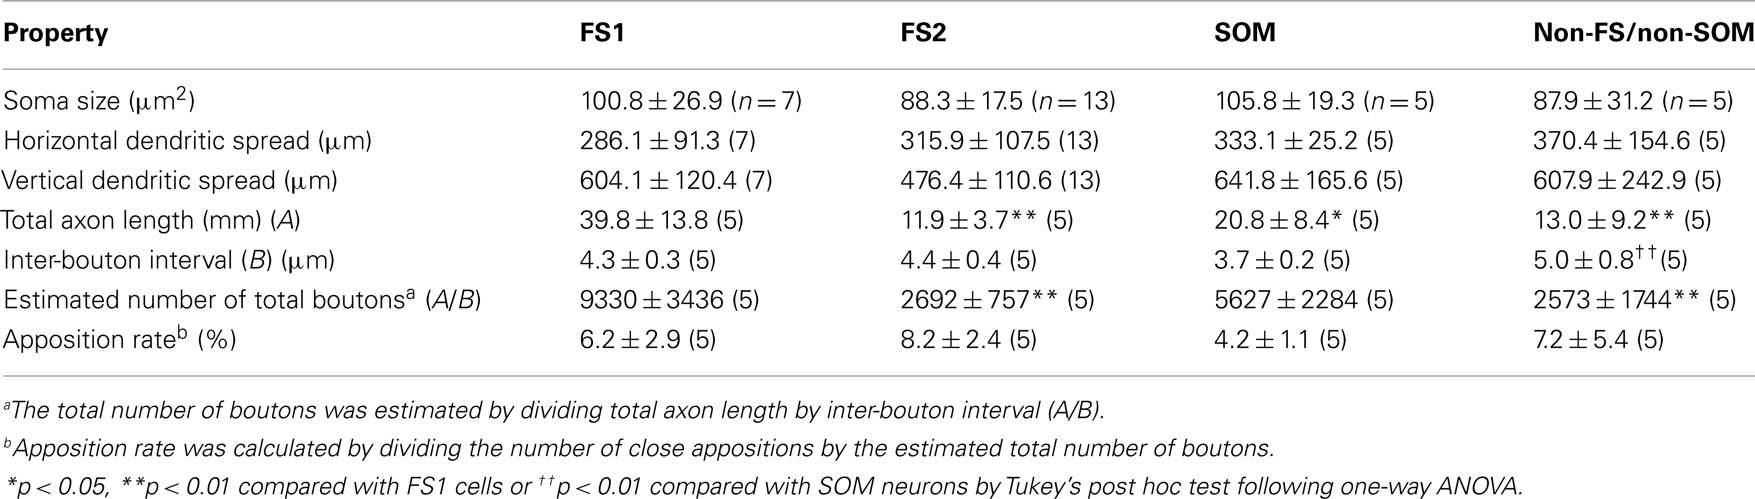
Table 4. Morphological properties of FS1, FS2, SOM, and Non-FS/non-SOM neurons.
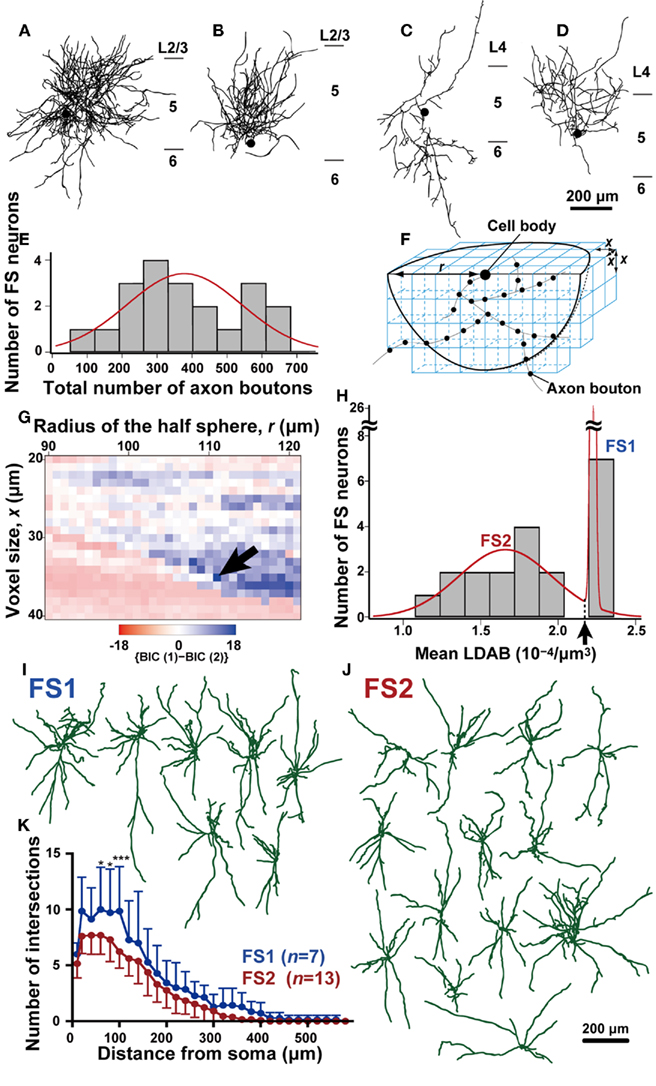
Figure 2. Morphological analysis of axons of L5 FS neurons. (A–D) Two-dimensional reconstructed FS neurons. Note that the axonal arborization of some FS neurons was much denser than that of other FS neurons. Black filled circles point to the cell bodies, and black lines are axons. (E) The frequency histogram of FS neurons against the total number of axon boutons in a half sphere as shown in (F) [center, cell body; radius, 111 μm in (F)]. This histogram was fitted better with a single Gaussian curve (red line) than with a mixture curve of two Gaussian distributions as judged by the BIC method. (F) The method for calculation of voxel-based local density of the axon boutons (LDAB). The hemisphere (radius = r) located under the intracellularly labeled cell body in the 500-μm-thick slice was divided into voxels with the size of x, and the mean LDAB was calculated as the average of axon bouton density of voxels that contained at least one bouton. (G) {BIC(1)-BIC(2)} values of fitting curves for the frequency histogram of L5 FS neurons against the mean LDAB. The {BIC(1)-BIC(2)} values was plotted with pseudocolor in a two-dimensional parameter space of radius r and voxel size x. The frequency histogram of FS neurons was fitted with a single Gaussian curve or with a mixture curve of two Gaussian distributions. Since smaller BIC indicates better fitting, blue points imply that the mixture curve of two Gaussian distributions better fits the histogram than a single curve. Arrow indicates the parameter point (r = 111 μm, x = 35 μm) resulting in the maximum {BIC(1)-BIC(2)}. (H) The histogram of FS neurons against mean LDAB at parameters of r = 111 μm and x = 35 μm. This histogram was fitted better by the mixture curve of two Gaussian distributions (red line) than the single or mixture curve of three. Arrow indicates the point that the probability densities of the two Gaussian distributions are identical (2.18 × 10⁻⁴/μm3). Thus, FS neurons with higher or lower mean LDAB than this point were defined as FS1 or FS2 neurons, respectively. (I,J) Reconstructed dendrites and somata of FS1 and FS2 neurons. (K) The Sholl analysis of FS1 (blue) and FS2 neurons (red). The data are shown as mean ± SD. The difference was statistically significant at distances 60–100 μm from the cell body (*p < 0.05, ***p < 0.001, Bonferroni multiple comparison test). Scale bar in (D) applies to (A–D), and that in (J) to (I,J).
Results
Classification of Interneurons in L5 of the Motor Areas by Electrical and Chemical Properties
Before examining the local connection of Venus-expressing interneurons to CSNs in VGAT/Venus transgenic rats, we examined the colocalization of GABA immunoreactivity and Venus fluorescence in L5 interneurons of motor areas. Venus-expressing neurons were observed in 434 of 441 GABA-immunopositive cells (98.4 ± 0.4%, n = 3 rats) and, inversely, all the Venus-expressing neurons were immunoreactive for GABA. We further examined PV (Figures 1A–A″) or SOM immunoreactivity (Figures 1B–B″) in Venus-expressing neurons. PV and SOM immunoreactivities were observed in 51.3 ± 0.04% (158 of 308) and 29.5 ± 0.1% (94 of 319) of Venus-positive neurons, respectively. Hence, these two interneuron subgroups accounted for approximately 80% of the L5 inhibitory interneurons in the motor areas, confirming the results of a previous study in the frontal cortex (Uematsu et al., 2008). The remaining 20% of interneurons were considered to belong to the other interneuron subgroup(s) as reported previously (Uematsu et al., 2008; Kubota et al., 2011).
We defined FS neurons as those satisfying the following electrical properties (McCormick et al., 1985): (1) a high-frequency spike train of at least 50 Hz was sustained when a strong depolarizing current pulse was injected; (2) the spike width at half amplitude from the resting potential was less than 0.76 ms at 30°C, which was estimated from 0.32 + 0.2 ms (mean + 2 SD) at 36°C by considering the temperature factor of spike width (Q10 = 0.525; Thompson et al., 1985); (3) fast after hyperpolarization (AHP) was larger than medium-range AHP; and (4) little or no spike frequency adaptation was observed. We obtained 32 FS neurons satisfying these criteria in L5 of the motor areas by intracellular recording and labeling with biocytin through patch pipettes under the fluorescent microscopy in the adult rat neocortex (Figures 1C,C′D). Some FS neurons were confirmed to be immunoreactive for PV as shown in Figures 1G,G′. We also found 18 non-FS neurons in L5 (Figures 1E,F), which we further divided into 11 SOM neurons and 7 non-FS/non-SOM neurons by the presence or absence of SOM immunoreactivity (Figures 1H,H′). In addition to the electrical properties that defined FS neurons, FS neurons were characterized with shorter membrane time constants and longer electrotonic lengths than those of SOM neurons (Table 2), as previously reported (Kawaguchi, 1993; Kawaguchi and Kubota, 1993).
Morphological Analysis of Axons of FS Neurons in L5 of the Motor Areas
Twenty of the 32 FS neurons were successfully reconstructed under the microscope attached with a camera lucida apparatus. As there was a large diversity in axonal density of these 20 FS neurons (Figures 2A–D), we examined whether or not FS neurons were classified into several subgroups by the distribution of their axon boutons in a three-dimensional space with the Neurolucida. Data were collected in the space deeper than the intracellularly labeled cell body, which was usually 50–70 μm from the slice cut surface, as the cut surface was damaged and unsuitable for the analysis. The frequency histogram of FS neurons against the total number of axon boutons in a hemisphere, the center of which was the cell body, was fitted with Gaussian distributions (Figure 2E). The histogram was best fitted with a single Gaussian distribution as judged by BIC (see Materials and Methods), where a smaller BIC value indicated better fitting.
Although this simple analysis failed to show diversity in FS neurons, we observed a large total number (≥540) of axon boutons in the analyzed hemisphere for some neurons, and a small difference between BIC values of the optimal single Gaussian distribution and the optimal mixture curve of Gaussian distributions (266.7 vs. 268.4, respectively). We therefore analyzed the plotted data by calculating the local density of the axon boutons (LDAB) in an unit voxel with the parameters of hemisphere radius r and voxel size x (Figure 2F). The mean LDAB was then obtained by averaging the LDAB in the voxels that contained at least one bouton. Thus, the volume containing no axon boutons was excluded from the averaging of LDAB. By varying x and r, the frequency histogram against the mean LDAB was fitted with the single Gaussian distribution and the mixture curve of two distributions, and the BIC value of the mixture curve of two distributions [BIC(2)] was compared with that of the single distribution [BIC(1)]. The BIC(2) of the mean LDAB was smaller than the BIC(1) in a wide range of r and x (blue region in Figure 2G). Figure 2H shows the histogram with the parameters (r = 111 μm, x = 35 μm) that resulted in the largest {BIC(1) − BIC(2)}. At the same parameters, the BIC(3) was larger than the BIC(2), indicating that the histogram was best fitted with the mixture curve of two Gaussian distributions. We thus divided the 20 FS neurons into two subgroups, 7 FS1 and 13 FS2 neurons, as defined by a mean LDAB higher and lower, respectively, than 2.17 × 10⁻⁴/μm3 (indicated by an arrow in Figure 2H). FS neurons of Figures 2A,B were classified as FS1 neurons (the value of mean LDAB: 2.23 and 2.22, respectively), while those of Figures 2C,D were classified as FS2 neurons (the value of mean LDAB: 1.08 and 1.42, respectively). Further examples are shown in Figure 4. Since the axonal arborization of FS neurons often contained a large volume without any axon bouton around their cell bodies, the total bouton number might not effectively represent their axonal density. This may account for the observed segregation of the FS subgroups in terms of the mean LDAB with appropriate parameters, but not in terms of the total bouton number.
When electrical properties were compared between FS1 and FS2 neurons, the input resistance of FS1 neurons was significantly smaller than that of FS2 neurons (p < 0.05, two-tailed Student’s t-test). In contrast, FS1 and FS2 neurons had similar kinetics of action potentials, maximum spike frequency, adaptation ratio and afterpotentials (Table 3). Morphologically, the size of FS1 cell bodies had a tendency to be larger than that of FS2 cell bodies, although the difference was not statistically significant (Table 4). The dendritic arborizations differed between FS1 and FS2 neurons (Figures 2I,J). Sholl analyses of the dendritic arbors revealed that, at distances of 60–100 μm from the cell body, the number of the dendritic intersections was significantly larger for FS1 neurons than for FS2 neurons (Figure 2K). These differences in electrical and morphological properties are considered to support the segregation of L5 FS neurons into the two subgroups, because these properties are independent of axonal arborization.
As expected from the classification using mean LDAB, the total axon length of FS1 neurons was significantly longer than that of FS2 neurons (Table 4). Because the inter-bouton intervals were virtually identical between FS1 and FS2 neurons (Table 4), it was likely that the differences in mean LDAB between the two subgroups mainly resulted from differences in the density of axon fibers.
Distribution of the Local Connection of GABAergic Interneurons to CSNs
To examine the inputs of GABAergic interneurons to CSNs, we retrogradely labeled CSNs by injection of TMR–DA dissolved in an acidic vehicle into the corticospinal tract (Kaneko et al., 1996). More than 45% of pyramidal neurons in L5 were immunopositive for TMR (Figure 3A). Since the largest percentage of retrogradely labeled neurons is approximately 50% in L5 of the motor areas after injection of potent retrograde tracers to the spinal cord (Miller, 1987; Kaneko et al., 2000; Cho et al., 2004b), the vast majority of CSNs were labeled retrogradely in our present study. The cell bodies and basal and apical dendritic shafts of CSNs were well visualized by this retrograde labeling method, whereas dendritic spines or intracortical axon collaterals of them were poorly labeled.
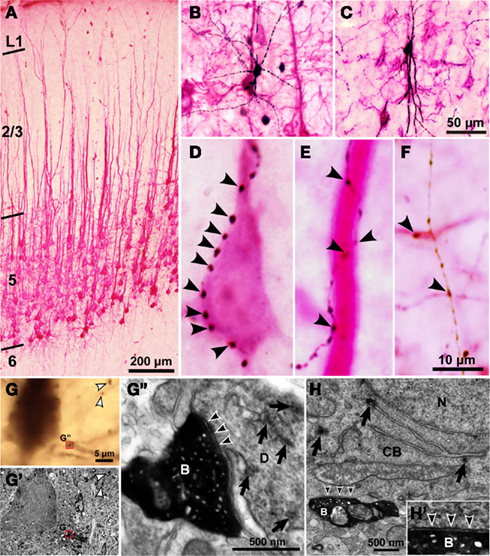
Figure 3. Light and electron microscopic findings of close appositions formed between CSN somata/dendrites and the axons of intracellularly labeled GABAergic interneurons. (A) Retrograde labeling of CSNs after injection into the corticospinal tract of TMR–DA dissolved in an acidic vehicle. Almost all the dendrites of CSNs were visualized red by immunostaining for TMR with the TAPM/p-cresol reaction. (B,C) Biocytin-labeled FS (B) and SOM neurons (C) were developed black by the ABC method with the DAB/nickel reaction. (D–F) Many axon boutons of intracellularly labeled interneurons were closely apposed to a cell body [arrowheads in (D)], a thick apical dendrite (E) and basal or oblique dendrites (F) of CSNs. (G–G′) Some close appositions found in the light microscope were examined electron-microscopically. TMR and biocytin were visualized brown and black with the DAB and DAB/nickel reactions, respectively. Many axosomatic and axodendritic appositions were found to form symmetrical synapses. Black arrowheads in (G″) indicate the symmetric synaptic contact that was made between the biocytin-labeled bouton (B) and the dendrite (D) with TMR immunoreactivity (arrows). White arrowheads in (G) and (G′) point to the boutons that did not contact with TMR-immunopositive structures. (H) Another example of symmetric synapses made on the cell body (CB) containing TMR immunoreactivity (arrows). N, cell nucleus. (H′) High-power view of the synaptic site. Scale bar in (C) applies in (B,C), that in (F) to (D–F), that in (G) to (G,G′), and that in (G″) to (G″,H).
Using cortical slices containing retrogradely labeled CSNs, the 32 FS cells, 11 SOM neurons, and 7 non-FS/non-SOM neurons were intracellularly recorded and stained by the whole-cell patch clamp method. On the basis of sufficient retrograde labeling of CSNs and successful intracellular staining of axon collaterals of recorded interneurons, five neurons each from FS1 (Figure 3B), FS2, SOM (Figure 3C) and non-FS/non-SOM neurons were selected for further morphological analyses. We observed many appositions between the axon boutons of intracellularly stained interneurons and the cell bodies/dendrites of TMR-immunopositive CSNs (arrows in Figures 3D–F). The pale staining of intracortical axons of CSNs helped us to identify the dendrites of CSNs; otherwise, the identification might be interfered by dense arborization of CSN axons. To examine how frequently the appositions formed synapses, we used electron microscopy to examine 25 appositions formed by the axons of FS neurons and 10 appositions by those of non-FS neurons in serial ultrathin sections (Figures 3G–H′). In the appositions examined, symmetric synapses were identified using the following criteria (Peters et al., 1991; Buhl et al., 1994; Ingham et al., 1998; Kubota and Kawaguchi, 2000): the accumulation of at least three synaptic vesicles at the presynaptic site, a widened synaptic cleft with parallel presynaptic and postsynaptic membranes, and a slightly thickened postsynaptic membrane. Of the 25 axodendritic and 10 axosomatic appositions examined, 18 (72%; 13 of 18 FS neurons and 5 of 7 non-FS neurons) and 8 (80%; 6 of 7 FS neurons and 2 of 3 non-FS neurons) were found to make symmetric synapses with TMR-immunopositive dendrites (Figures 3G–G″) and cell bodies (Figures 3H–H′), respectively. All of the other electron-microscopically examined boutons had postsynaptic targets other than TMR–DA immunopositive dendrites or cell bodies.
The distribution of appositions between axon boutons of each intracellularly labeled interneuron and retrogradely labeled CSN somata/dendrites is shown in Figures 4–6 after projection of the axons to frontal planes. Axon collaterals of FS1 and FS2 neurons were chiefly located in L5, but did not avert the adjacent layers (Figure 4). In contrast to FS neurons, SOM neurons had ascending axonal arbors up to L1 (Figure 5), while four of five non-FS/non-SOM neurons had descending axonal arbors into L6 (Figure 6). The inter-bouton interval of SOM neurons was smaller than those of the other three subgroups, which is consistent with previous findings (Karube et al., 2004; Table 4).
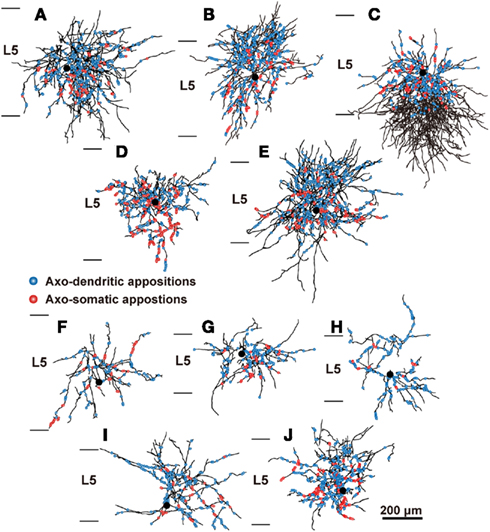
Figure 4. The distribution of axon boutons of FS neurons in close appositions to CSNs. Axons of L5 FS1 (A–E) and FS2 neurons (F–J) were reconstructed with camera lucida and projected to the frontal plane. Black lines and filled circles are axons and cell bodies of FS neurons, respectively. Blue and red circles indicate the axodendritic and axosomatic appositions, respectively. Scale bar in (J) applies to (A–J).

Figure 5. The distribution of axon boutons of SOM neurons in close appositions to CSNs. Axons and dendrites of L5 SOM neurons were reconstructed and projected to the frontal plane. Black lines and filled circles indicate the axons and cell bodies of SOM neurons, respectively. Blue and red circles indicate the axodendritic and axosomatic appositions, respectively. The dendrites were reconstructed dark green. Note that a considerable number of appositions were found in L1–3. Scale bar in (E) applies to (A–E).

Figure 6. The distribution of axon boutons of non-FS/non-SOM neurons in close appositions to CSNs. Axons and dendrites of L5 non-FS/non-SOM neurons were reconstructed and projected to the frontal plane. Black lines and filled circles indicate the axons and cell bodies of non-FS/non-SOM neurons, respectively. Blue and red circles indicate the axodendritic and axosomatic appositions, respectively. The dendrites were reconstructed dark green. Note that the appositions were much fewer than FS or SOM neurons. Scale bar in (E) applies to (A–E).
When FS1, FS2, SOM, and non-FS/non-SOM interneuron subgroups were analyzed, the largest average number of appositions to CSN somata/dendrites was observed with boutons sent by FS1 neurons (p < 0.01, Tukey’s post hoc test following one-way ANOVA; Figure 7A). The number of apposed boutons originating from single FS2 neurons or SOM neurons was approximately half of those arising from single FS1 neurons. The boutons apposed to CSN somata/dendrites were least frequently formed by non-FS/non-SOM neurons (Figure 7A).
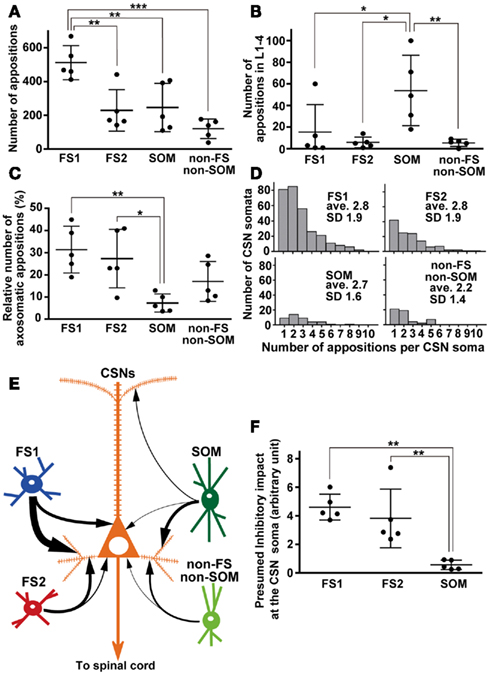
Figure 7. Quantitative comparisons of appositions formed between the axon boutons of L5 interneuron subgroups and somata/dendrites of CSNs. (A) Total number of appositions. The apposition number of single FS1 neurons was at least twofold more numerous than the other interneurons. (B) The number of appositions in L1–4. Of the four groups, SOM neurons most frequently formed appositions to the apical dendrites of CSNs. (C) Relative frequency of axosomatic appositions of FS1 and FS2 neurons were in the same range, and significantly higher than that of SOM neurons. (D) The histogram of number of appositions per CSN soma. In four interneuron subgroups, average of the number of appositions per CSN soma was 2.2—2.8. (E) Summary diagram of local inhibitory connections of single FS1, FS2, SOM, and non-FS/non-SOM neurons to CSNs. Arrows indicate the relative frequency of apposed boutons per neuron (for further detail, see text). (F) Presumed inhibitory impact at the CSN soma of each L5 interneuron subgroup. The impact was calculated as [the number of appositions made by an interneuron as shown in (A)] × [the relative frequency of the interneuron subgroup in L5] × [inhibitory current amplitude per apposition (Wang et al., 2002; Xiang et al., 2002; Silberberg and Markram, 2007)]. The presumed impacts of FS1 and FS2 neuron subgroups were comparable to each other, and much larger than that of SOM group. The presumed impact of non-FS/non-SOM neurons was not calculated, because no reliable data of inhibitory current amplitude is available for these neurons. All the data were shown as mean ± SD. *p < 0.05, **p < 0.01, ***p < 0.001 by Tukey’s post hoc multiple comparison test following one-way ANOVA.
When appositions to apical dendrites and their branches of CSNs were examined by counting appositions in L1–4, SOM neurons most frequently formed appositions to CSN dendrites of the four interneuron subgroups (p < 0.05, Tukey’s post hoc test following one-way ANOVA; Figure 7B). This is likely because SOM neurons contain many Martinotti cells, which are characterized by emitting axons ascending toward L1–3 (Kawaguchi and Kubota, 1997; Karube et al., 2004; Wang et al., 2004). In addition, relative frequency of appositions in L5 was higher (72.8 ± 19.7%) in SOM neurons than that in L1–4. Together with those of other interneurons (>95%), this result showed that numerically the strongest innervation of L5 interneurons was onto the cell bodies and proximal/basal dendrites.
Since previous studies have indicated that axons of FS neurons frequently target the cell bodies of pyramidal neurons (DeFelipe, 1997; Somogyi et al., 1998; Uematsu et al., 2008), we next compared how many axosomatic appositions to CSNs were formed between the four subgroups. Of appositions of FS1 and FS2 neurons, 31.5 and 27.3%, respectively, formed axosomatic contacts, whereas only 7.4% of appositions of SOM neurons made axosomatic contacts (Figure 7C, p < 0.05; Tukey’s post hoc test following one-way ANOVA). Although more than 68% of the appositions of FS neurons were formed on the dendrites of CSNs, these data clearly suggest that FS1 and FS2 neurons prefer CSN cell bodies as their targets for inhibition when compared to SOM neurons. The proportion of axosomatic appositions to the total appositions of non-FS/non-SOM neurons was between those of FS and SOM neurons (Figure 7C). Furthermore, we analyzed how many appositions were formed between individual interneurons and individual CSN somata (Figure 7D). The numbers of axosomatic appositions per CSN soma were similar between the four interneuron subtypes. On the contrary, the numbers of CSN somata per interneuron were different between the four subtypes. On average, single FS1 neurons innervated 59.0 ± 16.2 CSN somata and the other three subtypes sent their axon boutons to significantly fewer numbers of CSN somata (25.0 ± 18.1 for FS2, 8.4 ± 7.9 for SOM, and 10.6 ± 9.3 for non-FS/non-SOM, p < 0.01; Tukey’s post hoc test following one-way ANOVA). These results indicate that FS1 neurons innervate twice to seven times more CSN somata than the other interneuron subtypes with as many axosomatic appositions per CSN.
Discussion
In the present study, we morphologically examined connections of FS, SOM, and non-FS/non-SOM inhibitory interneurons to CSNs in L5 of adult rat motor areas by combining intracellular labeling with retrograde visualization of CSNs. L5 FS neurons were divided into two subgroups in terms of their axonal arborization, and single FS1 neurons with dense axonal arborization sent at least twofold greater number of inhibitory axon boutons to CSNs than the other three subgroups (Figure 7E). Axons of FS and non-FS/non-SOM neurons were predominantly located in L5 and innervated the basal dendrites and cell bodies of CSNs, whereas SOM neurons extended their axons to L1–4 and showed a tendency to target the basal and apical dendrites.
Two Types of L5 FS Neurons
The present results suggest that L5 FS neurons can be classified into two subgroups in terms of their axonal arborization. This classification was supported by the statistically significant differences in input resistance and dendritic arborization between the two subgroups. It is well established that FS neurons include basket cells and chandelier cells (Kawaguchi, 1995), and this heterogeneity might account for the presence of two types of L5 FS neurons. However, we found no chandelier cells in the 20 reconstructed FS neurons, and all the FS neurons showed a preference (approximately 30% of their appositions) for axosomatic appositions with CSNs. Besides chandelier cells, there is some evidence of a morphological heterogeneity of FS neurons. For example, Kawaguchi and Kondo (2002) described a wide-arbor FS neuron type with horizontal axon spread of 400–800 μm in addition to FS basket neurons. However, as we observed no FS1 or FS2 neurons with a horizontal axonal arborization of more than 400 μm, no FS neurons were classified as wide-arbor cells. Although the term “FS” was not used in the classification, Wang et al. (2002) divided non-accommodating basket cells, presumably including many FS neurons, into small, nest and large basket cells, and found a highly dense axonal plexus around the cell body of small and nest basket cells. Although these presumable FS neurons have been studied specifically in L2–4, small basket cells and nest ones in that study might correspond to the FS1 neurons in the present study.
Parvalbumin-producing cortical neurons, which are almost equal to FS neurons, exhibit heterogeneous chemical profiles. Approximately 40% of PV-immunopositive neurons were shown to express mRNA for cortistatin in the rat neocortex (de Lecea et al., 1997), although approximately one-third of cortistatin-expressing neurons showed SOM immunoreactivity. In addition, some PV-immunopositive neurons were reported to be immunoreactive for preprotachykinin A, a precursor of substance P, in the rat frontoparietal cortex (Kaneko et al., 1998), while 46% of PV-immunopositive neurons were immunopositive for substance P in L4–5 of the rat primary somatosensory cortex (Vruwink et al., 2001). Recently, in the rat primary somatosensory cortex, David et al. (2007) have found that the number of VIP-immunopositive boutons on somata/dendrites divides PV-immunopositive neurons into two subgroups. Further, the subgroup receiving dense VIP-immunopositive boutons have a smaller cell body and dendritic length than the other subgroup. Thus, the morphological subgroups of L5 FS neurons found in the present study may reflect chemical heterogeneity of PV-producing FS neurons in the rat neocortex.
Retrograde Labeling and Appositions
For a quantitative estimation, we counted appositions between the axon boutons of single GABAergic interneurons and the somata/dendrites of nearby CSNs. Using this technique there is potential for under- or over-estimation of the number of synaptic contacts. For example, the retrograde labeling of CSNs might be incomplete in terms both of labeling efficiency and visualization of dendritic spines, which could lead to a severe underestimation. However, for quantitative analyses, we selected the slices where more than 45% of L5 neurons were retrogradely labeled in the vicinity of intracellular labeled interneurons, as we reported previously (Kaneko et al., 2000; Cho et al., 2004b). Since the percentage of CSNs in L5 neurons of the motor areas was reported to be 50% at most (Miller, 1987; Kaneko et al., 2000; Cho et al., 2004b), the underestimation derived from the incomplete retrograde labeling efficiency was limited to less than 5%. Although injection of TMR–DA in an acidic vehicle into the corticospinal tracts and thalamic nuclei resulted in clear retrograde labeling of CSNs and corticothalamic neurons, the dendritic spines were not well visualized (Figures 3A–F; Kaneko et al., 1996, 2000; Cho et al., 2004b), which may be another cause of underestimation of numbers of synaptic contacts. However, since axodendritic synapses of inhibitory boutons are mostly found on dendritic shafts (DeFelipe, 1997; Somogyi et al., 1998), the detection of appositions for inhibitory connections would be unlikely to be dramatically affected by incomplete filling of CSN dendritic spines with TMR–DA. Thus, it is unlikely that the incompleteness of the present retrograde labeling method in terms both of labeling efficiency and of subcellular filling would have caused a severe underestimation of inhibitory inputs to CSNs.
One possible cause of overestimation is the fact that the number of appositions did not exactly indicate the number of synapses between intracellularly labeled axons and retrogradely labeled somata/dendrites. Using electron microscopy, we confirmed that 74% of the axodendritic and axosomatic appositions actually formed symmetric synapses. Therefore, the number of axodendritic and axosomatic appositions is considered to be indicative of the inhibitory synapses formed between inhibitory axons and CSN somata/dendrites. This percentage was higher than those in previous reports of axodendritic appositions between excitatory neurons (50–60%; Kaneko et al., 2000; Cho et al., 2004b). The inhibitory synapses were predominantly made on dendritic shafts or somata, whereas the excitatory synapses were largely on the dendritic spines (DeFelipe, 1997; Somogyi et al., 1998). As the present retrograde labeling method visualized CSNs well in their dendritic shafts, but poorly in their dendritic spines, the appositions in the present study might reflect synapse formation more efficiently than those in the previous studies on excitatory connections (Kaneko et al., 2000; Cho et al., 2004b).
Inhibitory Impact at the Soma of Interneuron Subgroups on CSNs
In a previous study of dual whole-cell recording, L5 FS neurons evoked large inhibitory postsynaptic currents (IPSCs; 208.3 ± 58.7 pA/pair) in L5 pyramidal neurons in the visual cortex of young rats (Xiang et al., 2002). By considering that the average number of appositions between axons of basket neurons (including many FS neurons) and dendrites of pyramidal neurons is 15.8/pair (Wang et al., 2002), the calculated inhibitory impact at the soma is to be 13.2 pA/apposition. On the other hand, LTS neurons, including many SOM neurons, evoke much smaller IPSCs (26.5 ± 1.6 pA/pair) in pyramidal neurons (Xiang et al., 2002). The average number of appositions from a Martinotti cell to a pyramidal neuron is 12 (Silberberg and Markram, 2007), and the inhibitory impact at the soma is therefore estimated at 2.2 pA/apposition. Using this estimation and the total number of interneuron subgroups in L5, we compared the inhibitory impacts at the soma of FS1, FS2, and SOM interneurons as a group (Figure 7F). Collectively, the L5 FS2 neuron group had a comparable inhibitory impact on CSNs at the soma with the FS1 group, whereas the SOM neuron group had much smaller impact on CSNs at the soma than the FS1 and FS2 groups. Although the firing rate of these interneurons should be considered in addition to the morphological parameters, this estimation indicates that FS neurons are much more important than SOM neurons in the local inhibition of CSNs.
Function of FS and SOM Neurons
In the motor areas, CSNs show strong disynaptic inhibition after the stimulation of motor thalamic nuclei (Futami et al., 1986). L4 FS neurons in the sensory cortical areas receive inputs from thalamocortical fibers and in turn, inhibit nearby pyramidal and spiny stellate neurons in L4, playing a key role in the feedforward inhibition of thalamocortical inputs (Keller and White, 1987; Staiger et al., 1996; Gibson et al., 1999; Porter et al., 2001; Sun et al., 2006). Thus, L5 FS neurons in motor areas would also be candidates for the feedforward inhibition. However, since the thalamocortical inputs mainly enter L3–4, but only partially enter L5 (Kuramoto et al., 2009, 2011), L5 FS neurons are unlikely to work as a main feedforward inhibitory mechanism for thalamic inputs. In contrast to thalamic inputs, L5 pyramidal neurons are known to send many axon collaterals to nearby FS neurons in L5 (Thomson et al., 1996; Silberberg and Markram, 2007; Otsuka and Kawaguchi, 2009). Furthermore, a recent study has shown that some L5 FS neurons are recruited during the execution of a self-paced task in motor areas of awake rats, and that the movement-related activity of FS neurons occurs in parallel with or slightly later than pyramidal neuron activity (Isomura et al., 2009). Thus, L5 FS neurons may serve as an element of a feedback or lateral inhibition mechanism for CSNs by increasing time and spatial resolution of motor executions.
The number of local connections of an SOM neuron to CSNs was approximately half of that of an FS1 neuron, and was comparable to that of an FS2 neuron (Figure 7E). Further, the SOM neuron group was estimated to have much less inhibitory impact on CSNs than FS groups (Figure 7F). However, considering the tendency for their apposed boutons to contact CSN apical dendrites, L5 SOM neurons might work as a principal component providing CSNs with inhibition of apical dendrites (Figure 7B). Most SOM neurons have ascending axonal arbors toward L1–3, showing characteristic of Martinotti cells (Goldberg et al., 2004), and the targets of the ascending axons are mainly apical dendrites of pyramidal neurons (DeFelipe, 1997; Somogyi et al., 1998). Since SOM neurons are known to be stimulated by nearby pyramidal neurons and inhibit surrounding pyramidal neurons (Kapfer et al., 2007; Silberberg and Markram, 2007; Berger et al., 2009), L5 SOM neurons might be stimulated by the axon collaterals of CSNs and produce an inhibitory effect on the apical dendrites of CSNs in a negative feedback manner. The synaptic inputs to apical dendrites of pyramidal neurons have been reported to modulate the gain of the pyramidal neuron response, resulting in a multiplicative control of the response (Larkum et al., 2004). In line with this, an in vivo study of awake rats suggested that Martinotti cells control the response gain of L5 pyramidal cells through inhibition of their apical dendrites (Murayama et al., 2009). Thus, our present results support that apical projection of SOM neurons negatively modulates these gain control mechanisms (Prescott and De Koninck, 2003).
In conclusion, we anatomically examined the connections from L5 inhibitory interneurons to CSNs, and found numerous differences in the connectivity among the interneuron subgroups. Future studies examining the firing dynamics of each subgroup of inhibitory interneurons and CSNs during motor execution in awake animals are required to further elucidate the neuronal mechanisms for motor execution.
Conflict of Interest Statement
The authors declare that the research was conducted in the absence of any commercial or financial relationships that could be construed as a potential conflict of interest.
Acknowledgments
We are grateful to Dr. A. Miyawaki for providing pCS2-Venus, Dr. Y. Kawaguchi for supplying with VGAT-Venus transgenic rats, Ms. K. Okamoto-Furuta and Mr. H. Kohda for technical assistance in electron microscopy and Dr. T. Tanaka for helpful discussion. This study was supported by Grants-in-Aid for Scientific Research from Ministry of Education, Culture, Sports, Science and Technology (22300113, 23115101, 23650175, and JST, CREST). Yasuyo H. Tanaka and Yasuhiro R. Tanaka was supported by Japan society for the Promotion of Science research fellowship for young scientists.
References
Anderson, C. T., Sheets, P. L., Kiritani, T., and Shepherd, G. M. (2010). Sublayer-specific microcircuits of corticospinal and corticostriatal neurons in motor cortex. Nat. Neurosci. 13, 739–744.
Bayraktar, T., Staiger, J. F., Acsady, L., Cozzari, C., Freund, T. F., and Zilles, K. (1997). Co-localization of vasoactive intestinal polypeptide, gamma-aminobutyric acid and choline acetyltransferase in neocortical interneurons of the adult rat. Brain Res. 757, 209–217.
Beloozerova, I. N., Sirota, M. G., and Swadlow, H. A. (2003). Activity of different classes of neurons of the motor cortex during locomotion. J. Neurosci. 23, 1087–1097.
Berger, T. K., Perin, R., Silberberg, G., and Markram, H. (2009). Frequency-dependent disynaptic inhibition in the pyramidal network: a ubiquitous pathway in the developing rat neocortex. J. Physiol. 587, 5411–5425.
Buhl, E. H., Halasy, K., and Somogyi, P. (1994). Diverse sources of hippocampal unitary inhibitory postsynaptic potentials and the number of synaptic release sites. Nature 368, 823–828.
Cauli, B., Audinat, E., Lambolez, B., Angulo, M. C., Ropert, N., Tsuzuki, K., Hestrin, S., and Rossier, J. (1997). Molecular and physiological diversity of cortical nonpyramidal cells. J. Neurosci. 17, 3894–3906.
Chedotal, A., Cozzari, C., Faure, M. P., Hartman, B. K., and Hamel, E. (1994). Distinct choline acetyltransferase (ChAT) and vasoactive intestinal polypeptide (VIP) bipolar neurons project to local blood vessels in the rat cerebral cortex. Brain Res. 646, 181–193.
Cho, R. H., Segawa, S., Mizuno, A., and Kaneko, T. (2004a). Intracellularly labeled pyramidal neurons in the cortical areas projecting to the spinal cord. I. Electrophysiological properties of pyramidal neurons. Neurosci. Res. 50, 381–394.
Cho, R. H., Segawa, S., Okamoto, K., Mizuno, A., and Kaneko, T. (2004b). Intracellularly labeled pyramidal neurons in the cortical areas projecting to the spinal cord. II. Intra- and juxta-columnar projection of pyramidal neurons to corticospinal neurons. Neurosci. Res. 50, 395–410.
David, C., Schleicher, A., Zuschratter, W., and Staiger, J. F. (2007). The innervation of parvalbumin-containing interneurons by VIP-immunopositive interneurons in the primary somatosensory cortex of the adult rat. Eur. J. Neurosci. 25, 2329–2340.
de Lecea, L., del Rio, J. A., Criado, J. R., Alcantara, S., Morales, M., Danielson, P. E., Henriksen, S. J., Soriano, E., and Sutcliffe, J. G. (1997). Cortistatin is expressed in a distinct subset of cortical interneurons. J. Neurosci. 17, 5868–5880.
DeFelipe, J. (1993). Neocortical neuronal diversity: chemical heterogeneity revealed by colocalization studies of classic neurotransmitters, neuropeptides, calcium-binding proteins, and cell surface molecules. Cereb. Cortex 3, 273–289.
DeFelipe, J. (1997). Types of neurons, synaptic connections and chemical characteristics of cells immunoreactive for calbindin-D28K, parvalbumin and calretinin in the neocortex. J. Chem. Neuroanat. 14, 1–19.
Donoghue, J. P., and Wise, S. P. (1982). The motor cortex of the rat: cytoarchitecture and microstimulation mapping. J. Comp. Neurol. 212, 76–88.
Eckenstein, F., and Baughman, R. W. (1984). Two types of cholinergic innervation in cortex, one co-localized with vasoactive intestinal polypeptide. Nature 309, 153–155.
Frost, S. B., Milliken, G. W., Plautz, E. J., Masterton, R. B., and Nudo, R. J. (2000). Somatosensory and motor representations in cerebral cortex of a primitive mammal (Monodelphis domestica): a window into the early evolution of sensorimotor cortex. J. Comp. Neurol. 421, 29–51.
Futami, T., Kano, M., Sento, S., and Shinoda, Y. (1986). Synaptic organization of the cerebello-thalamo-cerebral pathway in the cat. III. Cerebellar input to corticofugal neurons destined for different subcortical nuclei in areas 4 and 6. Neurosci. Res. 3, 321–344.
Galarreta, M., and Hestrin, S. (2002). Electrical and chemical synapses among parvalbumin fast-spiking GABAergic interneurons in adult mouse neocortex. Proc. Natl. Acad. Sci. U.S.A. 99, 12438–12443.
Georgopoulos, A. P., and Stefanis, C. N. (2007). Local shaping of function in the motor cortex: motor contrast, directional tuning. Brain Res. Rev. 55, 383–389.
Gibson, J. R., Beierlein, M., and Connors, B. W. (1999). Two networks of electrically coupled inhibitory neurons in neocortex. Nature 402, 75–79.
Goldberg, J. H., Lacefield, C. O., and Yuste, R. (2004). Global dendritic calcium spikes in mouse layer 5 low threshold spiking interneurones: implications for control of pyramidal cell bursting. J. Physiol. 558, 465–478.
Gonchar, Y., and Burkhalter, A. (1997). Three distinct families of GABAergic neurons in rat visual cortex. Cereb. Cortex 7, 347–358.
Gottlieb, J. P., and Keller, A. (1997). Intrinsic circuitry and physiological properties of pyramidal neurons in rat barrel cortex. Exp. Brain Res. 115, 47–60.
Hall, R. D., and Lindholm, E. P. (1974). Organization of motor and somatosensory neocortex in the albino rat. Brain Res. 6, 23–38.
Hioki, H., Fujiyama, F., Nakamura, K., Wu, S. X., Matsuda, W., and Kaneko, T. (2004). Chemically specific circuit composed of vesicular glutamate transporter 3- and preprotachykinin B-producing interneurons in the rat neocortex. Cereb. Cortex 14, 1266–1275.
Ingham, C. A., Hood, S. H., Taggart, P., and Arbuthnott, G. W. (1998). Plasticity of synapses in the rat neostriatum after unilateral lesion of the nigrostriatal dopaminergic pathway. J. Neurosci. 18, 4732–4743.
Isomura, Y., Harukuni, R., Takekawa, T., Aizawa, H., and Fukai, T. (2009). Microcircuitry coordination of cortical motor information in self-initiation of voluntary movements. Nat. Neurosci. 12, 1586–1593.
Kaneko, T., Caria, M. A., and Asanuma, H. (1994). Information processing within the motor cortex. II. Intracortical connections between neurons receiving somatosensory cortical input and motor output neurons of the cortex. J. Comp. Neurol. 345, 172–184.
Kaneko, T., Cho, R., Li, Y., Nomura, S., and Mizuno, N. (2000). Predominant information transfer from layer III pyramidal neurons to corticospinal neurons. J. Comp. Neurol. 423, 52–65.
Kaneko, T., Kang, Y., and Mizuno, N. (1995). Glutaminase-positive and glutaminase-negative pyramidal cells in layer VI of the primary motor and somatosensory cortices: a combined analysis by intracellular staining and immunocytochemistry in the rat. J. Neurosci. 15, 8362–8377.
Kaneko, T., Murashima, M., Lee, T., and Mizuno, N. (1998). Characterization of neocortical non-pyramidal neurons expressing preprotachykinins A and B: a double immunofluorescence study in the rat. Neuroscience 86, 765–781.
Kaneko, T., Saeki, K., Lee, T., and Mizuno, N. (1996). Improved retrograde axonal transport and subsequent visualization of tetramethylrhodamine (TMR)-dextran amine by means of an acidic injection vehicle and antibodies against TMR. J. Neurosci. Methods 65, 157–165.
Kapfer, C., Glickfeld, L. L., Atallah, B. V., and Scanziani, M. (2007). Supralinear increase of recurrent inhibition during sparse activity in the somatosensory cortex. Nat. Neurosci. 10, 743–753.
Karube, F., Kubota, Y., and Kawaguchi, Y. (2004). Axon branching and synaptic bouton phenotypes in GABAergic nonpyramidal cell subtypes. J. Neurosci. 24, 2853–2865.
Katzel, D., Zemelman, B. V., Buetfering, C., Wolfel, M., and Miesenbock, G. (2011). The columnar and laminar organization of inhibitory connections to neocortical excitatory cells. Nat. Neurosci. 14, 100–107.
Kawaguchi, Y. (1993). Groupings of nonpyramidal and pyramidal cells with specific physiological and morphological characteristics in rat frontal cortex. J. Neurophysiol. 69, 416–431.
Kawaguchi, Y. (1995). Physiological subgroups of nonpyramidal cells with specific morphological characteristics in layer II/III of rat frontal cortex. J. Neurosci. 15, 2638–2655.
Kawaguchi, Y., and Kondo, S. (2002). Parvalbumin, somatostatin and cholecystokinin as chemical markers for specific GABAergic interneuron types in the rat frontal cortex. J. Neurocytol. 31, 277–287.
Kawaguchi, Y., and Kubota, Y. (1993). Correlation of physiological subgroupings of nonpyramidal cells with parvalbumin- and calbindin D28k-immunoreactive neurons in layer V of rat frontal cortex. J. Neurophysiol. 70, 387–396.
Kawaguchi, Y., and Kubota, Y. (1996). Physiological and morphological identification of somatostatin- or vasoactive intestinal polypeptide-containing cells among GABAergic cell subtypes in rat frontal cortex. J. Neurosci. 16, 2701–2715.
Kawaguchi, Y., and Kubota, Y. (1997). GABAergic cell subtypes and their synaptic connections in rat frontal cortex. Cereb. Cortex 7, 476–486.
Keller, A., and White, E. L. (1987). Synaptic organization of GABAergic neurons in the mouse SmI cortex. J. Comp. Neurol. 262, 1–12.
Killackey, H. P., Koralek, K. A., Chiaia, N. L., and Rhodes, R. W. (1989). Laminar and areal differences in the origin of the subcortical projection neurons of the rat somatosensory cortex. J. Comp. Neurol. 282, 428–445.
Kosaka, T., Heizmann, C. W., Tateishi, K., Hamaoka, Y., and Hama, K. (1987). An aspect of the organizational principle of the gamma-aminobutyricacidergic system in the cerebral cortex. Brain Res. 409, 403–408.
Kubota, Y., and Kawaguchi, Y. (2000). Dependence of GABAergic synaptic areas on the interneuron type and target size. J. Neurosci. 20, 375–386.
Kubota, Y., Shigematsu, N., Karube, F., Sekigawa, A., Kato, S., Yamaguchi, N., Hirai, Y., Morishima, M., and Kawaguchi, Y. (2011). Selective coexpression of multiple chemical markers defines discrete populations of neocortical GABAergic neurons. Cereb. Cortex 21, 1803–1817.
Kuramoto, E., Fujiyama, F., Nakamura, K. C., Tanaka, Y., Hioki, H., and Kaneko, T. (2011). Complementary distribution of glutamatergic cerebellar and GABAergic basal ganglia afferents to the rat motor thalamic nuclei. Eur. J. Neurosci. 33, 95–109.
Kuramoto, E., Furuta, T., Nakamura, K. C., Unzai, T., Hioki, H., and Kaneko, T. (2009). Two types of thalamocortical projections from the motor thalamic nuclei of the rat: a single neuron-tracing study using viral vectors. Cereb. Cortex 19, 2065–2077.
Larkum, M. E., Senn, W., and Luscher, H. R. (2004). Top-down dendritic input increases the gain of layer 5 pyramidal neurons. Cereb. Cortex 14, 1059–1070.
Leong, S. K. (1983). Localizing the corticospinal neurons in neonatal, developing and mature albino rat. Brain Res. 265, 1–9.
Ma, Y., Hioki, H., Konno, M., Pan, S., Nakamura, H., Nakamura, K. C., Furuta, T., Li, J. L., and Kaneko, T. (2011). Expression of gap junction protein connexin 36 in multiple subtypes of GABAergic neurons in adult rat somatosensory cortex. Cereb. Cortex. doi:10.1093/cercor/bhr051
Markram, H., Toledo-Rodriguez, M., Wang, Y., Gupta, A., Silberberg, G., and Wu, C. (2004). Interneurons of the neocortical inhibitory system. Nat. Rev. Neurosci. 5, 793–807.
Matsumura, M., Sawaguchi, T., and Kubota, K. (1992). GABAergic inhibition of neuronal activity in the primate motor and premotor cortex during voluntary movement. J. Neurophysiol. 68, 692–702.
Matsumura, M., Sawaguchi, T., Oishi, T., Ueki, K., and Kubota, K. (1991). Behavioral deficits induced by local injection of bicuculline and muscimol into the primate motor and premotor cortex. J. Neurophysiol. 65, 1542–1553.
McCormick, D. A., Connors, B. W., Lighthall, J. W., and Prince, D. A. (1985). Comparative electrophysiology of pyramidal and sparsely spiny stellate neurons of the neocortex. J. Neurophysiol. 54, 782–806.
Merchant, H., Naselaris, T., and Georgopoulos, A. P. (2008). Dynamic sculpting of directional tuning in the primate motor cortex during three-dimensional reaching. J. Neurosci. 28, 9164–9172.
Miller, M. W. (1987). The origin of corticospinal projection neurons in rat. Exp. Brain Res. 67, 339–351.
Murayama, M., Perez-Garci, E., Nevian, T., Bock, T., Senn, W., and Larkum, M. E. (2009). Dendritic encoding of sensory stimuli controlled by deep cortical interneurons. Nature 457, 1137–1141.
Otsuka, T., and Kawaguchi, Y. (2009). Cortical inhibitory cell types differentially form intralaminar and interlaminarsubnetworks with excitatory neurons. J. Neurosci. 29, 10533–10540.
Peters, A., Palay, S. L., and Webster, H. D. (1991). “Synapses” in the Fine Structure of the Nervous System, Neurons and their Supporting Cells, 3rd Edn. New York: Oxford University Press, 138–211.
Porter, J. T., Johnson, C. K., and Agmon, A. (2001). Diverse types of interneurons generate thalamus-evoked feedforward inhibition in the mouse barrel cortex. J. Neurosci. 21, 2699–2710.
Prescott, S. A., and De Koninck, Y. (2003). Gain control of firing rate by shunting inhibition: roles of synaptic noise and dendritic saturation. Proc. Natl. Acad. Sci. U.S.A. 100, 2076–2081.
Rogers, J. H. (1992). Immunohistochemical markers in rat cortex: co-localization of calretinin and calbindin-D28k with neuropeptides and GABA. Brain Res. 587, 147–157.
Rudy, B., Fishell, G., Lee, S., and Hjerling-Leffler, J. (2011). Three groups of interneurons account for nearly 100% of neocortical GABAergic neurons. Dev. Neurobiol. 71, 45–61.
Sanderson, K. J., Welker, W., and Shambes, G. M. (1984). Reevaluation of motor cortex and of sensorimotor overlap in cerebral cortex of albino rats. Brain Res. 292, 251–260.
Schwarz, C., and Schmitz, Y. (1997). Projection from the cerebellar lateral nucleus to precerebellar nuclei in the mossy fiber pathway is glutamatergic: a study combining anterograde tracing with immunogold labeling in the rat. J. Comp. Neurol. 381, 320–334.
Silberberg, G., and Markram, H. (2007). Disynaptic inhibition between neocortical pyramidal cells mediated by Martinotti cells. Neuron 53, 735–746.
Somogyi, P., Tamas, G., Lujan, R., and Buhl, E. H. (1998). Salient features of synaptic organisation in the cerebral cortex. Brain Res. Brain Res. Rev. 26, 113–135.
Staiger, J. F., Zilles, K., and Freund, T. F. (1996). Distribution of GABAergic elements postsynaptic to ventroposteromedial thalamic projections in layer IV of rat barrel cortex. Eur. J. Neurosci. 8, 2273–2285.
Sun, Q. Q., Huguenard, J. R., and Prince, D. A. (2006). Barrel cortex microcircuits: thalamocortical feedforward inhibition in spiny stellate cells is mediated by a small number of fast-spiking interneurons. J. Neurosci. 26, 1219–1230.
Tanaka, Y., Tanaka, Y., Furuta, T., Yanagawa, Y., and Kaneko, T. (2008). The effects of cutting solutions on the viability of GABAergic interneurons in cerebral cortical slices of adult mice. J. Neurosci. Methods 171, 118–125.
Thompson, S. M., Masukawa, L. M., and Prince, D. A. (1985). Temperature dependence of intrinsic membrane properties and synaptic potentials in hippocampal CA1 neurons in vitro. J. Neurosci. 5, 817–824.
Thomson, A. M., West, D. C., Hahn, J., and Deuchars, J. (1996). Single axon IPSPs elicited in pyramidal cells by three classes of interneurones in slices of rat neocortex. J. Physiol. 496, 81–102.
Uematsu, M., Hirai, Y., Karube, F., Ebihara, S., Kato, M., Abe, K., Obata, K., Yoshida, S., Hirabayashi, M., Yanagawa, Y., and Kawaguchi, Y. (2008). Quantitative chemical composition of cortical GABAergic neurons revealed in transgenic venus-expressing rats. Cereb. Cortex 18, 315–330.
Vruwink, M., Schmidt, H. H., Weinberg, R. J., and Burette, A. (2001). Substance P and nitric oxide signaling in cerebral cortex: anatomical evidence for reciprocal signaling between two classes of interneurons. J. Comp. Neurol. 441, 288–301.
Wang, Y., Gupta, A., Toledo-Rodriguez, M., Wu, C. Z., and Markram, H. (2002). Anatomical, physiological, molecular and circuit properties of nest basket cells in the developing somatosensory cortex. Cereb. Cortex 12, 395–410.
Wang, Y., Toledo-Rodriguez, M., Gupta, A., Wu, C., Silberberg, G., Luo, J., and Markram, H. (2004). Anatomical, physiological and molecular properties of Martinotti cells in the somatosensory cortex of the juvenile rat. J. Physiol. 561, 65–90.
Wise, S. P., and Jones, E. G. (1977). Cells of origin and terminal distribution of descending projections of the rat somatic sensory cortex. J. Comp. Neurol. 175, 129–157.
Keywords: FS neuron, corticospinal neuron, somatostatin-immunopositive neuron, motor areas, apposition, inhibitory, synapse, morphology
Citation: Tanaka YH, Tanaka YR, Fujiyama F, Furuta T, Yanagawa Y and Kaneko T (2011) Local connections of layer 5 GABAergic interneurons to corticospinal neurons. Front. Neural Circuits 5:12. doi: 10.3389/fncir.2011.00012
Received: 30 July 2011; Paper pending published: 23 August 2011;
Accepted: 07 September 2011; Published online: 29 September 2011.
Edited by:
Hollis Cline, The Scripps Research Institute, USAReviewed by:
Gordon M. G. Shepherd, Northwestern University, USAMichael Nitabach, Yale University School of Medicine, USA
Copyright: © 2011 Tanaka, Tanaka, Fujiyama, Furuta, Yanagawa and Kaneko. This is an open-access article subject to a non-exclusive license between the authors and Frontiers Media SA, which permits use, distribution and reproduction in other forums, provided the original authors and source are credited and other Frontiers conditions are complied with.
*Correspondence: Takeshi Kaneko, Department of Morphological Brain Science, Graduate School of Medicine, Kyoto University, Konoe-cho, Yoshida, Sakyo-ku, Kyoto 606-8501, Japan. e-mail: kaneko@mbs.med.kyoto-u.ac.jp