Firebrand Generation Rates at the Source for Trees and a Shrub
 Sampath Adusumilli
 James E. Chaplen
 David L. Blunck
- School of Mechanical, Industrial and Manufacturing Engineering, Oregon State University, Corvallis, OR, United States
Source terms of the number of firebrands released as trees/shrubs torch are essential for helping to more accurately implement detailed physics-based models of wildfire propagation, particularly when torching occurs. A key challenge in estimating these source terms is the difficulty in measuring firebrand generation rates from the source. Typical studies have reported generation characteristics (firebrands/m2), but enumeration of the total number of firebrands released has remained elusive. Recently, a fire-resistant fabric was successfully employed to quantify “hot” firebrands (i.e., can potentially lead to further fire spread) generated during tree-scale burns. In this paper, a total of 71 tree/shrubs were burned to quantify hot firebrand production statistics for Douglas-fir, ponderosa pine, and sagebrush. A network of 65 fire-resistant fabric stations were deployed during the burns to measure the “hot” firebrands that are released. These stations are placed strategically at several radii and angles in the prominent wind direction. Using the number of firebrands determined from the fabric, a first-order extrapolation method was developed and evaluated to estimate the source terms (i.e., total number of hot firebrands released). Variation in the firebrand production with the height of the trees and for three species is reported. The total number of hot firebrands produced typically increased with the height of the tree/shrub burned as expected. The specific hot firebrand production (firebrands produced per kg dry mass burned) is exponentially dependent on the moisture content of the tree and had an inconclusive correlation with the height of the trees. Overall, for trees of comparable moisture content, sagebrush produced higher specific hot firebrands when compared to ponderosa pine and Douglas-fir species.
Introduction
A major cause of the spread of wildfires into the wildland urban interface (WUI) are spot fires caused by firebrands. Firebrands are pieces of burning material (e.g., cones, branches, structural components) that are released from the main fire. One study estimated that, in some situations, 75% of structures burn because of exposure to firebrands and radiative heat transfer (Fernandez-Pello, 2017). The threat of fires caused by firebrands can be a particularly challenging because firebrands can be transported a long distance (e.g., kilometers), thus bypassing barriers that may stop the main fire front (e.g., rivers, roads, and green spaces).
Four processes lead to spot fires: generation of firebrands, transport and deposition of firebrands, and subsequent ignition of recipient fuel bed (Manzello et al., 2020). Understanding characteristics associated with each of these processes is important for developing strategies or tools to help reduce the risk of spot fires, near the WUI. Knowledge gained regarding the processes leading to spot fires can be used to improve reduced-order and detailed physics models [e.g., FDS, WFDS, and FIRETEC (Linn et al., 2002; Jolly et al., 2016; Anand et al., 2017; Shotorban et al., 2018)]. In turn these models can be applied to better understand how to apply resources (Monedero et al., 2019), or to develop codes and standards which reduce the risk of spread of fire to the WUI.
Several studies, across multiple-scales have considered firebrand generation characteristics for building materials (Suzuki et al., 2012, 2013, 2014, 2015; Suzuki and Manzello, 2016; Hedayati, 2018) and vegetation (Manzello et al., 2006, 2007a, 2009; Benkoussas et al., 2007; Filkov et al., 2017) as part of efforts to understand processes that lead to spot fires. For example, Thomas et al. (2017) measured the time-resolved flux of firebrands onto pans of water during prescribed burns. The higher the heat release the greater the firebrand flux, in general. Studies by Manzello et al. (2007a) and Hudson et al. (2020) have shown sensitivities of firebrand characteristics to the species of tree or burning conditions. The firebrands with the largest mass from vegetation typically came from larger trees, showing a sensitivity of generation characteristics to the size and/or age of the tree (Manzello et al., 2007a). In related studies, the sizes of firebrands generated have been reported for two species of trees with similar heights. Korean pine provided firebrands that were shorter, but with a larger diameter than corresponding firebrands generated from Douglas-fir trees with similar heights (Manzello et al., 2007a,b).
Additionally, differentiating between firebrands which can cause ignition (i.e., have sufficient temperature and mass) and those which do not has been a problem of interest. The water tray method provides an estimation of the total number of firebrands, both those which can and cannot lead to spot fires. Several researchers have tried to quantify the number of “hot” firebrands that are produced from a fire. To this end, researchers have used the sizes and number of holes in trampoline mats near fires to evaluate the characteristics of “hot” firebrands (Rissel and Ridenour, 2013; Manzello and Foote, 2014). Recently, “hot” firebrands produced during tree-scale burns were estimated using char marks on a fire-resistant fabric and compared with the total number of firebrands produced using the water tray method (Hudson et al., 2020). A characterization of the fire-resistant fabric carried out by Adusumilli et al. (2020) indicated that the firebrands leaving char marks on the fabric would have a temperature of at least 300°C. The characteristics of the “hot” firebrands were found to be quite different compared to the total number of firebrands collected during experiments (Manzello et al., 2007a, 2020; Hudson et al., 2020). Since “hot” firebrands have a higher probability of causing spot fires, enumerating the production of these specific firebrands is of high priority.
One of the challenges to the fire community has been understanding how to link results from studies of firebrand generation characteristics, like those described above, to support models and/or fire decision makers. For example, firebrand generation characteristics have been measured based on firebrand fluxes or distributions at particular locations (Filkov et al., 2017; Thomas et al., 2017; Hudson et al., 2020). Yet a method for applying measured firebrand fluxes as boundary conditions in models is not clear, nor is it clear how the knowledge about the number of firebrands generated can be used to inform fire responders. To aid in such understanding, measurements or estimates of the total number of firebrands released are needed.
With this background, the objectives of this work are 3-fold. First, establish and evaluate a methodology for estimating the total number of “hot” firebrands that are released as trees/shrubs are burned. In turn, scale the results to provide specific source terms (i.e., “hot” firebrands released/kg of fuel consumed) that could potentially be used as source terms in models (Linn et al., 2002; Jolly et al., 2016; Anand et al., 2017; Shotorban et al., 2018). Second, apply this methodology to characterize how firebrand generation characteristics change as different species of trees burn. Third, assess the limitations in scaling of the source terms as the size of the tree/fuel are varied. By addressing these objectives, the following specific contributions can be derived of this work.
1) Source terms for firebrand generation (i.e., firebrands produced/kg-fuel consumed) can be used in both reduced-order and detailed physics based models examining wildfire propagation.
2) Sensitivities of measured source terms to fuel conditions (e.g., size of trees) are assessed. This information can be used to better understand how measured source terms are expected to scale as the number and size of trees are varied.
3) Establishing a methodology that can be used by the wider research community to further identity source terms for varying fuels and fire conditions relevant to wildfires and WUI communities.
To help achieve these objectives a total of 71 trees/shrubs were burned to understand “hot” firebrand production rates for 3 species of trees/shrubs. To measure the hot firebrand generation rates, a network of 65 fire-resistant fabric stations were deployed during the burns. These stations are placed strategically at several radii and angles in the prominent wind direction. Hot firebrands leave char marks on the fabric, as discussed later. Prior work has shown notable differences in the total number of firebrands released and hot firebrands (Hudson et al., 2020); only the results for hot firebrands are reported because of their potential to cause ignition during fires. For the remainder of this paper “hot” firebrands are described as firebrands.
Approach
The approach to quantify the firebrands generated from tree-scale burns expands upon the approach detailed by Hudson et al. (2020). In this effort, tree-scale burns of three species (Douglas-fir, ponderosa pine and sagebrush) of varying heights between 1.4 and 6.2 m were conducted. The measurement approach along with details regarding processes used to characterize the experiment (i.e., moisture content, wind speed measurements etc.) are provided in this section.
Experimental Arrangement
Figure 1A shows the experimental arrangement, with a 6 m tall Douglas-fir tree being torched. The torching of the tree is achieved by lighting a 10 kg wheat straw bed at one end and allowing the flames to progress toward the tree. The typical dimensions of the fuel bed were on average 2.2 m in length, 1.3 m in width, and 0.3 m in depth. The straw bed was arranged at an inclination to provide a ladder fuel effect resulting in taller flames that could better ignite the trees. In the foreground of Figure 1A several fire-resistant fabric stations can be observed. The fire-resistant fabrics were arranged in a semi-circle format in the prominent wind-direction. The fabric was used to collect firebrands; the resulting char marks were used to quantify the number of hot firebrands. Prior work suggests that only firebrands with surface temperatures >300°C leave char marks (Adusumilli et al., 2020). Figure 1B shows a map of the locations of the fabric. Each firebrand collection station consisted of a sheet of fabric, typically 40 by 41 cm squares, mounted to a wooden frame. The stations were in five concentric semicircle bands. The first band contained five stations positioned 45° apart along a 1.5 m radius arc. The second contained nine stations positioned 22.5° apart along a 3 m radius arc. The third, fourth, and fifth bands each contained seventeen stations positioned 11.25° apart and had radii of 4.5, 6, and 7.5 m, respectively. A key improvement of this work compared to the work of Hudson et al. (2020) was the expansion of the number of fabric stations from 15 to 65. The number of fabric stations at a radius was increased as the distance from the tree was increased in an effort better to capture the spread of the firebrands. All firebrands generated from a burn are assumed to fall in this semicircular region; while some firebrands might fall beyond this region their number is considered minimal based on where firebrands are observed (i.e., relatively few along the edges). The fabric was collected as needed after the completion of a burn and subsequently analyzed, as discussed later. Wind speeds and directions were recorded using an anemometer (OnSet S-WSA-M003) and are reported.
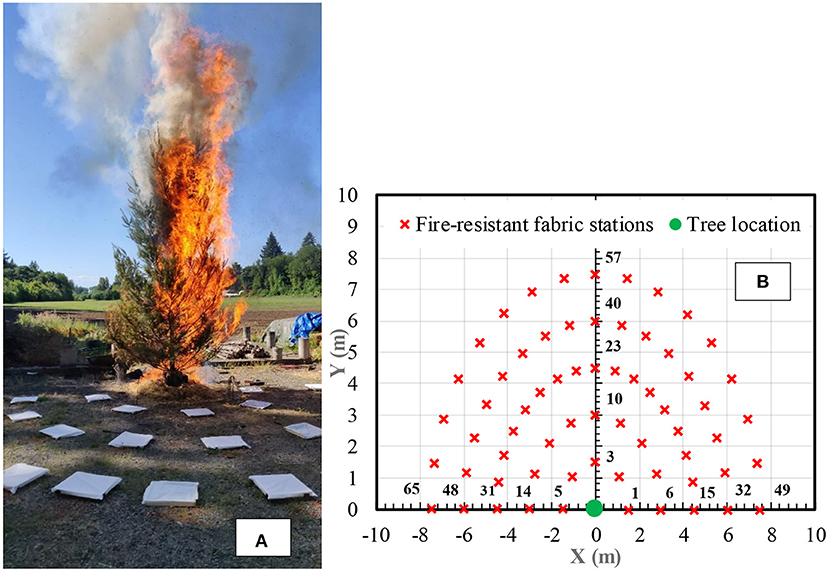
Figure 1. (A) Torching ~6 m tall Douglas-fir tree (details about this particular burn are given in Table A.1, test number 17) with fire-resistant fabric stations setup to collect “hot” firebrands. (B) Location map of the 65 fire-resistant fabric stations, with the tree location at (0, 0). Shown are selected station numbers to indicate the numbering scheme.
Typically, seven or more trees were burned for each species at a particular height. Burning of the trees was influenced by the flammability of the tree, the spacing of the branches, and the proximity of the flames from the ladder fuel to the foliage. As a result of all these factors, some of the trees torched completely while others did not. Similar variations in the torching characteristics are expected during wildfires. Variability in the burning of the trees/shrubs is considered by normalizing the results by the mass of fuel consumed by the fires. The tree's height along the trunk, maximum width, and diameter at breast height (DBH measured at 1.4 m from base) were measured and reported. As sagebrush lacked a defined trunk, the maximum discernable height is measured rather than height along the trunk. For similar reasons the DBH for these trees was also not measured. The tree's pre-burn and post-burn mass was measured using a scale. Average measurements characterizing the trees/shrub are provided in Tables 1–3 for Douglas-fir, ponderosa pine, and sagebrush (respectively). The ladder fuel was burned three times without a tree to evaluate the char mark production from the ladder fuel. No char marks were observed on the fire-resistant fabric from these tests, indicating that all char marks observed during tree burns come from the firebrands produced by the trees.
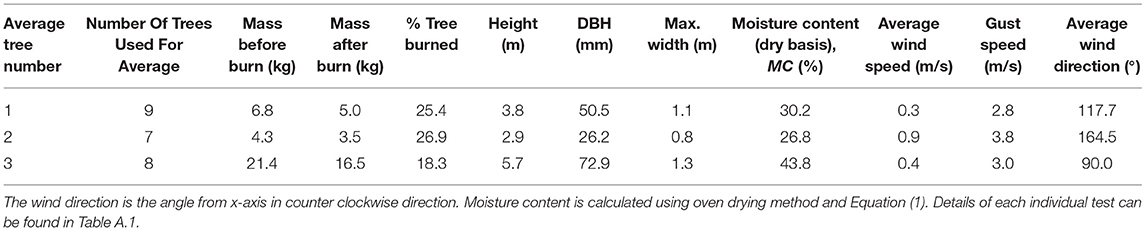
Table 1. Measurements corresponding to representative average trees for Douglas-fir species.
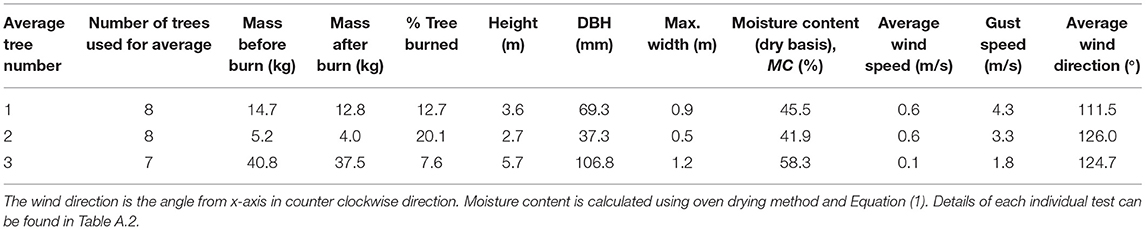
Table 2. Measurements corresponding to representative average trees for ponderosa pine species.
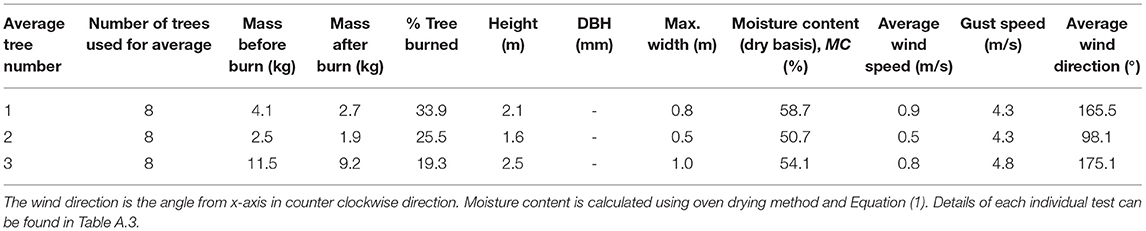
Table 3. Measurements corresponding to representative average trees for sagebrush species.
Data Collection and Analysis
The firebrand collection stations were inspected and potentially replaced following each test. Initially, a station was replaced after a burn if char marks were present. In the second phase of testing, only stations with sufficient char marks to warrant concern about overlap between marks were removed. Pictures of the sheets of fabric were collected using a Canon EOS Rebel T3i camera (18-megapixel). The images were subsequently used to determine the number of firebrands. An exposure time of 0.008 s and an 18–55 mm lens were used. A studio lighting arrangement was used to ensure that the fabric was illuminated uniformly and that the contrast between the fabric and char marks can be clearly observed. Figure 2A shows the example of a fire-resistant fabric with char marks from firebrands. The spatial resolution for these images was 0.016 cm/pixel.
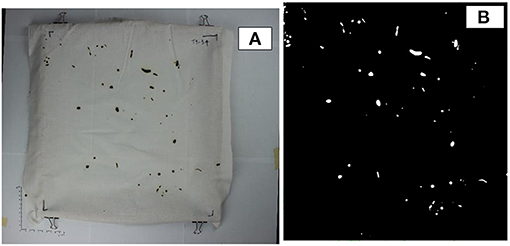
Figure 2. (A) Raw image of a fire-resistant fabric showing char marks captured from a tree burn. (B) Corresponding binarized image to enumerate the number of char marks on the fabric.
A computer algorithm written in MATLAB R2019b (MathWorks Inc., Natick, MA) (The MathWorks Inc., 2018) was used to process the images and extract firebrand characteristics. First, the zone outside the data collection region was cropped out and converted into a separate greyscale image. The greyscale image was converted to a binary image with the imbinarize function at a threshold of 0.4. This designated sufficiently dark pixels (i.e., the char marks) as one and left the rest as zero (example shown Figure 2B). Finally, the script used the distance to pixel ratio to measure the cropped image area and counted the number of char marks. Once the number of char marks was counted, the char mark area density was determined as the number of char marks divided by the area of the fabric. This process was repeated for fabric collected at every station, and an example representation of the processed data is shown in Figure 3. The data shown here is for a single tree burn; note that firebrands do not reach all the stations due to the transport characteristics. The number of firebrands at locations near the tree are significantly higher than the firebrands at locations farthest from the tree, consistent with the work by Hudson et al. (2020).
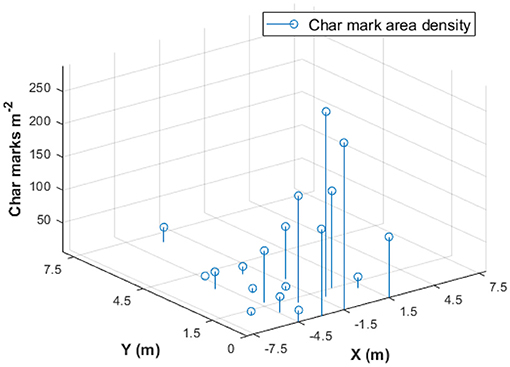
Figure 3. An example of char mark area density variation with the location of fabric stations where char marks were detected for a 4.4 m tall Douglas-fir tree.
Fabric Characterization
To characterize the temperature response of the fire-resistant fabric used in these experiments, the experimental approach described by Adusumilli et al. (2020) was employed. Briefly, a cartridge heater at a known temperature was used to form a char mark on a sample of the fire-resistant fabric. The heater and fabric were in contact for several durations of time. Once the char marks were formed, the samples were imaged and analyzed using the same algorithm described before. There were two different fire-resistant fabrics employed during these tests. For Douglas-fir trees material A (Roc-Lon Cotton Lining Fabric, from Jo-Ann Fabrics, item no. 1144484) was used, whereas for ponderosa pine and sagebrush material B (Roc-Lon Cotton Lining Fabric, from Jo-Ann Fabrics, item no. 1144492) was employed. Ideally, the material would remain constant between species of trees but due to a shortage of material A, material B was chosen. Both materials conform to the National Fire Protection Association 701 standard for fire-resistant fabrics, are 100% cotton, and are ~1 mm thick. The characterization of these fabrics became even more prudent with the need to change materials during testing.
Figure 4 shows the normalized char mark area variation with the cartridge heater power, temperature, and exposure time. This information is useful for understanding how the materials char when exposed to elevated temperatures (e.g., firebrand or heater). The exponential curve-fit for the data of both materials overlap, indicating that the char mark response of both materials is the same. This is expected as both these materials are made of 100% cotton and use the same fire retardant. Table 4 shows a comparison of coefficients of the curve fit when compared to values for material A tested using similar apparatus by Adusumilli et al. (2020). The maximum difference between the coefficient values is ~11%, which could be attributed to differences in experimental conditions. Adusumilli et al. (2020) established that material A would only form char marks if a firebrand had a temperature greater than roughly 300°C. Since both the materials have similar responses to heat exposure the minimum char mark formation temperature would also be 300°C for material B. As a result of the analysis just described, both types of fabric are considered to have equivalent responses to firebrands.
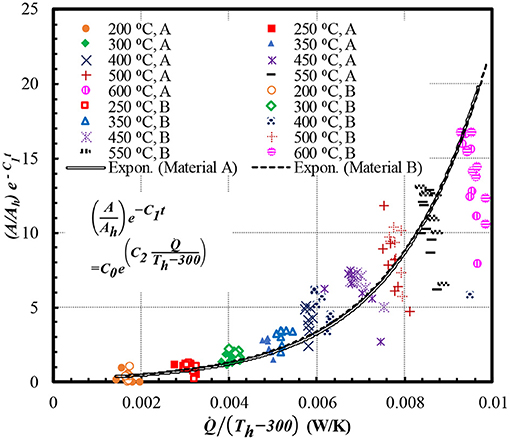
Figure 4. Demonstration of the curve fit between normalized char mark area, cartridge heater power input, temperature, and exposure time for both material A and B.
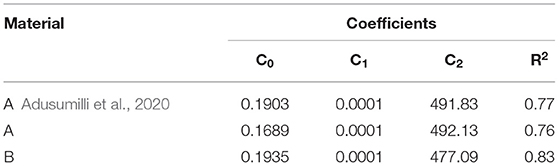
Table 4. Coefficients of the curve fit between normalized char mark area, heater power, temperature of the heater, and the time of exposure.
Moisture Content Measurement
Moisture content (MC) of the tree was measured using samples collected from the trees before a burn. The samples were collected from random locations of the tree to provide an accurate representation of the tree. In general, the firebrands observed on the fabric were needles or leaves from the trees. Certainly branches, bark, and cones can be firebrands during wildfires, however they were not observed in this study. The MC of the trees was estimated from the fine foliage (i.e., what formed firebrands). These samples were dried in an oven at ~105°C (Matthews, 2010) until the mass of the samples did not change, this drying method typically took 4 days to complete. The temperature of the oven was chosen to vaporize the moisture in the samples, but not cause pyrolysis. The MC percentage on a dry basis in the sample was calculated using the following relation (MacLean, 1952; Eckelman, 1997):
In general, the MC value was below 100% for all the trees burned. Trees were allowed to dry before burning to increase their propensity for torching, making the trees under consideration to be drier than those that would be found in forests (live trees). This step was necessary as the current ladder fuel's heat is insufficient to torch live trees. The results from this work are expected to be conservative in the number of hot firebrands produced (i.e., a larger number) than live fuels because of the lower moisture content. This assumption requires further investigation. Since this drying is natural and happens over a few days, we can assume that the dehydration occurs due to loss of moisture. Any loss in volatility of the trees is minimal and is not measured in this study. The amount of moisture in trees varied from species to species as the duration the trees were left out to dry differed. Figure 5 shows the measured MC for all the trees burned during the current tests. The average MC values for representative trees (using 7–8 trees of similar height) are given in Tables 1–3 for Douglas-fir, ponderosa pine, and sagebrush, respectively. On average the Douglas-fir trees were the driest followed by ponderosa pine trees. The sagebrush had the highest moisture content despite being left out to dry for a similar number of days to the Douglas-fir trees (14–20 days). The Douglas-fir trees were tested during a drier climate (May to June) when compared to the sagebrush tests (October to November). The dry mass (Md) was measured using the relationship given in Equation (2). All mass values reported in the table are of the actual mass measured, and Md was calculated from the MC value reported as needed.
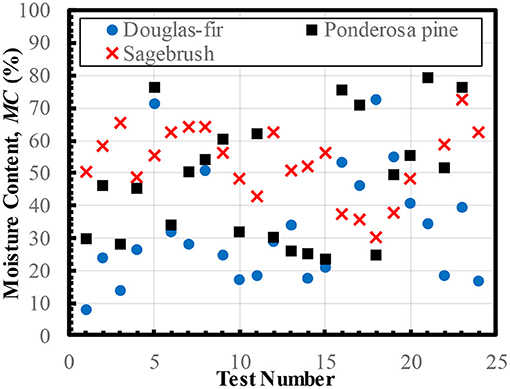
Figure 5. Moisture content of three different species of trees/shrubs burned during this study.
Wind Speed and Direction Measurements
The burns were conducted at an outdoor testing site because of the size of the trees and fires. To monitor the wind conditions a wind speed and direction smart sensor (OnSet S-WSA-M003) was deployed. This sensor works in association with a HOBO® Station logger to record the wind speed and direction. The accuracy of this sensor is ±1.1 m/s and ±5° for speed and direction, respectively. The resolution is 0.38 m/s and 1.4° for speed and direction, respectively. The starting threshold for the instrument is 1 m/s and the logging interval is 30 s. The wind speed reported is the average wind speed over the logging interval measured at a rate of 1 Hz, the gust speed is reported as the highest 3-s gust during the logging interval and the wind direction is logged as the vector average of wind direction measured every 3 s of the logging interval. The average wind speed and direction measurements (using 7–9 trees of similar height) are given in Tables 1–3 for Douglas-fir, ponderosa pine, and sagebrush, respectively. For measurements of each individual test, refer to the tables provided in the Appendix.
In general, the average wind speed was <1 m/s; these relatively low values were deliberate as burns were not conducted when it was windier. The maximum wind gust recorded was 4.8 m/s (for sagebrush), but the median value was 2.3 m/s. Anecdotally, the sagebrush measurements were gustier than the tests for Douglas-fir and ponderosa pine due to the difference in the season (i.e., fall instead of spring).
The wind direction provided here is the angle from the x-axis in the counterclockwise direction. Figure 6 shows the average wind direction of average trees for all the species under consideration. The average wind direction was between 0 and 180° which was the region where fire-resistant fabric stations were located. Although the average lies in this region, individual tests did sometimes have wind direction away from the region of interest indicating some of the firebrands might have been carried away from the region of interest. This would bias the measurements low. The error bars shown in Figure 6 display this possibility as the boundary of one standard deviation values lies beyond 180° for some of the tests. But the wind direction measurements have a drawback in that the sensor starting threshold was 1 m/s and the average wind speed was <1 m/s so sometimes the logger could record a false wind direction for the lowest wind speeds. Considering the relatively low wind speeds, and the number of tests conducted for each tree/shrub condition, the influence of wind on the average results is expected to be relatively minor. Despite the inability to control the wind due to outdoor testing, current work contributes toward the understanding of physics governing firebrand generation, particularly in low wind conditions (i.e., <1 m/s). Other research groups can obtain similar results for experiments conducted in low ambient wind speeds.
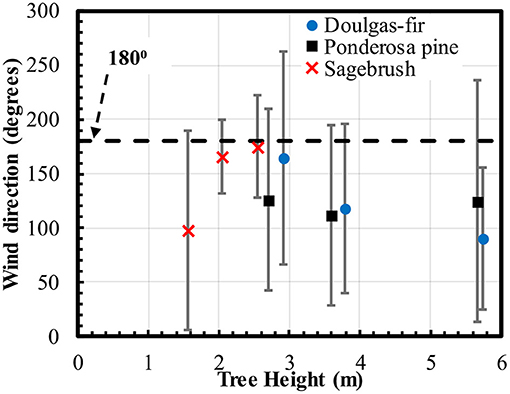
Figure 6. Average wind direction for an average tree. The error bars indicate the boundary of one standard deviation values.
Results
In this section, first, current measurements are compared with measurements from literature. Second, methodologies that can be used to estimate the total number of firebrands are discussed and evaluated. Third, the total weight and specific number of firebrands released are reported for Douglas-fir, ponderosa pine, and sagebrush. The sensitivity of the number of firebrands released to the height and MC of the tree/shrub are discussed.
Validation Results
Figure 7 reports the average char mark area density (i.e., number of char marks per m2) with respect to distance from the Douglas-fir trees. The average is based on the results from all the fabric stations where firebrands are collected at a given radii. The char mark area density decreases as the distance increases, as expected because of the increasing surface area with increasing radii for firebrands to be deposited. On average, the char mark area density at a radius of 1.5 m is 15 times larger than the value at a radius of 7.5 m. For reference, measurements collected by Hudson et al. (2020) are included on Figure 7. They conducted similar experiments but with fewer number of fabric stations (i.e., 15). In general, the overall trends of the current and former data are similar. It is noted that current char mark area density measurement are typically higher (e.g., 50% higher at 1.5 m radius) than the values measured by Hudson et al. (2020). The difference between measurements is attributed to the higher number of fire-resistant fabric stations used in the current study. Specifically, the larger number of stations assists with more accurately capturing the number of firebrands that are released. With fewer stations, it is more likely for firebrands to not land on fabric, hence biasing the measurements lower.
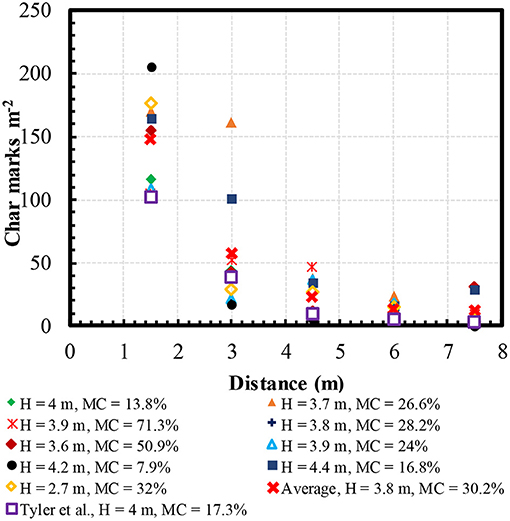
Figure 7. Char marks generated with distance from the tree for Douglas-fir trees, compared to measurements by Hudson et al. (2020).
Estimation of Total Number of Firebrands
Several methods were developed and evaluated for extrapolating from the number of measured char marks to estimate the total number of firebrands released by the tree/shrub during a burn. In particular, care was taken to ensure that the extrapolated values were not skewed by the data closest to the source. Currently, the assumption is that all the firebrands released fall in the semicircular region of interest. Since the fire-resistant fabric stations are in the wind's direction, the number of firebrands traveling in the opposite direction is minimal. Further, the data shown in Figure 7 indicates that the number of firebrands beyond the last semicircle (at 7.5 m) will be low when compared to the total number of firebrands within the semicircular region of interest. Further, the data shown in Figure 7 indicates that the number of firebrands beyond the last semicircle (at 7.5 m) will be low when compared to the total number of firebrands within the semicircular region of interest. The five extrapolation approaches considered are described and evaluated.
Node Method
With the node method to estimate the total number of hot firebrands released, the measured char mark/m2 information was used directly to estimate the total number of firebrands released. The semi-circle in front of the tree was divided into 65 spatial regions, with each region including a fabric station (i.e., a node). The measured char mark area density for a node was multiplied by the corresponding area of the region to calculate the firebrands in that region. In turn, the estimated number of firebrands from all the regions were cumulated to determine the overall number of hot firebrands released. If a node had no char marks, then that corresponding node area was assumed to not have any firebrands. The advantage of the node method was its ease of implementation. However, the method suffers from disproportional area weight given to the nodes at the farther end of the area of interest (i.e., the area increases as the node location is farther away from the tree). As a result, the total number of firebrands estimated by this methodology tends to be an overestimate. Figure 8 shows the estimated total number of firebrands released from Douglas-fir trees using the node method. The node method overestimates the number by a minimum of 100% when compared to other extrapolation and interpolation techniques.
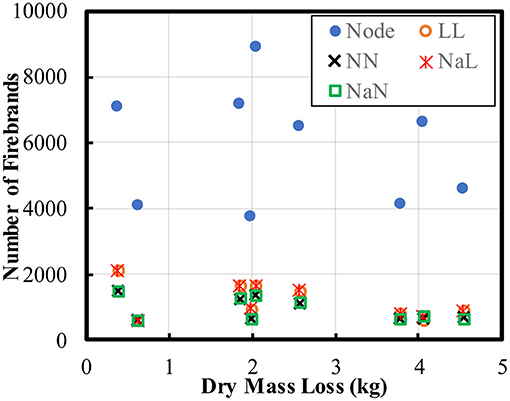
Figure 8. Variation of total number of firebrands measured using the node method and several interpolation and extrapolation methods. The trees used for these tests are Douglas-fir with heights between 2.7 and 4.2 m. The captions represent: LL, Linear interpolation and extrapolation; NN, Nearest neighbor interpolation and extrapolation; NaL, Natural neighbor interpolation and linear extrapolation; NaN, Natural neighbor interpolation and nearest neighbor extrapolation.
Interpolation and Extrapolation Methods
Arguably, a more accurate method to estimate the total number of firebrands is to interpolate data between nodes (i.e., 1.5 < r < 7.5 m) and extrapolate data for locations between center of the tree and nodes at 1.5 m radius (i.e., where not fabric could be placed). Once the char mark area density is interpolated and extrapolated, the char mark area density is integrated over the semicircular area of interest to estimate the total firebrand number. Four different interpolation/extrapolation combinations were used to estimate the total number of firebrands:
1. Linear interpolation and linear extrapolation (LL)
2. Nearest neighbor interpolation and extrapolation (NN)
3. Natural neighbor interpolation and linear extrapolation (NaL), and
4. Natural neighbor interpolation and nearest neighbor extrapolation (NaN)
These methods were implemented using functions already built into MATLAB software (The MathWorks Inc., 2018). Nodes that did not have char marks were specified as 0 when applying these methodologies. Figure 8 shows the estimated number of hot firebrands released using the four interpolation/extrapolation approaches. The total number of estimated firebrands from all these methods produce similar values (i.e., usually agree within 10%) indicating no significant differences in the results when the different methodologies are used, at least for the conditions from this study. For all methodologies, the total number of firebrands released was 2000 or less for Douglas-fir trees 2.7–4.2 m tall, as shown in Figure 8.
The results from the 4 interpolation/extrapolation techniques were further explored to evaluate the physical accuracy. Figure 9 shows the measurements (magenta) and the interpolated/extrapolated values (surface distribution) for the various methodologies. It is noted that both linear extrapolation methods resulted in a negative char mark area density at locations between 0 and 1.5 m radius (see Figures 9A,C). This occurred because linear extrapolation means extending data to unknown regions based on data at the last given point. A negative value for char mark area density is possible depending on the data at 1.5 m radius boundary. It was decided to not use either method employing linear extrapolation because of the unphysical aspect of extrapolation.
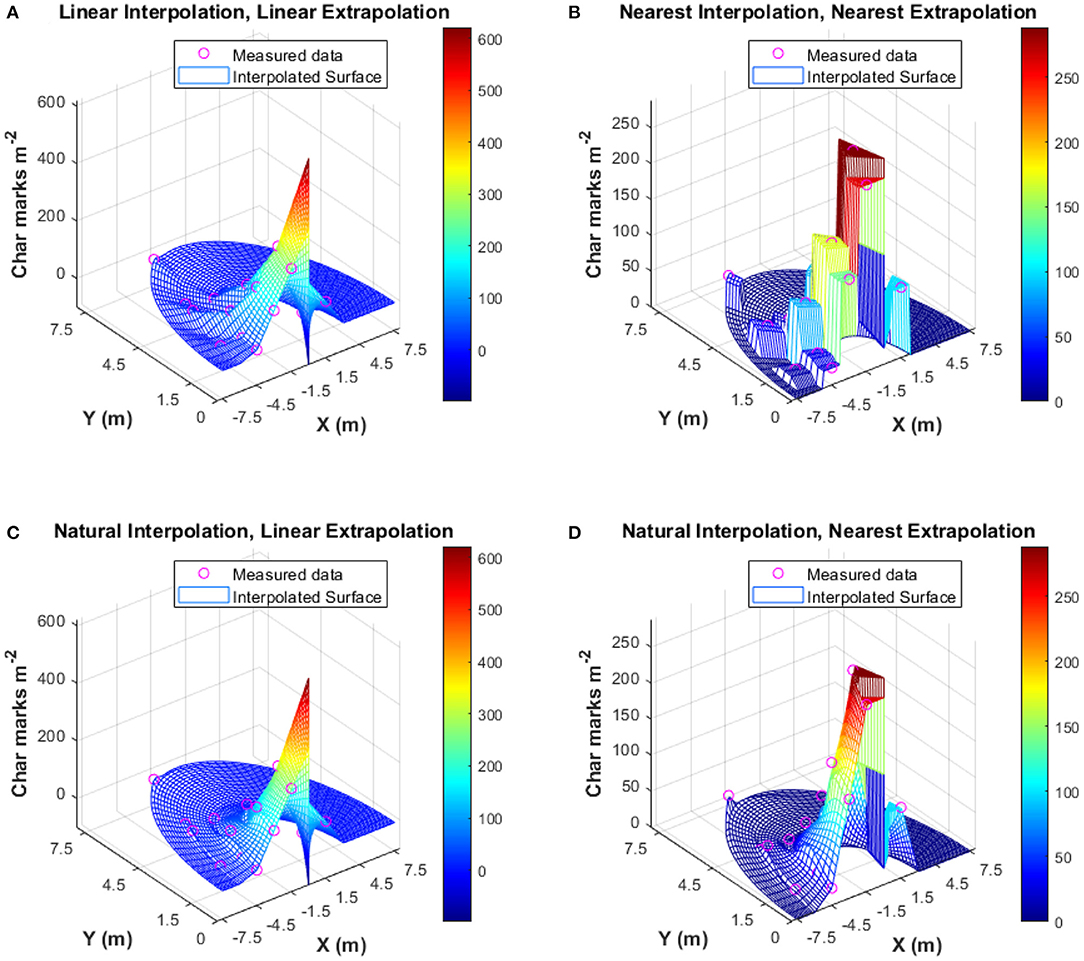
Figure 9. Performance of various interpolation and extrapolation methods for a Douglas-fir tree of height 4.4 m and MC = 16.8%. (A) Linear interpolation and extrapolation, (B) Nearest neighbor interpolation and extrapolation, (C) Natural neighbor interpolation and linear extrapolation, and (D) Natural neighbor interpolation and nearest neighbor extrapolation.
The nearest neighbor extrapolation method was used in conjunction with the nearest neighbor interpolation and natural neighbor interpolation methods (see Figures 9B,D). In the nearest neighbor interpolation method, the char mark area density between stations is calculated as the value of the nearest point leading to a piecewise constant value between data points (Amidror, 2002), as can be seen in Figure 9B. The natural neighbor interpolation method improves on the nearest neighbor interpolation method by applying a weighted value to neighboring known data points based on the distance between the point of interest and the neighbors (Amidror, 2002). This leads to a better estimation of the char mark area density at unknown locations as the approximation is smoother and close to the “true” function. This smoother approximation is evident in Figure 9D when compared to the nearest neighbor interpolation method shown in Figure 9B. The combination of natural neighbor interpolation and nearest neighbor extrapolation was used for the remainder of the work because linear extrapolation method is unphysical and natural neighbor interpolation method proved to be superior.
Single Tree vs. Accumulation Method
Two different approaches were evaluated for determining the total number of firebrands released. The first method was to collect the sheets of fabric after burning each tree [i.e., single tree method (STM)]. The results from each burn were added to provide the total number of firebrands produced for a type of tree for with a particular average height (using 7–9 trees). The second approach was the accumulation method (AM), where a total of 7–9 trees were burned separately and the fire-resistant fabric was changed between tests only if the fabric had enough char marks to warrant concern about marks merging together. If a station had to be replaced after a test, the char mark area density at that station is calculated as the sum of char mark area density of the fabrics at that station. The total number of firebrands was then estimated using the interpolation method. Each method has certain advantages, the STM provides resolution of the firebrands released for each tree whereas the AM method's data has char marks at more stations increasing the confidence in the interpolated data. The main advantage of the AM method is the ability to conduct tests with fewer resources (i.e., time and fabric) as the need to change fabric after every test is eliminated. Changing fabric typically consumes the longest amount of time to complete a test.
Figure 10 shows a comparison of the estimated number of firebrands produced per kg dry mass loss using the STM and AM for several Douglas-fir trees. Normalizing the total number of firebrands by the mass loss is important for allowing comparison between tests, and the values can potentially be used as source terms for models. Note that the AM provides a single data point (i.e., an accumulation for multiple trees) whereas the STM provides data points for individual trees. The data generated using STM was directly compared to the AM results by aggregating the former results for multiple trees [i.e., Accumulated Single tree method (ASTM)]. Considering both AM and ASTM data, as the average height of the tree increases the firebrands produced per dry mass loss decreases (i.e., Figure 10a). The trees studied using the STM measurements have an average height of 3.8 m, but a relatively large variation in firebrands produced per kg dry mass loss is evident; no discernable trend can be observed indicating that other physical parameter(s) are key for firebrand production.
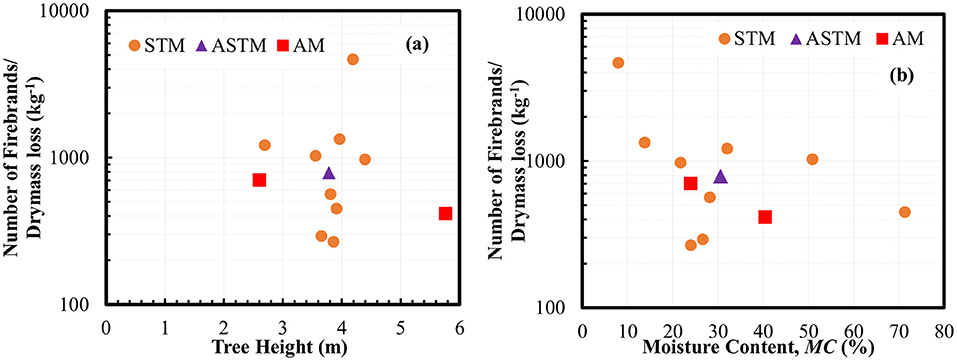
Figure 10. Number of firebrands measured per dry mass loss for Douglas-fir trees using both single tree method (STM) and accumulation method (AM). (a) Shows generation characteristics with respect to the height of the trees. (b) Shows results with respect to the moisture content of the trees.
Comparison of firebrands produced relative to the MC of trees is shown in Figure 10b. As trees become drier their ability to produce firebrands increases roughly exponentially. This was expected, as the trees dry, they have less moisture which makes them burn with higher intensity and thus can produce more firebrands. The average MC of the trees measured using STM is 30.2% as shown by the ASTM data point. The AM data points in this comparison fall in trend with the STM data points, indicating that MC is a factor that determines the firebrands produced per kg dry mass loss. Admittedly, the moisture content evaluated in this study is lower than for live fuel. Hence caution should be exercised in extrapolating the sensitivity found in this study to live fuels.
Species Dependence
The AM was applied to measure the sensitivity of the production of firebrands as the species of tree/shrub was varied. The AM was used because the reduced resources needed for the method allowed a greater number of trees/shrubs to be evaluated. Additionally, the AM and STM methods provide similar results (see Figure 10). Figure 11a shows the total number of firebrands produced for trees/shrubs of different heights for various species. Sagebrush typically produces larger numbers of firebrands when compared to the other two trees. Anecdotally, the burning intensity of sagebrush tended to be the highest of all the trees/shrubs. As the tree height increases the total number of firebrands being produced increases for Douglas-fir trees and nearly remains constant for ponderosa pine trees. The different sensitivities for the two species of trees is attributed to differences in the burning behavior of the trees. Ponderosa pine trees were less prone to complete torching, in particular with increasing height, because of the spacing of the branches and needles.
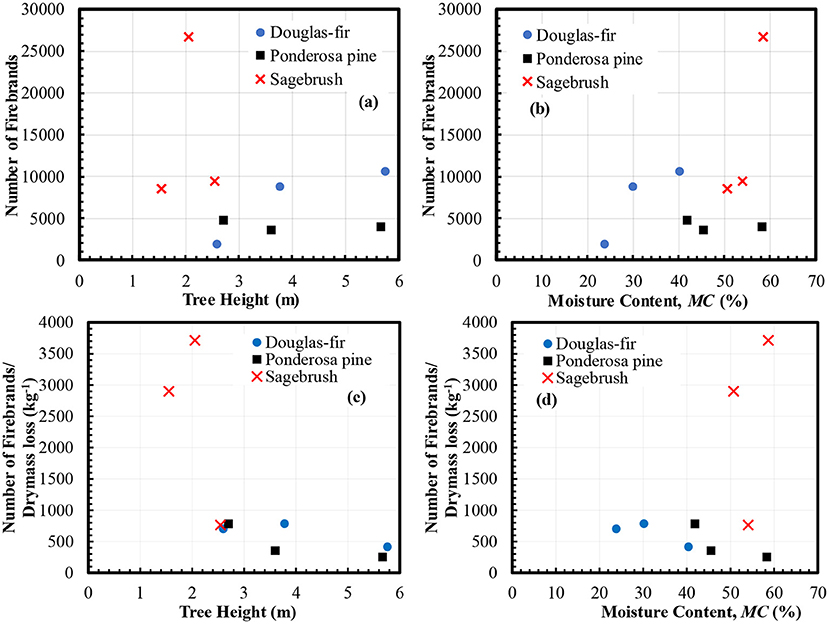
Figure 11. (a) Variation of total number of firebrands with the height of trees, (b) variation of total number of firebrands with the MC of trees, (c) variation of number of firebrands per kg dry mass loss with the height of trees, (d) variation of number of firebrands per kg dry mass loss with the MC of trees.
The number of firebrands produced for sagebrush increases as the height of the tree increases but decreases for the tallest trees. The cause of the reduction is not clear but may have happened because the prevailing winds may have caused firebrands to not be deposited on the fabric. However, as discussed before, the average wind conditions are expected to have a minor impact on burning of the trees/shrubs. Recall that the average wind speed was always <1 m/s and the average wind direction was toward the region of interest. Perhaps a more likely reason for the reduction in firebrands is that the ground fire has a disproportionate impact on the shorter trees/shrubs. Shorter sagebrush, tended to torch completely, thus producing more firebrands. For the taller trees/shrubs the starter fire burns the leaves closer to the ground, but not always propagate throughout the trees/shrubs. In particular, the tallest sagebrush do not have foliage near the ground and hence could experience a reduction the total number of firebrands. The effect of this anecdotal observation needs to be examined further in future studies.
As discussed before, MC could be used as the physical parameter indicative of firebrand production instead of tree height. Figure 11b shows the total number of firebrands produced with varying MC measured using AM. The total number of firebrands increases as the MC increases for Douglas-fir and sagebrush species but remains roughly constant for ponderosa pine trees. This trend is counter intuitive and may require further investigation, specifically to identify if the moisture content couples with other physical parameters.
Figure 11c shows the variation of the number of firebrands produced per kg of fuel consumed (specific number of firebrands) relative to the height of the tree/shrub. As the tree height increases the specific number of firebrands decreases for Douglas-fir and ponderosa pine trees. The cause of this sensitivity is not clear, but it is plausible that the greater number of branches with larger diameters for the taller trees reduces the relative number of firebrands that are produced. Hudson and Blunck (2019) found that the diameter of dowels was one of the most significant parameters that influences the propensity to generate firebrands. Hence, the larger the tree the greater the number of branches that may burn (and consume mass), but not produce firebrands. For sagebrush the specific number of firebrands increases initially with height of the shrub and then decreases for the tallest bushes. It is also plausible that the upper branches of bigger trees block the movement or generation of firebrands. The specific cause of the sensitivity identified in Figure 11c requires further investigation.
Figure 11d shows the specific number of firebrands relative to the MC of the tree/shrub. The specific number of firebrands decreases as the MC of the trees increases for Douglas-fir and ponderosa pine trees. These trees produce similar specific numbers of firebrands, but ponderosa pine trees had higher moisture content than Douglas-fir trees even though they were left out to dry for a longer time period. Since these trees are less susceptible to drying, it is expected that they could produce a smaller number of firebrands during wildfires compared to Douglas-fir. In contrast, sagebrush produces approximately six times more specific number of firebrands when compared to ponderosa pine trees for similar amount of MC. This is consistent with a visible greater burning intensity of the sagebrush and greater consumption of the foliage.
Summary and Conclusions
In this work, a total of 71 individual trees/shrubs of varying heights (1.4–6.2 m) were burned to enumerate the total number of firebrands produced. Two tree species (Douglas-fir and ponderosa pine) and one shrub species (sagebrush) were evaluated. A total of 65 fire-resistant fabric stations were deployed for each tree/shrub; the enumeration was carried out by counting the total number of char marks firebrands left on the fabric. The number of char marks was equated to be the number of firebrands captured whose temperatures were >300°C. A novel interpolation/extrapolation methodology was established to measure the total number of firebrands generated using the char mark information at individual stations.
The specific conclusions from this work are as follows:
1. Overall, sagebrush trees tend to produce a greater total number of firebrands and firebrands per kg of fuel consumed (~6 times higher for trees of similar moisture content) when compared to the Douglas-fir and ponderosa pine trees. This is attributed to the relatively small diameters of the foliage/branches and the visibly greater burning intensity of sagebrush.
2. The total number of firebrands tends to increase with the increase in the height of the tree/shrub. The specific number of firebrands produced tends to decrease with increasing height of the tree/shrub. It is plausible that the greater number of branches with larger diameters for the taller trees reduces the relative number of firebrands that are produced.
3. The total number of firebrands tends to increase or remain similar as the moisture content of the tree varies. The specific firebrand production increased exponentially with decreasing moisture content in the trees for Douglas-fir and ponderosa pine trees. This is supported by the anecdotally observed increase in the intensity of burns for trees with lower moisture content irrespective of the species. The definite cause of this sensitivity is unclear, but it is plausible that this trend results from a coupling of the moisture content with another physical parameter.
It is expected that the methodology established here can be used by other researchers to determine the total number of firebrands generated for other fuels of interest during fires. Moreover, the firebrand production terms reported here can be used within detailed physics-models to improve the fidelity of simulations of firebrand transport and ignition. Further, current measurements show that other experimental parameters, such as heat release rate from the burns, the size of tree branches and needles/leaves, and velocity within a tree during a burn need to be evaluated. Plans are in place to measure a few of these parameters in future experiments.
Data Availability Statement
The raw data supporting the conclusions of this article will be made available by the authors, without undue reservation.
Author Contributions
SA led the research, analyzed the results, and wrote the manuscript. JC contributed to the data collection and helped to write the manuscript. DB conceived of the research idea, helped with analysis, and contributed to the manuscript. All authors contributed to the article and approved the submitted version.
Funding
This research was supported by a NIST grant (grant number, 70NANB19H164).
Conflict of Interest
The authors declare that the research was conducted in the absence of any commercial or financial relationships that could be construed as a potential conflict of interest.
Acknowledgments
The authors would like to thank Andrew Ross, Nathan Gardner, Benjamin Smucker, Derek Bean, Harley Glad, and Kaz Teope for their support in conducting these experiments. The authors would also like to acknowledge the USDA-Forest service for lending their anemometer.
Supplementary Material
The Supplementary Material for this article can be found online at: https://www.frontiersin.org/articles/10.3389/fmech.2021.655593/full#supplementary-material
References
Adusumilli, S., Hudson, T., Gardner, N., and Blunck, D. L. (2020). Quantifying production of hot firebrands using a fire-resistant fabric. Int. J. Wildl. Fire. 30, 154–159. doi: 10.1071/WF20051
Amidror, I. (2002). Scattered data interpolation methods for electronic imaging systems: a survey. J. Electron. Imaging 11:157. doi: 10.1117/1.1455013
Anand, C., Shotorban, B., Mahalingam, S., McAllister, S., and Weise, D. R. (2017). Physics-based modeling of live wildland fuel ignition experiments in the forced ignition and flame spread test apparatus. Combust. Sci. Technol. 189, 1551–1570. doi: 10.1080/00102202.2017.1308357
Benkoussas, B., Consalvi, J. L., Porterie, B., Sardoy, N., and Loraud, J. C. (2007). Modelling thermal degradation of woody fuel particles. Int. J. Therm. Sci. 46, 319–327. doi: 10.1016/j.ijthermalsci.2006.06.016
Eckelman, C. A. (1997). Wood Moisture Calculations. West Lafayette, IN: Purdue University, Department of Forestry & Natural Resources.
Fernandez-Pello, A. C. (2017). Wildland fire spot ignition by sparks and firebrands. Fire Saf. J. 91, 2–10. doi: 10.1016/j.firesaf.2017.04.040
Filkov, A., Prohanov, S., Mueller, E., Kasymov, D., Martynov, P., Houssami, M. El, et al. (2017). Investigation of firebrand production during prescribed fires conducted in a pine forest. Proc. Combust. Inst. 36, 3263–3270. doi: 10.1016/j.proci.2016.06.125
Hedayati, F. (2018). Generation and Characterization of Firebrands From Selected Structural Fuels. Charlotte, NC: University of North Carolina.
Hudson, T. R., and Blunck, D. L. (2019). Effects of fuel characteristics on ember generation characteristics at branch-scales. Int. J. Wildl. Fire 28, 941–950. doi: 10.1071/WF19075
Hudson, T. R., Bray, R. B., Blunck, D. L., Page, W., and Butler, B. (2020). Effects of fuel morphology on ember generation characteristics at the tree scale. Int. J. Wildl. Fire. 29, 1042–1051. doi: 10.1071/WF19182
Jolly, M. W., Hintz, J., Linn, R. L., Kropp, R. C., Conrad, E. T., Parsons, R. A., et al. (2016). Seasonal variations in red pine (Pinus resinosa) and jack pine (Pinus banksiana) foliar physio-chemistry and their potential influence on stand-scale wildland fire behavior. For. Ecol. Manage. 373, 167–178. doi: 10.1016/j.foreco.2016.04.005
Linn, R., Reisner, J., Colman, J., and Winterkamp, J. (2002). Studying wildfire behavior using FIRETEC. Int. J. Wildl. Fire 11, 233–246. doi: 10.1071/wf02007
MacLean, J. D. (1952). Preservative Treatment of Wood by Pressure Methods. Washington, DC: US Department of Agriculture, Forest Service.
Manzello, S. L., and Foote, E. I. D. (2014). Characterizing firebrand exposure from wildland-urban interface (WUI) fires: results from the 2007 Angora fire. Fire Technol. 50, 105–124. doi: 10.1007/s10694-012-0295-4
Manzello, S. L., Maranghides, A., and Mell, W. E. (2007a). Firebrand generation from burning vegetation. Int. J. Wildl. Fire 16:458. doi: 10.1071/WF06079
Manzello, S. L., Maranghides, A., Mell, W. E., Cleary, T. G., and Yang, J. C. (2006). Firebrand production from burning vegetation. For. Ecol. Manage. 234:S119. doi: 10.1016/j.foreco.2006.08.160
Manzello, S. L., Maranghides, A., Shields, J. R., Mell, W. E., Hayashi, Y., and Nii, D. (2007b). Measurement of firebrand production and heat release rate (HRR) from burning Korean pine trees. Fire Saf. Sci. 7, 108–116.
Manzello, S. L., Maranghides, A., Shields, J. R., Mell, W. E., Hayashi, Y., and Nii, D. (2009). Mass and size distribution of firebrands generated from burning Korean pine (Pinus koraiensis) trees. Fire Mater. 33, 21–31. doi: 10.1002/fam.977
Manzello, S. L., Suzuki, S., Gollner, M. J., and Fernandez-Pello, A. C. (2020). Role of firebrand combustion in large outdoor fire spread. Prog. Energy Combust. Sci. 76:100801. doi: 10.1016/j.pecs.2019.100801
Matthews, S. (2010). Effect of drying temperature on fuel moisture content measurements. Int. J. Wildl. Fire 19:800. doi: 10.1071/WF08188
Monedero, S., Ramirez, J., and Cardil, A. (2019). Predicting fi re spread and behaviour on the fi reline. Wild fire analyst pocket: a mobile app for wildland fire prediction. Ecol. Modell. 392, 103–107. doi: 10.1016/j.ecolmodel.2018.11.016
Rissel, S., and Ridenour, K. (2013). Ember production during the bastrop complex fire. Fire Manag. Today 72, 7–13. Available online at: https://www.fs.usda.gov/sites/default/files/legacy_files/fire-management-today/72-4.pdf
Shotorban, B., Yashwanth, B. L., Mahalingam, S., and Haring, D. J. (2018). An investigation of pyrolysis and ignition of moist leaf-like fuel subject to convective heating. Combust. Flame 190, 25–35. doi: 10.1016/j.combustflame.2017.11.008
Suzuki, S., Brown, A., Manzello, S. L., Suzuki, J., and Hayashi, Y. (2014). Firebrands generated from a full-scale structure burning under well-controlled laboratory conditions. Fire Saf. J. 63, 43–51. doi: 10.1016/j.firesaf.2013.11.008
Suzuki, S., and Manzello, S. L. (2016). Firebrand production from building components fitted with siding treatments. Fire Saf. J. 80, 64–70. doi: 10.1016/j.firesaf.2016.01.004
Suzuki, S., Manzello, S. L., and Hayashi, Y. (2013). The size and mass distribution of firebrands collected from ignited building components exposed to wind. Proc. Combust. Inst. 34, 2479–2485. doi: 10.1016/j.proci.2012.06.061
Suzuki, S., Manzello, S. L., Kagiya, K., Suzuki, J., and Hayashi, Y. (2015). Ignition of Mulch beds exposed to continuous wind-driven firebrand showers. Fire Technol. 51, 905–922. doi: 10.1007/s10694-014-0425-2
Suzuki, S., Manzello, S. L., Lage, M., and Laing, G. (2012). Firebrand generation data obtained from a full-scale structure burn. Int. J. Wildl. Fire 21, 961–968. doi: 10.1071/WF11133
Keywords: firebrand, generation, Douglas-fir, spot fires, wildfire, sagebrush, ponderosa pine, wildland urban interface
Citation: Adusumilli S, Chaplen JE and Blunck DL (2021) Firebrand Generation Rates at the Source for Trees and a Shrub. Front. Mech. Eng. 7:655593. doi: 10.3389/fmech.2021.655593
Received: 19 January 2021; Accepted: 12 April 2021;
Published: 15 June 2021.
Edited by:
Sayaka Suzuki, National Research Institute for Fire and Disaster, JapanReviewed by:
Miguel Almeida, Associação para o Desenvolvimento da Aerodinâmica Industrial, PortugalMichael John Gollner, University of California, Berkeley, United States
Copyright © 2021 Adusumilli, Chaplen and Blunck. This is an open-access article distributed under the terms of the Creative Commons Attribution License (CC BY). The use, distribution or reproduction in other forums is permitted, provided the original author(s) and the copyright owner(s) are credited and that the original publication in this journal is cited, in accordance with accepted academic practice. No use, distribution or reproduction is permitted which does not comply with these terms.
*Correspondence: Sampath Adusumilli, adusumis@oregonstate.edu