Geopolymer Concrete Compressive Strength via Artificial Neural Network, Adaptive Neuro Fuzzy Interface System, and Gene Expression Programming With K-Fold Cross Validation
 Mohsin Ali Khan1*
  Adeel Zafar1
  Furqan Farooq2
  Muhammad Faisal Javed2* Rayed Alyousef3 Hisham Alabduljabbar3
  M. Ijaz Khan4
- 1Military College of Engineering (MCE), National University of Science and Technology (NUST), Islamabad, Pakistan
- 2Department of Civil Engineering, COMSATS University Islamabad, Abbottabad Campus, Abbottabad, Pakistan
- 3College of Engineering in Al-Kharj, Prince Sattam Bin Abdulaziz University, Al-Kharj, Saudi Arabia
- 4Department of Mathematics and Statistics, Riphah International University, Islamabad, Pakistan
The ultrafine fly ash (FA) is a hazardous material collected from coal productions, which has been proficiently employed for the manufacturing of geopolymer concrete (GPC). In this study, the three artificial intelligence (AI) techniques, namely, artificial neural network (ANN), adaptive neuro-fuzzy interface (ANFIS), and gene expression programming (GEP) are used to establish a reliable and accurate model to estimate the compressive strength
Introduction
Fly ash is the unburned residual obtained from coal production and is taken out by the gases expelled from the boiler, which is then accumulated by means of mechanical or electrostatic precipitator (Rafieizonooz et al., 2016; Aprianti S, 2017; Akbar et al., 2021). Every year, about 375 million tons of FA is generated with a retention cost of $20–$40 per ton (Dwivedi and Jain, 2014). FA contains hazardous minerals like alumina, ferric oxide, and silica; putting to dump fill sites without sufficient treatment creates a destructive and harmful effect on the ecology (Carlson and Adriano, 1993; Kumar Tiwari et al., 2016; Nadesan and Dinakar, 2017; Ghazali et al., 2019). Virtuous waste management is needed for the sustainability of a healthy environment. Also, the ultrafine particles of FA, when reached to the respiratory system, cause different health issues like cancer, anemia, physiological disorder, dermatitis, and diarrhea. It also pollutes the ground water and alarms the aquatic life (Carlson and Adriano, 1993; Kumar Tiwari et al., 2016; Ghazali et al., 2019).
In the world, mostly, concrete is used for construction purposes and is the utmost desirable substance after water (Farooq et al., 2020a; Liew and Akbar, 2020). Around 3 tons of concrete is manufactured per person, which accumulates 25 billion tons of concrete production per year (Watts, 2019), which requires 2.6 billion tons of cement production every year and would be increased by 25 percent in the latter decade (Wongsa et al., 2020). However, the processing of cement has a detrimental role in polluting the environment. In manufacturing, 1 ton of cement and 1 ton of carbon dioxide are emitted into the atmosphere (Akbar and Liew, 2020). The cement utilizes limestone, and a serious deficiency of limestone may arise after 25–50 years (Farooq et al., 2020c; Sumanth Kumar et al., 2020). Thus, the production of green concrete is needed which leads to sustainable development and a healthy environment. FA acts as a supplementary cementitious material in the concrete mix and has been effectively used by researchers in the production of green concrete (Wang et al., 2017, Wang et al., 2019a; Chen et al., 2019). The consumption of FA in the construction is a better choice as it will not only reduce the malicious impact of its dumping into landfills but will also decrease the use of cement.
From the last 20 years, in the construction industry, the use of fly ash–dependent geopolymer concrete is increasing rapidly because it lessens the depletion of cement in geopolymer concrete (GPC) (Gülşan et al., 2019; Kondepudi and Subramaniam, 2019; Xie et al., 2019; Zhang et al., 2020a; Bajpai et al., 2020; Meesala et al., 2020; Noushini et al., 2020; Nuaklong et al., 2020). Because of the anomalous behavior of FA, its application in the construction industry is still limited (Jena et al., 2019; Nguyen et al., 2020; Sandanayake et al., 2020). FGPC is significantly used in the construction industry, but yet no method is available for the prediction of its compressive strength
Throughout the globe, AI techniques are being used to estimate concrete properties (Farooq et al., 2021). Various AI techniques are used by researchers such as fuzzy interface system (FIS), response surface methodology (RSM), adaptive neuro-fuzzy interface system (ANFIS), extreme machine learning (EML), artificial neural network (ANN), support vector machine (SVM), random forest (RF), particle swarm optimization algorithm (PSOA), backpropagation neural network (BPNN), genetic algorithm (GA), genetic programming (GP), and gene expression programming (GEP). Table 1 covers the recent research conducted for the prediction of concrete properties via AI techniques. The ANN and ANFIS techniques can detect and generalize the complicated patterns. Therefore, they can be effectively used to solve engineering complexities (Noori et al., 2010; Chou and Pham, 2013). The existence of enormous hidden neurons sometimes makes it difficult to develop the relationship between input and output variables. These models show a strong correlation between input and outputs but do not provide an empirical equation that can be further used in the field. This is due to the complex structure of ANN and ANFIS models, which limits the wide-scale adoption of these models (Noori et al., 2010; Sebaaly et al., 2018).
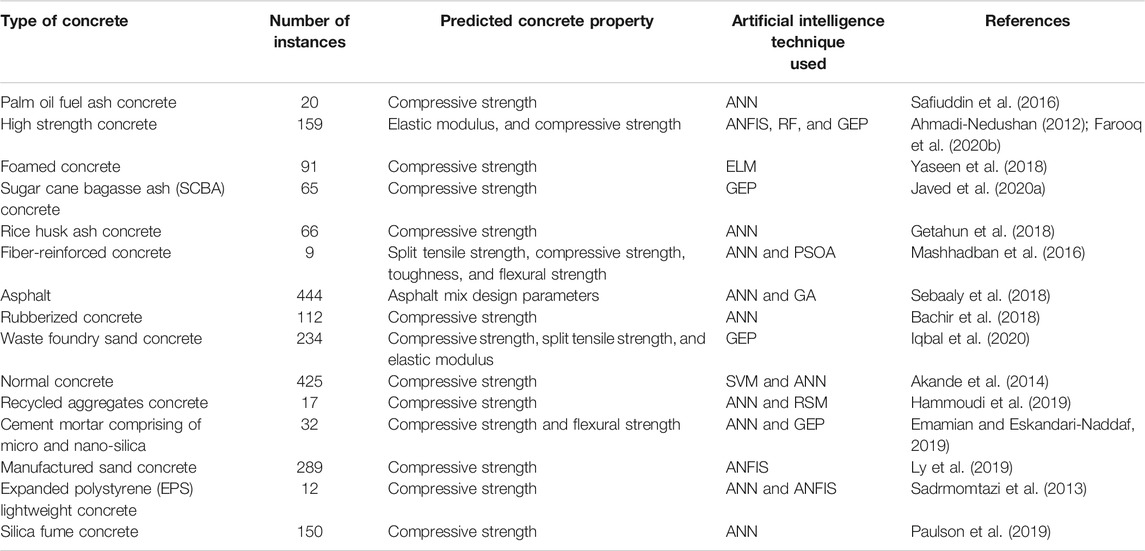
TABLE 1. Application of artificial intelligence (AI) techniques in civil engineering materials.
Genetic programming (GP) is a worthy soft computing method as it ignores the prior developed relationship in the establishment of the model (Gandomi et al., 2012; Gandomi et al., 2013). Recently, in civil engineering, gene expression programming (GEP) is introduced which is an extension of GP. GEP uses a fixed-length linear chromosome and encodes a small program (Ferreira, 2006). It is advantageous as it provides a simple empirical equation for predicting the response, which can be used practically (Behnia et al., 2013; Beheshti Aval et al., 2017; Gholampour et al., 2017; Sadrossadat et al., 2018; Iqbal et al., 2020).
In the design and analysis of concrete, compressive strength
In this research, a comprehensive database of 298 instances has been established from the previous peer-reviewed published work which contains 101 cylindrical samples with a size of
Machine Learning Modeling Techniques
This study considers three different artificial intelligence (AI) algorithms, to establish a model for estimating the compressive strength of FGPC. The execution of these models does not need any prior knowledge of the experimental procedure. This section briefly describes the overview of the AI modeling techniques used in this research.
Gene Expression Programming
Koza suggested an artificial intelligence method, that is, genetic programming (GP), as a substitute for GA which works on fixed-size strings (Koza and Poli, 2005). GP is a flexible and adjustable programming method as it uses the nonlinear parse tree structure. It accepts the initial nonlinearity within the data. Such nonlinearity has been executed earlier (Koza and Poli, 2005; Alkroosh and Sarker, 2019). GP fails in considering the independent genome. GP deals with the nonlinear structure as both phenotype and genotype. This marks GP questionable in assembling the rudimentary and simple equation. To resolve the discrepancies in GP, Ferreira introduced a novel methodology called GEP (Koza and Poli, 2005). The noteworthy change in GEP is that it transfers the genome toward another generation. One more unique function is the formation of objects via chromosomes made up of genes, which are further expanded as tail and head (Saridemir, 2010). In GEP, every single gene is comprised of fitted length parameters, arithmetic operation as a set of functions, and terminal set of constants. In the operation of genetic code, there exists a one-to-one interaction between subsequent functions and the symbols of chromosomes. The essential figures and information needed for the establishment of an empirical equation are stored in the chromosomes. A novel language Karva is developed to deduce this information.
Figure 1 shows the flow diagram of the GEP technique. The first step is the fairly random distribution of fixed-size chromosomes for every instance. The same chromosomes are then represented as the expression trees (ET), and the fitness is calculated for every single individual. The mutation cycle keeps on with the addition of different individuals for several generations till the best model is achieved. To renovate the population, genetic operations like reproduction, mutations, and crossovers are carried out.
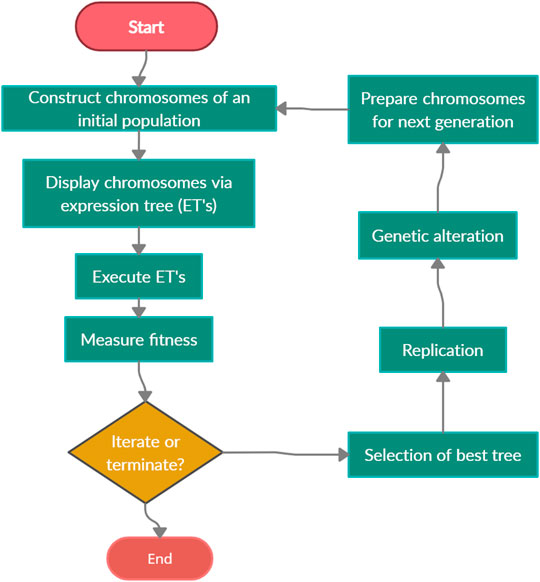
FIGURE 1. Architectural flowchart of GEP algorithm.
Artificial Neural Network
ANN analyzes the data by the artificial intelligence (AI) method. It uses the learning ability of the human brain. The extensively used form of ANN is the feed-forward backpropagation (FFBP) algorithm. Figure 2 illustrates that FFBP comprises of minimum three layers, that is, the input, the output, and the hidden layers. These layers are linked through nodes in an appropriate order along with approximated weights. The purpose of the input layer is to obtain the data from outside. Their nodes do not operate a single function on input data. The data become biased, weighted, and summed up in the hidden layer. The executed data are then transferred to the output layer (Alavi and Gandomi, 2011; Gandomi and Roke, 2015).
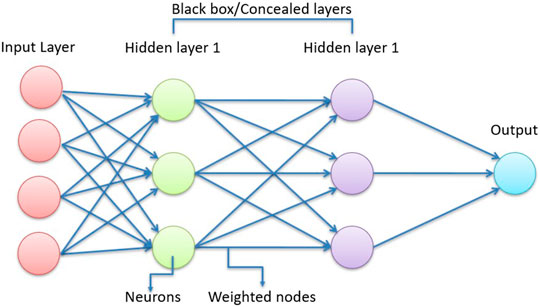
FIGURE 2. Architecture of the ANN model.
Two types of FFBP are generally used, that is, single-layer perceptron (SLP) and multiple layer perceptron (MLP). The SLP is easy and simple but cannot catch the nonlinear relationship, while the complex nature of MLP effectively handles the nonlinear relation between output and input variables. The steps involved in the mathematical operation of MLP are as following:
Step 1: In the first step, the input data is weighted and summed given as:
where
Step 2: It involves an activation function. Different activation functions are used like a ramp, Gaussian, and sigmoid functions. However, the sigmoid function is utilized in this study which is stated as:
Step 3: In this step, the final output is determined, which is dependent on the estimated outputs by hidden neurons. The ultimate output can be expressed as:
where
Artificial Neuro-Fuzzy Interface
ANFIS is another AI technique that combines the effect of fuzzy logic and ANN (Çaydaş et al., 2009). ANN is generally employed to lessen the probability of error in the outcome. Whereas the fuzzy logic is utilized to prove and demonstrate the practiced knowledge and is applied while mathematical modeling of the anticipated input and output data set (Jaafari et al., 2019). Generally, the ANFIS works on five layers. The description of these layers is as follows:
1st layer: It is the fuzzification layer that encompasses the functional members of the input parameters, which use the Gaussian function for the prediction of the outcome. The mathematical equation is given as:
where
2nd layer: In this layer, nodes are utilized to send the output through the multiplication of the input with a particular weightage. This layer is worked on the fuzzy and logic via expression given below;
3rd layer: The aim of this layer is to normalize the functions of membership. The below-listed equation is used to estimate the ratio between various firing strengths.
4th layer: It is the defuzzification layer that utilizes the square nodes to conclude the rules of the fuzzy logic. The following expression shows the defuzzification process:
where
5th layer: This layer has the function to aggregate and sum up the previous layers and later on conclude the final output.
Acquisition of Data
For estimating the compressive strength
The comprised dataset has
Figure 3 shows the cumulative percentage and frequency distribution for all the 10-input parameter used in the modeling of
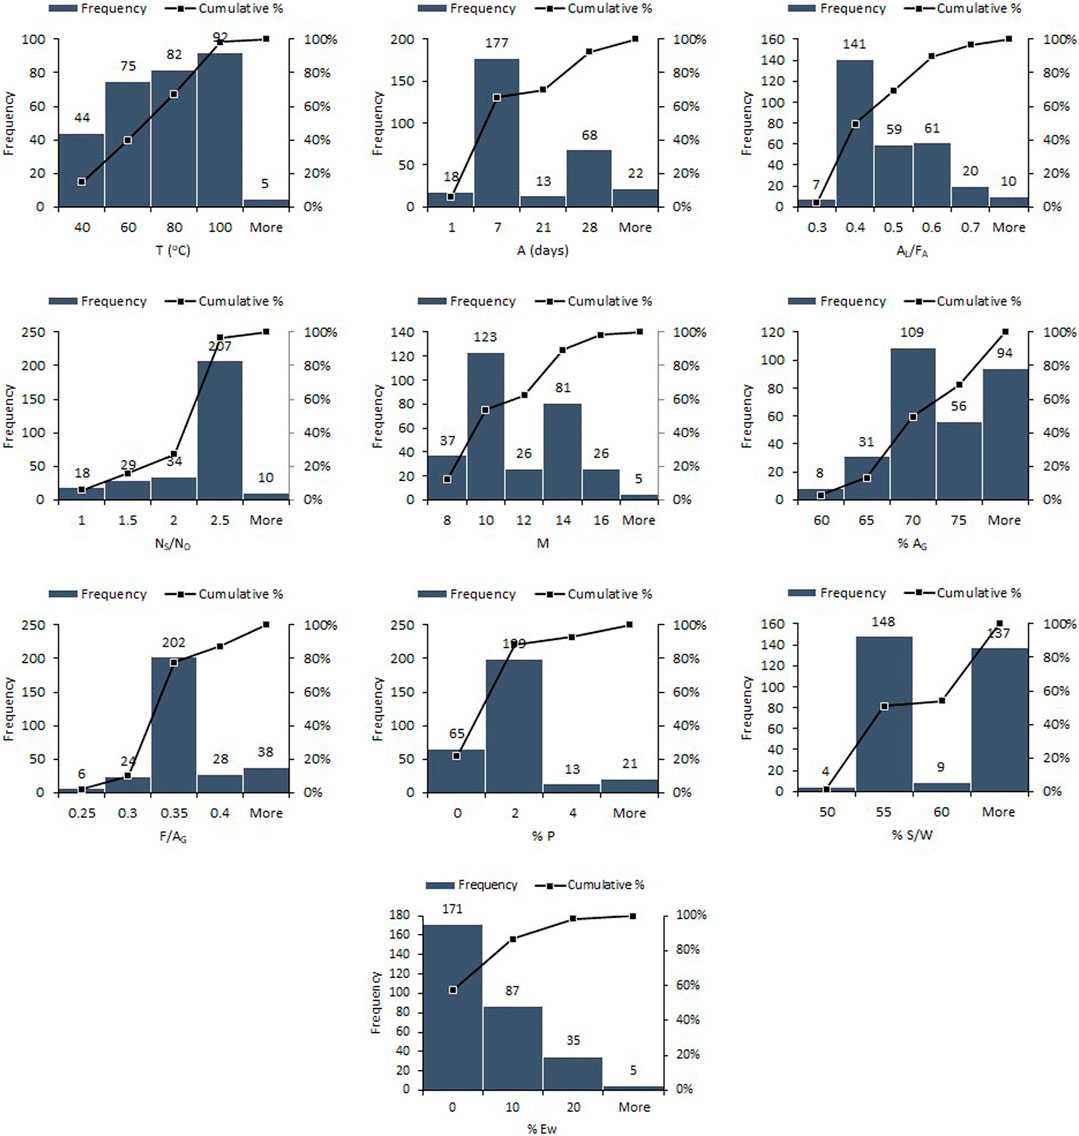
FIGURE 3. Occurrence frequency and cumulative percentage of explanatory variables.
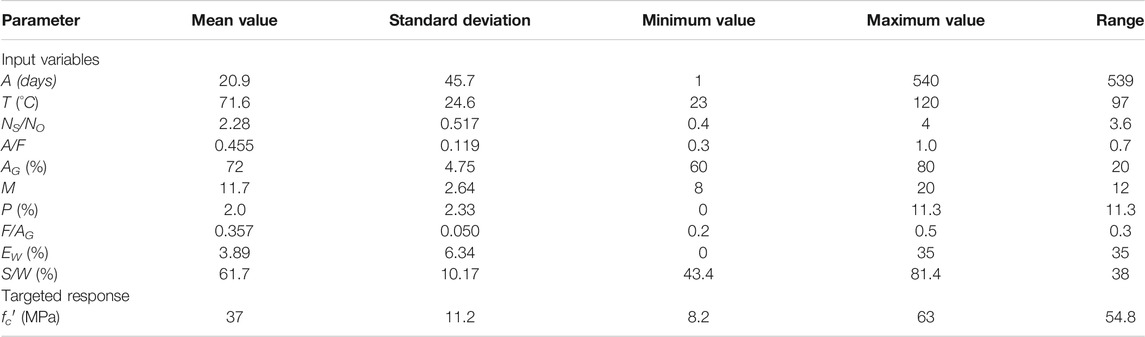
TABLE 2. Mean value, standard deviation, and range of input and targeted parameters.
It must be noted that for the validation, consistency, and reliability of the dataset, many trials have been executed. The instances that deviate about 20% from the global norm were not counted in the development of the models. 298 data points were used to develop ANN, ANFIS, and GEP models for the prediction of
Development and Evaluation of Machine Learning Models
The first and foremost step in the establishment of the model using a machine learning algorithm is the selection of such input variables. To develop the generalized AI models, those input parameters are chosen, which greatly influence the properties of FGPC. To develop AI models for the compressive strength of FGPC, the most influential input variables considered in this study are shown in Eq. 9.
Development of Artificial Neural Network Model
The first step in the establishment of the ANN model is the adjustment of fitting parameters, which includes the numbers of the hidden layer, the hidden number of neurons in every layer, the function used for training of the neural network, the epochs, and the maximum number of repetitions. Table 3 displays the details of these parameters. MATLAB software is utilized for the execution of the ANN algorithm.
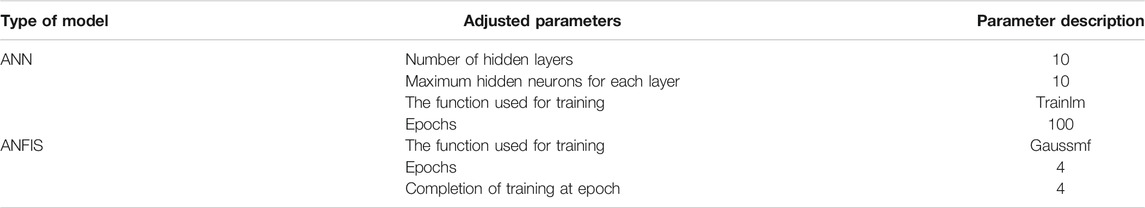
TABLE 3. Setting of fitted parameters for ANN and ANFIS models.
Development of Artificial Neuro-Fuzzy Interface Model
Likewise, before the execution of the ANFIS algorithm, the fitting parameters were provided, which include the function used for the activation of the ANFIS algorithm, the number of epochs, and the maximum number of repetitions. Table 3 displays the detailed description of these parameters. Similarly, for the execution of the ANFIS algorithm, MATLAB software is utilized.
Development of Gene Expression Programming Model
The three groups of fitting parameters are used in the development of the GEP model. These are the ordinary model parameters, the numerical constants, and the genetic operators. The ordinary parameters include the population size, that is, the number of chromosomes, the number of genes, the connecting function, the head size, and the set of functions. The numerical constants cover the number of constants used per each gene, the type of data, and its lower and upper bound. The genetic operators involve the mutation rate, transposition function for root insertion sequence (RIS) and insertion sequence (IS), and rate of recombination for combining and splitting two chromosomes. To achieve a generous algorithm, the setting parameter setting suggested in the previous study has been utilized (Iqbal et al., 2020). Table 4 shows the detailed description of GEP setting parameters. GeneXproTool has been utilized to run the GEP-based algorithm.
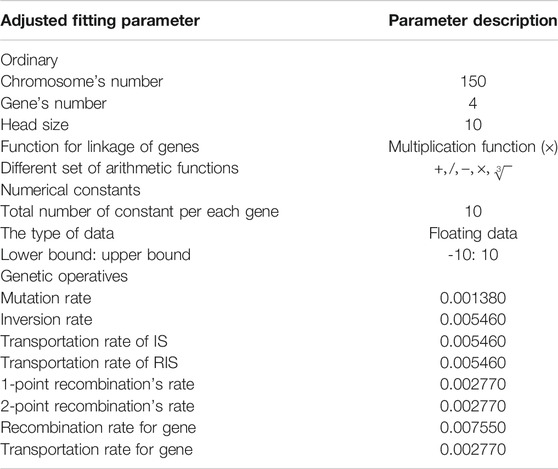
TABLE 4. Setting of fitted parameters for the GEP model.
Model Performance Evaluation Criteria
Generally, the coefficient of correlation (R) is utilized to study the performance and operation of the models. Because of the insensitivity of R in relation to division and multiplication of response to the constants, it cannot be exclusively chosen to judge the accuracy and precision of the model (Babanajad et al., 2017). Thus, this research study also considers the evaluation of the models via various statistical error parameters, that is, the relative squared error (RSE), root mean squared error (RMSE), mean absolute error (MSE), relative root mean squared error (RRMSE), and the performance index
In the above expressions, here,
K-Fold Cross-Validation Model
Cross-validation (CV) is the technique generally considered for the judgment of the performance and flexibility of the machine learning model, while statistical analysis generalizes to an independent dataset. There are various types of CV techniques, for example, bootstrapping, Jack Knife test, disjoint sets test, three-way split test, and Monte Carlo test. (Saud et al., 2020). The k-fold cross-validation (CV) is carried out to minimize the sampling bias and overfitting issue.
In this research k-fold, CV algorithm is used which is Jack Knife’s test part. The k-fold CV is the technique used to judge the working of the model, which splits the whole dataset into “k” equal subsets. In which, k-1 subsets are used for data training and one subset is hold out which is used for validation or testing with other datasets (Saud et al., 2020). In the k-fold CV technique, the entire procedure is recurring k-times through varying the testing and training data samples. Furthermore, the finest model is chosen via finding minimal error based on different error approximation statistics. The effectiveness of CV is that the entire instances are utilized for training and validation of the model, and every instance is once utilized for the validation purpose. The steps involved in the k-fold CV are as follows:
• Splitting the whole dataset into “k” number of equal parts, known as folds.
• Among “k” folds, one-fold is chosen for testing purposes and “k-1” folds are saved for training purposes.
• The model is fitted upon train folds and predicted upon test fold. This recurs for all the folds.
• For the prediction of the best model, the error is estimated via statistical checks like correlation coefficient (R) and root mean squared error (RMSE). Further, the best coefficient value that corresponds to lesser error is selected.
Kohavi (Kohavi, 1995) reported that the ten-fold CV algorithm provides reliable variance with reduced computational complexity. The whole dataset comprises of 298 instances that are divided into ten-folds. Nine-folds are utilized for training various models. One-fold is held to test against the best coefficient value provided by nine-folds. The entire process is recurred 10 times as the validation is to be executed the number of generations the data are divided. Among the 10 coefficient values, the best coefficient which displays minimal RMSE value is chosen. The flow diagram of the whole k-fold CV is shown in Figure 4.
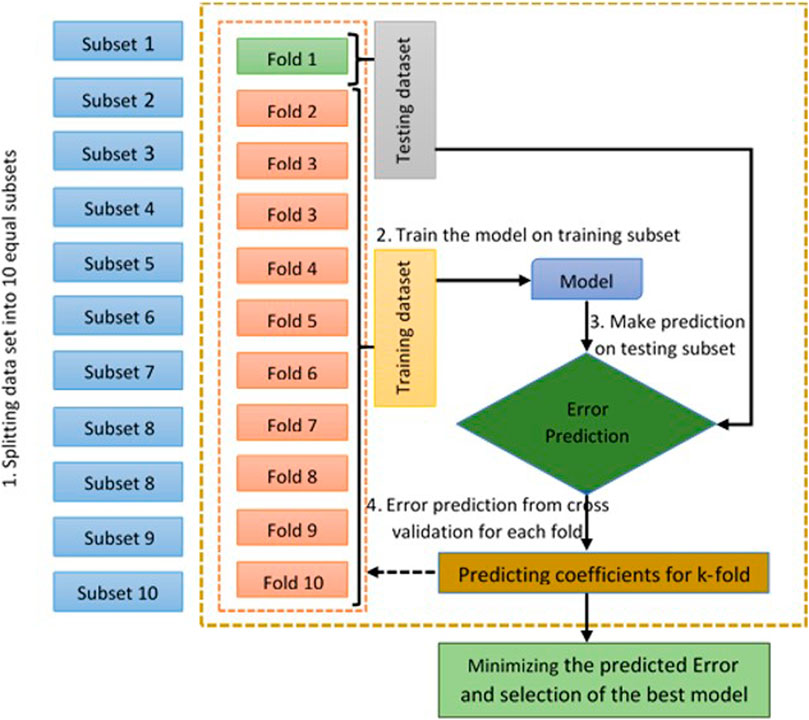
FIGURE 4. Flow diagram of K-fold cross-validation.
Results and Discussion
Performance Assessment of Artificial Neural Network Model
The ANN has its importance in resolving a complex engineering problem. It is initially developed for predicting the models for complicated procedures that are nonlinear in nature. The simulation of the process requires input parameters (garbage in) to predict the output (garbage out). The ultimate results of the ANN predictive model are presented in Figure 5, which shows the slope of the regression lines for training and validation data points, that is, 0.9715 and 0.9762, respectively, (see Figures 5A,B) displays the dispersion of absolute error for the whole dataset utilized in ANN modeling. The percentage of average error and maximum percentage of error come out to be 9.83 and 14.67%, respectively. Nearly 80% of the data points have error values less than 10%. The hidden layers of ANN are like a black box, and it is very hard to find a proposed equation.
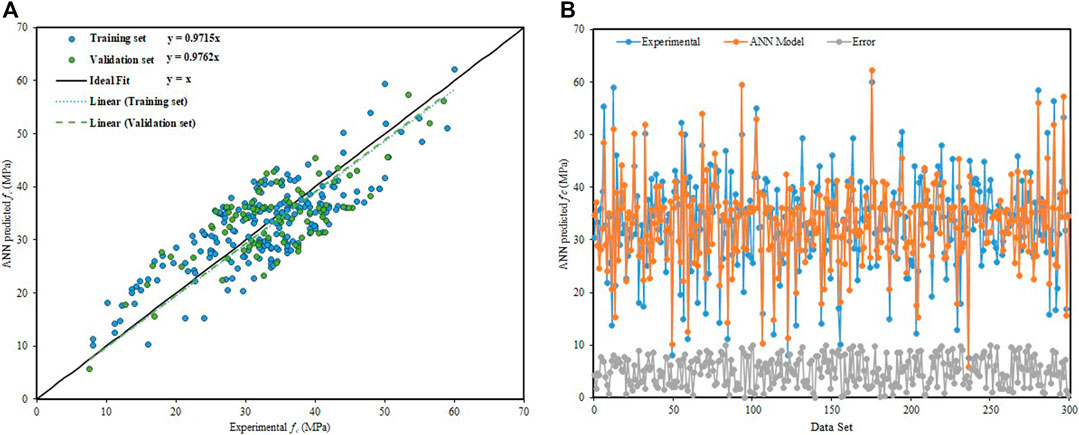
FIGURE 5. ANN model predictive results. (A) Regression line slope of the ANN model. (B) Dispersion of absolute error values of the ANN model.
Performance Assessment of Artificial Neuro-Fuzzy Interface Model
In fuzzy system works on fuzzy reasoning and IF–THEN rules, ANFIS is a more powerful tool which is a combination of fuzzy logic and neural network. Figure 6A depicts that the slope of the regression line in the training and validation stage is 0.9949 and 1.000, respectively, which defines a strong correlation between ANFIS predicted outcome values and experimental outputs of
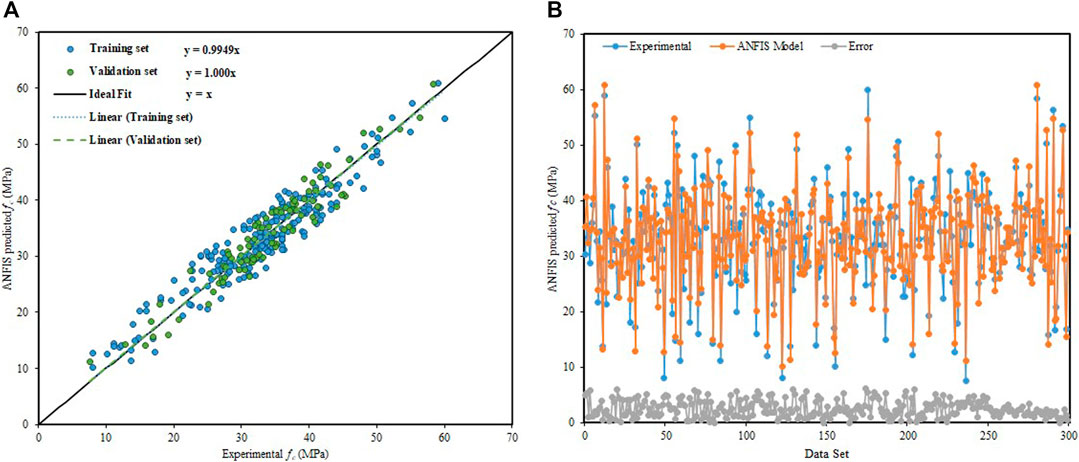
FIGURE 6. ANFIS model predictive results. (A) Regression line slope of the ANFIS model. (B) Dispersion of absolute error values of the ANFIS model.
Gene Expression Programming–Based Empirical Equation
As presented in Figure 7, GEP provides an expression tree (ET) with four sub-ETs, which is translated to have empirical relation for the prediction of compressive strength
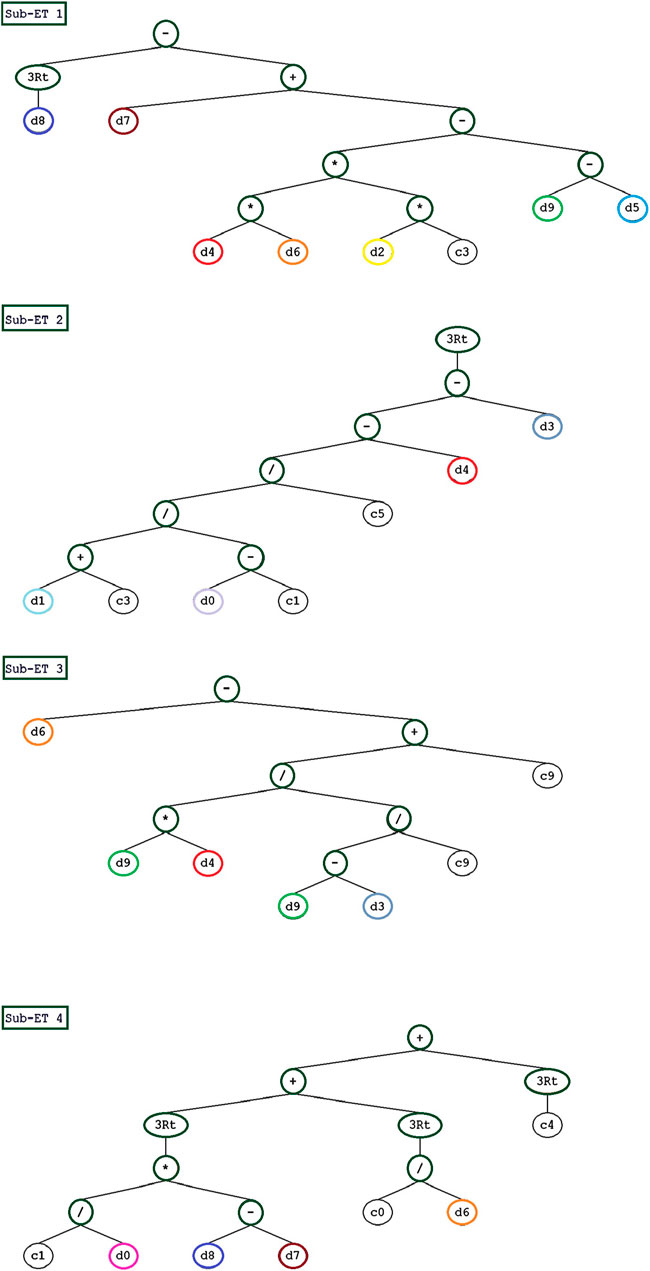
FIGURE 7. Expression trees (ETs) of the GEP model.
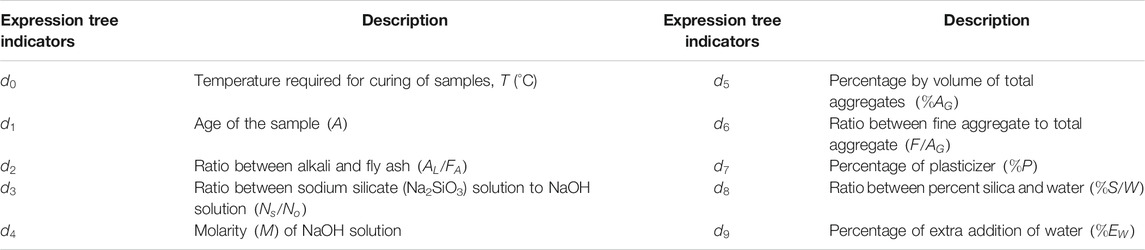
TABLE 5. Description of indicators used in expression tree of the GEP model.
Performance Assessment of Gene Expression Programming Model
Figure 8A presents a strong correlation via the slope of the regression line between the predicted results of the GEP model and experimental values. From the training instances and validation instances, the regression line slope is calculated as 1.000 and 0.9892, respectively. The distribution of absolute error values between experimental and targeted outcomes is shown in Figure 8B. The maximum error percentage and the average percentage of absolute error are quite closer, that is, 8.32 and 6.47%, respectively. In comparison with ANN, the occurrence of maximum absolute error values is quite lesser. In the validation stage, 90% of data points of GEP predicted values have an error lower than 10%, with an average percent error lesser than 5.560%. ANFIS gives an outstanding performance as compared to GEP, but it fails in providing a flexible and simplistic empirical equation for future use.
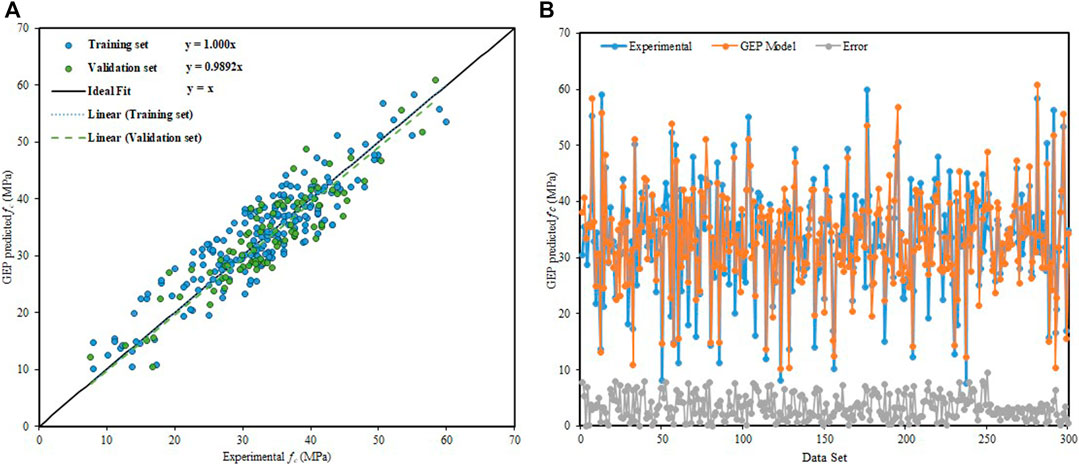
FIGURE 8. GEP model predictive results. (A) Regression line slope of the GEP model. (B) Dispersion of absolute error values of the GEP model.
Statistics and External Verification of Artificial Neural Network, Artificial Neuro-Fuzzy Interface, and Gene Expression Programming Models
The statistics considered in this study for the error analysis of training and validation sets of ANN, ANFIS, and GEP models are shown in Table 6. The results indicate that all three models performed effectively, giving lesser error values. This shows the robust correlation between models predicted outcomes and experimental values. Among all the three models, ANFIS gives an outstanding performance followed by GEP and ANN models. In ANFIS, for the training instances, the MAE, RMSE, RSE, and R equal 3.286, 4.086, 0.294, and 0.9256, respectively, and measured as 2.084, 2.593, 0.0493, and 0.9783 for the validation instances. While for GEP, these values come out to be 5.823, 5.971, 0.325, and 0.8586 for the training instances, respectively, and 2.057, 2.643, 0.0675, and 0.9643 for the validation instances. The consistency of the GEP model is dependent on the number of data points in the dataset. The literature reveals that for the development of a reliable and consistent GEP model, the minimum value of the ratio between total number of instances and the total input variable must 3 (Gandomi and Roke, 2015). This study uses a higher value equal to 30 which comes from 298 data points and 10 input variables. Thus, as compared to ANN, an accurate and reliable GEP predictive model has been accomplished. In general, GEP modeling is preferred over ANFIS and ANN as it provides an empirical relation between the input variables and the response. However, ANN and ANFIS fail in providing an empirical relationship due to its complex architecture. As presented in Table 6, the performance index
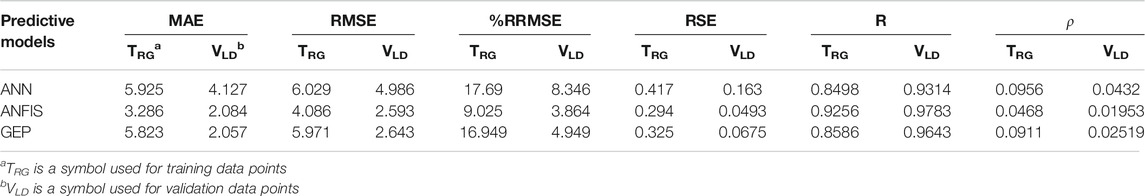
TABLE 6. Statistics of ANN, ANFIS, and GEP models.
The predicted results of all three models are also verified through the statistical checks suggested in the literature. The inclination (slope) of the regression line, that is,
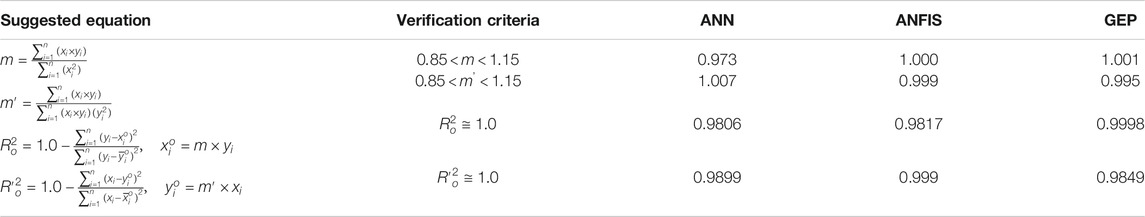
TABLE 7. Verification of ANN, ANFIS, and GEP models via criteria suggested in the literature.
Comparison Between Artificial Neural Network, Artificial Neuro-Fuzzy Interface, and Gene Expression Programming Models
Figure 9 illustrates the comparison of the output proposed via ANN, ANFIS, and GEP models, for both the training and validation phases. It shows that all the models can capture the output precisely within an acceptable range of error. The performance index
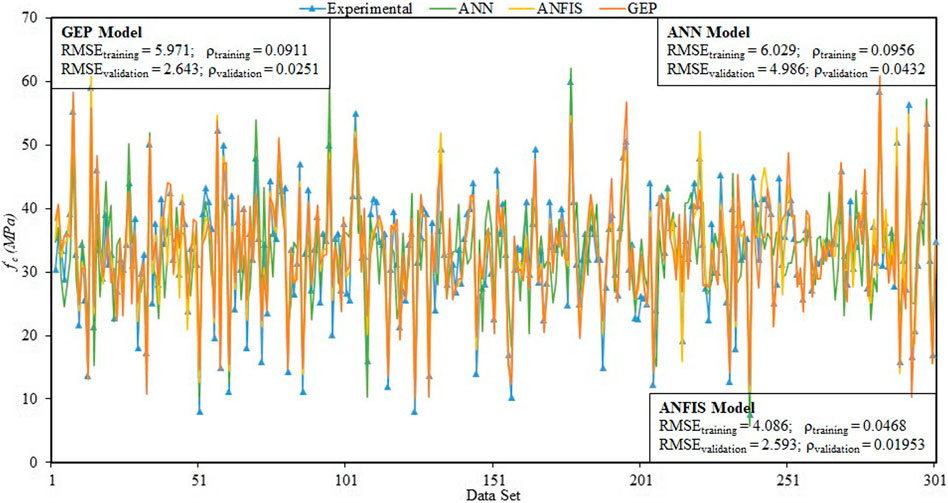
FIGURE 9. Comparison between the predicted compressive strength via ANN, ANFIS, and GEP models.
K-Fold Cross-Validation of the Gene Expression Programming Model
Validation of the model is of great importance in machine learning, to test the performance and generalization ability of the model and to assure the optimal accuracy of the model. CV is conducted via k-fold CV algorithm, to improve the robustness, reliability, and effectiveness of the developed GEP model. The fluctuation in the selected statistical performance, that is, R and RMSE are shown in Figure 10. The maximum, minimum, and mean values of R for the predictive model are 0.9723, 0.8706, and 0.9239, respectively, and 9.5031, 4.4537, and 6.9605 for RMSE, respectively. While the standard deviations of R and RMSE are 0.0328 and 1.5173, respectively. Based on the mentioned statistical indicators, the results of k-fold cross-validation confirm the generalization capacity and accurateness of the predictive model.

FIGURE 10. K-fold cross-validation results for the GEP model. (A) Coefficient of correlation (R). (B) Root mean square error (RMSE).
Sensitivity and Parametric Analysis
In this study, sensitivity analysis (SA) is conducted using GEP model outputs. The purpose is to assess the comparative contribution of all the ten explanatory variables utilized for the estimation of compressive strength
Here,
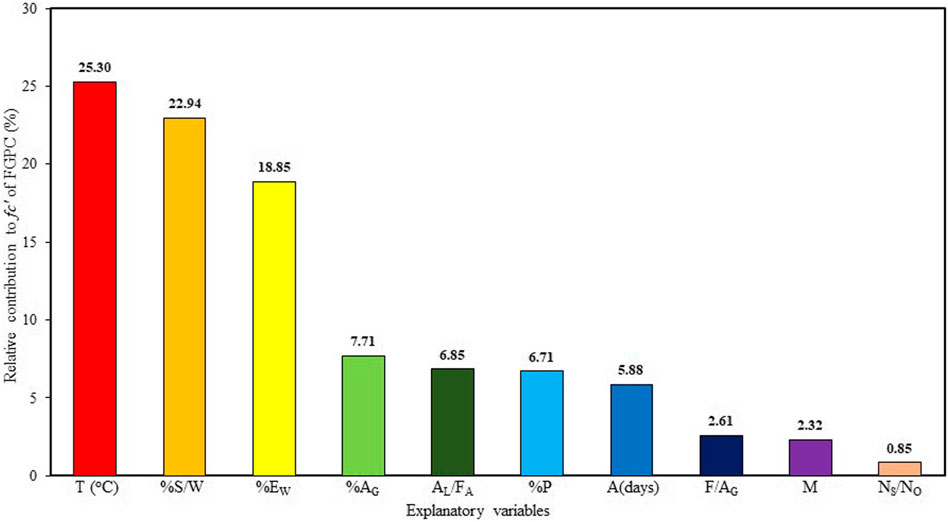
FIGURE 11. Percentage of the comparative contribution of input variables.
In this research, a parametric study is also conducted via GEP model outcomes (using Equation 16), to assess the trend of predicted
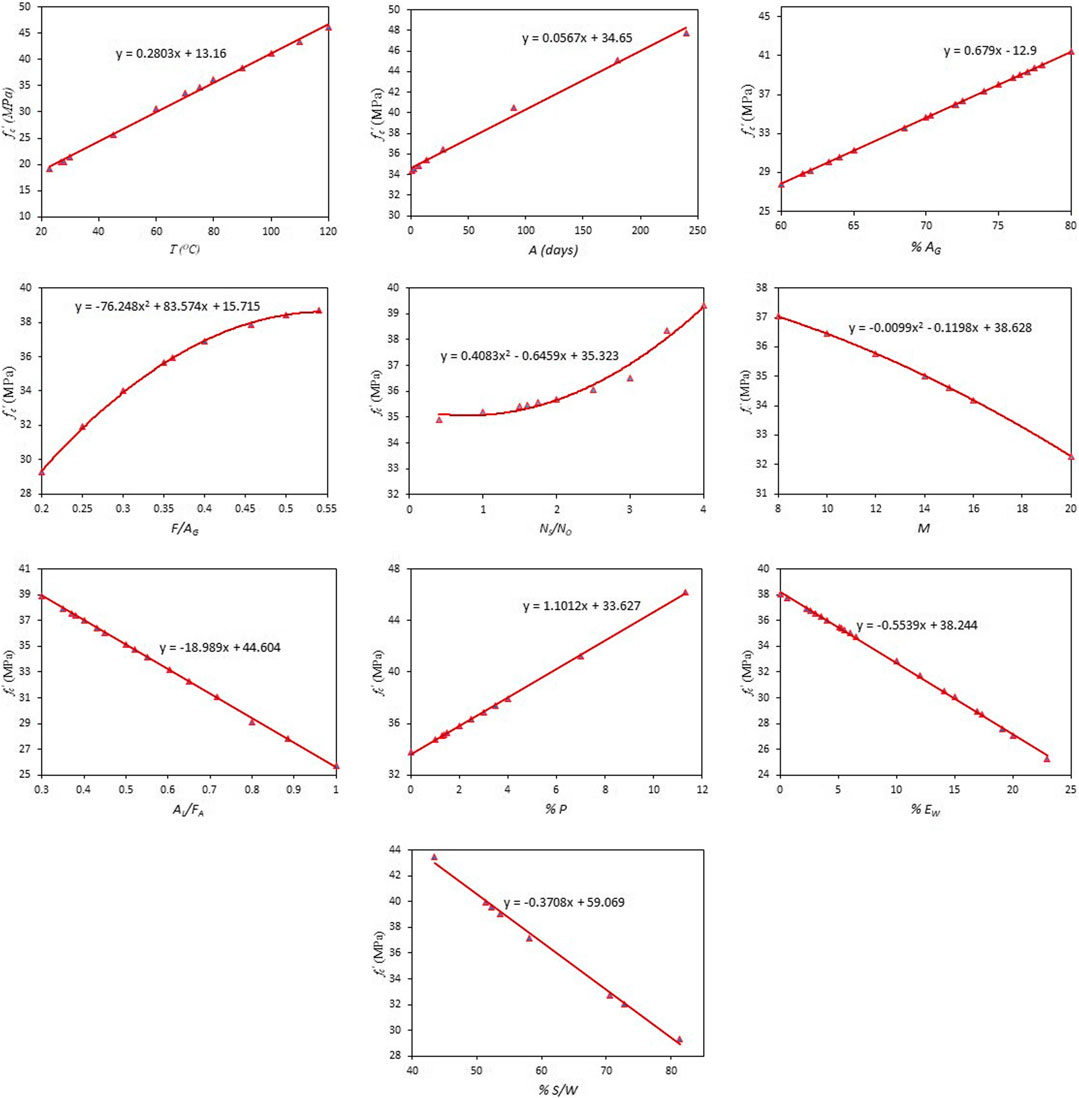
FIGURE 12. Change in compressive strength by changing input variables.
In working with GPC, the initial temperature
In the production of FGPC, alkaline solution releases hydroxides and silicates, which creates polymers of alumina silicates. Extra heat is required to expedite its reaction with the source substance and to enhance the
The effect of molarity
To accomplish a high workable FGPC mix and to prevent cracking, the addition of extra water and plasticizer is required (Nuruddin et al., 2011a). Figure 11 displays that the inclusion of plasticizers or extra addition of water
The parametric and sensitivity analysis accurately capture the effect of all input parameters considered in the establishment of machine learning models for the prediction of
Conclusion
In this study, the three AI techniques, namely, ANN, ANFIS, and GEP are used for estimating the compressive strength
However, it is highly suggested to conduct the leachate study, before the addition of fly ash (FA) as geopolymer material. This study offers a practical and effective base for the use of hazardous FA in concrete, as a substitute for discarding into landfills. This would eventually step toward viable, sustainable, and efficient construction with reduced greenhouse gases and lesser utilization of energy. In terms of disposal cost of FA and carbon credit, it would increase the economy of a country.
Data Availability Statement
The raw data supporting the conclusion of this article will be made available by the authors, without undue reservation.
Author Contributions
MAK: methodology, software, data curation, and writing –original draft; AZ: supervision, funding acquisition and project administration; FF: investigation, writing –review and editing; MFJ: conceptualization, software, writing –review and editing; RA: resources and validation; HA: visualization and resources; MIK: resources and formal analysis.
Funding
This research was supported by the deanship of scientific research at Prince Sattam Bin Abdulaziz University under the research project number 2020/01/16810 and was also followed by the National University of science and technology (NUST), Islamabad, Pakistan.
Conflict of Interest
The authors declare that the research was conducted in the absence of any commercial or financial relationships that could be construed as a potential conflict of interest.
References
Ahmadi-Nedushan, B. (2012). Prediction of elastic modulus of normal and high strength concrete using ANFIS and optimal nonlinear regression models. Construction Building Mater. 36, 665–673. doi:10.1016/j.conbuildmat.2012.06.002
Akande, O., Owolabi, K., O. T., Twaha, S., and Olatunji, S. O. (2014). Performance comparison of SVM and ANN in predicting compressive strength of concrete. IOSR J. Comput. Eng. 16, 88–94. doi:10.9790/0661-16518894
Akbar, A., Farooq, F., Shafique, M., Aslam, F., Alyousef, R., and Alabduljabbar, H. (2021). Sugarcane bagasse ash-based engineered geopolymer mortar incorporating propylene fibers. J. Building Eng. 33, 101492. doi:10.1016/j.jobe.2020.101492
Akbar, A., and Liew, K. M. (2020). Assessing recycling potential of carbon fiber reinforced plastic waste in production of eco-efficient cement-based materials. J. Clean. Prod. 274, 123001. doi:10.1016/j.jclepro.2020.123001
Akbar, A., Liew, K. M., Farooq, F., and Khushnood, R. A. (2020). Exploring mechanical performance of hybrid MWCNT and GNMP reinforced cementitious composites. Constr. Build. Mater. 267, 120721. doi:10.1016/j.conbuildmat.2020.120721
Alavi, A. H., Ameri, M., Gandomi, A. H., and Mirzahosseini, M. R. (2011). Formulation of flow number of asphalt mixes using a hybrid computational method. Construction Building Mater. 25, 1338–1355. doi:10.1016/j.conbuildmat.2010.09.010
Alavi, A. H., and Gandomi, A. H. (2011). Prediction of principal ground-motion parameters using a hybrid method coupling artificial neural networks and simulated annealing. Comput. Structures 89, 2176–2194. doi:10.1016/j.compstruc.2011.08.019
Albitar, M., Visintin, P., Mohamed Ali, M. S., and Drechsler, M. (2015). Assessing behaviour of fresh and hardened geopolymer concrete mixed with class-F fly ash. KSCE J. Civ. Eng. 19, 1445–1455. doi:10.1007/s12205-014-1254-z
Aliabdo, A. A., Abd Elmoaty, A. E. M., and Salem, H. A. (2016). Effect of cement addition, solution resting time and curing characteristics on fly ash based geopolymer concrete performance. Construction Building Mater. 123, 581–593. doi:10.1016/j.conbuildmat.2016.07.043
Alkroosh, I. S., and Sarker, P. K. (2019). Prediction of the compressive strength of fly ash geopolymer concrete using gene expression programming. Comput. Concr. 24, 295–302. doi:10.12989/cac.2019.24.4.295
Aprianti S, E. (2017). A huge number of artificial waste material can be supplementary cementitious material (SCM) for concrete production - a review part II. J. Clean. Prod. 142, 4178–4194. doi:10.1016/j.jclepro.2015.12.115
Aslam, F., Farooq, F., Amin, M. N., Khan, K., Waheed, A., Akbar, A., et al. (2020). Applications of gene expression programming for estimating compressive strength of high-strength concrete. Adv. Civil Eng. 2020, 1–23. doi:10.1155/2020/8850535
Assi, L. N., Deaver, E., Elbatanouny, M. K., and Ziehl, P. (2016). Investigation of early compressive strength of fly ash-based geopolymer concrete. Construction Building Mater. 112, 807–815. doi:10.1016/j.conbuildmat.2016.03.008
Babanajad, S. K., Gandomi, A. H., and Alavi, A. H. (2017). New prediction models for concrete ultimate strength under true-triaxial stress states: an evolutionary approach. Adv. Eng. Softw. 110, 55–68. doi:10.1016/j.advengsoft.2017.03.011
Bachir, R., Sidi Mohammed, A. M., and Habib, T. (2018). Using artificial neural networks approach to estimate compressive strength for rubberized concrete. Period. Polytech. Civil Eng. 62, 858–865. doi:10.3311/PPci.11928
Bajpai, R., Choudhary, K., Srivastava, A., Sangwan, K. S., and Singh, M. (2020). Environmental impact assessment of fly ash and silica fume based geopolymer concrete. J. Clean. Prod. 254, 120147. doi:10.1016/j.jclepro.2020.120147
Beheshti Aval, S. B., Ketabdari, H., and Asil Gharebaghi, S. (2017). Estimating shear strength of short rectangular reinforced concrete columns using nonlinear regression and gene expression programming. Structures 12, 13–23. doi:10.1016/j.istruc.2017.07.002
Behnia, D., Ahangari, K., Noorzad, A., and Moeinossadat, S. R. (2013). Predicting crest settlement in concrete face rockfill dams using adaptive neuro-fuzzy inference system and gene expression programming intelligent methods. J. Zhejiang Univ. Sci. A. 14, 589–602. doi:10.1631/jzus.A1200301
Carlson, C. L., and Adriano, D. C. (1993). Environmental impacts of coal combustion residues. J. Environ. Qual. 22, 227–247. doi:10.2134/jeq1993.00472425002200020002x
Çaydaş, U., Hasçalik, A., Ekici, S., Hasçalık, A., and Ekici, S. (2009). An adaptive neuro-fuzzy inference system (ANFIS) model for wire-EDM. Expert Syst. Appl. 36, 6135–6139. doi:10.1016/j.eswa.2008.07.019
Chen, L., Wang, L., Cho, D.-W., Tsang, D. C. W., Tong, L., Zhou, Y., et al. (2019). Sustainable stabilization/solidification of municipal solid waste incinerator fly ash by incorporation of green materials. J. Clean. Prod. 222, 335–343. doi:10.1016/j.jclepro.2019.03.057
Chou, J.-S., and Pham, A.-D. (2013). Enhanced artificial intelligence for ensemble approach to predicting high performance concrete compressive strength. Construction Building Mater. 49, 554–563. doi:10.1016/j.conbuildmat.2013.08.078
Dao, D., Ly, H.-B., Trinh, S., Le, T.-T., and Pham, B. (2019). Artificial intelligence approaches for prediction of compressive strength of geopolymer concrete. Materials 12, 983. doi:10.3390/ma12060983
Deb, P. S., Nath, P., and Sarker, P. K. (2013a). Properties of fly ash and slag blended geopolymer concrete cured at ambient temperature, In S. Yazdani, and A. Singh (ed) ISEC 2013 - 7th International Structural Engineering and Construction Conference, Manoa, Honolulu, Jun 18-23 2013, 571–576. doi:10.3850/978-981-07-5354-2-M-55-433
Deb, P. S., Sarker, P. K., and Nath, P. (2013b). Sulphate resistance of slag blended fly ash based geopolymer concrete, In V. Dao, and P. Dux (ed) Proceedings of the 26th Biennial National Conference of the Concrete Institute Australia: Understanding Concrete, Gold Coast, QLD, Australia, Oct 16-18 2013
del Viso, J. R., Carmona, J. R., and Ruiz, G. (2008). Shape and size effects on the compressive strength of high-strength concrete. Cement Concrete Res. 38, 386–395. doi:10.1016/j.cemconres.2007.09.020
Dwivedi, A., and Jain, M. K. (2014). Fly ash – waste management and overview : a Review. Recent Res. Sci. Technol. 6, 30–35.
Emamian, S. A., and Eskandari-Naddaf, H. (2019). Effect of porosity on predicting compressive and flexural strength of cement mortar containing micro and nano-silica by ANN and GEP. Construction Building Mater. 218, 8–27. doi:10.1016/j.conbuildmat.2019.05.092
Fareed Ahmed, M., Fadhil Nuruddin, M., and Shafiq, N. (2011). Compressive strength and workability characteristics of low-calcium fly ash-based self-compacting geopolymer concrete. World Acad. Sci. Eng. Technol. 74, 8–14.
Farooq, F., Ahmed, W., Akbar, A., Aslam, F., and Alyousef, R. (2021). Predictive modeling for sustainable high-performance concrete from industrial wastes: a comparison and optimization of models using ensemble learners. J. Clean. Prod. 292, 126032. doi:10.1016/j.jclepro.2021.126032
Farooq, F., Akbar, A., Khushnood, R. A., Muhammad, W. L. B., Rehman, S. K. U., and Javed, M. F. (2020a). Experimental investigation of hybrid carbon nanotubes and graphite nanoplatelets on rheology, shrinkage, mechanical, and microstructure of SCCM. Materials 13, 230. doi:10.3390/ma13010230
Farooq, F., Nasir Amin, M., Khan, K., Rehan Sadiq, M., Faisal Javed, M. F., Aslam, F., et al. (2020b). A comparative study of random forest and genetic engineering programming for the prediction of compressive strength of high strength concrete (HSC). Appl. Sci. 10, 7330–7418. doi:10.3390/app10207330
Farooq, F., Rahman, S. K. U., Akbar, A., Khushnood, R. A., Javed, M. F., alyousef, R., et al. (2020c). A comparative study on performance evaluation of hybrid GNPs/CNTs in conventional and self-compacting mortar. Alexandria Eng. J. 59, 369–379. doi:10.1016/j.aej.2019.12.048
Ferreira, C. (2006). Gene expression programming mathematical modeling by an artificial intelligence, Berlin, Heidelberg: Springer.
Galvin, B., Lloyd, N., and Lecturer, S. (1978). Fly ash based geopolymer concrete with recycled concrete aggregate, Perth, Australia: Curtin University.
Gandomi, A. H., Alavi, A. H., Mirzahosseini, M. R., and Nejad, F. M. (2011). Nonlinear genetic-based models for prediction of flow number of asphalt mixtures. J. Mater. Civ. Eng. 23, 248–263. doi:10.1061/(ASCE)MT.1943-5533.0000154
Gandomi, A. H., Babanajad, S. K., Alavi, A. H., and Farnam, Y. (2012). Novel approach to strength modeling of concrete under triaxial compression. J. Mater. Civ. Eng. 24, 1132–1143. doi:10.1061/(ASCE)MT.1943-5533.0000494
Gandomi, A. H., and Roke, D. A. (2015). Assessment of artificial neural network and genetic programming as predictive tools. Adv. Eng. Softw. 88, 63–72. doi:10.1016/j.advengsoft.2015.05.007
Gandomi, A. H., Yun, G. J., and Alavi, A. H. (2013). An evolutionary approach for modeling of shear strength of RC deep beams. Mater. Struct. 46, 2109–2119. doi:10.1617/s11527-013-0039-z
Ganesan, N., Abraham, R., and Deepa Raj, S. (2015). Durability characteristics of steel fibre reinforced geopolymer concrete. Construction Building Mater. 93, 471–476. doi:10.1016/j.conbuildmat.2015.06.014
Getahun, M. A., Shitote, S. M., and Abiero Gariy, Z. C. (2018). Artificial neural network based modelling approach for strength prediction of concrete incorporating agricultural and construction wastes. Construction Building Mater. 190, 517–525. doi:10.1016/j.conbuildmat.2018.09.097
Ghazali, N., Muthusamy, K., and Wan Ahmad, S. (2019). Utilization of fly ash in construction, in IOP conference series: materials science and engineering. Bristol, UK: Institute of Physics Publishing. doi:10.1088/1757-899X/601/1/012023
Gholampour, A., Gandomi, A. H., and Ozbakkaloglu, T. (2017). New formulations for mechanical properties of recycled aggregate concrete using gene expression programming. Construction Building Mater. 130, 122–145. doi:10.1016/j.conbuildmat.2016.10.114
Gülşan, M. E., Alzeebaree, R., Rasheed, A. A., Niş, A., and Kurtoğlu, A. E. (2019). Development of fly ash/slag based self-compacting geopolymer concrete using nano-silica and steel fiber. Constr. Build. Mater. 211, 271–283. doi:10.1016/j.conbuildmat.2019.03.228
Hamad, A. J. (2017). Size and shape effect of specimen on the compressive strength of HPLWFC reinforced with glass fibres. J. King Saud Univ. - Eng. Sci. 29, 373–380. doi:10.1016/j.jksues.2015.09.003
Hammoudi, A., Moussaceb, K., Belebchouche, C., and Dahmoune, F. (2019). Comparison of artificial neural network (ANN) and response surface methodology (RSM) prediction in compressive strength of recycled concrete aggregates. Construction Building Mater. 209, 425–436. doi:10.1016/j.conbuildmat.2019.03.119
Hardjito, D., and Rangan, B. V. (2005). Development and properties of low-calcium fly ash-based geopolymer concrete, Perth, Australia: Curtin University of Technology
Iqbal, M. F., Liufeng, Q.-f., Azim, I., Azim, X., Yang, J., Javed, M. F., et al. (2020). Prediction of mechanical properties of green concrete incorporating waste foundry sand based on gene expression programming. J. Hazard. Mater. 384, 121322. doi:10.1016/j.jhazmat.2019.121322
Ishak, S., Lee, H. S., Singh, J. K., Ariffin, M. A. M., Lim, N. H. A. S., and Yang, H. M. (2019). Performance of fly ash geopolymer concrete incorporating bamboo ash at elevated temperature. Materials 12, 3404. doi:10.3390/ma12203404
Jaafari, A., Panahi, M., Pham, B. T., Shahabi, H., Bui, D. T., Rezaie, F., et al. (2019). Meta optimization of an adaptive neuro-fuzzy inference system with grey wolf optimizer and biogeography-based optimization algorithms for spatial prediction of landslide susceptibility. Catena 175, 430–445. doi:10.1016/j.catena.2018.12.033
Javed, M. F., Amin, M. N., Shah, M. I., Khan, K., Iftikhar, B., Farooq, F., et al. (2020a). Applications of gene expression programming and regression techniques for estimating compressive strength of bagasse ash based concrete. Crystals 10, 737–817. doi:10.3390/cryst10090737
Javed, M. F., Farooq, F., Memon, S. A., Akbar, A., Khan, M. A., Aslam, F., et al. (2020b). New prediction model for the ultimate axial capacity of concrete-filled steel tubes: an evolutionary approach. Crystals 10, 741. doi:10.3390/cryst10090741
Jena, S., Panigrahi, R., and Sahu, P. (2019). Mechanical and durability properties of fly ash geopolymer concrete with silica fume. J. Inst. Eng. India Ser. A. 100, 697–705. doi:10.1007/s40030-019-00400-z
Joseph, B., and Mathew, G. (2012). Influence of aggregate content on the behavior of fly ash based geopolymer concrete. Scientia Iranica 19, 1188–1194. doi:10.1016/j.scient.2012.07.006
Kohavi, R. (1995). A study of cross-validation and bootstrap for accuracy estimation and model selection. Int. Jt. Conf. Artif. Intell. Available at: http://robotics.stanford.edu/∼ronnyk (Accessed January 2, 2021)
Kondepudi, K., and Subramaniam, K. V. L. (2019). Rheological characterization of low-calcium fly ash suspensions in alkaline silicate colloidal solutions for geopolymer concrete production. J. Clean. Prod. 234, 690–701. doi:10.1016/j.jclepro.2019.06.124
Koza, J. R., and Poli, R. (2005). Genetic programming. Search methodologies: introductory tutorials in optimization and decision support techniques (Boston, MA: Springer), 127–164. doi:10.1007/0-387-28356-0_5
Kumar Tiwari, M., Bajpai, S., and Kumar Dewangan, U. (2016). Fly ash utilization: a brief review in Indian context. Int. Res. J. Eng. Technol. 3, 949-956.
Kusbiantoro, A., Nuruddin, M. F., Shafiq, N., and Qazi, S. A. (2012). The effect of microwave incinerated rice husk ash on the compressive and bond strength of fly ash based geopolymer concrete. Construction Building Mater. 36, 695–703. doi:10.1016/j.conbuildmat.2012.06.064
Lavanya, G., and Jegan, J. (2015). Evaluation of relationship between split tensile strength and compressive strength for geopolymer concrete of varying grades and molarity. Int. J. Appl. Eng. Res. 10, 35523–35529. http://www.ripublication.com.
Liew, K. M., and Akbar, A. (2020). The recent progress of recycled steel fiber reinforced concrete. Construction Building Mater. 232, 117232. doi:10.1016/j.conbuildmat.2019.117232
Lokuge, W., Wilson, A., Gunasekara, C., Law, D. W., and Setunge, S. (2018). Design of fly ash geopolymer concrete mix proportions using Multivariate Adaptive Regression Spline model. Construction Building Mater. 166, 472–481. doi:10.1016/j.conbuildmat.2018.01.175
Long, T., Shi, X. S., Wang, Q. Y., and Li, L. (2013). Mechanical properties and microstructure of fly ash based geopolymeric polymer recycled concrete. Sichuan Daxue Xuebao (Gongcheng Kexue Ban)/journal Sichuan Univ. (Engineering Sci. Ed. 45, 43–47.
Luhar, S., Chaudhary, S., and Luhar, I. (2019). Development of rubberized geopolymer concrete: strength and durability studies. Construction Building Mater. 204, 740–753. doi:10.1016/j.conbuildmat.2019.01.185
Ly, H. B., Pham, B. T., Dao, D., Le, V. M., Le, L. M., and Le, T. T. (2019). Improvement of ANFIS model for prediction of compressive strength of manufactured sand concrete. Appl. Sci. 9, 3841. doi:10.3390/app9183841
Mashhadban, H., Kutanaei, S. S., and Sayarinejad, M. A. (2016). Prediction and modeling of mechanical properties in fiber reinforced self-compacting concrete using particle swarm optimization algorithm and artificial neural network. Construction Building Mater. 119, 277–287. doi:10.1016/j.conbuildmat.2016.05.034
Meesala, C. R., Verma, N. K., and Kumar, S. (2020). Critical review on fly‐ash based geopolymer concrete. Struct. Concrete 21, 1013–1028. doi:10.1002/suco.201900326
Mehta, A., and Siddique, R. (2017). Properties of low-calcium fly ash based geopolymer concrete incorporating OPC as partial replacement of fly ash. Construction Building Mater. 150, 792–807. doi:10.1016/j.conbuildmat.2017.06.067
Nadesan, M. S., and Dinakar, P. (2017). Mix design and properties of fly ash waste lightweight aggregates in structural lightweight concrete. Case Stud. Construction Mater. 7, 336–347. doi:10.1016/j.cscm.2017.09.005
Nath, P., and Sarker, P. K. (2017). Flexural strength and elastic modulus of ambient-cured blended low-calcium fly ash geopolymer concrete. Construction Building Mater. 130, 22–31. doi:10.1016/j.conbuildmat.2016.11.034
Nguyen, K. T., Nguyen, Q. D., Le, T. A., Shin, J., and Lee, K. (2020). Analyzing the compressive strength of green fly ash based geopolymer concrete using experiment and machine learning approaches. Construction Building Mater. 247, 118581. doi:10.1016/j.conbuildmat.2020.118581
Noori, R., Hoshyaripour, G., Ashrafi, K., and Araabi, B. N. (2010). Uncertainty analysis of developed ANN and ANFIS models in prediction of carbon monoxide daily concentration. Atmos. Environ. 44, 476–482. doi:10.1016/j.atmosenv.2009.11.005
Noushini, A., Castel, A., Aldred, J., and Rawal, A. (2020). Chloride diffusion resistance and chloride binding capacity of fly ash-based geopolymer concrete. Cement and Concrete Composites 105, 103290. doi:10.1016/j.cemconcomp.2019.04.006
Nuaklong, P., Jongvivatsakul, P., Pothisiri, T., Sata, V., and Chindaprasirt, P. (2020). Influence of rice husk ash on mechanical properties and fire resistance of recycled aggregate high-calcium fly ash geopolymer concrete. J. Clean. Prod. 252, 119797. doi:10.1016/j.jclepro.2019.119797
Nuaklong, P., Sata, V., and Chindaprasirt, P. (2016). Influence of recycled aggregate on fly ash geopolymer concrete properties. J. Clean. Prod. 112, 2300–2307. doi:10.1016/j.jclepro.2015.10.109
Nuruddin, M. F., Demie, S., and Shafiq, N. (2011a). Effect of mix composition on workability and compressive strength of self-compacting geopolymer concrete. Can. J. Civ. Eng. 38, 1196–1203. doi:10.1139/l11-077
Nuruddin, M. F., Qazi, S. A., Kusbiantoro, A., and Shafiq, N. (2011b). Utilisation of waste material in geopolymeric concrete. Proc. Inst. Civil Eng. - Construction Mater. 164, 315–327. doi:10.1680/coma.2011.164.6.315
Okoye, F. N., Durgaprasad, J., and Singh, N. B. (2015). Mechanical properties of alkali activated flyash/Kaolin based geopolymer concrete. Construction Building Mater. 98, 685–691. doi:10.1016/j.conbuildmat.2015.08.009
Olivia, M., and Nikraz, H. (2012). Properties of fly ash geopolymer concrete designed by Taguchi method. Mater. Des. (1980-2015) 36, 191–198. doi:10.1016/j.matdes.2011.10.036
Patankar, S. V., Ghugal, Y. M., and Jamkar, S. S. (2015). Mix design of fly ash based geopolymer concrete, in Advances in structural engineering: materials, New Delhi: Springer India, Vol 3, 1619–1634. doi:10.1007/978-81-322-2187-6_123
Patankar, S. V., Jamkar, S. S., and Ghugal, Y. M. (2013). Effect of water-to-geopolymer binder ratio on the production of fly ash based geopolymer concrete. Int. J. Adv. Technol. Civ. Eng., 79–83. doi:10.13140/2.1.4792.1284
Paulson, A. J., Prabhavathy, R. A., Rekh, S., and Brindha, E. (2019). Application of neural network for prediction of compressive strength of silica fume concrete. Int. J. Civ. Eng. Technol. 10, 1859 Available at: http://www.iaeme.com/IJCIET/index.asp1859http://www.iaeme.com/ijmet/issues.asp?JType=IJCIET&VType=10&IType=2. http://www.iaeme.com/IJMET/index.asp1860http://www.iaeme.com/IJCIET/issues.asp?JType=IJCIET&VType=10&IType=2 (Accessed January 31, 2021)
Prachasaree, W., Limkatanyu, S., Hawa, A., Sukontasukkul, P., and Chindaprasirt, P. (2020). Manuscript title: development of strength prediction models for fly ash based geopolymer concrete. J. Building Eng. 32, 101704. doi:10.1016/j.jobe.2020.101704
Rafieizonooz, M., Mirza, J., Salim, M. R., Hussin, M. W., and Khankhaje, E. (2016). Investigation of coal bottom ash and fly ash in concrete as replacement for sand and cement. Construction Building Mater. 116, 15–24. doi:10.1016/j.conbuildmat.2016.04.080
Ramujee, K., and Potharaju, M. (2017). Mechanical properties of geopolymer concrete composites. in Materials today: proceedings. Amsterdam, Netherlands: Elsevier Ltd, 2937–2945. doi:10.1016/j.matpr.2017.02.175
Sadrmomtazi, A., Sobhani, J., and Mirgozar, M. A. (2013). Modeling compressive strength of EPS lightweight concrete using regression, neural network and ANFIS. Construction Building Mater. 42, 205–216. doi:10.1016/j.conbuildmat.2013.01.016
Sadrossadat, E., Ghorbani, B., Hamooni, M., and Moradpoor Sheikhkanloo, M. H. (2018). Numerical formulation of confined compressive strength and strain of circular reinforced concrete columns using gene expression programming approach. Struct. Concrete 19, 783–794. doi:10.1002/suco.201700131
Safiuddin, M., Raman, S., Abdus Salam, M., and Jumaat, M. (2016). Modeling of compressive strength for self-consolidating high-strength concrete incorporating palm oil fuel ash. Materials 9, 396. doi:10.3390/ma9050396
Sandanayake, M., Gunasekara, C., Law, D., Zhang, G., Setunge, S., and Wanijuru, D. (2020). Sustainable criterion selection framework for green building materials - an optimisation based study of fly-ash Geopolymer concrete. Sustainable Mater. Tech. 25, e00178. doi:10.1016/j.susmat.2020.e00178
Saridemir, M. (2010). Genetic programming approach for prediction of compressive strength of concretes containing rice husk ash. Constr. Build. Mater. 24, 1911–1919. doi:10.1016/j.conbuildmat.2010.04.011
Sarker, P. K., Haque, R., and Ramgolam, K. V. (2013). Fracture behaviour of heat cured fly ash based geopolymer concrete. Mater. Des. 44, 580–586. doi:10.1016/j.matdes.2012.08.005
Sathanandam, T., Awoyera, P. O., Vijayan, V., and Sathishkumar, K. (2017). Low carbon building: experimental insight on the use of fly ash and glass fibre for making geopolymer concrete. Sustainable Environ. Res. 27, 146–153. doi:10.1016/j.serj.2017.03.005
Satpute, S., Shirasath, M., and Hake, S. (2016). Investigation of alkaline activators for fly-ash based geo-polymer concrete. Int. J. Adv. Res. Innov. Ideas Educ., 2 (5), 2395–4396.
Saud, S., Jamil, B., Upadhyay, Y., and Irshad, K. (2020). Performance improvement of empirical models for estimation of global solar radiation in India: a k-fold cross-validation approach. Sustainable Energ. Tech. Assessments 40, 100768. doi:10.1016/j.seta.2020.100768
Sebaaly, H., Varma, S., and Maina, J. W. (2018). Optimizing asphalt mix design process using artificial neural network and genetic algorithm. Construction Building Mater. 168, 660–670. doi:10.1016/j.conbuildmat.2018.02.118
Shaikh, F. U. A. (2016). Mechanical and durability properties of fly ash geopolymer concrete containing recycled coarse aggregates. Int. J. Sustainable Built Environ. 5, 277–287. doi:10.1016/j.ijsbe.2016.05.009
Shaikh, F. U. A., and Vimonsatit, V. (2015). Compressive strength of fly-ash-based geopolymer concrete at elevated temperatures. Fire Mater. 39, 174–188. doi:10.1002/fam.2240
Shehab, H. K., Eisa, A. S., and Wahba, A. M. (2016). Mechanical properties of fly ash based geopolymer concrete with full and partial cement replacement. Construction Building Mater. 126, 560–565. doi:10.1016/j.conbuildmat.2016.09.059
Sujatha, T., Kannapiran, K., and Nagan, S. (2012). Strength assessment of heat cured geopolymer concrete slender column. Asian J. Civ. Eng. 13, 635–646.
Sumajouw, M. D. J., and Rangan, . B. V. (2006). Low-Calcium fly ash-based geopolymer Concrete : reinforced beams and columns. Perth, Australia: Curtin University of Technology, 1–120.
Sumanth Kumar, B., Sen, A., and Rama Seshu, D. (2020). Shear strength of fly ash and GGBS based geopolymer concrete, in Lecture notes in civil engineering. Berlin, Germany: Springer, 105–117. doi:10.1007/978-981-15-3361-7_8
Thesis, A., Joseph, B., and Philosophy, D. O. F. (2015). Behaviour of geopolymer concrete exposed to elevated temperatures school of engineering, Kochi, India: Cochin University of Science and Technology, 682022
Tran, T. T., Pham, T. M., and Hao, H. (2019). Rectangular stress-block parameters for fly-ash and slag based geopolymer concrete. Structures 19, 143–155. doi:10.1016/j.istruc.2019.01.006
Van Jaarsveld, J. G. S., Van Deventer, J. S. J., and Lukey, G. C. (2002). The effect of composition and temperature on the properties of fly ash- and kaolinite-based geopolymers. Chem. Eng. J. 89, 63–73. doi:10.1016/S1385-8947(02)00025-6
Vora, P. R., and Dave, U. V. (2013). Parametric studies on compressive strength of geopolymer concrete. Proced. Eng. 51, 210–219. doi:10.1016/j.proeng.2013.01.030
Wang, L., Chen, L., Cho, D.-W., Tsang, D. C. W., Yang, J., Hou, D., et al. (2019a). Novel synergy of Si-rich minerals and reactive MgO for stabilisation/solidification of contaminated sediment. J. Hazard. Mater. 365, 695–706. doi:10.1016/j.jhazmat.2018.11.067
Wang, Q., Wang, D., and Chen, H. (2017). The role of fly ash microsphere in the microstructure and macroscopic properties of high-strength concrete. Cement and Concrete Composites 83, 125–137. doi:10.1016/j.cemconcomp.2017.07.021
Wang, Y., Hu, S., and He, Z. (2019b). Mechanical and fracture properties of fly ash geopolymer concrete addictive with calcium aluminate cement. Materials 12, 2982. doi:10.3390/ma12182982
Wardhono, A., Gunasekara, C., Law, D. W., and Setunge, S. (2017). Comparison of long term performance between alkali activated slag and fly ash geopolymer concretes. Construction Building Mater. 143, 272–279. doi:10.1016/j.conbuildmat.2017.03.153
Wongsa, A., Siriwattanakarn, A., Nuaklong, P., Sata, V., Sukontasukkul, P., Chindaprasirt, P., et al. (2020). Use of recycled aggregates in pressed fly ash geopolymer concrete. Environ. Prog. Sustainable Energ. 39. doi:10.1002/ep.13327
Wongsa, A., Zaetang, Y., Sata, V., and Chindaprasirt, P. (2016). Properties of lightweight fly ash geopolymer concrete containing bottom ash as aggregates. Construction Building Mater. 111, 637–643. doi:10.1016/j.conbuildmat.2016.02.135
Xie, J., Wang, J., Rao, R., Wang, C., and Fang, C. (2019). Effects of combined usage of GGBS and fly ash on workability and mechanical properties of alkali activated geopolymer concrete with recycled aggregate. Composites B: Eng. 164, 179–190. doi:10.1016/j.compositesb.2018.11.067
Yaseen, Z. M., Deo, R. C., Hilal, A., Abd, A. M., Bueno, L. C., Salcedo-Sanz, S., et al. (2018). Predicting compressive strength of lightweight foamed concrete using extreme learning machine model. Adv. Eng. Softw. 115, 112–125. doi:10.1016/j.advengsoft.2017.09.004
Zhang, H., Li, L., Sarker, P. K., Long, T., Shi, X., Wang, Q., et al. (2019). Investigating various factors affecting the long-term compressive strength of heat-cured fly ash geopolymer concrete and the use of orthogonal experimental design method. Int. J. Concr. Struct. Mater. 13. doi:10.1186/s40069-019-0375-7
Zhang, H. Y., Qiu, G. H., Kodur, V., and Yuan, Z. S. (2020a). Spalling behavior of metakaolin-fly ash based geopolymer concrete under elevated temperature exposure. Cement and Concrete Composites 106, 103483. doi:10.1016/j.cemconcomp.2019.103483
Keywords: geopolymer concrete, artificial neural network, adaptive neuro-fuzzy interface system, gene expression programming, k-fold cross-validation
Citation: Khan MA, Zafar A, Farooq F, Javed MF, Alyousef R, Alabduljabbar H and Khan MI (2021) Geopolymer Concrete Compressive Strength via Artificial Neural Network, Adaptive Neuro Fuzzy Interface System, and Gene Expression Programming With K-Fold Cross Validation. Front. Mater. 8:621163. doi: 10.3389/fmats.2021.621163
Received: 25 October 2020; Accepted: 19 February 2021;
Published: 03 May 2021.
Edited by:
Cristina Leonelli, University of Modena and Reggio Emilia, ItalyReviewed by:
Ping Duan, China University of Geosciences Wuhan, ChinaNeven Ukrainczyk, Darmstadt University of Technology, Germany
Qing-Feng Liu, Shanghai Jiao Tong University, China
Copyright © 2021 Khan, Zafar, Farooq, Javed, Alyousef, Alabduljabbar and Khan. This is an open-access article distributed under the terms of the Creative Commons Attribution License (CC BY). The use, distribution or reproduction in other forums is permitted, provided the original author(s) and the copyright owner(s) are credited and that the original publication in this journal is cited, in accordance with accepted academic practice. No use, distribution or reproduction is permitted which does not comply with these terms.
*Correspondence: Mohsin Ali Khan, moak.pg18mce@student.nust.edu.pk; Muhammad Faisal Javed, arbabfaisal@cuiatd.edu.pk