Eutrophication Amplifies the Diel Variability of Carbonate Chemistry in an Equatorial, Semi-Arid, and Negative Estuary
 Luiz C. Cotovicz Jr.
 Rozane V. Marins
 Agda Raquel Facundo da Silva
- Laboratory of Coastal Biogeochemistry (LBC), Institute of Marine Sciences (LABOMAR), Universidade Federal do Ceará, Fortaleza, Brazil
This study presents high-resolution data on diel variations of carbonate chemistry in a semi-arid estuary (Jaguaribe River) in NE Brazil, which has witnessed decreasing annual rainfall and freshwater inputs due to climate change and river damming. In addition, the estuary has been suffering with increasing discharges from shrimp farm and urban effluents. We monitored surface water and atmospheric CO2 partial pressure (pCO2), temperature, salinity, and wind speed with continuous real-time measurements during two eulerian surveys in October 2017 (33 h) and September 2018 (44 h), during spring tides in the dry season. Additionally, pH, total alkalinity (TA), dissolved inorganic carbon (DIC), carbonate (CO32–), and saturation state of calcite (Ωcal) and aragonite (Ωara) were monitored hourly. Higher salinity (>38) during ebb tides confirmed the hypersalinity and negative estuarine circulation. TA and DIC concentrations in the estuary were higher than in the adjacent coastal ocean due to evaporation, showing positive correlation with salinity and negative correlation with tidal height. Measured TA and DIC concentrations were slightly higher than those calculated by the conservative evaporation model, suggesting their production in the estuary by aerobic and anaerobic processes. CO32–, Ωcal, and Ωara showed a clear semi-diurnal (tidal-driven) and diel (24 h; biological-driven) patterns: lowest values occurred at flood tide during night-time (respectively, 185 μmol kg–1, 4.3 and 2.8), whereas highest occurred during ebb tide and daytime (respectively, 251 μmol kg–1, 5.7 and 3.8). DIC/TA ratios were higher at night-time supporting a diel control (linked to solar irradiance) of the carbonate buffering capacity. pCO2 was oversaturated comparing to the atmosphere (512–860 μatm) and the estuary was a source of CO2, with fluxes ranging from 2.2 to 200.0 mmol C m–2 d–1 (51.9 ± 26.7 mmol C m–2 d–1), which are higher than emissions normally found in low-inflow, marine-dominated estuaries. The diel variability of DIC indicated a net heterotrophic metabolism averaging −5.17 ± 7.39 mmol C m–2 h–1. Eutrophication amplifies the diel variability of the CO2 system generating large differences between daytime and night-time. The results highlight the importance of considering diel variability when estimating CO2 fluxes and carbonate chemistry in eutrophic, semi-arid, and tidally dominated estuaries under rapid environmental changes, and may represent future conditions in estuaries worldwide experiencing warming, increasing aridity and eutrophication.
Introduction
Monthly average global atmospheric CO2 concentration reached 418.9 ppm in May-2021 (UCSD-SIO, 2021), which is the highest concentration in the past 3 million years (Willeit et al., 2019). Considering this dramatic increase of atmospheric CO2, it is essential to improve carbon budget estimations at local/regional and global scales, identifying sources and sinks of this major anthropogenic greenhouse gas (IPCC, 2021). Estuarine ecosystems play a disproportional role in coastal carbon budget. They occupy a modest global area (0.2% of global ocean), but contribute with a significant global CO2 emission on the order of 0.10 Pg C yr–1 (Chen et al., 2013); these emissions respond to ∼5% of the annual ocean CO2 sink (Friedlingstein et al., 2019). However, the controls of carbonate chemistry and air-water CO2 flux in estuaries are complex and still not well understood and quantified (Borges, 2005). Estuarine ecosystems are highly dynamic transitional areas, with diverse “coastal typologies” and high spatial-temporal variabilities of biogeochemical properties (Dürr et al., 2011).
Estuaries are generally considered sources of CO2 to the atmosphere because they exhibit net heterotrophic metabolism. It means the rates of community respiration (both autotrophic and heterotrophic) are higher than the rates of gross primary production (Borges and Abril, 2011). Furthermore, estuaries receive CO2-rich waters from riverine discharges (Jiang et al., 2008; Van Dam et al., 2018; Cotovicz et al., 2020a), and lateral inputs of DIC and TA from vegetated coastal ecosystems (mangroves, saltmarshes) (Ovalle et al., 1990; Santos et al., 2021). Most studies concerning air-water CO2 exchanges and carbonate chemistry were conducted in temperate and subtropical regions, and generally in turbid estuaries dominated by significant river discharges (Frankignoulle et al., 1998; Borges and Abril, 2011). Studies of carbonate chemistry are overlooked in tropical ecosystems, particularly in semi-arid regions on and near the equator. In such regions, the river flow changes drastically during the year depending on the balance between evaporation and precipitation (Lavín et al., 1998; Dias et al., 2009). Furthermore, the significant water retention upstream in artificial reservoirs has been described in several estuaries impacted by dams (Dias et al., 2009; Mulligan et al., 2020). Consequently, the turbidity maximum zone, rarely reported in studies of estuarine systems in northeastern Brazil, can be retained by tidal forcing and favor oxygen consumption, with modifications in organic matter processing and the export of carbon to the ocean (Dias et al., 2016; Cavalcante et al., 2021). When the evaporation exceeds the freshwater supply from rivers and forms hypersaline waters the estuaries exhibit negative or inverse circulation (Lavín et al., 1998; Dias et al., 2009). Hypersalinity occurs under prolonged drought (low humidity) and warm climate, leading to changes in the physico-chemical properties and carbonate chemistry of estuaries with implications considering the magnitude of air-water CO2 flux (McCutcheon et al., 2019; Yao et al., 2020). Hypersalinity occurs in many coastal ecosystems; however, investigations of the carbonate chemistry in inverse estuaries are almost non-existent.
In addition, there is a lack of information regarding the temporal variability of carbonate chemistry and associated CO2 fluxes in estuaries, mostly at diel time scales (day—night changes). The diel cycles in solar radiation exert a periodicity on biogeochemical processes, creating diel (that is, 24-h) patterns of aquatic CO2 concentrations (Gómez-Gener et al., 2021). The diel-CO2 variability in general is governed by the photosynthetic activity occurring at daytime with assimilation of DIC from the water (mainly CO2); however, during night-time the photosynthesis is interrupted, and the aquatic CO2 concentrations increases due to the microbial respiration of organic matter. Despite this obvious process, there is a lack of CO2 measurements especially at night-time. The diel variably has showed to be important in diverse estuarine typologies and climate domains, including subarctic, temperate, subtropical, and tropical coastal regions (Yates et al., 2007; Dai et al., 2009; Bozec et al., 2011; Cotovicz et al., 2015; Fairchild and Hales, 2021; Miller and Kelley, 2021). The diel variability affects all carbonate chemistry parameters, including concentrations of DIC, TA, CO32–, and values of pH, Ωcal, and Ωara (Cyronak et al., 2018; Fairchild and Hales, 2021; Miller and Kelley, 2021). The diel patterns of CO2 system in equatorial coastal regions is particularly neglected.
Tropical coastal ecosystems have been suffering with increasing nutrient pollution and eutrophication due to the insufficiency of wastewater treatment facilities. The eutrophication has been associated with changes in coastal carbon budgets (Borges and Gypens, 2010; Cai et al., 2011; Cotovicz et al., 2015). However, the response of coastal ecosystems to eutrophication is strongly site-specific, in which some ecosystems develop acidification of subsurface waters (high pCO2, low pH, CO32–, Ωcal, and Ωara), whereas others are the opposite and exhibit an increase in pH (low pCO2, high pH, CO32–, Ωcal, and Ωara) (Borges and Gypens, 2010; Cai et al., 2011; Cotovicz et al., 2015, 2021).
The Jaguaribe River Estuary (JRE), located at an equatorial region in the northeastern coast of Brazil, is classified as a well-mixed estuary (Dias et al., 2009). The reduced rains, in addition to the constructions of large dams in the river basin and high average atmospheric temperatures (∼28°C), have decreased the freshwater flux into the estuary. The very low freshwater supply and the high rates of evaporation contribute to the insignificant riverine discharge during dry periods. For this reason, the salinities during dry periods are higher or similar to those of adjacent coastal waters (Dias et al., 2009, 2016). The hydrochemistry in the JRE reflects the seasonal variability of the semi-arid climate, and the estuary behaves as a retainer of DIC in the dry season (Cavalcante et al., 2021). However, the carbonate chemistry dynamics in the estuary was not addressed. The JRE suffers with increasing eutrophication, particularly through discharges from shrimp aquaculture ponds and domestic effluents that impact local mangroves and the main estuarine channel (Eschrique et al., 2014; Marins et al., 2020; Lacerda et al., 2021). This tropical semi-arid estuary shows rapid environmental change related to anthropogenic disturbances, including eutrophication, river damming, decreasing of freshwater discharge and hypersalinity. The main objective of the present study was to investigate the diel variability of carbonate chemistry in the estuary, with emphasis on the quantification of air-water CO2 exchanges. Our main hypotheses are that: (1) the concentrations of TA and DIC in the estuary will be higher compared to the adjacent coastal ocean due to the high rates of evaporation, the heterotrophic metabolism, and the supply of DIC and TA by mangrove forests and anthropogenic effluents; (2) The diel variability of carbonate chemistry parameters will present both semi-diurnal (tidally-driven) and diel (biologically driven) tendencies, with minimum buffering capacity at low tide and night-time conditions.
Materials and Methods
Study Area
The JRE basin (4° 23′ S and 37° 43′ W; 4° 36′ S and 37° 43′ W) has a surface area of about 1,350 km2, located in a tropical region near the equator (Dias et al., 2009; Figure 1). The watershed of the Jaguaribe River that covers 74,327 km2 with an extension of about 610 km contributing to the Western Equatorial Atlantic Ocean (Dias et al., 2009; Cavalcante and Cunha, 2012). Historically, the freshwater discharge into the estuary ranged from 0 to 7,000 m3 s–1 (Campos et al., 2000). However, the freshwater inputs have decreased due to the construction of a series of dams at the Jaguaribe River watershed (Dias et al., 2009). Historical monthly rainfall shows a marked seasonal behavior, with a wet period between March and April (200–400 mm), and a dry period between August and November, when the precipitation can frequently be zero. Between 2012 and 2017, a persistent extended drought (<700 mm.yr–1) dominated the river basin climate, and in 2018 annual rainfall started to return to the historical average (FUNCEME, 2021). Indeed, there is a decreasing continental runoff in the semi-arid northeastern region of Brazil as the result of decreasing annual rainfall, and this alarming scenario of decreasing freshwater supply have worsened due to river damming (Lacerda et al., 2020). The water residence time during the dry season is longer in the higher/middle estuary with average of 3 days, and up to 13 days (Lacerda et al., 2013). The estuary has a semi-diurnal and meso-tidal regime with average tidal height of 2.8 m, with peaks during spring tide reaching up to 3.4 m (Dias et al., 2009). The human population in the estuarine basin is estimated at about 100,000 inhabitants, whereas the wastewater treatment services comprise less than 40% of the households (IPECE, 2017). This has contributed to increasing levels of nutrients in the estuary, and occasional occurrence of hypoxia particularly in mangrove channels of the upper/middle estuarine regions (Eschrique et al., 2014; Marins et al., 2020). The trophic status in the estuary, using the trophic state index (Lamparelli, 2004; Silva, 2019), was classified as mesotrophic to eutrophic during the sampling period of this study. In addition to urban wastewaters, discharges from about 3,640 ha of shrimp farms significantly increases nutrient loads into the estuary (Lacerda et al., 2021). The estuary is surrounded by mangroves, which occupy about 13,000 ha (Godoy et al., 2018).
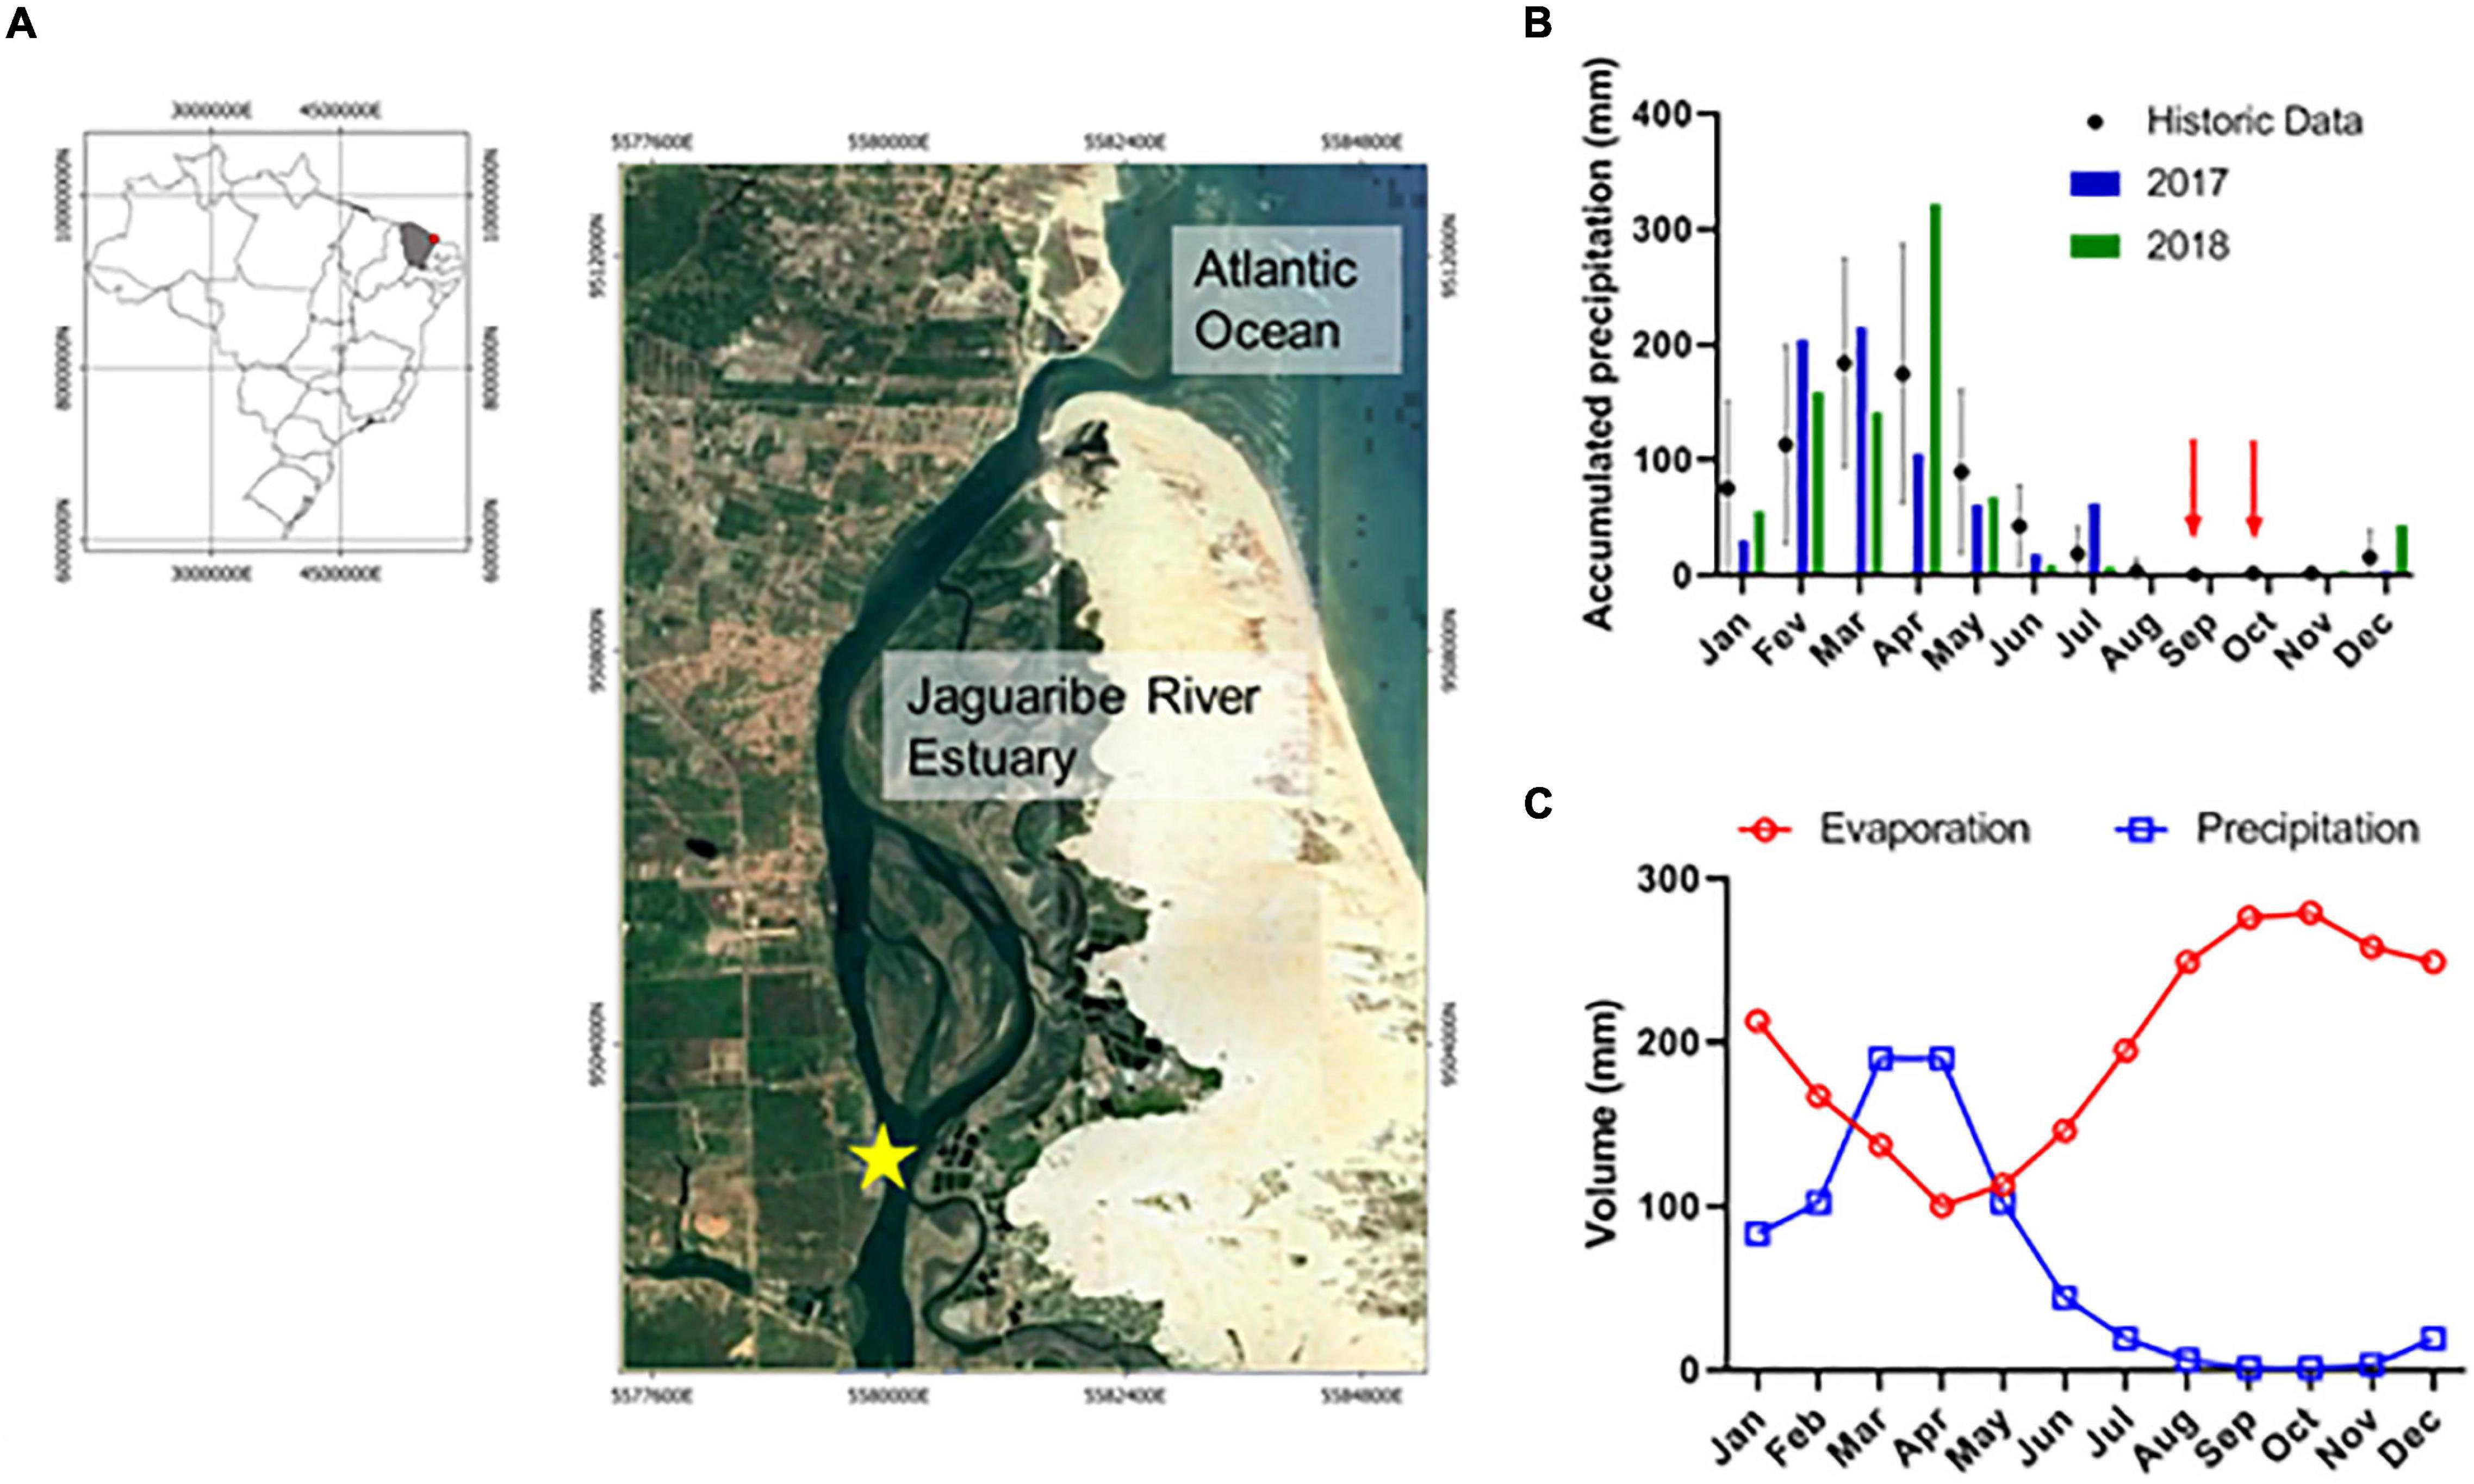
Figure 1. (A) Study area in the Jaguaribe River Estuary (JRE), Ceará, NE Brazil; (B) annual precipitation during the study period; (C) annual evaporation and precipitation over the study area.
Sampling Surveys and Analytical Procedures
Two eulerian time series were performed, one in October-2017 (33 h of sampling), and other in September-2018 (44 h of sampling) (Figure 1). Both samplings were performed during spring tides and dry season, and at the same moored sampling station. The monthly averaged precipitation during these two surveys were null, and the water budget was negative, i.e., evaporation exceed rainfall rates (Figures 1B,C). The moored station was chosen because it represents a transitional region in the central estuary, which receives influences from continental and marine intrusion and in dry season often represents a turbidity maximum zone, where organic matter interactions and DIC retention occur (Dias et al., 2016; Cavalcante et al., 2021).
Continuous Measurements
The collection campaign included continuous and discrete sampling. The continuous and real-time measurements were performed for the partial pressure of CO2 (pCO2), salinity, temperature, and wind velocity. The continuous measurement system is based on Pierrot et al. (2009), and well-described in Carvalho et al. (2017) and Cotovicz et al. (2020b). Briefly, a water pump was placed at a depth of ∼0.5 m and provided continuous water flow (∼2.5 L min–1) to the boat. The water flow was directed to a thermosalinograph (SeaBird Electronics ®) to record the surface temperature and salinity. After, passing through the thermosalinograph, this water flux was directed to two equilibrators (shower head type) and then discharged. These showerhead equilibrators promote fast equilibration between air and water phases inside the system. The gas, free from humidity, passes through a Non-dispersive InfraRed gas analyzer (NDIR) for CO2 quantification (Licor-7000 ®CO2/H2O gas analyzer). A data acquisition system determined the following parameters every 5 min: date and time, position of the ship, velocity of the ship, molar fraction of CO2 in the equilibrator (xCO2), water content in the detector, sea surface temperature (SST) and sea surface salinity (SSS). The molar fraction of CO2 (xCO2 ppm) measured in the equilibrator in dry gas was computed using the equation below:
where Peq is the pressure in the equilibrator (assumed to be the same of atmosphere), and Pweq is the pressure of water vapor (atm), according to Weiss and Price (1980). The temperature measured in the surface water and in the equilibrator were slightly different, and then a correction was applied to compensate such difference, according (Takahashi et al., 1993):
where pCO2 represents the seawater pCO2 at in situ conditions, SST is the temperature measured in situ and Teq is the temperature measured in the equilibrator.
The NDIR was calibrated prior the first analyses and after every 6 h of seawater molar fraction records using air free CO2 by passing N2 standard followed by standard gases with nominal concentrations of 360, 1,009, and 2,009 ppmv (99.9% purity, supplied by White Martins Certified Gases).
Atmospheric pCO2 measurements (pCO2air) were performed every 6 h with air taken from the top of the vessel at ∼10 m high. The accuracy of the pCO2 measurements was estimated at ± 2 μatm. One anemometer model Davis S-WCF-M003 was used to measure the wind velocity and placed at about 10 m in height.
Discrete Water Sampling
Discrete water samples, at a depth of ∼0.5 m, were collected hourly using a 3-L Niskin bottle. The water samples were filtered in the boat using Whatman GF/F filters (diameter 0.47 mm, pore size 0.7 μm), which were used for chlorophyll a (Chl a) analysis, and the filtrate used for nutrients (phosphate) and TA analysis. All filters were pre-combusted (at 500°C for 6 h). The filters and the filtered water samples were conditioned (fixed and/or maintained in ice in the dark) for further analysis in the laboratory. At the laboratory, the Chl a was extracted in 90% acetone and determined by spectrophotometry following the procedures described by Jeffrey and Humphrey (1975). The phosphate (PO43–) was determined by colorimetric method according to Hansen and Koroleff (1983). TA was determined on 60 mL of filtrate using the Gran (1952) electro-titration method with an automated titration system (Mettler Toledo model T50). The reproducibility of TA was about 3 μmol kg–1 (n = 7). Measurements were compared to certified reference material (CRM, provided by A. G. Dickson from Scripps Institution of Oceanography) and consistent at an accuracy level of ± 5 μmol kg–1.
Carbonate Chemistry Calculations
The pH (at the National Bureau of Standards scale, NBS), DIC, Ωcal, and Ωara were calculated from pCO2, TA, seawater temperature, and salinity using the CO2calc 1.2.9 program (Robbins et al., 2011). The dissociation constants for carbonic acid were those proposed by Mehrbach et al. (1973) refitted by Dickson and Millero (1987), the borate acidity constant from Lee et al. (2010), the dissociation constant for the HSO4– ion from Dickson (1990) and the CO2 solubility coefficient of Weiss (1974). The Ksp values for aragonite and calcite were taken from Mucci (1983) and the concentrations of calcium (Ca2+) were assumed proportional to the salinity variations according to Millero (1979).
Mixing Model
According to Jiang et al. (2008), in estuaries and lagoons with low or negligible freshwater inputs, the concentrations of DIC and TA during estuarine mixing can be calculated as:
Where SSSmeasured is the measured surface salinity, SSSocean the surface salinity of the ocean endmember, DICocean and TAocean the DIC and TA concentrations of the ocean endmember. This model assumes that the DICconservative is the DIC concentration after the ocean endmember is diluted by a zero DIC freshwater. Here, we applied this same approach; however, we assumed that the ocean endmember is linearly concentrated by the evaporation considering the salt conservation. This same approach was recently applied by Cotovicz et al. (2021) studying an evaporative coastal lagoon. The salinities in the inner shelf off the Jaguaribe River during dry season are relatively constant (∼36.7); typical variabilities are < 1 in the ocean endmember (Dias et al., 2013).
The deviation from conservative mixing (ΔDIC) is defined as the DIC addition or loss relative to the theoretical DIC concentration during mixing:
Where DICmeasured is the measured DIC. In the same way, the deviation of TA from the evaporation path (ΔTA) can be calculated. As we did not measure the ocean endmember, we use the value from Cotovicz et al. (2020b), which measured TA and DIC in an adjacent coastal region with similar salinity and water temperature and during the dry season.
Air-Water CO2 Fluxes
The air-water CO2 fluxes (FCO2) was calculated according:
where k is the gas transfer velocity coefficient (cm.d–1), K0 (mol.cm–3.atm–1), is the solubility coefficient of CO2 at in situ temperature and salinity (Weiss, 1974), and pCO2water and pCO2air (pressure) are the partial pressures of CO2 in equilibrium with surface water and in the overlaying air, respectively.
The gas transfer velocity was parameterized as a function of wind speed taking account two parameterizations available for estuaries (Raymond and Cole, 2001, RC01; Jiang et al., 2008, J08), and two specific parameterizations for oceanic waters (McGillis et al., 2001, M01; Wanninkhof, 2014, W14). The parameterizations of RC01, M01, J08, and W14 can be calculated as follows:
Where U represents the measured wind velocity (m s–1), Sc is the Schmidt number for CO2, and 660 is the Schmidt number of CO2 in seawater at 20°C.
Net Community Production
The NCP was calculated considering the changes in dissolved inorganic carbon (DIC) with time, comparing consecutive peaks of maximal and minimal tidal heights. For highest tidal heights, the NCPHT was calculated according:
Where NCPHT is in (mmol m–2 h–1), ρ is the seawater density (kg m–3), d is the average depth (m) of the area, t represents the time interval (12 h), and FCO2 is the averaged carbon dioxide flux (mmol m–2 h–1) across the water–atmosphere interface during this period. DIC1HT and DIC2HT represent the salinity-normalized concentration of DIC (mmol kg–1) during two consecutive measurements at the highest tide. In this manner, we can compare consecutive DIC measurements at the maximal tidal level and in different diel period (daytime and night-time). Furthermore, we calculated the NCP for the lowest tidal heights (NCPLT) according:
Where DIC1LT and DIC2LT represent the salinity-normalized concentration of DIC (mmol kg–1) during two consecutive measurements at the lowest tide. The averaged values of NCPLT and NCPHT provide the NCP of the estuary.
Statistics
The Shapiro-Wilk test was applied to check whether a given variable follows a parametric or a non-parametric distribution. All investigated variables in this study were not normally distributed; therefore, we only applied non-parametric statistics. To compare two unpaired groups, we calculated the Mann-Whitney test. To compare three or more unmatched groups, we calculated the Kruskal-Wallis test. Spearman rank coefficient was calculated to assess the statistical correlation between the rankings of two variables. All statistical analysis were based on significance level of 0.05. We used the GraphPad Prism 8 program (GraphPad Software, Inc., La Jolla, California) to perform graphs and statistical tests.
Results
Main physico-chemical parameters analyzed in this study are shown in Table 1. The carbonate chemistry parameters presented marked variability at the semi-diurnal and diel time scales (Figures 2, 3). Both sampling campaigns presented similar tidal heights and amplitudes, with maximal tidal height of 3.60 m and minimum tidal height of 0.10 m. The averaged tidal amplitude was 3.3 m in Oct-2017, and 3.0 m in Sep-2018. The salinity showed a strong and negative trend with tidal height, showing characteristics of an inverse estuary (Figure 3). Higher salinities (max = 40.8) were measured during low tides (p < 0.01), whereas lower salinities (min = 38.2) were measured during high tides. The averaged salinity was 39.3 ± 0.7 in Oct-2017 and 39.4 ± 0.2 in Sep-2018, which are higher than the values found in the adjacent coastal region. The water temperature followed a clear diel pattern, with warming from dawn to midday (highest temperature of 29.1°C) and cooling from midday to dusk/night (lowest temperature of 26.7°C) (Figure 3). The averaged water temperature was 28.2 ± 0.6 and 28.0 ± 0.6°C for Oct-2017 and Sep-2018, respectively, with no significant differences considering the two time-series.
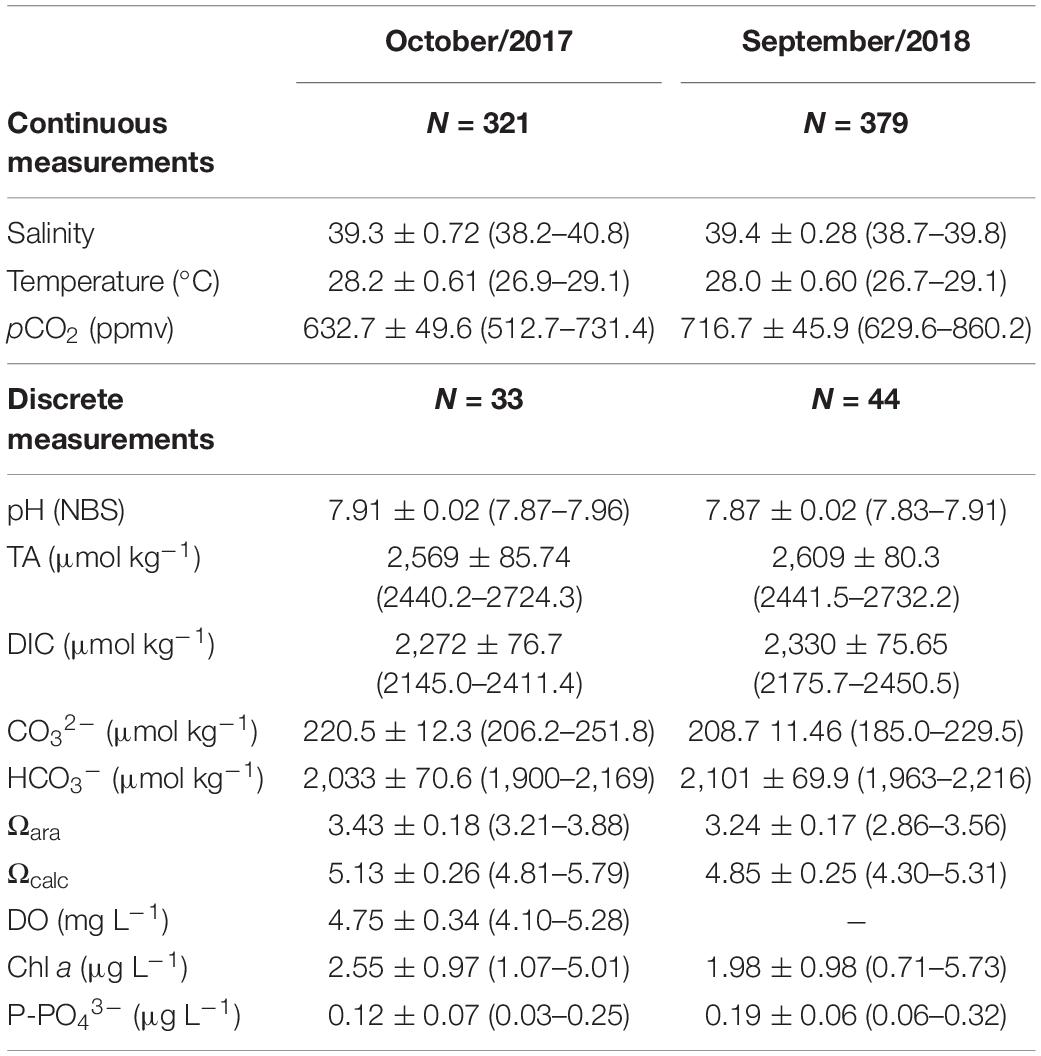
Table 1. Main physico-chemical parameters analyzed in this study (average, standard deviation, minimum, and maximum values).
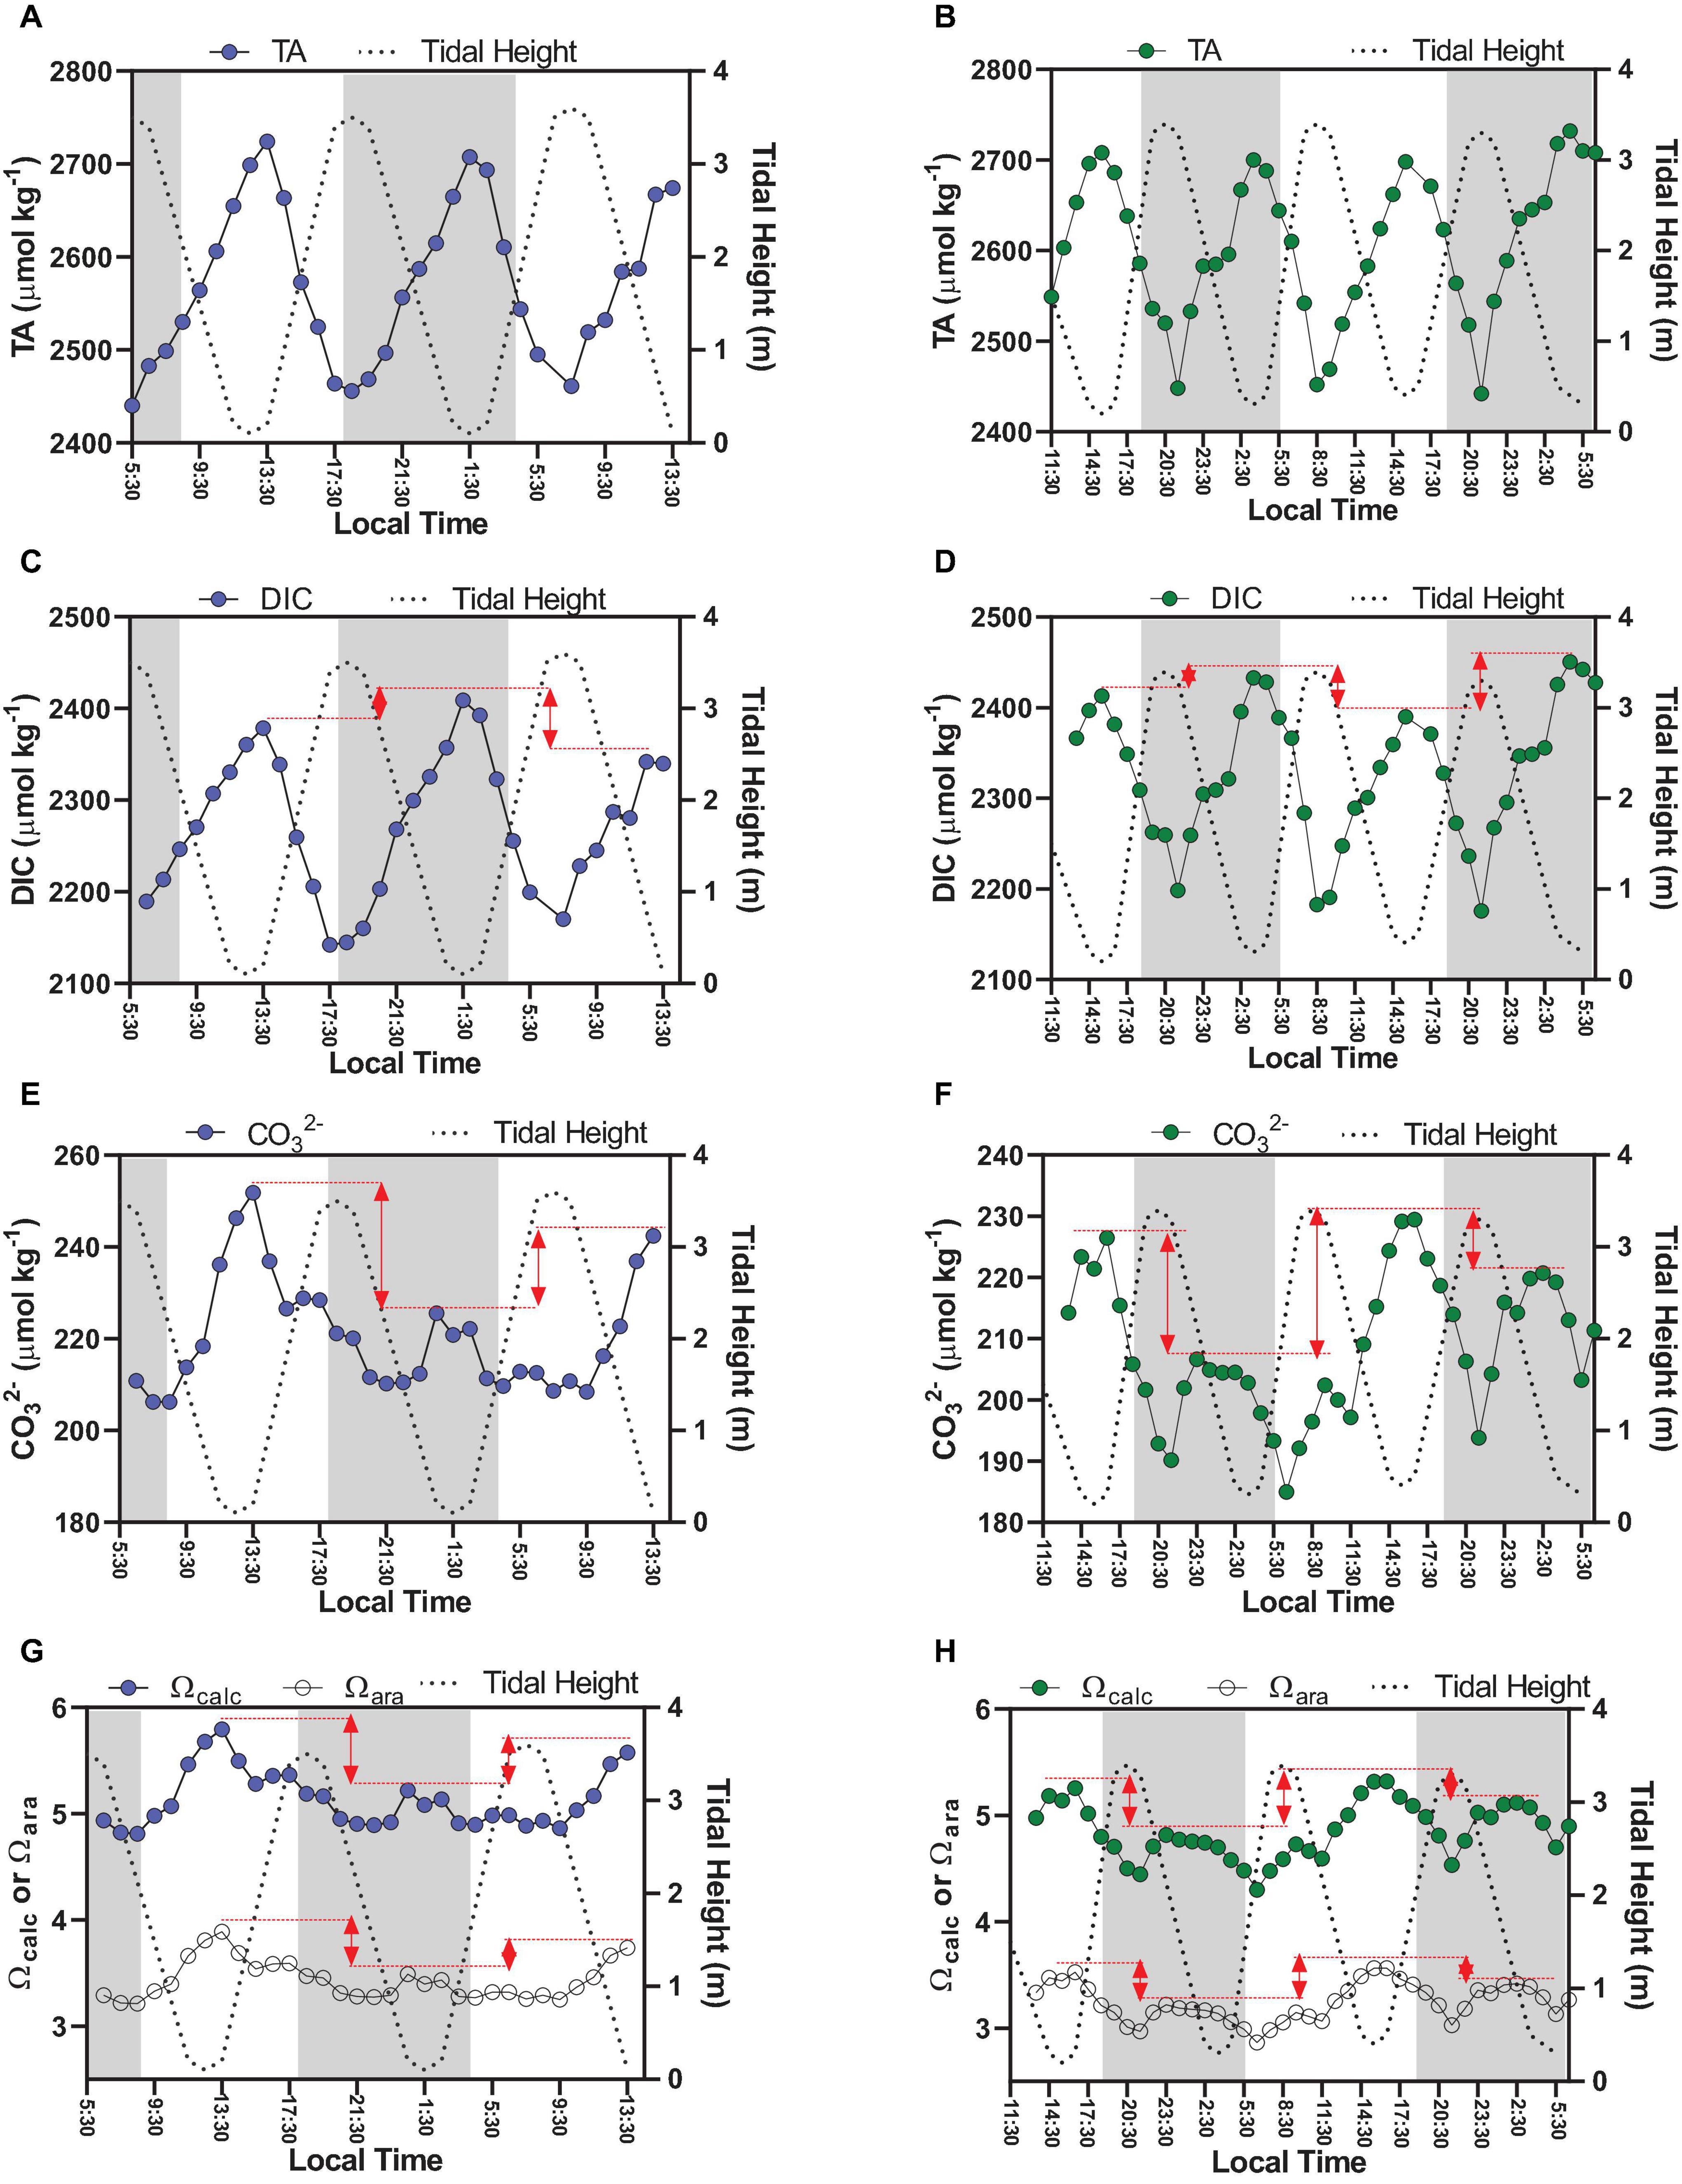
Figure 2. Time-series observations of carbonate chemistry parameters sampled hourly (discrete sampling), which are TA (A,B), DIC (C,D), CO32– (E,F), Ωcalc, and Ωara (G,H). Graphs on the left side represent Oct-2017 (blue dots); graphs on the right side represent Sep-2018 (green dots). The red lines in graphs illustrate the diel variability by comparing minimal tidal heights occurring at different hours of the day (daytime × night-time).
Figure 3. Time-series observations of parameters measured continuously, which are salinity (A,B), temperature (C,D), and pCO2 (E,F). Graphs on the left side represent Oct-2017 (blue dots); graphs on the right side represent Sep-2018 (green dots). The red lines in graphs (E,F) illustrate the diel variability of pCO2 values by comparing peaks of low tides occurring at different hours of the day (daytime × night-time).
The TA variability followed a clear semi-diurnal pattern, but with an inverse trend compared to the tidal height (Figures 2A,B). The highest concentrations were measured during lowest tidal heights (up to 2,724 μmol kg–1), whereas lowest concentrations were measured during highest tides (down to 2,440 μmol kg–1) (p < 0.01). TA averaged concentrations were not different considering daytime and night-time periods (p > 0.05). DIC variability also followed a semi-diurnal tendency, but with diel influences (Figures 2C,D). Highest concentrations were verified during lowest tidal heights and night-time (max = 2,450 μmol kg–1), whereas lowest concentrations were verified during highest tidal heights and daytime (min = 2,145 μmol kg–1) (p < 0.01). The red arrows in Figures 2C,D show the difference of DIC concentrations between consecutive peaks of maximal tidal heights occurring in daytime and nigh-time conditions, illustrating the influence of diel variability (Figure 4). On Oct-2017 presented DIC concentration averaging 2,272 ± 76 μmol kg–1 that is about 50 μmol kg–1 lower than the averaged DIC concentration on Sep-2018. DIC and TA concentrations presented positive correlation with salinity (Figure 5). The Spearman correlation coefficient between TA and salinity was 0.98 and 0.97 on Oct-2017 and Sep-2018. Considering the correlation between DIC and salinity these coefficients were 0.97 and 0.95, respectively, on Oct-2017 and Sep-2018. This positive correlation with salinity was also verified for PO43– concentrations, with minimum concentration of 0.09 mg L–1 (high tide and daytime) and maximum concentration of 0.40 mg L–1 (low tide and night-time). The correlation coefficient (Spearman rank) between PO43– and salinity was 0.96 for both sampling campaigns. Measured TA and DIC concentrations are overall higher than those predicted by the evaporation model, creating positive deviations in the values of ΔTA and ΔDIC (Figures 5A,B). Considering the mean value of ΔTA = 48 μmol kg–1, ΔDIC = 107 μmol kg–1, the surface area in the middle estuarine portion = 450 km2, the mean water depth = 5 m, and considering the residence time of 3 days, the estimated net gains of TA and DIC are about 80.8 and 179.2 mmolC m–2 d–1, respectively. Figure 5C present unitless directional vectors representing the slopes of the main processes affecting TA and DIC, showing that data points are close to the slopes of sulfate reduction and denitrification.
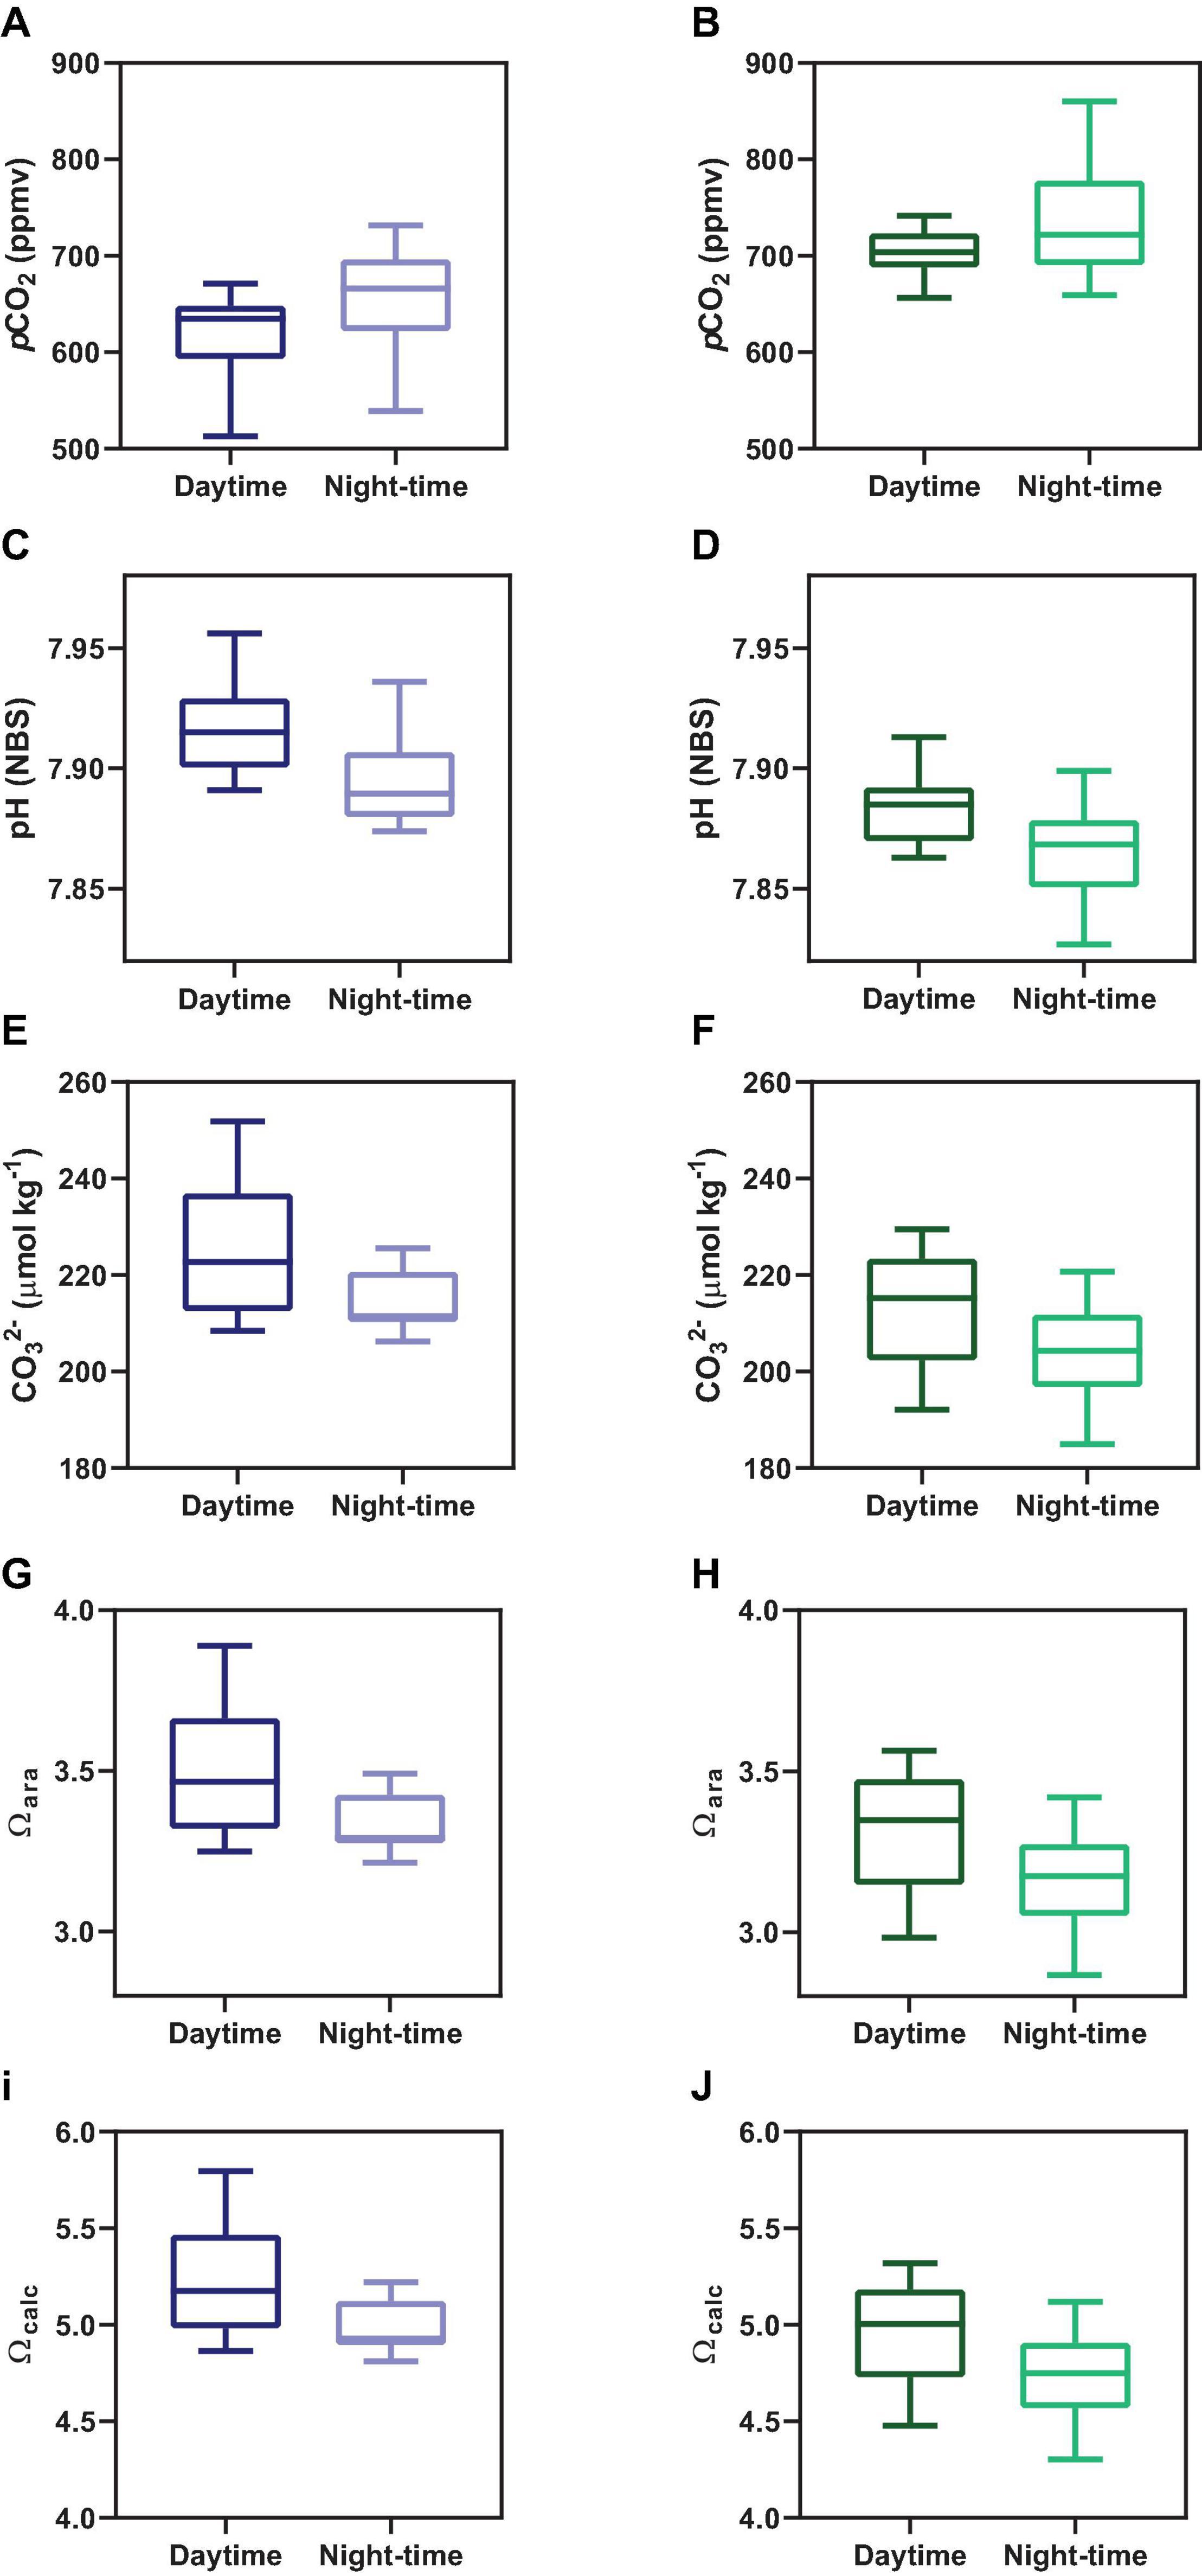
Figure 4. Comparison between daytime and night-time averaged concentrations for the main carbonate chemistry parameters, which are pCO2 (A,B), pH (C,D), CO32– (E,F), Ωara (G,H), and Ωcalc (I,J). Graphs on the left side represent Oct-2017; graphs on the right side represent Sep-2018.
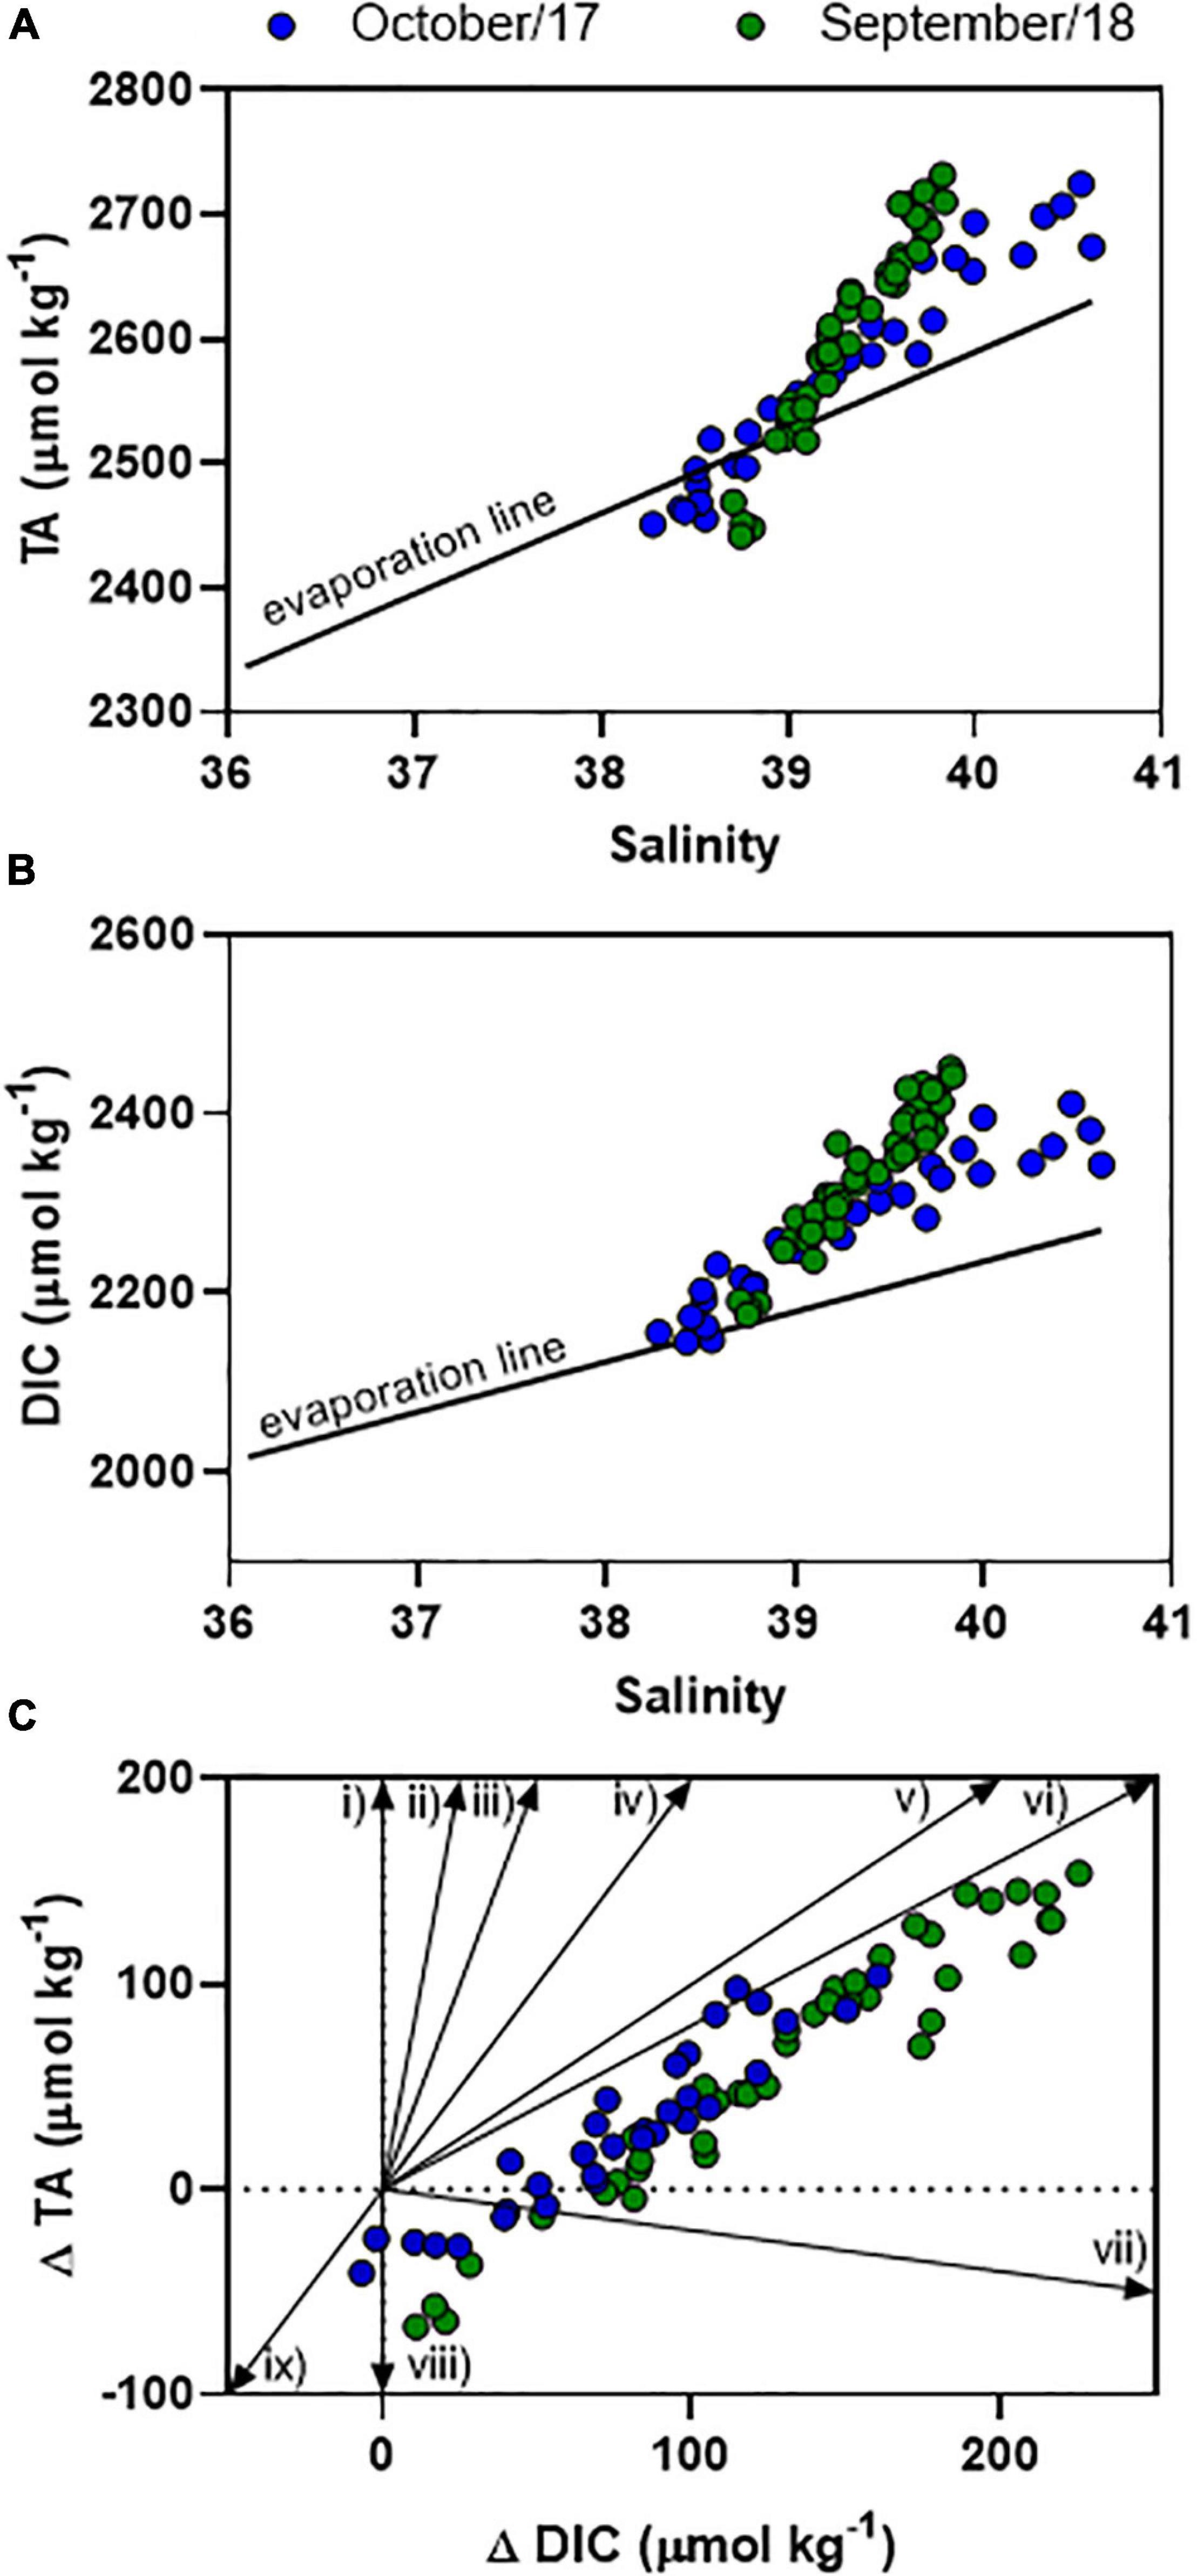
Figure 5. Distributions of TA (A) and DIC (B) concentrations as a function of salinity. The graph (C) represents the deviation of TA and DIC from conservative mixing following specific vectors of organic matter degradation, which are: (i) ammonification, (ii) iron reduction, (iii) manganese reduction, (iv) carbonate dissolution, (v) sulfate reduction, (vi) denitrification, (vii) aerobic respiration, (viii) sulfur oxidation, iron oxidation, and nitrification, (ix) carbonate precipitation.
Concentrations of CO32–, Ωcal, and Ωara presented a similar tendency, exhibiting a combination of semi-diurnal and diel influences (Figure 2). Highest values of CO32–, Ωcal, and Ωara were verified during low tide at daytime, with values reaching up 251 μmol kg–1, 5.79 and 3.88, respectively, during sampling in Oct-2017. The lowest values of CO32–, Ωcal, and Ωara were verified during high tide at night-time, with values of, respectively, 185 μmol kg–1, 4.30 and 2.86. Overall, on Oct-2017 the values of CO32–, Ωcal, and Ωara were higher than those on Sep-2018. The red arrows in Figure 2 shows the difference of CO32–, Ωcal, and Ωara values comparing consecutive peaks of maximal tidal heights occurring at different time of the day (daytime and night-time). The values of CO32–, Ωcal, and Ωara were higher during daytime compared to night-time (Figure 4) (p < 0.001). Chl a concentrations exhibited values averaging 2.55 ± 0.97 μg L–1 in Oct-2017, and 1.98 ± 0.98 μg L–1 in Sep-2018. No significant trend was verified considering flood and ebb tides; however, a significant difference was verified considering the diel variability: highest concentrations were measured at daytime.
Following the tendencies described above for TA, DIC, CO32–, Ωcal, and Ωara, the values of pCO2 also exhibited marked differences considering the hour of sampling (diel variability) and tidal height (semi-diurnal) (Figures 2, 4). On Oct-2017 high pCO2 values occurred at low tide and night-time with pCO2 values reaching up to 731 μatm, and a maximal diel amplitude of 219 μatm. On Sep-2018 we also found this same tendency, with values reaching the maximum value of 860 μatm during low tide and night-time, and maximal diel amplitude of 231 μatm. On Oct-2017 the averaged pCO2 value (716 ± 45 μatm) was slightly above than the average measured in Sep-2018 (632 ± 49 μatm). The values of pCO2 measured during daytime were lower than those measured during night-time, in both sampling campaigns (Figure 4) (p < 0.001). The red arrows in Figure 2E, f illustrate the diel variability of pCO2 values considering consecutive peaks of maximal pCO2 occurring during low tide, but with different magnitude depending on the hour of sampling (daytime × night-time). As expected, the pH followed a significant and inverse trend compared to pCO2. Highest values of pH were verified during daytime and high tide (7.96), whereas lowest values were verified during night-time and low tide (7.83), with diel pH amplitude reaching a maximum of 0.10 units (NBS scale).
Table 2 shows the main parameters used to calculate the air-water CO2 fluxes (FCO2). The wind velocities were similar for both sampling campaigns, however, with some particularities. Oct-2017 presented wind velocities averaging 4.15 ± 0.99 and 3.96 ± 1.59 m s–1 for daytime and night-time, respectively, with no statistical difference between these periods. Sep-2018 presented wind velocities averaging 4.73 ± 0.74 m s–1 for daytime that was higher than the average of 3.47 ± 1.28 m s–1 measured during night-time (p < 0.0001). This diel pattern verified for wind velocities was the same of that verified for the values of gas transfer velocities (k660). The parameterization of RC01, which is specific for estuaries, provided the highest values of k660 that averaged 10.15 cm h–1 on Oct-2017, and 10.21 cm h–1 on Sep-2018 (Figures 6C,D). The parameterization of W14, which is specific for oceanic waters, provided the lowest values of k660 with a mean of 5.58 cm h–1 in Oct-2017, and 5.65 cm h–1 in Sep-2018. Considering the averaged values, the wind velocities and gas transfer velocities did not present differences between Oct-2017 and Sep-2018. The FCO2 were always positive, indicating that the estuary is a source of CO2 to the atmosphere in all conditions (Table 2 and Figure 6). Following the tendency verified for k660 values, the CO2 emissions were highest applying the parameterization of RC01 (mean of 67.1 mmolC m–2 d–1), and lowest with the parameterization of W14 (mean of 37.3 mmolC m–2 d–1), whereas the parameterizations of M01 and J08 provided intermediate values (Table 2 and Figure 6). On Oct-2017, the diel difference of wind velocities and k660 values were not statistically different. Therefore, the highest FCO2 values were verified during low tide and night-time, following the trend verified for pCO2 values. The emissions during night-time (48.1 mmolC m–2 d–1) were higher than during daytime (42.5 mmolC m–2 d–1). On Sep-2018, however, the wind velocities and k660 were lower during night-time and pCO2 values were higher. For this, despite the fact that night-time presented higher pCO2 values, the values of FCO2 were lower during night-time (54.1 mmolC m–2 d–1) compared to daytime (67.5 mmolC m–2 d–1). Considering all FCO2 data and all parameterizations, the averaged CO2 emission was estimated at 51.9 ± 26.7 mmolC m–2 d–1. As we could not account for current velocity, which can be an important driver of k660 in shallow estuaries, our evasion rates should be considered conservative (Abril et al., 2009; Jeffrey et al., 2018).

Table 2. Air-water CO2 fluxes.
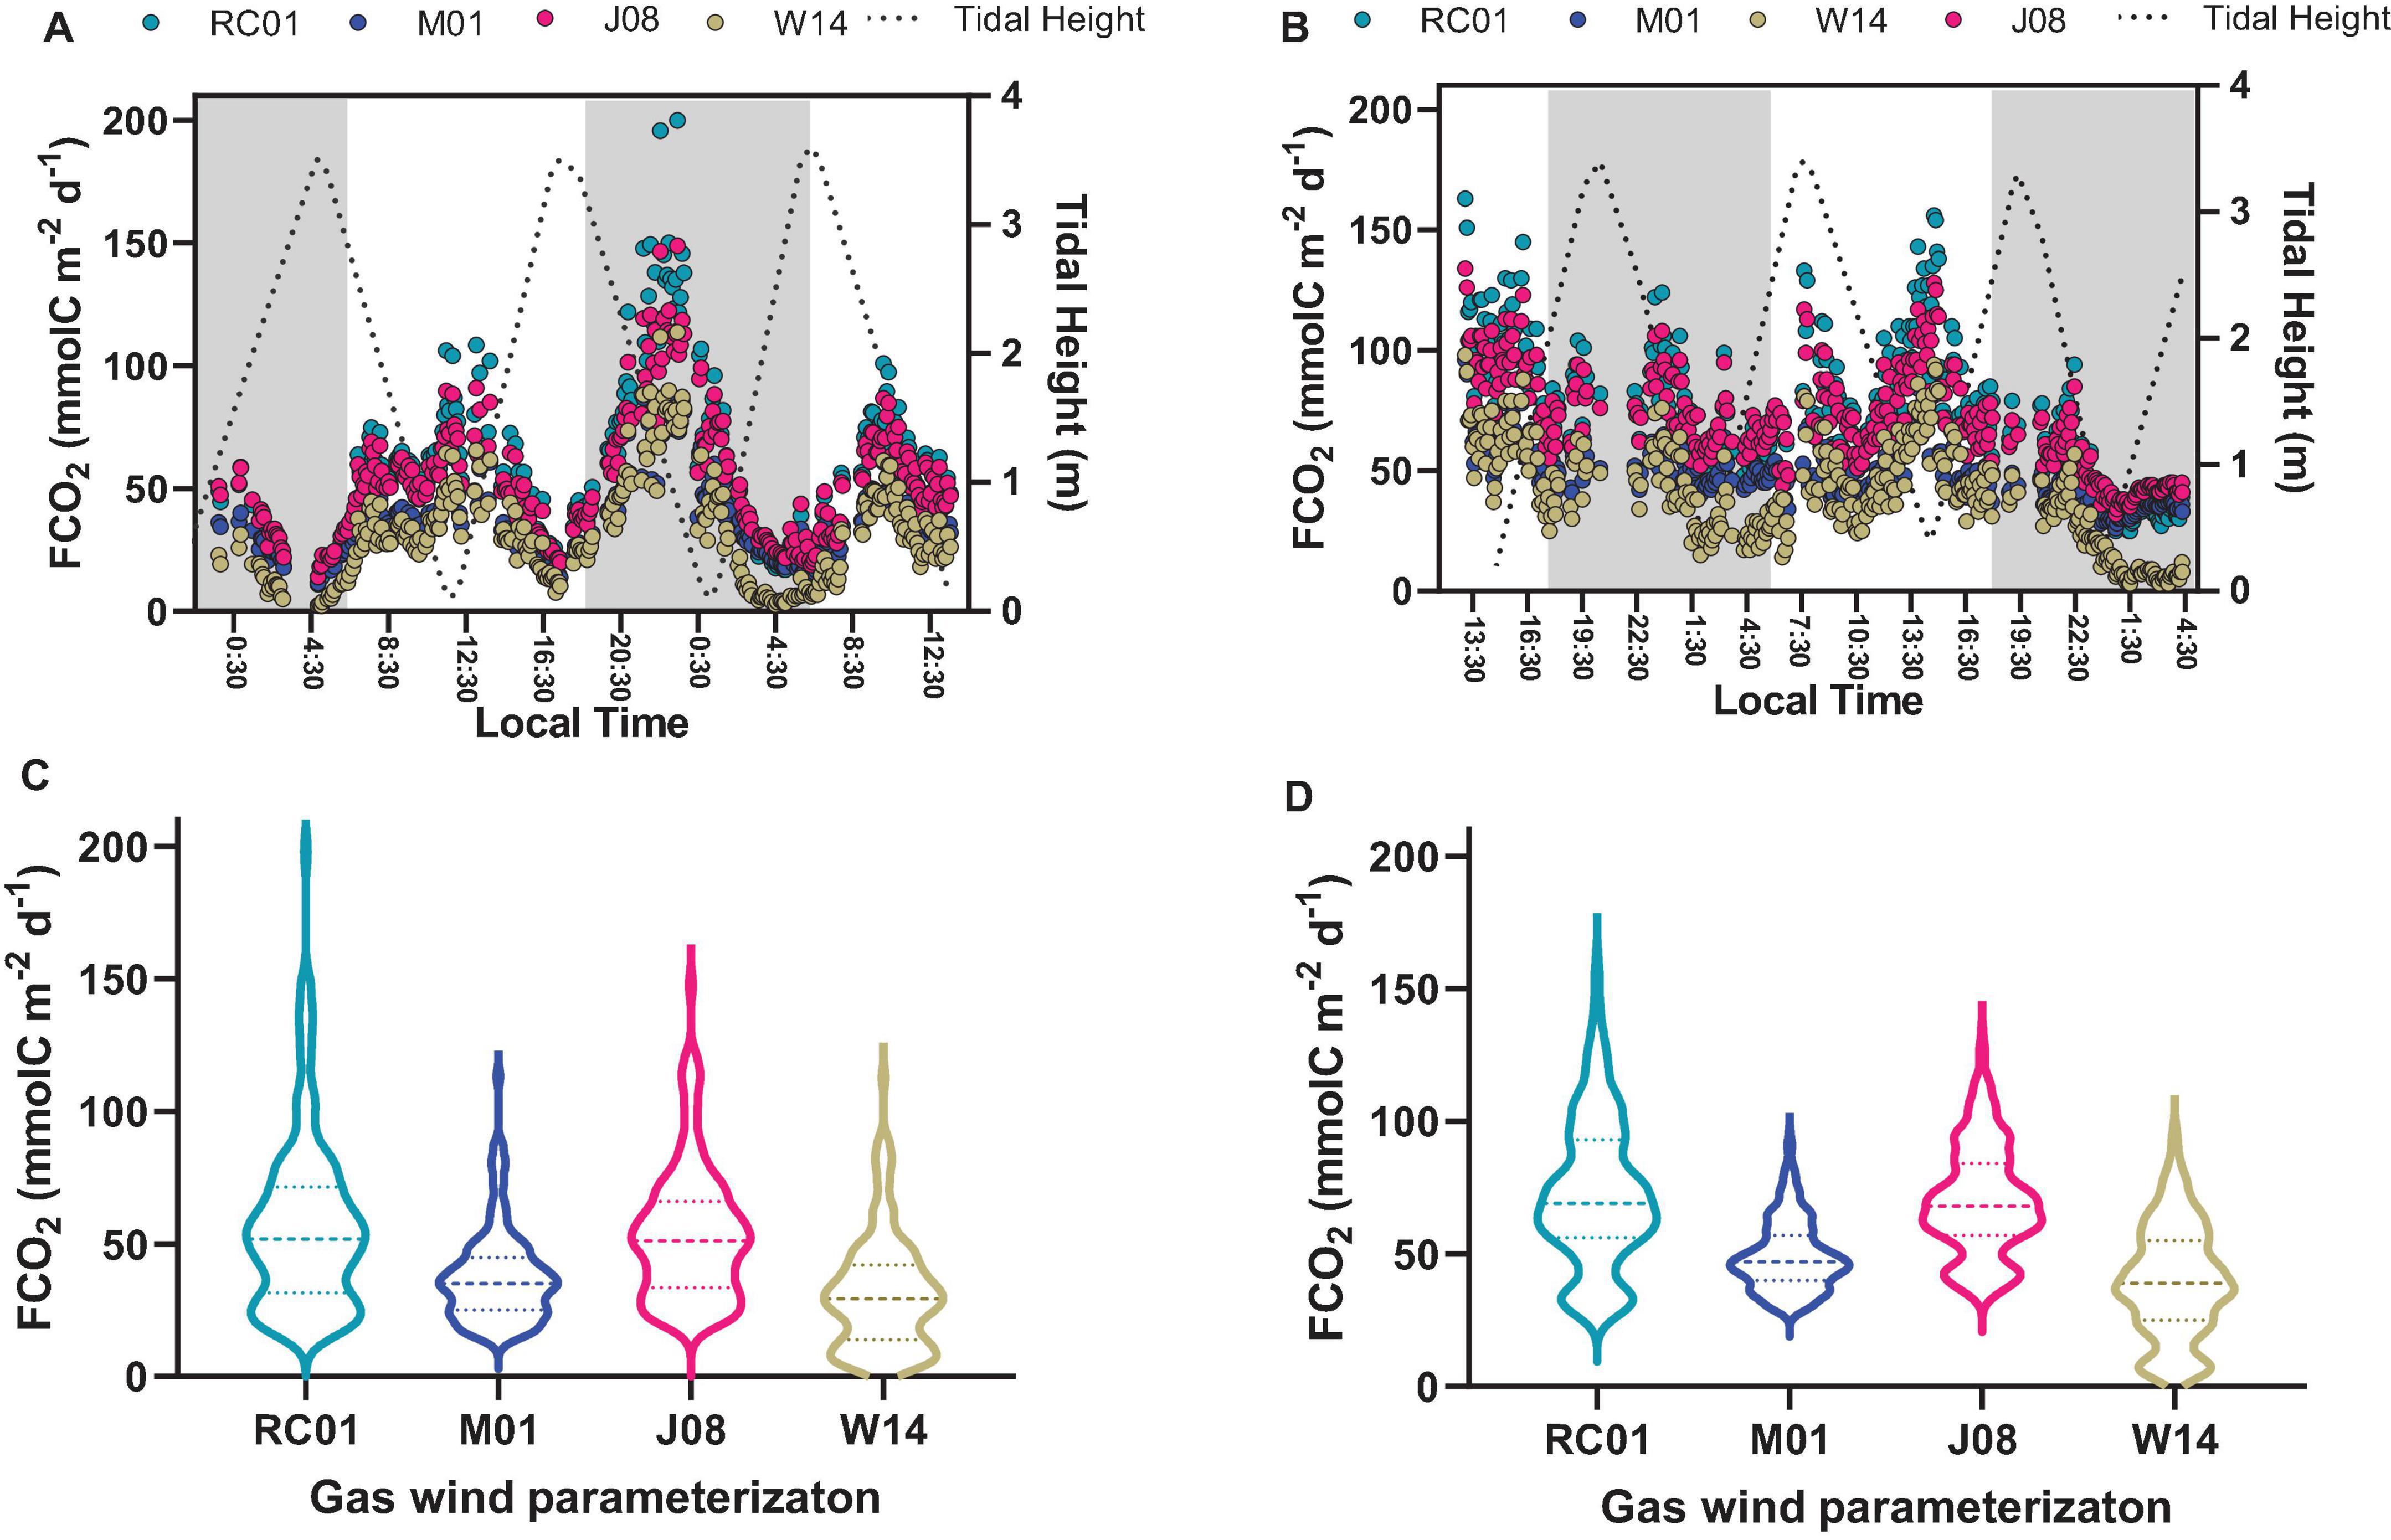
Figure 6. Graphs (A,B) represent the time-series observations of FCO2 calculated with different gas transfer velocities parameterizations. Graphs (C,D) represent violin plots, showing the median, and 25 and 75 percentiles of FCO2 calculated with different gas transfer velocities parameterizations. Graphs on the left side represent Oct-2017; graphs on the right side represent Sep-2018.
The net heterotrophic metabolism in the JRE was estimeted at about −5.17 ± 7.39 mmol C m–2 h–1, varying from +6.86 to −14.66 mmol C m–2 h–1 (Table 2). Most NCP values were negative; however, there are few periods of autotrophy as indicated by the positive NCP. For each individual tidal cycle, we compared consecutive peaks of DIC concentrations from low-to-low tides occurring at different hour of the day (daytime and night-time). The same was calculated for consecutive peaks of high tides (high-to-high). The maximal heterotrophy is verified when we compared the DIC concentrations from daytime to night-time (low-to-low and high-to-high tides), considering that DIC concentrations (and pCO2 values) were always higher at night-time. The two situations of autotrophy occurred when we compared the DIC concentrations from night-time to day time (low-to-low and high-to-high tides).
Discussion
Production of Dissolved Inorganic Carbon and Total Alkalinity in the Estuary
Changes in carbonate chemistry in semi-arid, hypersaline estuaries are still overlooked (McCutcheon et al., 2019; Yao et al., 2020). Hypersalinity occurs frequently in the JRE during dry months because evaporation exceeds water inputs (Dias et al., 2013). This favors water retention by tidal forcing which increases water residence time in the estuary and enables sediment trapping in the middle estuary (Dias et al., 2013). Water in the middle estuary is blocked for long periods before reaching the sea (Lacerda et al., 2020). Negative water balance is reflected in higher salinities in the estuary (averaging 39.5) compared to the adjacent coastal ocean (<36.5; Cotovicz et al., 2020b; 36.45 ± 0.24 along the equatorial coast; Carvalho et al., 2017). This corroborates previous results in this estuary that exhibits negative estuarine circulation (Dias et al., 2009). Indeed, the JRE behaves as a retainer of DIC during the dry season (Cavalcante et al., 2021). The evaporation of seawater increases the salinity in the remaining seawater (evaporation-concentrated seawater) in the same proportion to the amount of seawater that is evaporated, considering that precipitation and evaporation create no salt flux across the air-sea interface. Thus, it is possible to calculate the effect of evaporation in the concentrations of TA and DIC in the estuary. The values of ΔTA and ΔDIC were mostly positive (above the evaporation line), evidencing that estuary is producing TA and DIC in significant amounts by oxic and sub-oxic processes (Figure 5). The estimated net gains of TA and DIC are about 80.8 and 179.2 mmolC m–2 d–1, respectively. This gain of DIC is higher than the average of CO2 emissions in the world’s estuaries (45.2 mmolC m–2 d–1; Chen et al., 2013) and higher than the NCP calculated for this estuary (section “pCO2 Variability Amplified by Eutrophication” of this manuscript).
The reactions of reduction and oxidation are coupled to proton production and consumption leading to changes in TA and DIC, particularly in estuaries and coastal regions enriched in organic matter (Abril and Frankignoulle, 2001; Hu and Cai, 2011). The stoichiometry of diagenetic reactions alters TA and DIC in specific ways (Rassmann et al., 2020). The highest deviations of TA and DIC concentrations from the expected evaporation line (Figures 5A,B) occurred in the samples with highest salinities from JRE, indicating that there are net gains of TA and DIC from middle/upper estuarine zones. The data from the JRE are between the slopes of sulfate reduction (vector v), denitrification (vector vi), and aerobic respiration (vector vii). Indeed, the biogeochemical processes of aerobic respiration, ammonification, denitrification, and sulfate reduction explained the gains of TA and DIC in other tropical mangrove-dominated estuaries (Dutta et al., 2019; Akhand et al., 2021). A previous study has suggested the influence of sulfate reduction in the JRE (Lacerda et al., 2013), which is particularly pronounced during the dry period due to the longer water residence time and greater influence of the waters trapped inside the mangrove area and when bidirectional flux can be observed at the middle of the estuary (Dias et al., 2016). Sulfate reduction is the main digenetic pathway of organic matter mineralization in mangroves (Borges et al., 2003; Bouillon et al., 2007). Furthermore, high levels of ammonium (NH4+) and low levels of dissolved oxygen were reported at mangrove tidal creeks in the JRE, indicating processes of ammonification and denitrification (Eschrique et al., 2014; Marins et al., 2020). Increasing levels of NH4+ and PO43– in the middle estuarine portion suggest influences of wastes from shrimp aquaculture ponds and domestic sewage (Eschrique et al., 2014). The net heterotrophy explains the higher production of DIC compared to TA.
Controls of Carbonate Chemistry at Semi-Diurnal and Diel Variabilities
In classical river-dominated estuaries, there is a clear gradient of salinity in the main estuarine channel, with salinities decreasing from the sea to the higher estuary (freshwater domain) (Frankignoulle et al., 1998; Chen et al., 2013). Tropical rivers present lower TA concentrations than temperate/boreal rivers overall (Cai et al., 2008, 2013; Cotovicz et al., 2020a). Consequently, tropical river-dominated estuaries show lower values of pH, DIC, CO32–, Ωcal, and Ωara in the freshwater domain (Salisbury et al., 2008; Hu and Cai, 2011), and these carbonate chemistry parameters tend to increase seaward or during flooding tides. However, the JRE did not present this classical salinity gradient frequently, and principally during dry conditions; to the contrary, the estuary presents increasing salinity, pH, DIC, TA, CO32–, Ωcal, and Ωara during ebb tides (Figure 3). The high residence time of water in the estuary contributes to the high rates of evaporation, resulting in hypersalinity and creating this atypical pattern of carbonate chemistry at semi-diurnal (tidal-driven) time scale. Evaporation would increase solute concentrations (TA, DIC) and salinity simultaneously without changing the TA/salinity and DIC/salinity ratios (Hu et al., 2015; McCutcheon et al., 2019). Therefore, the residual water (after evaporation) shows higher values of DIC and TA concentrations than the initial seawater entering the estuary. Since evaporation also exerts control on major cations (like Ca2+) and consequently changes the solubility of calcium carbonate minerals, it may have the potential to change the CO32–, Ωcal, and Ωara (Millero, 2007; McCutcheon et al., 2019). Indeed, changing only salinity and keeping the other parameters constant, the CO32–, Ωcal, and Ωara will be lower in waters with salinity of 40 than in waters with salinity of 35, due to the changes in DIC speciation (Middelburg et al., 2020). This means that the proportion of dissolved CO2 to the DIC pool increases, whereas the proportion of CO32– decreases with increasing salinity (maintaining TA and DIC constant).
In addition to this atypical semi-diurnal pattern, the carbonate chemistry in JRE also exhibited a clear light-driven diel cycle due to the influence of biological metabolism. Comparing consecutive periods of lowest tidal height occurring at daytime and night-time, there is a marked difference of CO32– concentrations, and values of pH, Ωcal, and Ωara. The values of these parameters are always lower at night-time because of respiratory processes exceed photosynthetic production of organic matter. There is a variety of organic matter sources available in the estuary, with autochthonous (estuarine phytoplankton) and allochthonous (predominantly mangrove detritus) origins (Mounier et al., 2018; Cavalcante et al., 2021). The respiratory processes lead to a production of CO2, reducing the CO32– concentrations, and values of pH, Ωcal, and Ωara. On the other hand, the concentrations of CO32– and values of pH, Ωcal, and Ωara were higher at daytime because of primary production, with uptake of CO2 (Cotovicz et al., 2018; Cyronak et al., 2018). The phytoplankton biomass is highest at daytime and during ebb tide conditions (Chl a concentrations reach up to 2.5 μg L–1), suggesting that the phytoplankton biomass is concentrated in middle/upper estuarine sections.
The DIC/TA ratio gives information about the buffering capacity of seawater; the waters have lowest buffering capacity when DIC/TA ratio are close to 1 (Egleston et al., 2010). Indeed, the CO32–, pH, Ωcal, and Ωara were lowest when the DIC/TA ratio was at highest levels approaching to 1 (Figure 7). As sulfate reduction and denitrification produce TA and DIC in a very close proportion (1:1), aerobic respiration can be considered the main driver of reduced buffering capacity in the estuary, increasing the DIC/TA. Indeed, the prevalence of respiratory processes over primary production reduces buffering capacity (Anthony et al., 2011; Cotovicz et al., 2018; Cyronak et al., 2018). Enhanced respiratory processes caused by coastal eutrophication has recently been described in estuaries, contributing to coastal acidification (Cai et al., 2011; Wallace et al., 2014). In the JRE, the buffering capacity was lower at night-time than at daytime. This diel pattern was verified in other productive coastal ecosystems, following the diel balance between photosynthesis and respiration. The concentrations of CO32–, and values of pH, Ωcal, and Ωara in the JRE were, in average, slightly lower than those found in adjacent shelf waters (Cotovicz et al., 2020b) suggesting a slight acidification driven by eutrophication in the estuary compared to shelf waters. Calcite minerals were observed in JRE sediments at 30 cm depth by X-ray microanalysis (SEM/EDS), suggesting that the trophic state that affects pH, Ωcal, and Ωara has changed through time (Miguens et al., 2010, 2011).
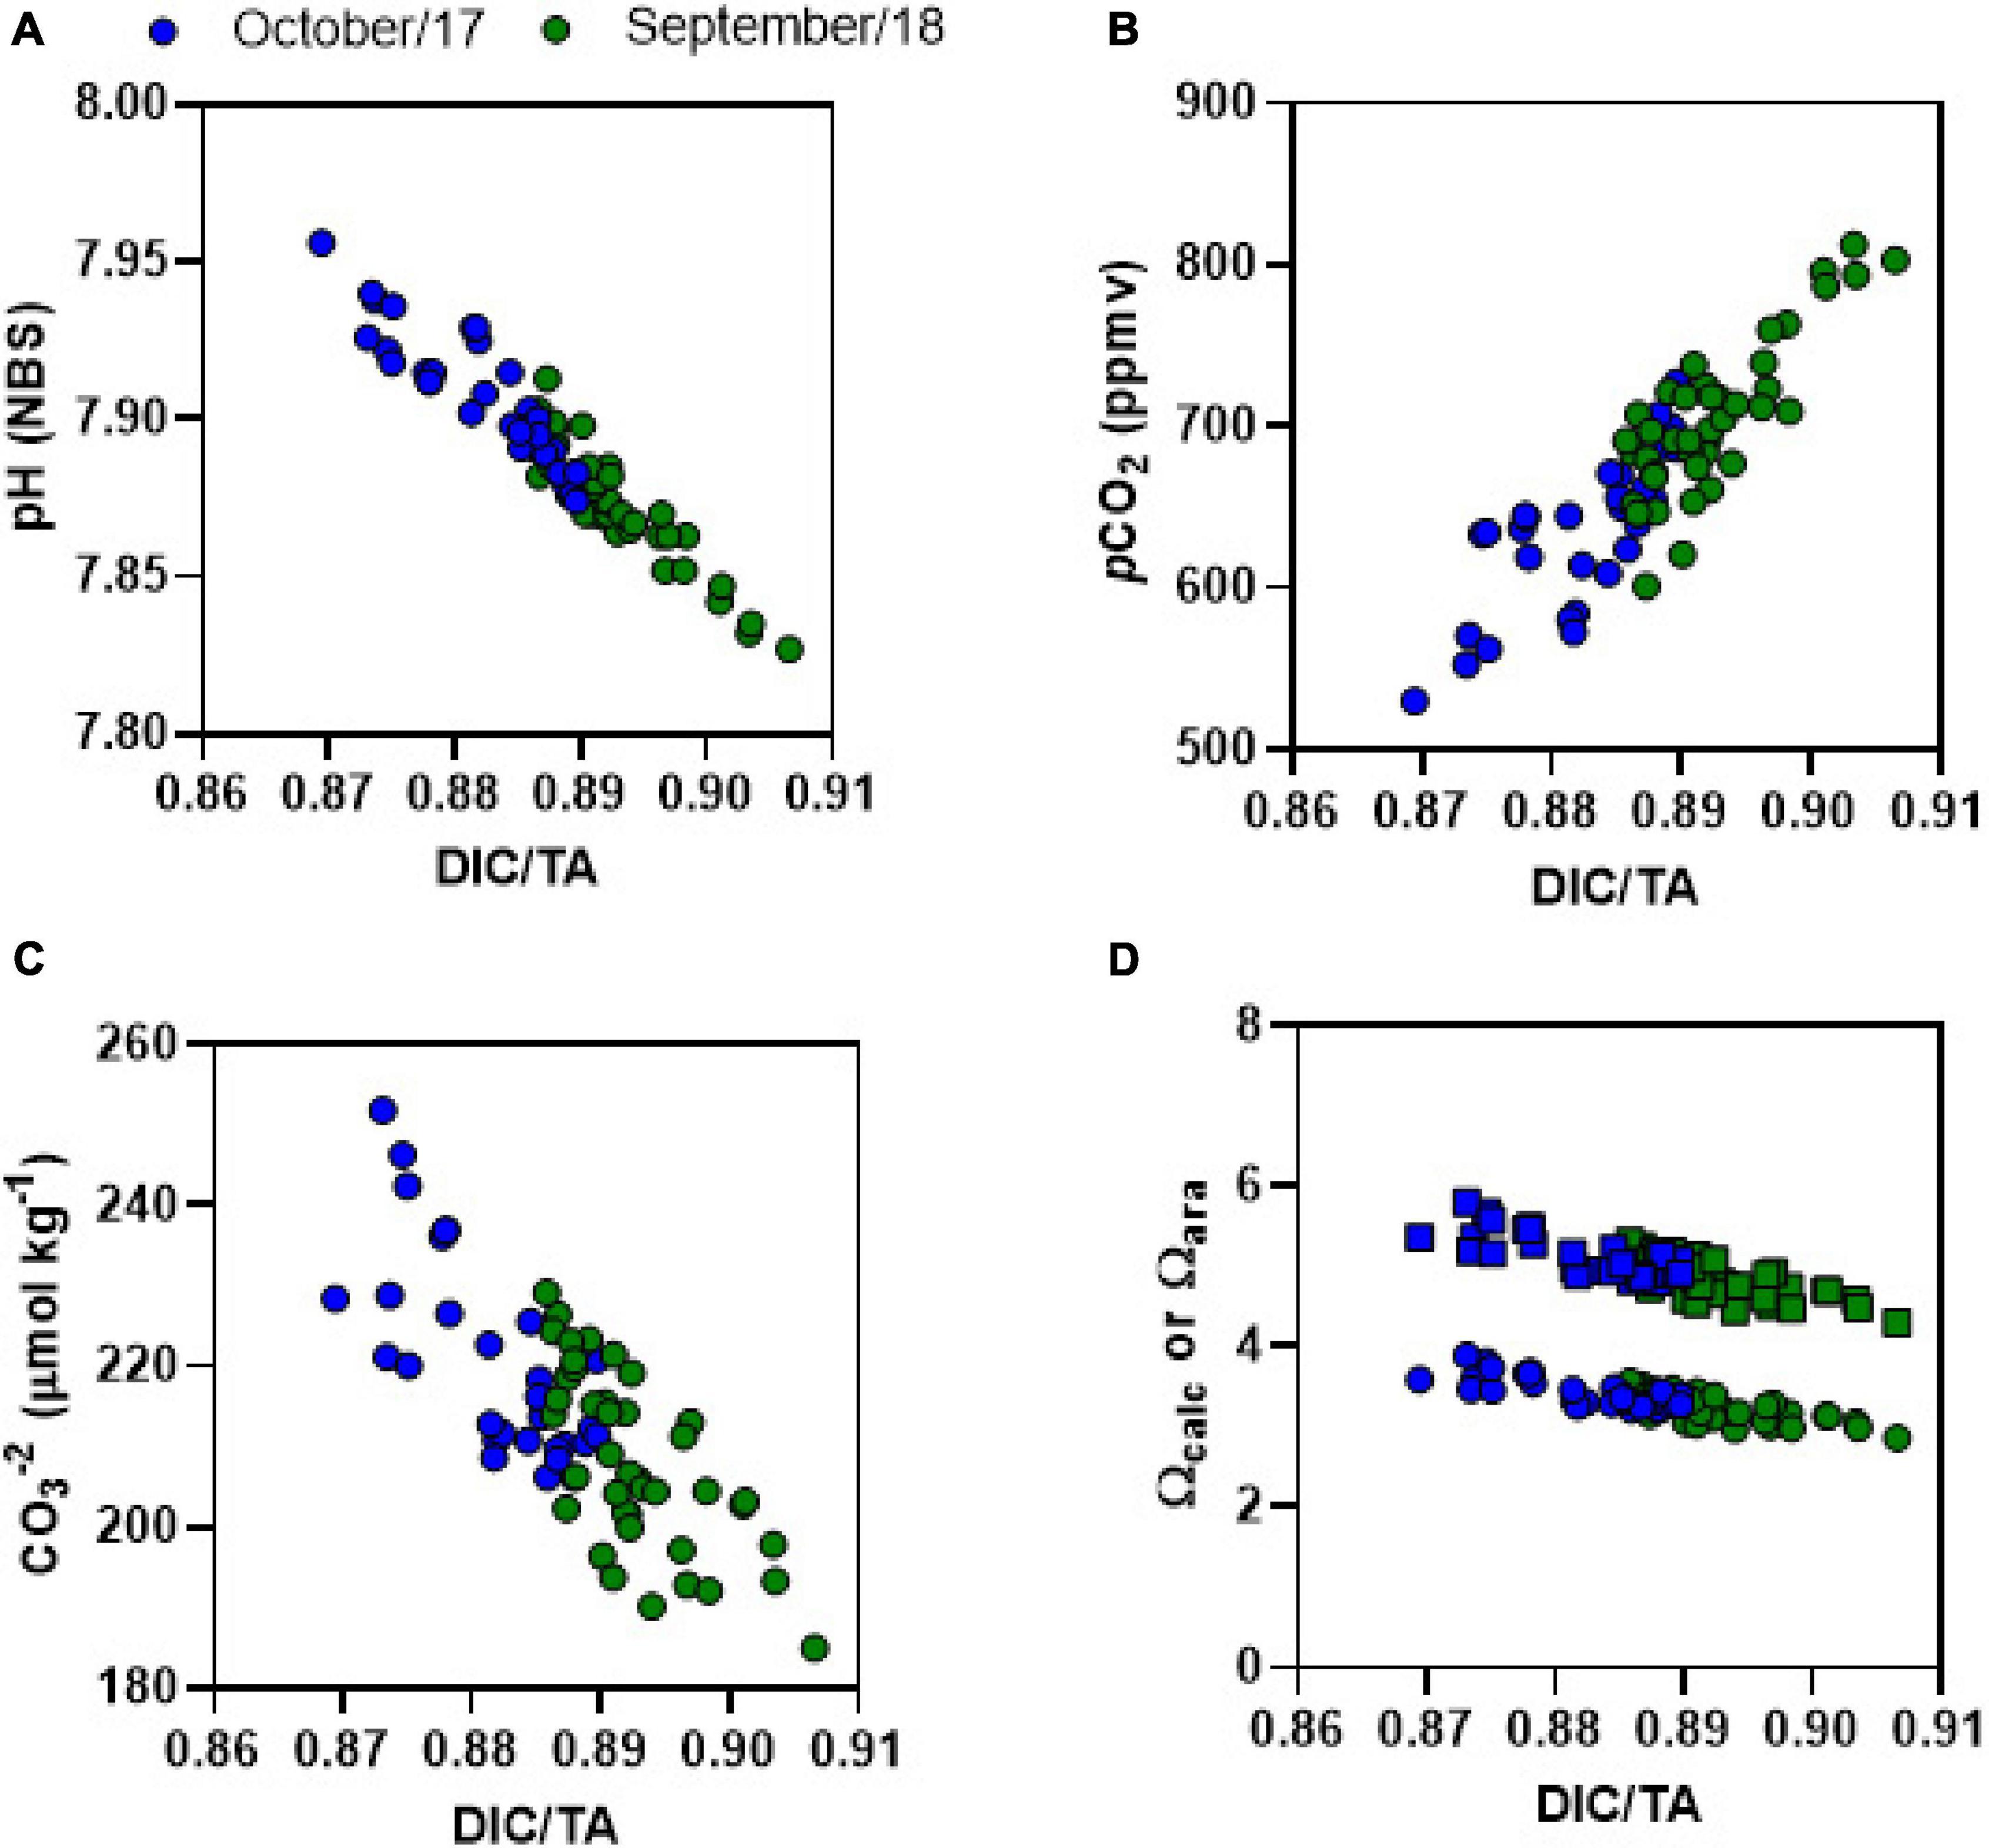
Figure 7. DIC/TA ratio plotted against (A) pH, (B) pCO2, (C) CO32–, and (D) Ωcalc (squares) or Ωara (dots). Blue dots represent Oct-2017 and green dots represent Sep-2018.
pCO2 Variability Amplified by Eutrophication
Overall, estuarine waters are oversaturated in CO2 with respect to atmospheric equilibrium because estuaries are net heterotrophic ecosystems (Borges and Abril, 2011). The JRE follows this pattern, with pCO2 values always above the atmospheric pCO2 (∼ 410 uatm). The variability of pCO2 shows strong influences from semi-diurnal and diel time scales, as described for other carbonate chemistry parameters. The values of pCO2 increases during ebb tides, and decreases during flood tides, a common pattern found in diverse estuaries worldwide (Borges and Abril, 2011). However, in the JRE the higher pCO2 values are coincident with higher salinities, which is not commonly described in estuaries. The hypersalinity in the JRE was developed in more confined waters, coinciding the highest organic matter concentrations and nutrients, which comes from diverse sources, both natural and anthropogenic (Lacerda et al., 2013; Eschrique et al., 2014; Mounier et al., 2018; Marins et al., 2020; Cavalcante et al., 2021). These sources of organic matter contribute to maintain high rates of microbial respiration, sustaining a net heterotrophic metabolism. Indeed, there is a strong positive correlation between pCO2 values and PO43– concentrations, evidencing that microbial production of CO2 and remineralization of nutrients by respiratory processes are coupled in the estuary. Other probable explanation is that part of the CO2 and part of the PO43– in the estuary are coming from same allochthonous sources (shrimp farm; domestic effluents) (Marins et al., 2011, 2020), as well in other eutrophic tropical estuaries (Cotovicz et al., 2015, 2018).
The highest levels of pCO2 occurred at night-time due to the organic matter respiration and absence of photosynthesis (light-driven diel cycle) (Figures 4A,B). Most of the calculated NCP showed negative values (Table 2) indicating that on average the ecosystem is net heterotrophic, confirming an overall metabolism found in estuaries (Borges and Abril, 2011). Even taking into account the net heterotrophy, the estuarine phytoplankton consumes some CO2 from the water column considering that pCO2 values were always lower at daytime compared to night-time considering similar tidal heights. The uptake of CO2 by estuarine phytoplankton is particularly exacerbated in shallow, stratified, and eutrophic ecosystems (Cotovicz et al., 2015). Reduction in pCO2 over daylight corresponds to a diel increase in water temperature and solar radiation (Reiman and Xu, 2019). The net heterotrophy in the JRE seems to amplify the diel variability of pCO2. The diel amplitude of pCO2 values in the JRE was between 219 and 231 μatm. It is highly above than diel variations found in offshore and oligotrophic sites (Dai et al., 2009) but similar to productive coastal bays, nearshore macrophyte meadows, and hypersaline mangrove-dominated wetlands (Borges et al., 2003; Dai et al., 2009; Delille et al., 2009; Saderne et al., 2013), and lower than those found in coral reef ecosystems and mangrove creeks (Dai et al., 2009; Cotovicz et al., 2020a).
In addition to NCP, the contribution of DIC (and pCO2) from other sources can be relevant in the main estuarine channel, particularly from mangrove ecosystems and effluent discharges. Carbon export from mangrove soils to the ocean occurs due to soil’s semi-diurnal inundation by tide, a process called “tidal pumping” (Becherer et al., 2016; Santos et al., 2021). Waters flowing from mangroves during ebb tide are enriched in DIC and pCO2 compared to flood tides (Borges et al., 2003). This outwelling of mangrove-derived carbon can partially sustain the high pCO2 values found in the main estuarine channel of the JRE, as the estuary has about 13,000 ha covered by mangrove forests (Godoy et al., 2018). Furthermore, there is increasing evidence of direct inputs of effluents from shrimp aquaculture ponds and urban discharges into the estuary (Eschrique et al., 2014; Marins et al., 2020; Lacerda et al., 2021). High pCO2 values associate with the mineralization of domestic organic matter was described in urbanized estuaries (Frankignoulle et al., 1998; Borges and Abril, 2011). The relationship between E-DIC and AOU shows that JRE present values above the 1:1 line (Figure 8), which represents the quotient between photosynthesis and respiration (Borges and Abril, 2011). The deviation above this line confirms additional sources of sources of DIC (and pCO2) other than NCP. Moreover, there is thermodynamic influences supporting high pCO2 values. The CO2 solubility in hypersaline and warm waters is low (Millero, 2007). Thermodynamic calculations using CO2Calc (Robbins et al., 2011) show that the increase of 1°C in water temperature and 1 unit in water salinity increase the pCO2 in 25 and 16 μatm, respectively. Hypersaline and warm water holds less dissolved CO2 increasing the pCO2, a process described in another evaporative estuary (Yao and Hu, 2017; McCutcheon et al., 2019). However, at the diel time scale, the changes of pCO2 driven by thermodynamics are minor compared to influences driven by ecosystem metabolism and allochthonous sources.
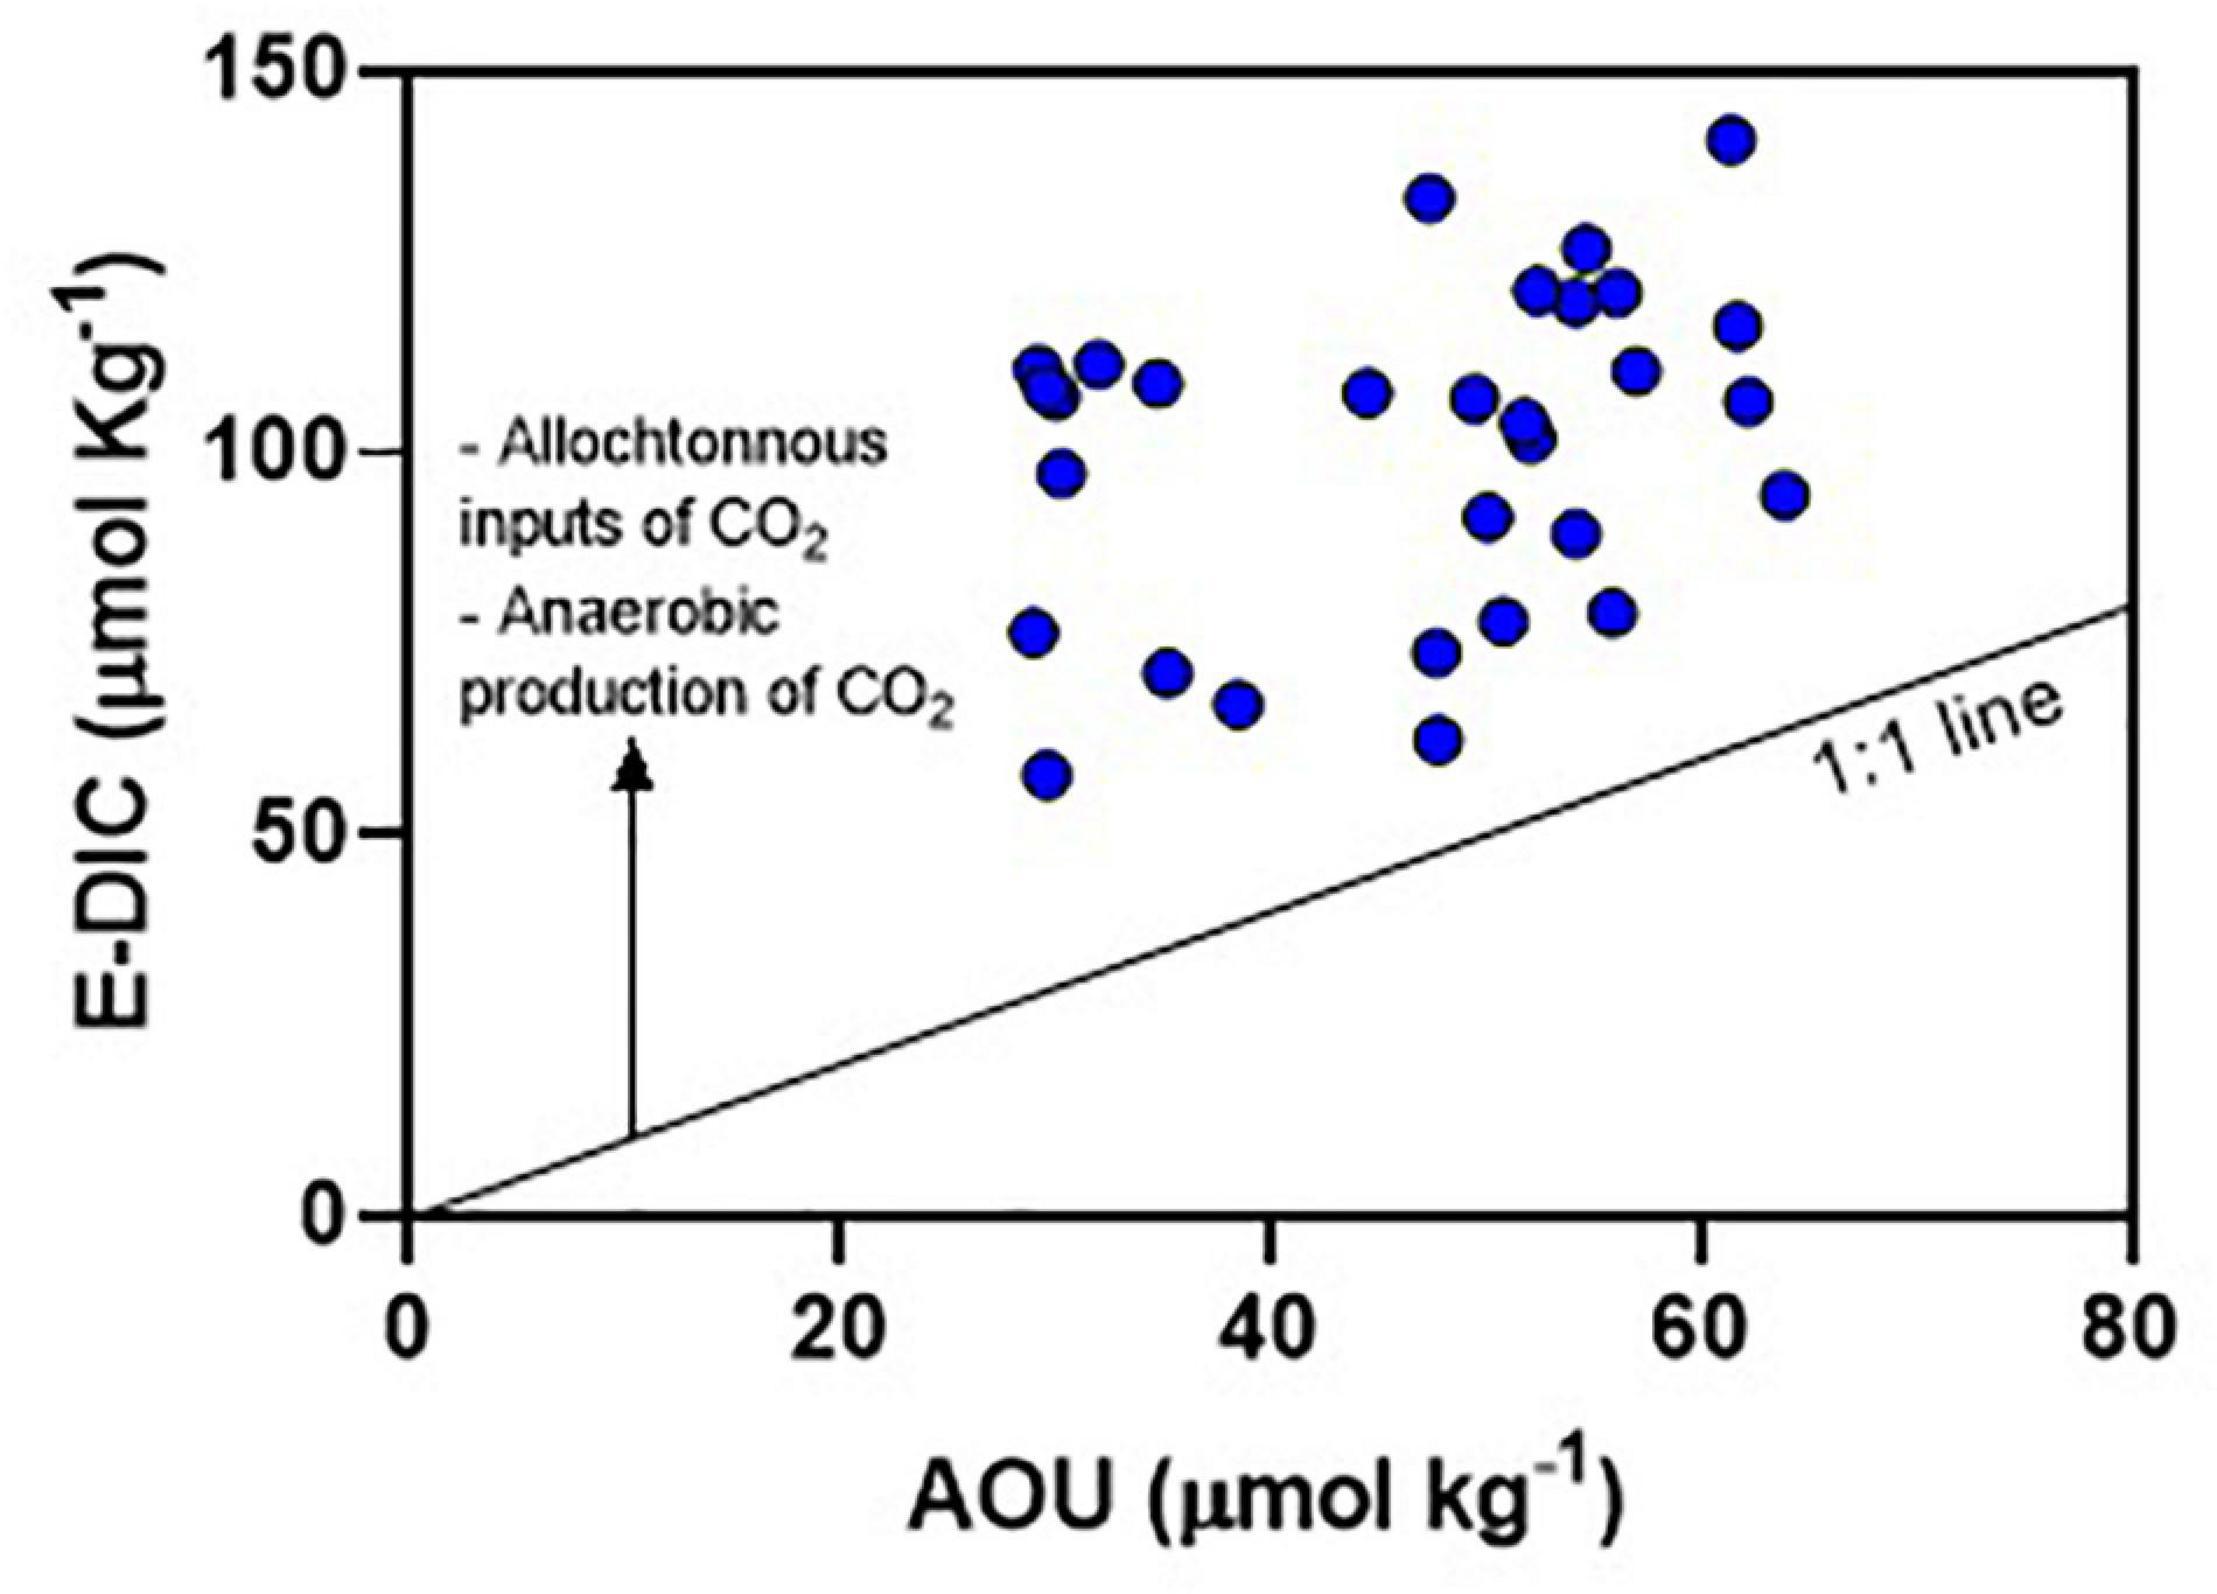
Figure 8. Relationship between the excess dissolved inorganic carbon (E-DIC) and apparent oxygen utilization (AOU) for Oct-2017. The 1:1 line represents the quotient between CO2 and O2 during the processes of photosynthesis and respiration.
Emissions of CO2 (Air-Water CO2 Fluxes) and Implications Considering the Undergoing Processes of Climate Change and Eutrophication Worldwide
Estuaries show large range of variability in the values of gas transfer velocity (k660) as a function of wind speed compared to lakes, streams, rivers, and open ocean environments (Borges and Abril, 2011). The gas transfer velocity is highly site-specific and one of the major uncertainties in estimating flux rates for CO2 (Borges and Abril, 2011; Wanninkhof, 2014; Jeffrey et al., 2018). For that reason, when the gas transfer velocity is not directly measured, it is recommended to quantify the air-water CO2 fluxes using different parameterizations to provide a wider range of air-water CO2 flux estimates (Jeffrey et al., 2018; Akhand et al., 2021). That is the reason we have applied four commonly used k660 parameterizations (McGillis et al., 2001; Raymond and Cole, 2001; Jiang et al., 2008; Wanninkhof, 2014). The FCO2 in the JRE showed a strong diel influence driven by wind velocity and pCO2 disequilibria. Indeed, some estuaries show daytime decrease in pCO2 in coincidence with increase in average wind speed (Reiman and Xu, 2019). In others, the increased evasion during the day is explained by usually higher wind velocities during this period (Cotovicz et al., 2015; Maher et al., 2015). Summarizing, the highest CO2 effluxes in the JRE are verified when the gradient of pCO2 at the air-water interface and wind velocities are greatest.
A global estuarine compilation of air-water CO2 emissions showed that lower estuaries (with salinities higher than 25) are weak sources of CO2 (23.0 ± 38.3 mmol C m–2 d–1) (Chen et al., 2013). With respect to latitude, lower latitude estuaries exhibited moderate emissions (23.5–0°S: 44 ± 29 mmol C m–2 d–1; 0–23.5°N: 39 ± 55 mmol C m–2 d–1) (Chen et al., 2013). The average of CO2 emissions in the middle JRE estuarine portion is 51.9 ± 26.7 mmol C m–2 d–1 and higher than values verified in other estuaries with similar characteristics. Our values are close to those found in tropical waters surrounding mangrove forests, with air-water CO2 fluxes of about 50 mmolC m–2 d–1 (Borges et al., 2003; Maher et al., 2015). Overall, the hypersaline estuarine waters hold less dissolved CO2 contributing to enhanced CO2 efflux, a pattern found in estuaries located at the northwestern Gulf of Mexico (Yao and Hu, 2017; Yao et al., 2020). Our averaged values of CO2 outgassing exceeded those found in hypersaline waters in the northwestern Gulf of Mexico estuaries, suggesting that eutrophication and allochthonous contributions from mangrove and effluent discharges in the JRE can amplify the CO2 efflux in these hypersaline waters.
Figure 9 shows a conceptual model with interrelations between semi-arid climate, river damming, eutrophication, and carbonate chemistry (with emphasis on CO2 emissions) in the JRE. The presence of organic matter retained by the negative estuary enhances the respiratory processes, decreasing the pH values and DIC/TA ratio (buffering capacity), but increasing the pCO2 and CO2 emissions. Consequently, CO2 emissions by the estuarine waters are about 10 times higher compared to nearshore waters (Carvalho et al., 2017; Cotovicz et al., 2020b). Observations and modeling presume the increase of evaporation compared to precipitation in arid/semi-arid regions as the result of climate change (Chou et al., 2009; Huang et al., 2017) and in JRE this process is potentiated by river damming (Dias et al., 2009; Lacerda et al., 2020). Currently, semi-arid regions cover ∼15% of the Earth’s continental surface (Safriel and Adeel, 2005), and the global area of drylands is estimated to expand ∼10% by 2,100 (Feng and Fu, 2013). Indeed, Godoy et al. (2018) reported a 5.6 mm yr–1 decrease in annual rainfall over the Jaguaribe River basin from the late 1960s that has accelerated in the past 50 years. The consequences of this decrease in rainfall were potentialized by the construction of five large dams. Concomitantly, the eutrophication of estuaries is a widespread environmental problem and particularly enhanced in densely populated regions (Cloern et al., 2014). Despite the recent efforts to implement wastewater treatment plans in developing countries (Tong et al., 2020), the delivery of nitrogen and phosphorus is continuing to grow with urbanization and the associated population increase (Larsen et al., 2016). The water quality of the Jaguaribe River reflects this tropical scenario of environmental degradation, sustaining an increasing process of eutrophication (Eschrique et al., 2014; Marins et al., 2020). The current levels of Ωara and pCO2 are still higher than 2 (supersaturation) and less than 1,000 μatm (hypercapnia), respectively, and similar to other tropical evaporative estuaries (McCutcheon et al., 2019). However, eutrophication and warming tend to increase the values of pCO2 and CO2 efflux in the estuary, which could be critical in the coming years considering the actual scenario of climate change and environmental degradation. The enhanced respiratory processes driven by eutrophication tend to decrease the pH, concentrations of CO32–, and vales of Ωara and Ωcal. The critical levels of Ωcal and Ωara (<1) will probably appear early in the JRE compared to adjacent coastal waters due to the ongoing process of eutrophication. Indeed, the coastal eutrophication could increase the susceptibility of coastal waters to ocean acidification (Cai et al., 2011). The diel variability of pH exceeded 0.1 in the JRE, which is the magnitude comparable to the change in the mean ocean pH during the industrial era (Orr et al., 2005). Finally, the amplitude of diel variations is expected to increase with increasing aquatic pCO2 values in the future, because of simultaneously decreasing buffer capacity driven by global (ocean acidification) (Schulz and Riebesell, 2013), and local (enhanced respiration) processes (Cai et al., 2011).
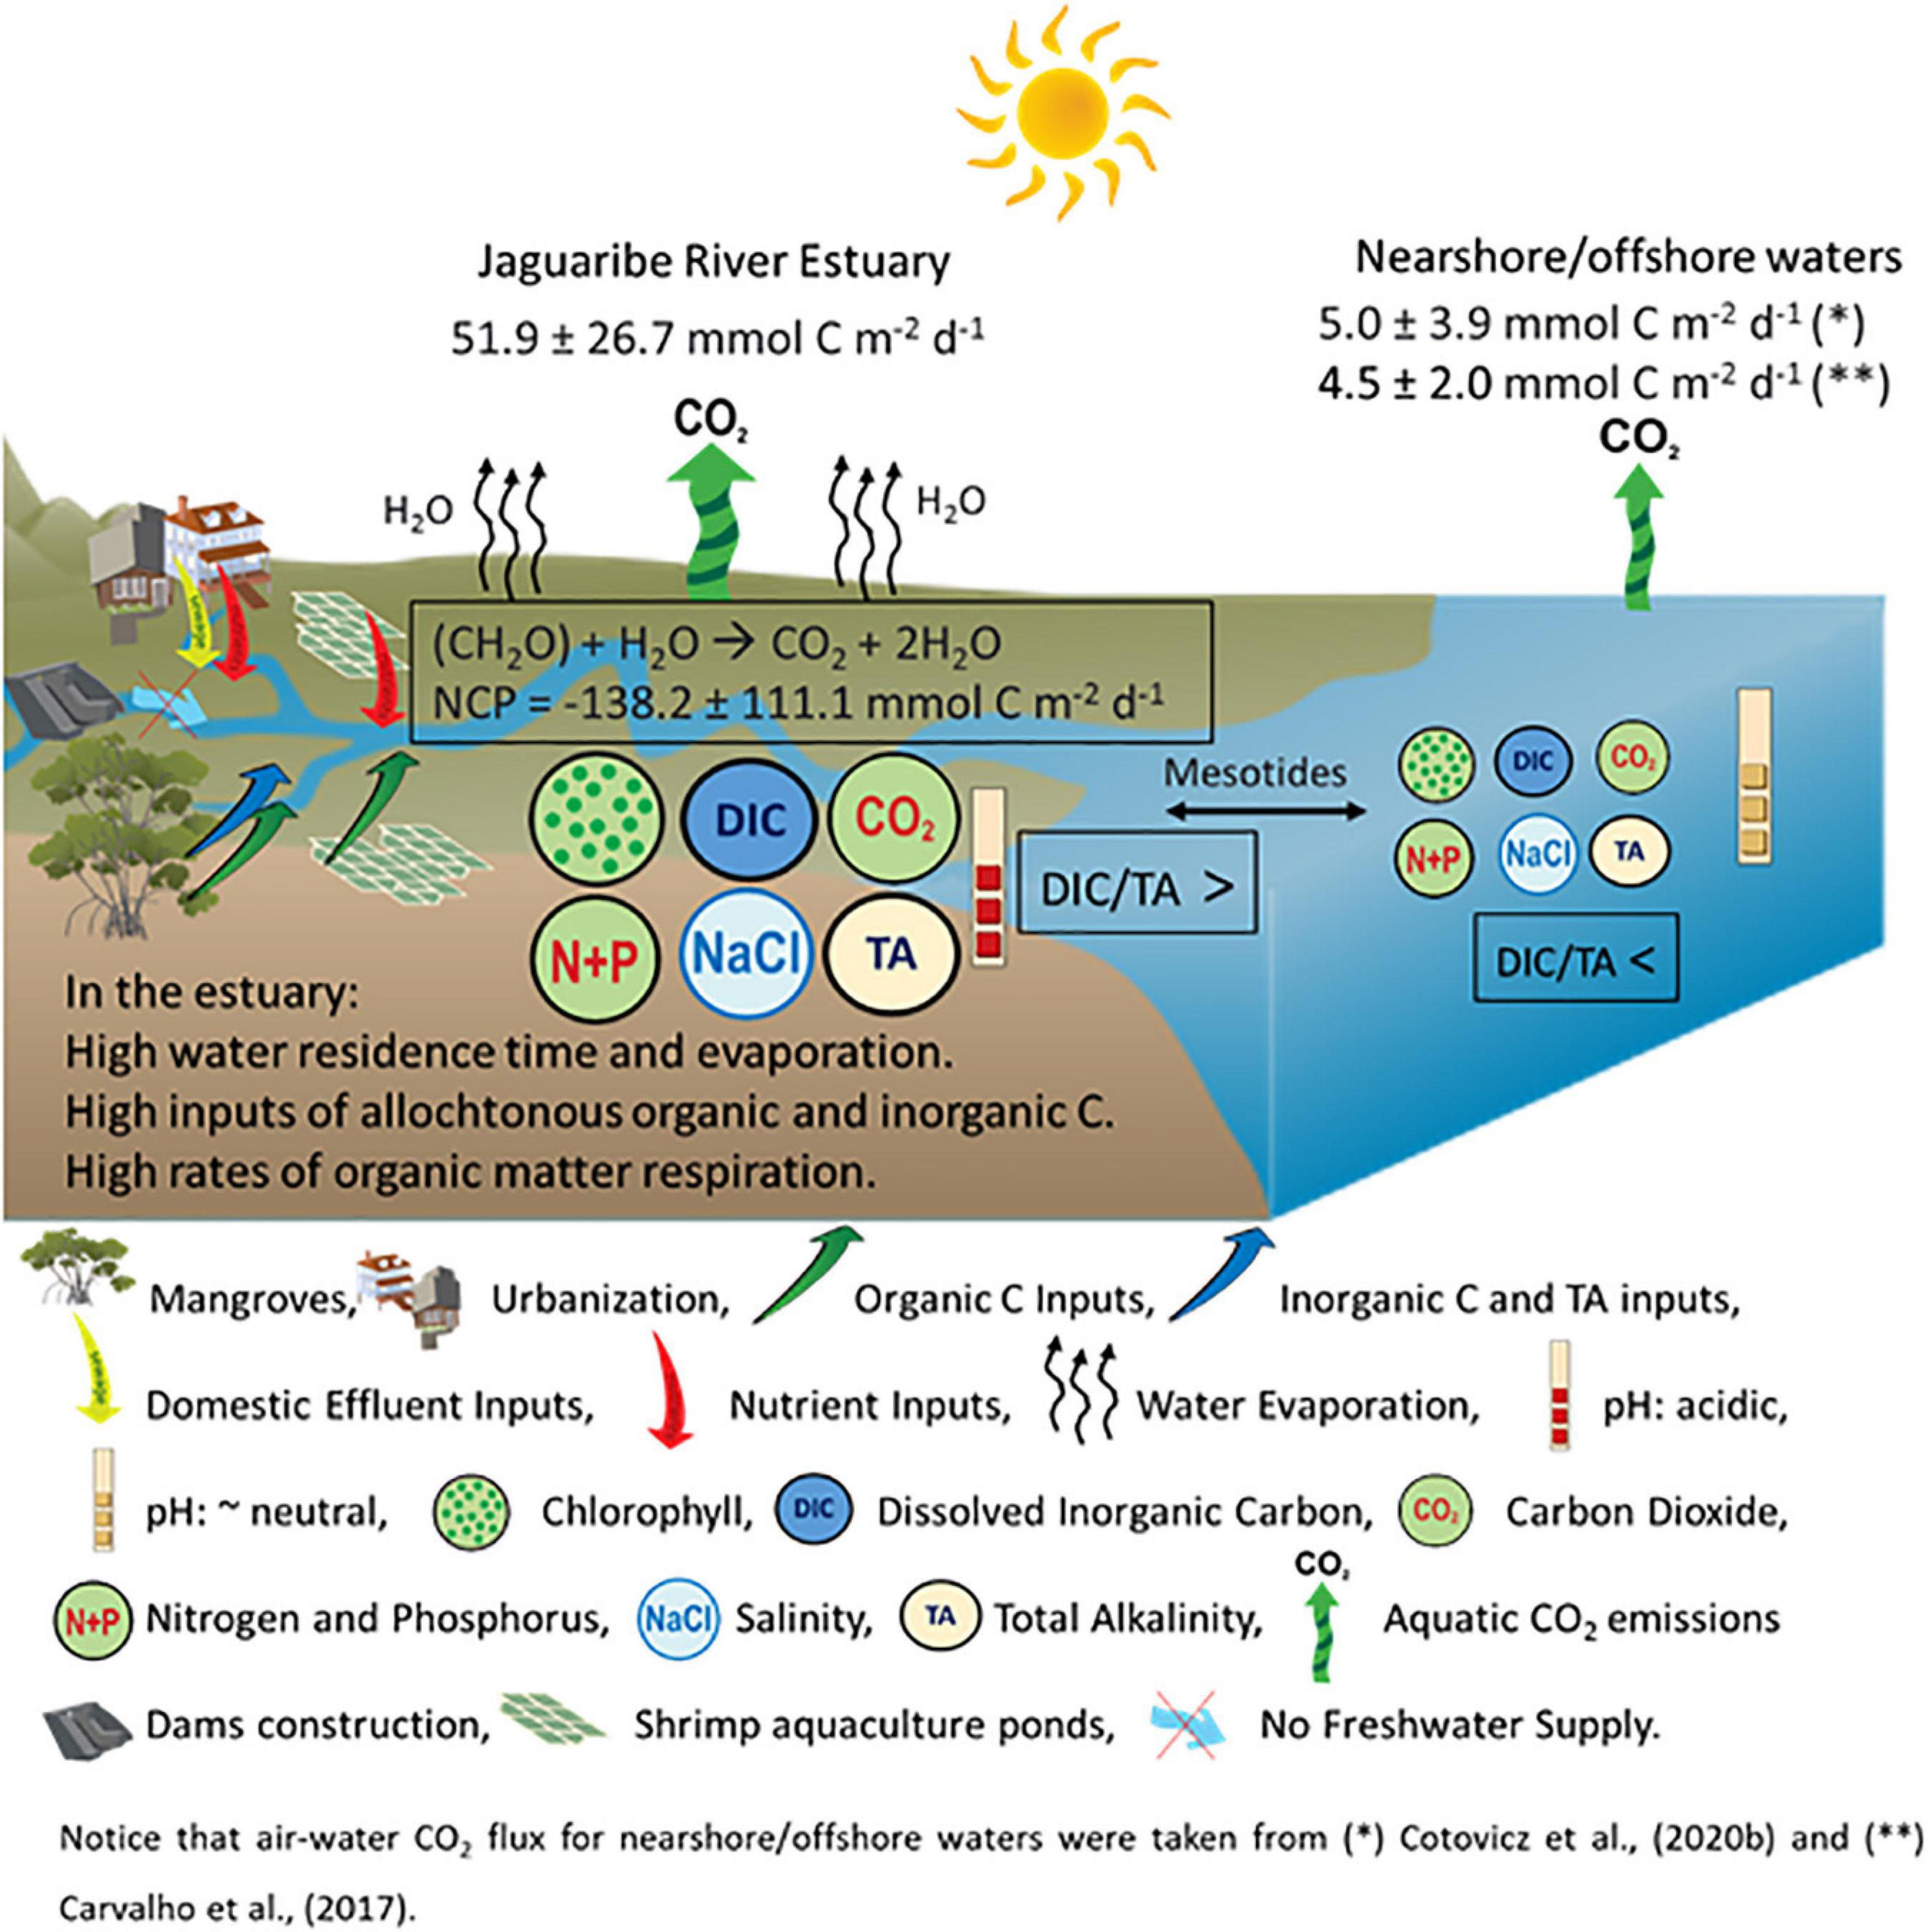
Figure 9. Conceptual model showing the interrelations between semi-arid climate, river damming, eutrophication, and carbonate chemistry in the Jaguaribe River Estuary under dry conditions, and comparison with nearshore waters (Carvalho et al., 2017; Cotovicz et al., 2020b). The larger size of the circles in the estuarine waters represents higher values (for chlorophyll, DIC, TA, CO2, nutrients, and salinity) compared to nearshore waters, but are not proportional to measured values.
Conclusion
The diel variability of carbonate chemistry was investigated in the JRE under severe drought conditions. The estuary shows higher salinity, TA and DIC concentrations compared to adjacent coastal waters, confirming an evaporative and inverse estuary. The salinity, TA and DIC concentrations increase during ebb tides, a different trend compared to most estuaries. However, the concentrations of TA and DIC are above than those calculated by the evaporation model, evidencing additional sources in the estuary (biological metabolism, mangroves, effluent discharges). Overall, the carbonate chemistry parameters were governed by a combination of semi-diurnal and diel tendencies. Semi-diurnal variability was driven by the tidal movement, with increasing pCO2, and decreasing pH, CO32–, Ωara, and Ωcal during ebbing tides, and an inverse pattern verified during flooding tides. The diel variability was governed by the light-driven biological cycle. Comparing pCO2 values occurring in similar conditions of tidal heights but at different hour of the day, the highest values of pCO2 were always verified during night-time due to respiratory processes and absence of photosynthesis. The aquatic pCO2 values were always above the atmospheric values. The estuary behaved as a CO2 source, averaging 51.9 ± 26.7 mmol C m–2 d–1, which is higher than verified in other similar environments due to enhanced heterotrophy driven by eutrophication. Considering that human population is increasing in coastal regions, and many coastal regions of the world are experiencing increases in aridity as the result of climate change (IPCC, 2021), the present study may provide important insights of future conditions regarding carbon cycling and carbon budget in other aquatic coastal ecosystems worldwide.
Data Availability Statement
The raw data supporting the conclusions of this article will be made available by the authors, without undue reservation.
Author Contributions
LC: data analysis, writing, reviewing, and editing. RM: conceptualization, experiment design, sampling, funding acquisition, writing, and reviewing. AS: experiment design, sampling, and analytical procedures. All authors contributed to the article and approved the submitted version.
Funding
This study was financed by the Fundação Cearense de Apoio ao Desenvolvimento Científico e Tecnologico (FUNCAP; Proc. No. INT-00159-00009.01.00/19 and FUNCAP PV2-00125-00405.01.00/21), and the Programa de Apoio a Núcleos de Excelência (PRONEX; Proc. No. PR2-0101-0052.01.00/2015).
Conflict of Interest
The authors declare that the research was conducted in the absence of any commercial or financial relationships that could be construed as a potential conflict of interest.
Publisher’s Note
All claims expressed in this article are solely those of the authors and do not necessarily represent those of their affiliated organizations, or those of the publisher, the editors and the reviewers. Any product that may be evaluated in this article, or claim that may be made by its manufacturer, is not guaranteed or endorsed by the publisher.
Acknowledgments
LC thanks the Fundação Cearense de Apoio ao Desenvolvimento Científico e Tecnológico (FUNCAP) for a visiting professor grant at the Marine Sciences Institute (LABOMAR)—UFC. Thanks are also due to Francisco ATF Silva, from INPE- Instituto Nacional de Pesquisa Espacial, Eusébio, Ceará, for supervising the equipment developed to these studies in the Brazilian Equatorial Coast. The symbols used in Figure 9 are a courtesy of the Integration and Application Network, University of Maryland Center for Environmental Science (ian.umces.edu/symbols/).
References
Abril, G., and Frankignoulle, M. (2001). Nitrogen – alkalinity interactions in the highly polluted Scheldt Basin (Belgium). Water Res. 35, 844–850. doi: 10.1016/S0043-1354(00)00310-9
Abril, G., Commarieu, M., Sottolichio, A., Bretel, P., and Guérin, F. (2009). Turbidity limits gas exchange in a large macrotidal estuary. Estuar. Coast. Shelf Sci. 83, 342–348.
Akhand, A., Chanda, A., Watanabe, K., Das, S., Tokoro, T., Hazra, S., et al. (2021). Reduction in riverine freshwater supply changes inorganic and organic carbon dynamics and air-water CO2 fluxes in a tropical mangrove dominated estuary. J. Geophys. Res. Biogeosci. 126:e2020JG006144. doi: 10.1029/2020JG006144
Anthony, K. R. N., Maynard, J. A., Diaz-Pulido, G., Mumby, P. J., Marshall, P. A., Cao, L., et al. (2011). Ocean acidification and warming will lower coral reef resilience. Glob. Chang. Biol. 17, 1798–1808. doi: 10.1111/j.1365-2486.2010.02364.x
Becherer, J., Flöser, G., Umlauf, L., and Burchard, H. (2016). Estuarine circulation versus tidal pumping: sediment transport in a well-mixedtidal inlet. J. Geophys. Res. Oceans 121, 6251–6270. doi: 10.1002/2016JC011640
Borges, A. V. (2005). Do we have enough pieces of the jigsaw to integrate CO2 fluxes in the coastal ocean? Estuaries 28, 3–27. doi: 10.1007/BF02732750
Borges, A. V., and Abril, G. (2011). “Carbon dioxide and methane dynamics in estuaries,” in Treatise on Estuarine and Coastal Science, Vol. 5, eds E. Wolanski and D. McLusky (Waltham, MA: Academic Press), 119–161.
Borges, A. V., and Gypens, N. (2010). Carbonate chemistry in the coastal zone responds more strongly to eutrophication than ocean acidification. Limnol. Oceanogr. 55, 346–353.
Borges, A. V., Djenidi, S., Lacroix, G., Theate, J., Delille, B., and Frankignoulle, M. (2003). Atmospheric CO2 flux from mangrove surrounding waters. Geophys. Res. Lett. 30:1558. doi: 10.1029/2003GL017143
Bouillon, S., Dehairs, F., Schiettecatte, L.-S., and Borges, A. V. (2007). Biogeochemistry of the Tana estuary and delta (Northern Kenya). Limnol. Oceanogr. 52, 46–59. doi: 10.4319/lo.2007.52.1.0046
Bozec, Y., Merlivat, L., Baudoux, A. C., Beaumont, L., Blain, S., Bucciarelli, E., et al. (2011). Diurnal to inter-annual dynamics of pCO2 recorded by a CARIOCA sensor in a temperate coastal ecosystem (2003–2009). Mar. Chem. 126, 13–26.
Cai, W.-J., Chen, C.-T. A., and Borges, A. V. (2013). “Carbon dioxide dynamics and fluxes in coastal waters influenced by river plumes,” in Biogeochemical Dynamics at Major River-Coastal Interfaces: Linkages with Global Change, eds T. Bianchi, M. Allison, and W.-J. Cai (Cambridge: Cambridge University Press), 155–173.
Cai, W.-J., Guo, X., Chen, C.-T. A., Dai, M., Zhang, L., Zhai, W., et al. (2008). A comparative overview of weathering intensity and HCO3- flux in the world’s major rivers with emphasis on the Changjiang, Huanghe, Zhujiang (pearl) and Mississippi Rivers. Cont. Shelf Res. 28, 1538–1549. doi: 10.1016/j.csr.2007.10.014
Cai, W.-J., Hu, X., Huang, W.-J., Murrell, M. C., Lehrter, J. C., Lohrenz, S. E., et al. (2011). Acidification of subsurface coastal waters enhanced by eutrophication. Nat. Geosci. 4, 766–770. doi: 10.1038/ngeo1297
Campos, J. N. B., Studart, T. M., Luna, R., and Franco, S. (2000). “Hydrological transformations in Jaguaribe river basin during 20th century,” in Proceedings of the 20th Annual American Geophysical Union, Vol. 1. (Fort Collins, CO: Hydrology Days Publications), 221–227.
Carvalho, A. C. O., Marins, R. V., Dias, F. J. S., Rezende, C. E., Lefevre, N., Cavalcante, M. S., et al. (2017). Air-sea CO 2 fluxes for the Brazilian northeast continental shelf in a climatic transition region. J. Mar. Syst. 173, 70–80. doi: 10.1016/j.jmarsys.2017.04.009
Cavalcante, A. A., and Cunha, S. B. (2012). Morfodinâmica fluvial em áreas semiáridas: discutindo o vale do Rio Jaguaribe-CE-Brasil. Rev. Bras. Geomorfol. 13, 39–49.
Cavalcante, M. S., Marins, R. V., Dias, F. J. S., and Rezende, C. E. (2021). Assessment of carbon fluxes to coastal area during persistent drought conditions. Reg. Stud. Mar. Sci. 47:101934. doi: 10.1016/j.rsma.2021.101934
Chen, C.-T. A., Huang, T.-H., Chen, Y.-C., Bai, Y., He, X., and Kang, Y. (2013). Air–sea exchanges of CO2 in the world’s coastal seas. Biogeosciences 10, 6509–6544. doi: 10.5194/bg-10-6509-2013
Chou, C., Neelin, J. D., Chen, C.-A., and Tu, J. Y. (2009). Evaluating the rich-get-richer mechanism in tropical precipitation change under global warming. J. Clim. 22, 1982–2005. doi: 10.1175/2008JCLI2471.1
Cloern, J. E., Foster, S. Q., and Kleckner, A. E. (2014). Phytoplankton primary production in the world’s estuarine-coastal ecosystems. Biogeosciences 11, 2477–2501. doi: 10.5194/bg-11-2477-2014
Cotovicz, L. C., Vidal, L. O., de Rezende, C. E., Bernardes, M. C., Knoppers, B. A., Sobrinho, R. L., et al. (2020a). Carbon dioxide sources and sinks in the delta of the Paraíba do Sul River (Southeastern Brazil) modulated by carbonate thermodynamics, gas exchange and ecosystem metabolism during estuarine mixing. Mar. Chem. 226:103869. doi: 10.1016/j.marchem.2020.103869
Cotovicz, L. C., Chielle, R., and Marins, R. V. (2020b). Air-sea CO2 flux in an equatorial continental shelf dominated by coral reefs (Southwestern Atlantic Ocean). Cont. Shelf Res. 204:104175. doi: 10.1016/j.csr.2020.104175
Cotovicz, L. C., Knoppers, B. A., Brandini, N., Costa Santos, S. J., and Abril, G. (2015). A strong CO2 sink enhanced by eutrophication in a tropical coastal embayment (Guanabara Bay, Rio de Janeiro, Brazil). Biogeosciences 12, 6125–6146. doi: 10.5194/bg-12-6125-2015
Cotovicz, L. C., Knoppers, B. A., Brandini, N., Poirier, D., Costa-Santos, S. J., and Abril, G. (2018). Aragonite saturation state in a tropical coastal embayment dominated by phytoplankton blooms (Guanabara Bay – Brazil). Mar. Pollut. Bull. 129, 729–739. doi: 10.1016/j.marpolbul.2017.10.064
Cotovicz, L. C., Knoppers, B. A., Régis, C. R., Tremmel, D., Costa-Santos, S., and Abril, G. (2021). Eutrophication overcoming carbonate precipitation in a tropical hypersaline coastal lagoon acting as a CO2 Sink (Araruama Lagoon, SE Brazil). Biogeochemistry 156, 231–254. doi: 10.1007/s10533-021-00842-3
Cyronak, T., Andersson, A. J., D’Angelo, S., Bresnahan, P., Davidson, C., Griffin, A., et al. (2018). Short-term spatial and temporal carbonate chemistry variability in two contrasting seagrass meadows: implications for pH buffering capacities. Estuar. Coasts 41, 1282–1296. doi: 10.1007/s12237-017-0356-5
Dai, M., Lu, Z., Zhai, W., Chen, B., Cao, Z., Zhou, K., et al. (2009). Diurnal variations of surface seawater pCO2 in contrasting coastal environments. Limnol. Oceanogr. 54, 735–745.
Delille, B., Borges, A. V., and Delille, D. (2009). Influence of giant kelp beds (Macrocystis pyrifera) on diel cycles of pCO2 and DIC in the Sub-Antarctic coastal area. Estuar. Coast. Shelf Sci. 81, 114–122. doi: 10.1016/j.ecss.2008.10.004
Dias, F. J., Castro, B. M., Lacerda, L. D., Miranda, L. B., and Marins, R. V. (2016). Physical characteristics and discharges of suspended particulate matter at the continent-ocean interface in an estuary located in a semiarid region in northeastern Brazil. Estuar. Coast. Shelf Sci. 180, 258–274. doi: 10.1016/j.ecss.2016.08.006
Dias, F. J. S., Castro, B. M., and Lacerda, L. D. (2013). Continental shelf water masses off the Jaguaribe River (4S). Northeastern Brazil. Cont. Shelf Res. 66, 123–135. doi: 10.1016/j.csr.2013.06.005
Dias, F. J. S., Marins, R. V., and Maia, L. P. (2009). Hydrology of a well-mixed estuary at the semi-arid Northeastern Brazilian coast. Acta Limnol. Bras. 21, 377–385.
Dickson, A. G. (1990). Standard potential of the reaction: AgCl(s) + 1/2H2(g) = Ag(s) + HCl(aq), and the standard acidity constant of the ion HSO4 in synthetic sea water from 273.15 to 318.15 K. J. Chem. Thermodyn. 22, 113–127. doi: 10.1016/0021-9614(90)90074-Z
Dickson, A. G., and Millero, F. J. (1987). A comparison of the equilibrium constants for the dissociation of carbonic acid in seawater media. Deep Sea Res. Part A Oceanogr. Res. Pap. 34, 1733–1743. doi: 10.1016/0198-0149(87)90021-5
Dürr, H. H., Laruelle, G. G., van Kempen, C. M., Slomp, C. P., Meybeck, M., and Middelkoop, H. (2011). Worldwide typology of Nearshore coastal systems: defining the estuarine filter of river inputs to the oceans. Estuar. Coasts 34, 441–458. doi: 10.1007/s12237-011-9381-y
Dutta, M. K., Kumar, S., Mukherjee, R., Sharma, N., Acharya, A., Sanyal, P., et al. (2019). Diurnal carbon dynamics in a mangrove-dominated tropical estuary (Sundarbans, India). Estuar. Coast. Shelf Sci. 229:106426. doi: 10.1016/j.ecss.2019.106426
Egleston, E. S., Sabine, C. L., and Morel, F. M. M. (2010). Revelle revisited: buffer factors that quantify the response of ocean chemistry to changes in DIC and alkalinity. Glob. Biogeochem. Cycles 24, 1–9. doi: 10.1029/2008GB003407
Eschrique, S. A., Marins, R. V., Chiozzini, V. G., and Braga, E. S. (2014). “Alteration of dissolved nitrogen forms in Brazilian estuaries and its relation to the anthropogenic influence,” in Procesos Geoquímicos Superficiales en Iberoamérica, 1aed Edn, eds J. E. Marcovecchio, S. E. Botté, and R. H. Freije (Salamanca: SOCIEDAD IBEROAMERICANA DE FÍSICA Y QUÍMICA AMBIENTAL), 165–178.
Fairchild, W., and Hales, B. (2021). High-resolution carbonate system dynamics of Netarts Bay, OR from 2014 to 2019. Front. Mar. Sci. 7:590236. doi: 10.3389/fmars.2020.590236
Feng, S., and Fu, Q. (2013). Expansion of global drylands under a warming climate. Atmos. Chem. Phys. 13, 10081–10094. doi: 10.5194/acp-13-10081-2013
Frankignoulle, M., Abril, G., Borges, A., Bourge, I., Canon, C., Delille, B., et al. (1998). Carbon dioxide emission from European estuaries. Science 282, 434–436.
Friedlingstein, P., Jones, M. W., O’Sullivan, M., Andrew, R. M., Hauck, J., Peters, G. P., et al. (2019). Global carbon budget 2019. Earth Syst. Sci. Data 11, 1783–1838. doi: 10.5194/essd-11-1783-2019
FUNCEME (2021). Fundação Cearense de Meteorologia – FUNCEME. Chuva Média Anual por Região Hidrográfica. Available online at: http://www.funceme.br/hidro-ce-app/regioes-hidrograficas/precipitacao/regioes-hidrograficas-precipitacao-anual (accessed July 26, 2021).
Godoy, M. D. P., Meireles, A. J., and Lacerda, L. D. (2018). Mangrove response to land use change in estuaries along the semiarid coast of Ceará. Braz. J. Coast. Res. 343, 524–533. doi: 10.2112/jcoastres-d-16-00138.1
Gómez-Gener, L., Rocher-Ros, G., Battin, T., Cohen, M. J., Dalmagro, H. J., Dinsmore, K. J., et al. (2021). Global carbon dioxide efflux from rivers enhanced by high nocturnal emissions. Nat. Geosci. 14, 289–294. doi: 10.1038/s41561-021-00722-3
Gran, G. (1952). Determination of the equivalence point in potentiometric titrations-part II. Analyst 77, 661–671.
Hansen, H. P., and Koroleff, F. (1983). “Determination of nutrients,” in Methods of Seawater Analysis, 3. Edn, eds K. Grasshoff, K. Kremiling, and M. Ehrhardt (Hoboken, NJ: Wiley-VCH), 159–228.
Hu, X., and Cai, W.-J. (2011). An assessment of ocean margin anaerobic processes on oceanic alkalinity budget. Glob. Biogeochem. Cycles 25:GB3003. doi: 10.1029/2010GB003859
Hu, X., Pollack, J. B., McCutcheon, M. R., Montagna, P. A., and Ouyang, Z. (2015). Long-term alkalinity decrease and acidification of estuaries in Northwestern Gulf of Mexico. Environ. Sci. Technol. 49, 3401–3409. doi: 10.1021/es505945p
Huang, J., Li, Y., Fu, C., Chen, F., Fu, Q., Dai, A., et al. (2017). Dryland climate change: recent progress and challenges. Rev. Geophys. 55, 719–778. doi: 10.1002/2016RG000550
IPCC (2021). “Summary for Policymakers,” in Climate Change 2021: The Physical Science Basis. Contribution of Working Group I to the Sixth Assessment Report of the Intergovernmental Panel on Climate Change, eds V. Masson-Delmotte, P. Zhai, A. Pirani, S. L. Connors, C. Péan, S. Berger, et al. (Cambridge: Cambridge University Press).
IPECE (2017). Instituto de Pesquisa e Estratégia Econômica do Ceara. Available online at: http://www2.ipece.ce.gov.br/publicacoes/anuario/anuario2017/infraEstrutura/habitacao/saneamento.htm (accessed January 15, 2021)
Jeffrey, L. C., Maher, D. T., Santos, I. R., Call, M., Reading, M. J., Holloway, C., et al. (2018). The spatial and temporal drivers of pCO2, pCH4 and gas transfer velocity within a subtropical estuary. Estuar. Coast. Shelf Sci. 208, 83–95. doi: 10.1016/j.ecss.2018.04.022
Jeffrey, S. W., and Humphrey, G. F. (1975). New spectrophotometric equations for determining chlorophylls a, b, c1 and c2 in higher plants, algae and natural phytoplankton. Biochem. Physiol. Pflanz. 167, 191–194. doi: 10.1016/S0015-3796(17)30778-3
Jiang, L. Q., Cai, W. J., and Wang, Y. C. (2008). A comparative study of carbon dioxide degassing in river- and marinedominated estuaries. Limnol. Oceanogr. 53, 2603–2615.
Lacerda, L. D., Dias, F. J. S., Marins, R. V., Soares, T. M., Godoy, J. M. O., and Godoy, M. L. D. P. (2013). Pluriannual watershed discharges of Hg into a tropical semi-arid estuary of the Jaguaribe River. NE Brazil. J. Braz. Chem. Soc. 24, 1719–1731.
Lacerda, L. D., Marins, R. V., Dias, F. J., and da, S. (2020). An arctic paradox: response of fluvial Hg inputs and bioavailability to global climate change in an extreme coastal environment. Front. Earth Sci. 8:93. doi: 10.3389/feart.2020.00093
Lacerda, L. D., Ward, R. D., Godoy, M. D. P., de Andrade Meireles, A. J., Borges, R., and Ferreira, A. C. (2021). 20-Years cumulative impact from shrimp farming on mangroves of Northeast Brazil. Front. For. Glob. Change 4:653096. doi: 10.3389/ffgc.2021.653096
Lamparelli, M. C. (2004). Graus de Trofia em Corpos D’água do Estado de São Paulo: Avaliação dos Métodos de Monitoramento. Tese (Doutorado). Universidade de São Paulo, 235. Available online at: www.teses.usp.br/teses/disponiveis/41/41134/tde-20032006-075813/publico/TeseLamparelli2004.pdf (accessed March 20, 2021).
Larsen, T. A., Hoffmann, S., Lüthi, C., Truffer, B., and Maurer, M. (2016). Emerging solutions to the water challenges of an urbanizing world. Science 352, 928–933. doi: 10.1126/science.aad8641
Lavín, M. F., Godínez, V. M., and Alvarez, L. G. (1998). Inverse-estuarine features of the Upper Gulf of California. Estuar. Coast. Shelf Sci. 47, 769–795. doi: 10.1006/ecss.1998.0387
Lee, K., Kim, T. W., Byrne, R. H., Millero, F. J., Feely, R. A., and Liu, Y. M. (2010). The universal ratio of boron to chlorinity for the North Paci!c and North Atlantic oceans. Geochim. Cosmochim. Acta 74, 1801–1811.
Maher, D. T., Cowley, K., Santos, I. R., Macklin, P., and Eyre, B. D. (2015). Methane and carbon dioxide dynamics in a subtropical estuary over a diel cycle: insights from automated in situ radioactive and stable isotope measurements. Mar. Chem. 168, 69–79. doi: 10.1016/j.marchem.2014.10.017
Marins, R. V., Lacerda, L. D., Araujo, I. C., Fonseca, L. V., and Silva, F. A. T. (2020). Phosphorus and suspended matter retention in mangroves affected by shrimp farm effluents in NE Brazil. An. Acad. Bras. Ciênc. 92:e20200758. doi: 10.1590/0001-3765202020200758
Marins, R. V., Paula Filho, F. J., Eschrique, S. A., and Lacerda, L. D. (2011). Anthropogenic sources and distribution of phosphorus in sediments from the Jaguaribe River estuary, NE, Brazil. Braz. J. Biol. 71, 673–678.
McCutcheon, M. R., Staryk, C. J., and Hu, X. (2019). Characteristics of the carbonate system in a semiarid estuary that experiences summertime hypoxia. Estuar. Coasts 42, 1509–1523. doi: 10.1007/s12237-019-00588-0
McGillis, W. R., Edson, J. B., Hare, J. E., and Fairall, C. W. (2001). Direct covariance air-sea CO2 fluxes. J. Geophys. Res. Ocean. 106, 16729–16745. doi: 10.1029/2000JC000506
Mehrbach, C., Cuberson, C. H., Hawley, J. E., and Pytkowicz, R. M. (1973). Measurements of the apparent dissociation constants of carbonic acid in seawater at atmospheric pressure. Limnol. Oceanogr. 18, 897–907. doi: 10.4319/lo.1973.18.6.0897
Middelburg, J. J., Soetaert, K., and Hagens, M. (2020). Ocean alkalinity, buffering and biogeochemical processes. Rev. Geophys. 58:e2019RG000681. doi: 10.1029/2019RG000681
Miguens, F. C., Oliveira, M. L. d., Marins, R. V., and Lacerda, L. D. (2010). A new protocol to detect light elements in estuarine sediments by X-ray microanalysis (SEM/EDS). J. Electron Microsc. 59, 437–446. doi: 10.1093/jmicro/dfq013
Miguens, F. C., Oliveira, M. L., Marins, R. V., and Lacerda, L. D. (2011). Analytical microscopy as a tool in sediments study. Rev. Virtual Quim. 3, 60–67. doi: 10.5935/1984-6835.20110011
Miller, C. A., and Kelley, A. L. (2021). Seasonality and biological forcing modify the diel frequency of Nearshore pH extremes in a subarctic Alaskan estuary. Limnol. Oceanogr. 66, 1475–1491. doi: 10.1002/lno.11698
Millero, F. J. (1979). The thermodynamics of the carbonate system in seawater. Geochim. Cosmochim. Acta 43, 1651–1661.
Millero, F. J. (2007). The marine inorganic carbon cycle. Chem. Rev. 107, 308–341. doi: 10.1021/cr0503557
Mounier, S., Marins, R. V., and Lacerda, L. D. (2018). “Determining the influence of urbanization on mangrove zones of Northeastern Brazil: characterization of Ceará State Coastal zone organic matter inputs,” in Threats to Mangrove Forests, 1 Edn, Vol. 25, eds C. Makowski and C. Finkl (Cham: Springer), 1–37.
Mucci, A. (1983). The solubility of calcite and aragonite in seawater at various salinities, temperatures, and one atmosphere total pressure. Am. J. Sci. 283, 780–799.
Mulligan, M., van Soesbergen, A., and Sáenz, L. (2020). GOODD, a global dataset of more than 38,000 georeferenced dams. Nat. Sci. Data 7:31. doi: 10.1038/s41597-020-0362-5
Orr, J. C., Fabry, V. J., Aumont, O., Bopp, L., Doney, S. C., Feely, R. A., et al. (2005). Anthropogenic ocean acidification over the twenty-first century and its impact on calcifying organisms. Nature 437, 681–686. doi: 10.1038/nature04095
Ovalle, A. R. C., Rezende, C. E., Lacerda, L. D., and Silva, C. A. R. (1990). Factors affecting the hydrochemistry of a mangrove tidal creek, Sepetiba bay, Brazil. Estuar. Coast. Shelf Sci. 31, 639–650. doi: 10.1016/0272-7714(90)90017-L
Pierrot, D., Neill, C., Sullivan, K., Castle, R., Wanninkhof, R., Lüger, H., et al. (2009). Recommendations for autonomous underway pCO2 measuring systems and data-reduction routines. Deep Sea Res. Part II Top. Stud. Oceanogr. 56, 512–522. doi: 10.1016/j.dsr2.2008.12.005
Rassmann, J., Eitel, E. M., Lansard, B., Cathalot, C., Brandily, C., Taillefert, M., et al. (2020). Benthic alkalinity and dissolved inorganic carbon fluxes in the Rhône River prodelta generated by decoupled aerobic and anaerobic processes. Biogeosciences 17, 13–33. doi: 10.5194/bg-17-13-2020
Raymond, P. A., and Cole, J. J. (2001). Gas exchange in rivers and estuaries: choosing a gas transfer velocity. Estuaries 24, 312–317. doi: 10.2307/1352954
Reiman, J. H., and Xu, Y. J. (2019). Diel variability of pCO2 and CO2 outgassing from the lower Mississippi River: implications for riverine CO2 outgassing estimation. Water 11:43. doi: 10.3390/w11010043
Robbins, L. L., Hansen, M. E., Kleypas, J. A., and Meylan, S. C. (2011). CO2 Calc: A User-Friendly Seawater Carbon Calculator for Windows, Max OS X, and iOS (iPhone), U.S. Geological Survey Open-File Report, 1280. 1–17. Available online at: http://pubs.usgs.gov/of/2010/1280/ (accessed December 2, 2021).
Saderne, V., Fietzek, P., and Herman, P. M. J. (2013). Extreme variations of pCO2 and pH in a macrophyte meadow of the Baltic sea in summer: evidence of the effect of photosynthesis and local upwelling. PLoS One 8:e62689. doi: 10.1371/journal.pone.0062689
Safriel, U., and Adeel, Z. (2005). “Dryland systems,” in Ecosystems and Human Well-Being: Current State and Trends, eds R. Hassan, R. Scholes, and N. Ash (Washington, DC: Island Press), 623–662.
Salisbury, J., Green, M., Hunt, C., and Campbell, J. (2008). Coastal acidification by rivers: a threat to shellfish? Eos Trans. Am. Geophys. Union 89:513. doi: 10.1029/2008EO500001
Santos, I. R., Burdige, D. J., Jennerjahn, T. C., Bouillon, S., Cabral, A., Serrano, O., et al. (2021). The renaissance of Odum’s outwelling hypothesis in “Blue Carbon” science. Estuar. Coast. Shelf Sci. 255:107361. doi: 10.1016/j.ecss.2021.107361
Schulz, K. G., and Riebesell, U. (2013). Diurnal changes in seawater carbonate chemistry speciation at increasing atmospheric carbon dioxide. Mar. Biol. 160, 1889–1899. doi: 10.1007/s00227-012-1965-y
Silva, A. R. F. (2019). Ciclagem Diuturna do Carbono entre Águas Superficiais Estuarinas e a Baixa Atmosfera em Clima Semiárido – Rio Jaguaribe. Master thesis. Fortaleza: Universidade Federal do Ceará, Instituto de Ciências do Mar, Programa de Pós- Graduação em Ciências Marinhas Tropicais.
Takahashi, T., Olafsson, J., Goddard, J. G., Chipman, D. W., and Sutherland, S. C. (1993). Seasonal variation of CO2 and nutrients in the high-latitude surface oceans: a comparative study. Glob. Biogeochem. Cycles 7, 843–878. doi: 10.1029/93GB02263
Tong, Y., Wang, M., Peñuelas, J., Liu, X., Paerl, H. W., Elser, J. J., et al. (2020). Improvement in municipal wastewater treatment alters lake nitrogen to phosphorus ratios in populated regions. Proc. Natl. Acad. Sci. U.S.A. 117, 11566–11572. doi: 10.1073/pnas.1920759117
UCSD-SIO (2021). The Keeling Curve. San Diego, CE: University of California San Diego - Scripps Institution of Oceanography.
Van Dam, B. R., Crosswell, J. R., Anderson, I. C., and Paerl, H. W. (2018). Watershed-scale drivers of air-water CO2 exchanges in two lagoonal North Carolina (USA) estuaries. J. Geophys. Res. Biogeosci. 123, 1–17. doi: 10.1002/2017JG004243
Wallace, R. B., Baumann, H., Grear, J. S., Aller, R. C., and Gobler, C. J. (2014). Coastal ocean acidification: the other eutrophication problem. Estuar. Coast Shelf Sci. 148, 1–13. doi: 10.1016/j.ecss.2014.05.027
Wanninkhof, R. (2014). Relationship between wind speed and gas exchange over the ocean revisited. Limnol. Oceanogr. Methods 12, 351–362. doi: 10.4319/lom.2014.12.351
Weiss, R. F. (1974). Carbon dioxide in water and seawater: the solubility of a non-ideal gas. Mar. Chem. 2, 203–215. doi: 10.1016/0304-4203(74)90015-2
Weiss, R. F., and Price, B. A. (1980). Nitrous oxide solubility in water and seawater. Mar. Chem. 8, 347–359. doi: 10.1016/0304-4203(80)90024-9
Willeit, M., Ganopolski, A., Calov, R., and Brovkin, V. (2019). Mid-Pleistocene transition in glacial cycles explained by declining CO2 and regolith removal. Sci. Adv. 5:eaav7337. doi: 10.1126/sciadv.aav7337
Yao, H., and Hu, X. (2017). Responses of carbonate system and CO2 flux to extended drought and intense flooding in a semiarid subtropical estuary. Limnol. Oceanogr. 62, S112–S130. doi: 10.1002/lno.10646
Yao, H., McCutcheon, M. R., Staryk, C. J., and Hu, X. (2020). Hydrologic controls on CO2 chemistry and flux in subtropical lagoonal estuaries of the northwestern Gulf of Mexico. Limnol. Oceanogr. 65, 1380–1398.
Keywords: CO2 fluxes, climate change, coastal eutrophication, coastal acidification, pCO2
Citation: Cotovicz LC Jr, Marins RV and da Silva ARF (2022) Eutrophication Amplifies the Diel Variability of Carbonate Chemistry in an Equatorial, Semi-Arid, and Negative Estuary. Front. Mar. Sci. 9:767632. doi: 10.3389/fmars.2022.767632
Received: 31 August 2021; Accepted: 16 February 2022;
Published: 07 April 2022.
Edited by:
Christian Joshua Sanders, Southern Cross University, AustraliaReviewed by:
Martin F. Soto-Jimenez, National Autonomous University of Mexico, MexicoPeggy W. Lehman, California Department of Water Resources, United States
Copyright © 2022 Cotovicz, Marins and da Silva. This is an open-access article distributed under the terms of the Creative Commons Attribution License (CC BY). The use, distribution or reproduction in other forums is permitted, provided the original author(s) and the copyright owner(s) are credited and that the original publication in this journal is cited, in accordance with accepted academic practice. No use, distribution or reproduction is permitted which does not comply with these terms.
*Correspondence: Rozane V. Marins, rmarins@ufc.br