The 2019 Benguela Niño
 Rodrigue Anicet Imbol Koungue1*
  Peter Brandt1,2
  Joke Lübbecke1,2
  Arthur Prigent1
  Meike Sena Martins3
  Regina R. Rodrigues4
- 1GEOMAR Helmholtz Centre for Ocean Research Kiel, Kiel, Germany
- 2Faculty of Mathematics and Natural Sciences, Christian-Albrechts-Universität zu Kiel, Kiel, Germany
- 3Center for Earth System Research and Sustainability, Institute of Oceanography, University of Hamburg, Hamburg, Germany
- 4Department of Oceanography, Federal University of Santa Catarina, Florianópolis, Brazil
High interannual sea surface temperature anomalies of more than 2°C were recorded along the coasts of Angola and Namibia between October 2019 and January 2020. This extreme coastal warm event that has been classified as a Benguela Niño, reached its peak amplitude in November 2019 in the Angola Benguela front region. In contrast to classical Benguela Niños, the 2019 Benguela Niño was generated by a combination of local and remote forcing. In September 2019, a local warming was triggered by positive anomalies of near coastal wind-stress curl leading to downwelling anomalies through Ekman dynamics off Southern Angola and by anomalously weak winds reducing the latent heat loss by the ocean south of 15°S. In addition, downwelling coastal trapped waves were observed along the African coast between mid-October 2019 and early January 2020. Those coastal trapped waves might have partly emanated from the equatorial Atlantic as westerly wind anomalies were observed in the central and eastern equatorial Atlantic between end of September to early December 2019. Additional forcing for the downwelling coastal trapped waves likely resulted from an observed weakening of the prevailing coastal southerly winds along the Angolan coast north of 15°S between October 2019 and mid-February 2020. During the peak of the event, latent heat flux damped the sea surface temperature anomalies mostly in the Angola Benguela front region. In the eastern equatorial Atlantic, relaxation of cross-equatorial southerly winds might have contributed to the equatorial warming in November 2019 during the peak of the 2019 Benguela Niño. Moreover, for the first time, moored velocities off Angola (11°S) revealed a coherent poleward flow in the upper 100 m in October and November 2019 suggesting a contribution of meridional heat advection to the near-surface warming during the early stages of the Benguela Niño. During the Benguela Niño, a reduction of net primary production in the Southern Angola and Angola Benguela front regions was observed.
Introduction
The southeastern tropical Atlantic Ocean hosts the Angola Benguela upwelling system which is one of the most productive marine ecosystems in the world (Chavez and Messié, 2009; Jarre et al., 2015) fuelled by the upwelling of nutrient-rich waters. This upwelling system is marked by the presence of a sharp meridional temperature gradient called the Angola Benguela front (ABF) located in the region between 15°S and 18°S (Mohrholz et al., 2001; Veitch et al., 2006) which separates the warm tropical waters in the north to the cold upwelled waters in the south (Figure 1A). The region exhibits high sea surface temperature (SST) variability at a wide range of frequencies varying from sub-monthly to decadal timescales (Bachèlery et al., 2020; Imbol Koungue and Brandt, 2021; Roch et al., 2021). The interannual timescale is marked by the occurrence of extreme warm events, the so-called Benguela Niños (Shannon et al., 1986; Florenchie et al., 2004; Rouault et al., 2007, 2018; Lübbecke et al., 2010; Bachèlery et al., 2016a,2020; Imbol Koungue et al., 2017, 2019) and their cold counterparts, the Benguela Niñas (Florenchie et al., 2004; Koseki and Imbol Koungue, 2020). Those interannual warm and cold events usually peak in boreal spring between March and April (Rouault et al., 2007; Lübbecke et al., 2010; Imbol Koungue et al., 2019) when the SSTs are climatologically high and the intertropical convergence zone (ITCZ) reaches its southernmost position. During a Benguela Niño (Niña) event, the SSTs can be up to 3°C higher (lower) than the climatology in the Angola Benguela area (ABA, 8°E – coast; 10–20°S). Those extreme events may impact the marine ecosystem, biological productivity and fisheries in the Angola Benguela upwelling system by modulating the upward supply of nutrients (Bachèlery et al., 2016b) as they affect the upwelling intensity and upper-ocean mixing (Gammelsrød et al., 1998; Boyer et al., 2001; Blamey et al., 2015). Benguela Niños are often associated with floods in Angola and Namibia and strongly enhanced rainfall in the arid Namib desert (Rouault et al., 2003; Hansingo and Reason, 2009), whereas Benguela Niñas often lead to droughts over the Angola Benguela region (Koseki and Imbol Koungue, 2020).
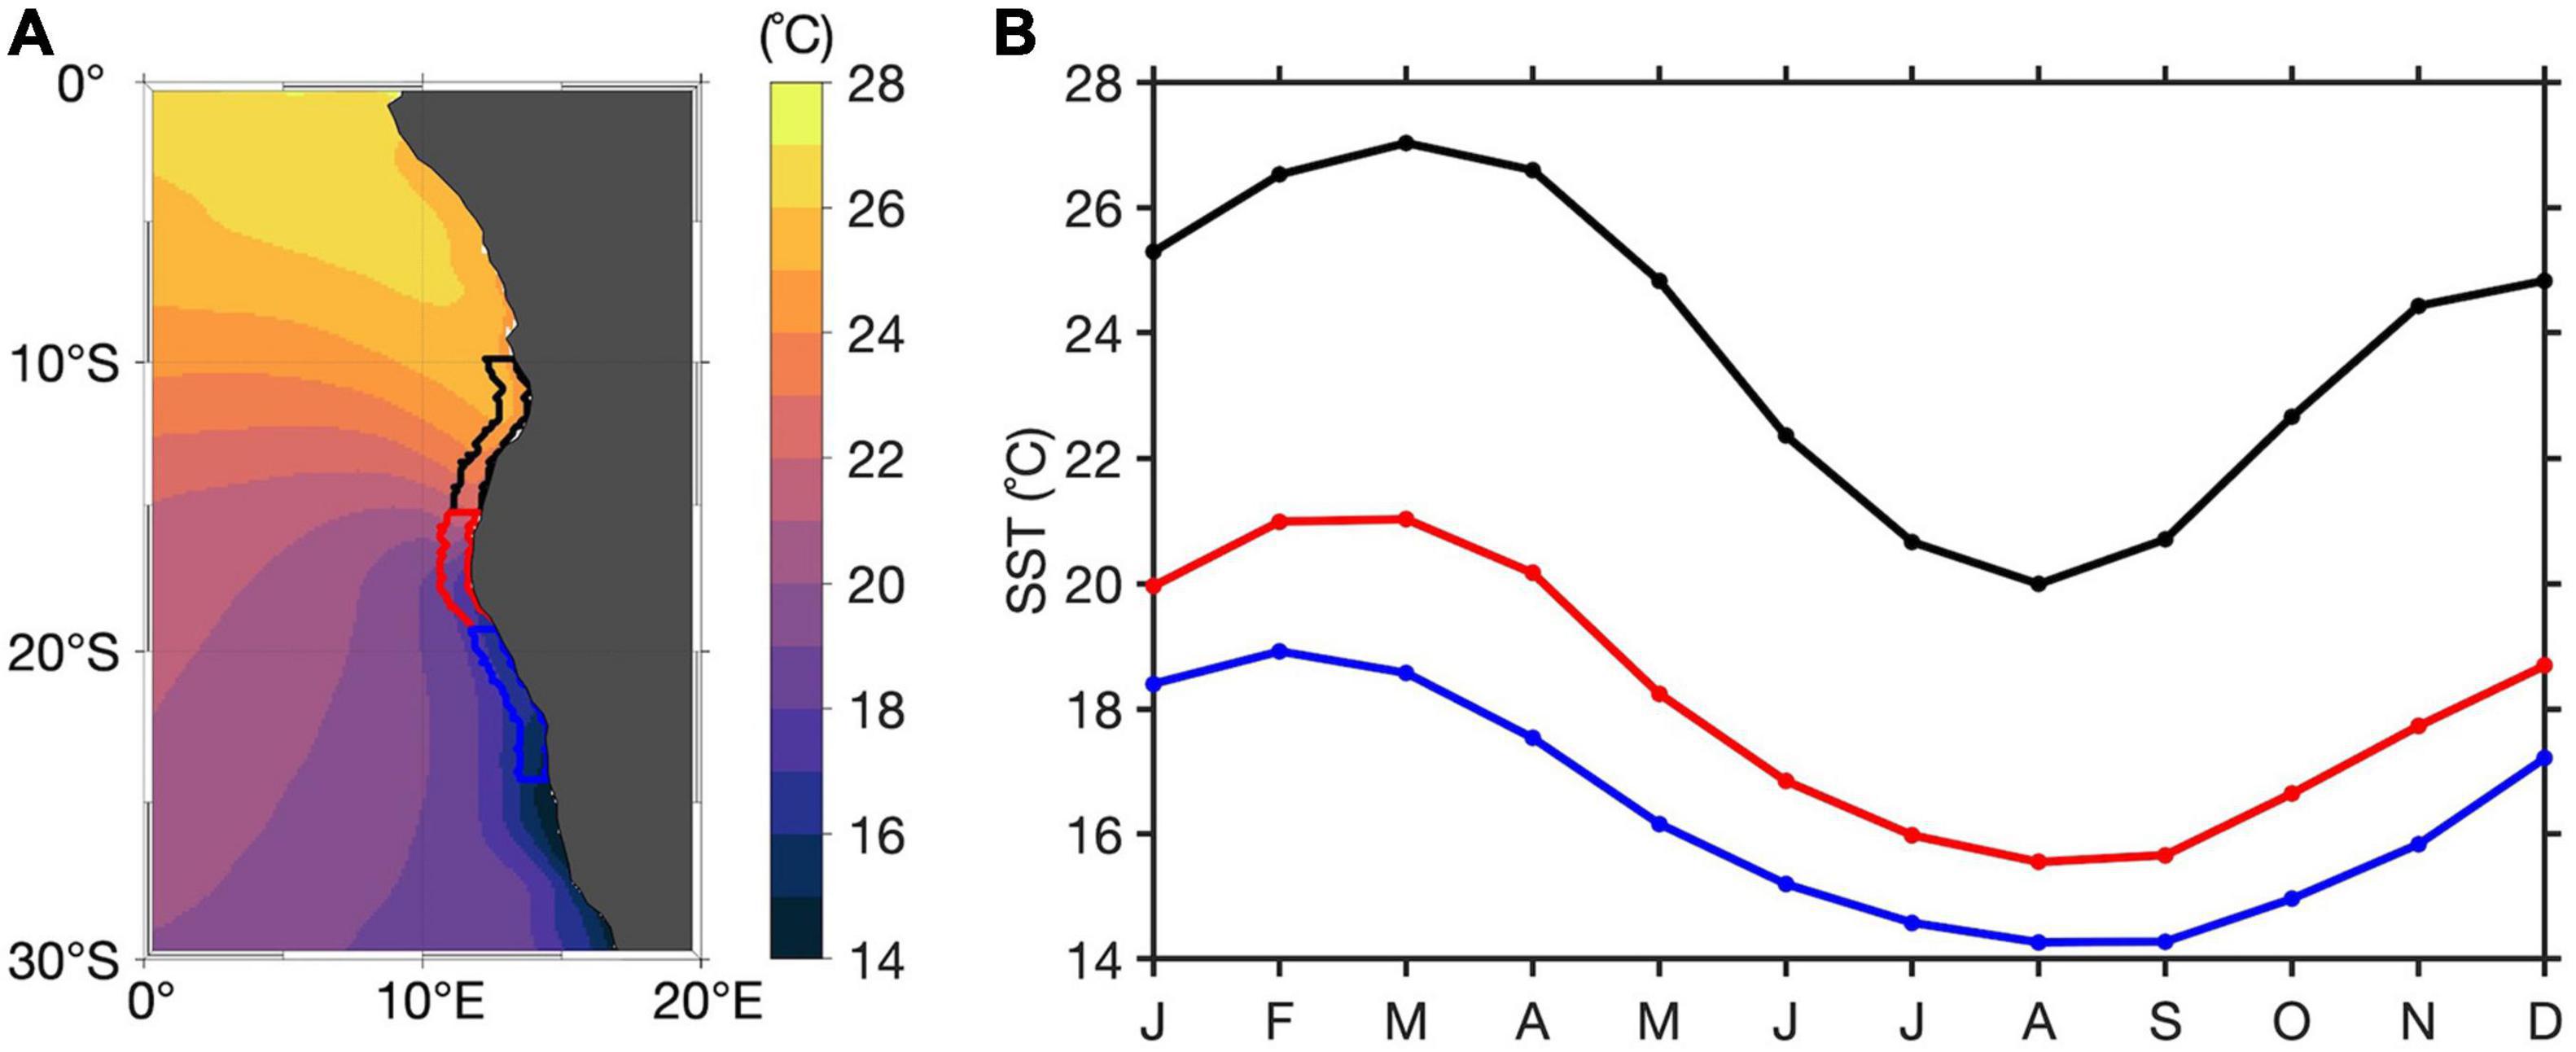
Figure 1. (A) Annual climatology of SST with geographical delimitations of the coastal zones of interest overlaid: Southern Angola (10–15°S, 1°-width coastal fringe) in black, Angola Benguela front (15–19°S, 1°-width coastal fringe) in red and Northern Namibia (19–24°S, 1°-width coastal fringe) in blue. (B) SST climatology in the three coastal zones of interest shown in panel (A). The climatology is calculated relative to the period January 1982 and April 2020.
Benguela Niño events are often marked by poleward intrusion of warm equatorial waters in the Angola Benguela upwelling system transported by the Angola Current (Rouault, 2012; Tchipalanga et al., 2018). Previous studies also stated that the seasonality of the Angola current is partly driven by semiannual coastal trapped waves (CTWs, Kopte et al., 2017; Tchipalanga et al., 2018). Off Angola, semiannual CTWs lead to two upwelling seasons in July–August and December–January, and two downwelling seasons in February – March and October (Ostrowski et al., 2009; Tchipalanga et al., 2018; Zeng et al., 2021).
It was recently reported that the interannual SST variability along the equatorial and in the southeastern tropical Atlantic has substantially reduced by more than 30% in May–July and March–May, respectively, in the post-2000 period compared to 1982–1999 (Prigent et al., 2020a,b; Silva et al., 2021). Those recent changes in the interannual SST variability suggest that Benguela Niños might be affected by decadal variability and/or climate warming and likely will further change in the future. This decadal modulation might also apply to the relative importance of different forcings. Previous studies have shown that Benguela Niños and Niñas can be triggered both by local and remote equatorial forcing. On the one hand, fluctuations in the local alongshore wind (Polo et al., 2008) associated with the strength and position of the South Atlantic Anticyclone (Richter et al., 2010) modulate the coastal upwelling intensity and generate positive SST anomalies in the southeastern tropical Atlantic. Moreover, Florenchie et al. (2004) suggested that local sea-air heat flux exchanges do not play a role in preconditioning the sea surface in the Angola Benguela upwelling system prior to the arrival of an event. However, the analyses of the 2016 warm event off Angola and Namibia by Lübbecke et al. (2019) revealed that the warming resulted from a combination of different local processes such as the weakening of the alongshore wind, which lead to a reduction in the latent heat loss from the ocean, as well as enhanced freshwater input through abundant precipitation and river runoffs reducing surface cooling by attenuated vertical exchange processes. Imbol Koungue et al. (2019) highlighted the influence of CTWs forced by meridional wind stress anomalies north of the Angolan region on the SST anomalies in the regions downstream. The authors found a 95% statistically significant correlation (<−0.4) at 1-month lag when the meridional wind stress anomalies north of Angola lead the SST anomalies in the Southern Angola and Angola Benguela front regions. On the other hand, Benguela Niños have been shown to be caused by remote equatorial forcing by the eastward propagation of equatorial Kelvin waves (EKWs) along the equatorial waveguide triggered by zonal wind fluctuations in the western or central equatorial Atlantic (Florenchie et al., 2003, 2004; Illig et al., 2004; Lübbecke et al., 2010; Rouault et al., 2018). Those EKWs impinging at the eastern boundary generate subsequent CTWs that propagate poleward along the Southwest African coast and impact the coastal interannual variability in the Angola Benguela upwelling system (Ostrowski et al., 2009; Rouault, 2012; Bachèlery et al., 2016a; Imbol Koungue et al., 2017; Illig et al., 2018; Illig and Bachèlery, 2019; Imbol Koungue et al., 2019; Bachèlery et al., 2020; Imbol Koungue and Brandt, 2021). A recent study by Imbol Koungue and Brandt (2021) using observations and altimetry, evidenced a thermocline feedback with the SST response lagging a thermocline displacement induced by the passage of a CTW by about 14 days. These intraseasonal CTWs are found to modulate also the intensity of the peak Benguela Niños and Niñas depending on their timing.
In the tropical Atlantic, Chenillat et al. (2021) investigated the impacts of climate modes on the interannual variability of the chlorophyll-a using satellite and reanalysis data. The authors found that during the Atlantic zonal mode (June–August), CTWs trigger by EKWs forced by zonal wind stress anomalies in the western equatorial Atlantic explain the sea surface height and chlorophyll-a variations off Southern Angola. The variability of the eastern equatorial SST in the Atlantic and Pacific Oceans has been shown to be linked to the variations of the local meridional wind at seasonal and interannual timescales (Philander and Pacanowski, 1981; Xie, 1998). Philander and Pacanowski (1981) showed that the onset of southerly winds induced low SSTs in the southeastern part of the basin as the coastal upwelling is extended to the west due to advection and Rossby wave propagations. With the onset of the southerly winds, the thermocline is anomalously deep (shallow) north (south) of the equator near 4°N (3°S). Indeed, using a forced ocean model, Philander and Pacanowski (1981) showed that the relaxation of the cross-equatorial southerly winds induced a weakening of the South Equatorial Current and Countercurrent which then resulted in a warming of the southeastern Atlantic. The same mechanism has been shown to be active in the Pacific during the growing phase of some El Niño events (e.g., Peng et al., 2020). A modeling study of Périgaud et al. (1997) investigated the role of meridional wind anomalies on El Niño using a coupled simulation. The authors demonstrated that during a warm (cold) event in the equatorial east Pacific, meridional wind stress anomalies drove convergent (divergent) surface currents inducing downwelling (upwelling) anomalies acting to enhance the SST and wind anomalies.
The aim of this manuscript is to describe the origin and evolution of the 2019 Benguela Niño off Angola and Namibia. This extreme warm event is atypical compared to the well-known Benguela Niño events (e.g., 1995, 2001, and 2010/2011) because of: (1) the timing of the event, and (2) the timing of the forcing mechanisms. More details are given in the section “Result.” The manuscript is structured as follows: section “Data and Methods” describes the different data sets used to characterize the warming in the southeastern Atlantic as well as the methodology. Section “Results” describes the warming off Angola and Namibia and analyses the role played by the different forcing and the impact on the local net primary production. Lastly, section “Discussion and Summary” will be dedicated to the discussion of the results and the conclusion.
Data and Methods
This section aims at describing the different data sets and methods used in this study.
Data
Off Angola (13°00′E; 10°50′S) at around 77 km away from the coast, a current meter mooring is measuring current velocities since July 2013 (Kopte et al., 2017; Imbol Koungue and Brandt, 2021). On the mooring cable, at 500-m depth, an upward-looking 75-kHz Long Ranger Acoustic Doppler current profiler (LR ADCP) is mounted to measure the velocity of the Angola Current up to 45 m below the sea surface with a 16-m bin size as vertical resolution. Current velocities from the moored ADCP are rotated by -34° against North to derive alongshore and cross-shore velocities (positive onshore) according to the local coastal orientation. The data are freely available at https://doi.pangaea.de/10.1594/PANGAEA.939249.
In this study, we use the gridded products of sea level anomaly (SLA) and near-surface absolute geostrophic current velocities from the delayed-time multi-mission (all satellites merged) and the near-real time that are distributed by the European Union Copernicus Marine Service Information1 with a daily temporal resolution and available at 0.25° horizontal resolution from January 1993 to May 2020 and since April 2019, respectively. More details on the mapping algorithm procedures are provided by Pujol et al. (2016). Absolute surface geostrophic current velocities are extracted from the data point (13°07.5′E; 10°52.5′S) closest to the mooring position as in Kopte et al. (2018) and Imbol Koungue and Brandt (2021) to complement the moored velocity time series.
The daily Optimum Interpolation SST version 2 (OI-SST v2; Reynolds et al., 2007) available at 0.25° horizontal resolution from September 1981 onward is used. Data can be downloaded from the NOAA website2. The data is derived from daily merged in situ and remote sensed data.
We further use daily in situ temperature fields and 20°C isotherm depth from the enhanced Prediction and Research Moored Array in the Tropical Atlantic (ePIRATA, Foltz et al. (2018)3, that are available from September 1997 to August 2020. These data are derived from buoy measurements of the PIRATA program (Servain et al., 1998; Bourlès et al., 2008; Johns et al., 2014; Bourles et al., 2019) which have successfully passed the quality control and do not need bias correction. The subsurface temperature fields are interpolated onto a uniform 5-m vertical grid. More details about the gap-filling procedures, error estimates and corrections of instrument biases can be found in Foltz et al. (2018).
The sea surface salinity (SSS) data originates from a combination of three satellite missions: Aquarius, soil moisture active passive (SMAP) and soil moisture and ocean salinity (SMOS). SMOS has a spatial resolution of around 0.5° and measures SSS since 2010. Aquarius satellite collected SSS measurements between 2011 and 2015 and has a coarser spatial resolution (1.35°) than SMOS. Finally, SMAP mission started in April 2015 and is running until now with a spatial resolution of around 0.36°. This initiative is part of the European space agency (ESA), which has funded the climate change initiative (CCI) SSS program (CCI+SSS). The CCI+SSS program delivers improved calibrated global SSS field data (version 3.21) which spans the period 2010 to 2020 (Boutin et al., 2021). The data set is freely available via https://catalogue.ceda.ac.uk/uuid/5920a2c77e3c45339477acd31ce62c3c.
Potential links to the local marine ecosystem were analyzed by presenting the anomalies of the net primary production (NPP) during the extreme warm event. Monthly means of NPP for the time period July 2002 to July 2020 are freely available online4. The data has a horizontal resolution of 1/6° but is interpolated on a 0.25°× 0.25° spatial grid to match with the SST anomalies. The NPP data is based on the Eppley vertically generalized production model which uses MODIS chlorophyll, SST data, SeaWiFs photosynthetically available radiation and estimates of the euphotic zone depth.
Atmospheric variables such as surface winds, air-sea heat fluxes, surface pressure, specific humidity of the air, and sea level pressure are investigated in this manuscript using the European Centre for Medium-Range Weather Forecasts (ECMWF) re-analysis 5 (ERA5; Hersbach et al., 2020). The ERA5 data is available at 0.25° horizontal resolution and the period used for the study extends from January 1982 to April 2020. Data are freely distributed via https://cds.climate.copernicus.eu/.
Methods
Throughout the manuscript, prior to all analyses, the linear trend estimated over the data set period (see Figures 1–13) has been removed and anomalies are calculated with respect to the corresponding seasonal cycle. To identify the anomalous warm or cold events along the Southwest African coast, the SST anomalies are analyzed in three 1°-width coastal fringe regions of interest (see Figure 1A): the Southern Angola region (in black, 10–15°S), the Angola Benguela front region (in red, 15–19°S) and the Northern Namibia region (in blue, 19–24°S). Based on these three coastal regions, the following criterion (also used in Imbol Koungue et al., 2017, 2019) is used to identify the different coastal extreme warm and cold events: an event is classified as an extreme warm or cold event when the detrended normalized SST anomalies exceed ± 1 standard deviation for at least three consecutive months and for at least two of the three coastal regions of interest.
The potential contribution to the latent heat flux from the wind speed and specific humidity difference between the sea surface and air at 10 m has been investigated. Following the bulk formula, the latent heat flux is given by:
where, Qlat is the turbulent latent heat flux; ρa is the air density; Ce is the transfer coefficient for water vapor; lv is the latent heat of evaporation; U10 is the surface wind speed at 10 m; qw is the surface specific humidity, usually the saturated specific humidity at the temperature of the sea surface and qa is the specific humidity of air at 10 m. The specific humidity at the sea surface has been estimated as in Imbol Nkwinkwa et al. (2019) using the formula:
where, Rdry = 287.0597 J kg–1 K–1 and Rvap = 461.5250 J kg–1 K–1 are the gas constants for dry air and water vapor, respectively, P is the surface pressure (in Pa), T0 = 273.16 K and T is the sea surface temperature (in K) from ERA5 reanalysis, es (T) is the saturation vapor pressure (in Pa). The parameters a1, a3, and a4 are set to 611.21 Pa, 17.502 and 32.19 K, respectively (Imbol Nkwinkwa et al., 2019).
Results
The understanding of the SST climatology in the three coastal regions of interest (Figure 1B) is crucial for the interpretation of the SST anomalies. The evolution of the SST climatology is quite similar in the three coastal regions, but from the northern to the southern regions the SST climatology is shifted to lower mean SSTs. The warm season is observed in boreal spring with a maximum SST in March (February) for the Southern Angola and Angola Benguela front (Northern Namibia) regions. The cold season is observed from July to September with a minimum SST in August in the three coastal regions of interest. The normalized detrended anomalies of SST averaged over the three coastal regions are shown in Figure 2 from January 1982 to April 2020. Based on the criterion defined in section “Methods,” 14 extreme events have been identified and categorized into 6 extreme cold events, namely in 1982 (April–July), 1986–1987 (October–April), 1989–1990 (October–February), 1991-1992 (October–May), 1992 (July–September), 1996–1997 (November–June) and eight extreme warm events, namely in 1984 (February–April), 1984 (June–October), 1991 (May–July), 1995 (February–September), 1997–1998 (October–January), 2001 (March–May), 2010–2011 (December–March), and 2019 (October–January). All those extreme events have already been described in the literature (Florenchie et al., 2004; Reason et al., 2006; Rouault et al., 2007; Ostrowski et al., 2009; Rouault et al., 2009; Lübbecke et al., 2010; Rouault, 2012; Lutz et al., 2013; Imbol Koungue et al., 2017; Rouault et al., 2018; Imbol Koungue et al., 2019) except for the 2019 Benguela Niño which is the focus of this study. A complete list of manuscripts describing the previous extreme coastal events is provided in Imbol Koungue et al. (2019) in their Supplementary Table 1. It is noteworthy that since 2000, there are no extreme cold events observed along the Southwest African coast, and only three extreme warm events occurring at an interval of ∼ 9 to 10 years, consistent with the results by Prigent et al. (2020b). The time series of normalized detrended anomalies of SST do portray short episodes of cold SST anomalies (for example in 2001/2002, 2005, and 2018), but they do not meet the requirements to be considered as extreme events.
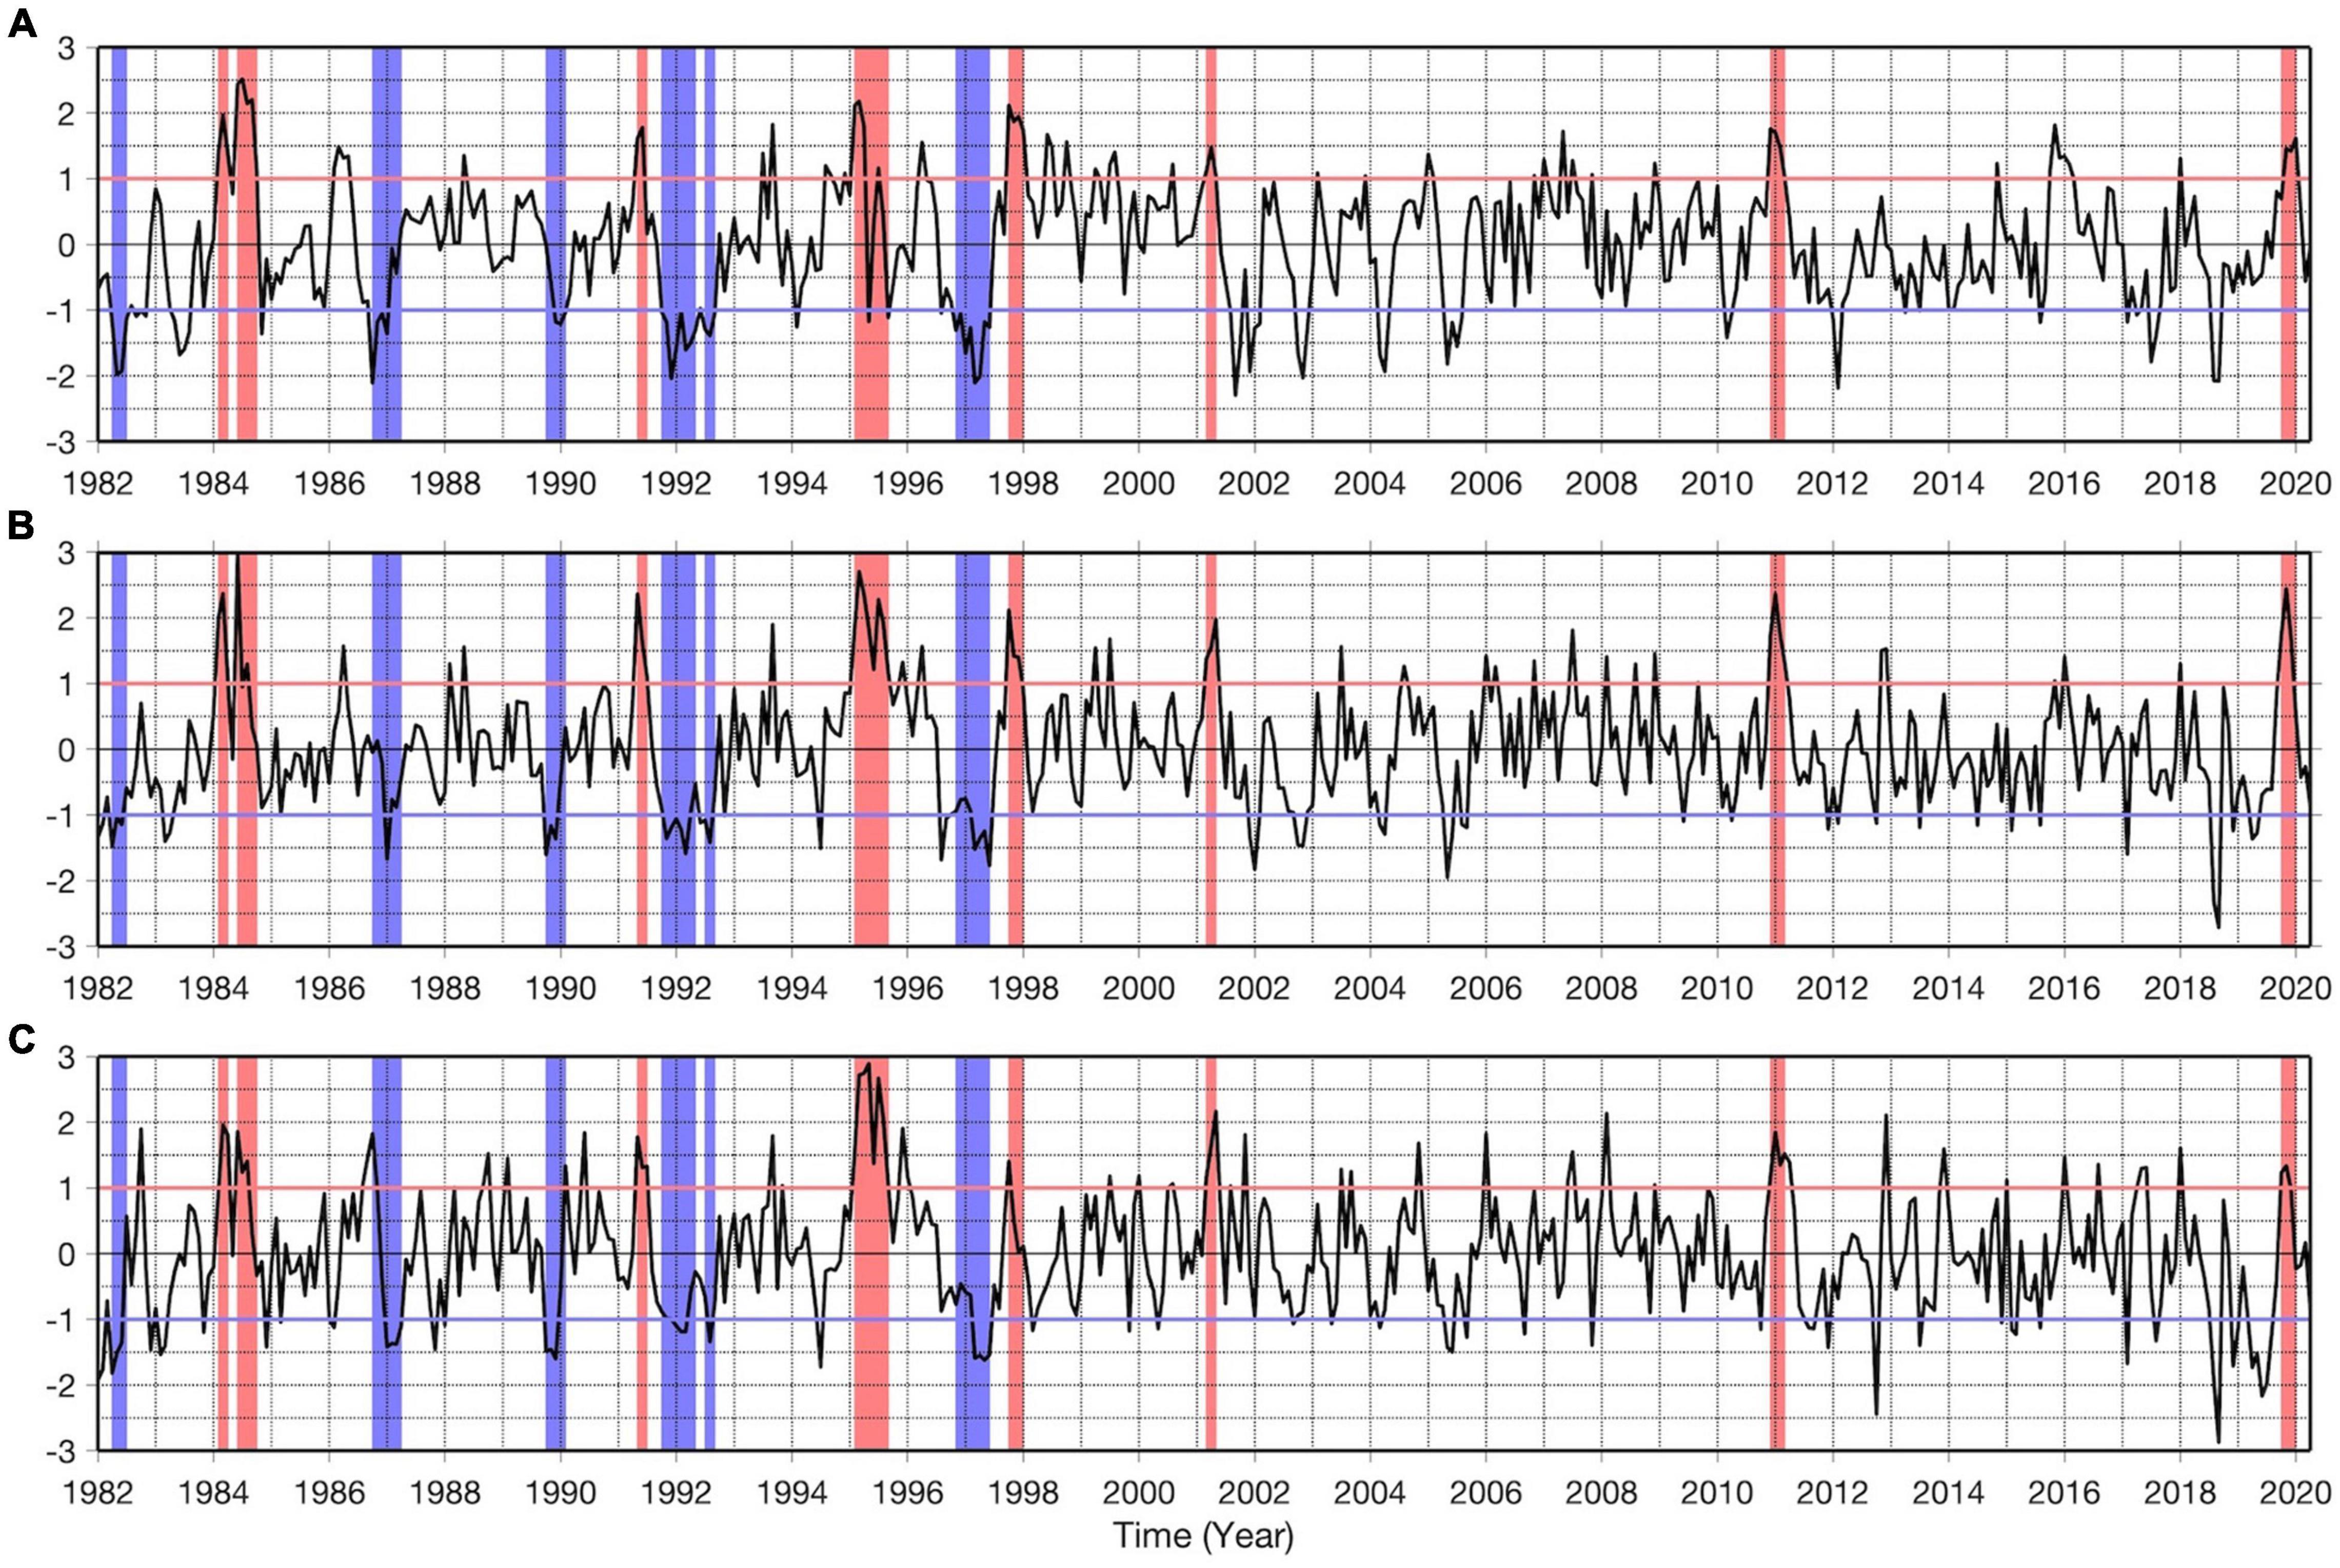
Figure 2. Normalized detrended OI-SST monthly anomalies averaged in the regions of Southern Angola (A), Angola Benguela front (B), and Northern Namibia (C) between January 1982 and April 2020. The red and blue rectangles highlight Benguela Niños and Niñas, respectively. The horizontal red and blue lines indicate the ±1 standard deviation.
Sea Surface Temperature Anomalies During 2019
This subsection aims at describing the origin and the evolution of the SST anomalies during the 2019 Benguela Niño. Figure 3A zooms in on the time series from Figure 2 between January 2019 and April 2020 including the period considered to display maps of monthly SST anomalies (green rectangle). In August 2019, negative SST anomalies prevail in the southeastern tropical Atlantic with a weak warming at around 15°S (Figure 3B). One month later (September 2019), a warming is observed along the coast north of 20°S and extends offshore with SST anomalies greater than 1°C (Figure 3C), while it remains relatively cool south of 20°S along the coast. This is consistent with the time series (Figure 3A) which also show positive (negative) normalized detrended SST anomalies of ∼ 1 (−0.5) standard deviation in the Southern Angola and Angola Benguela front (Northern Namibia) regions. The warming persists off Southern Angola and Angola Benguela front regions, but also spreads south of 20°S in October 2019 in the Northern Namibia regions (Figure 3D). The peak of the 2019 Benguela Niño is observed in November 2019 (Figure 3A) with high SST anomalies recorded in all three coastal regions of interest but exceeding 2°C in the Angola Benguela front region (Figure 3E). During the peak of the event, the whole southeastern Atlantic is anomalously warm. North of 20°S, offshore maximum SST anomalies are also observed mainly in the Southern Angola region. One month after the peak of the event (December 2019), the southeastern tropical Atlantic stays warm (Figure 3F). The demise of the extreme warm event starts in January (February) 2020 in the Angola Benguela front and Northern Namibia (Southern Angola) regions with the appearance of cold surface waters as shown in Figures 3G,H. In the Southern Angola region, the SST anomalies peak in January 2020 (>2°C) with SST anomalies confined along the coast (Figure 3G). The area of cold SST anomalies expands northward along the southern Angola coast in March 2020 (Figure 3I).
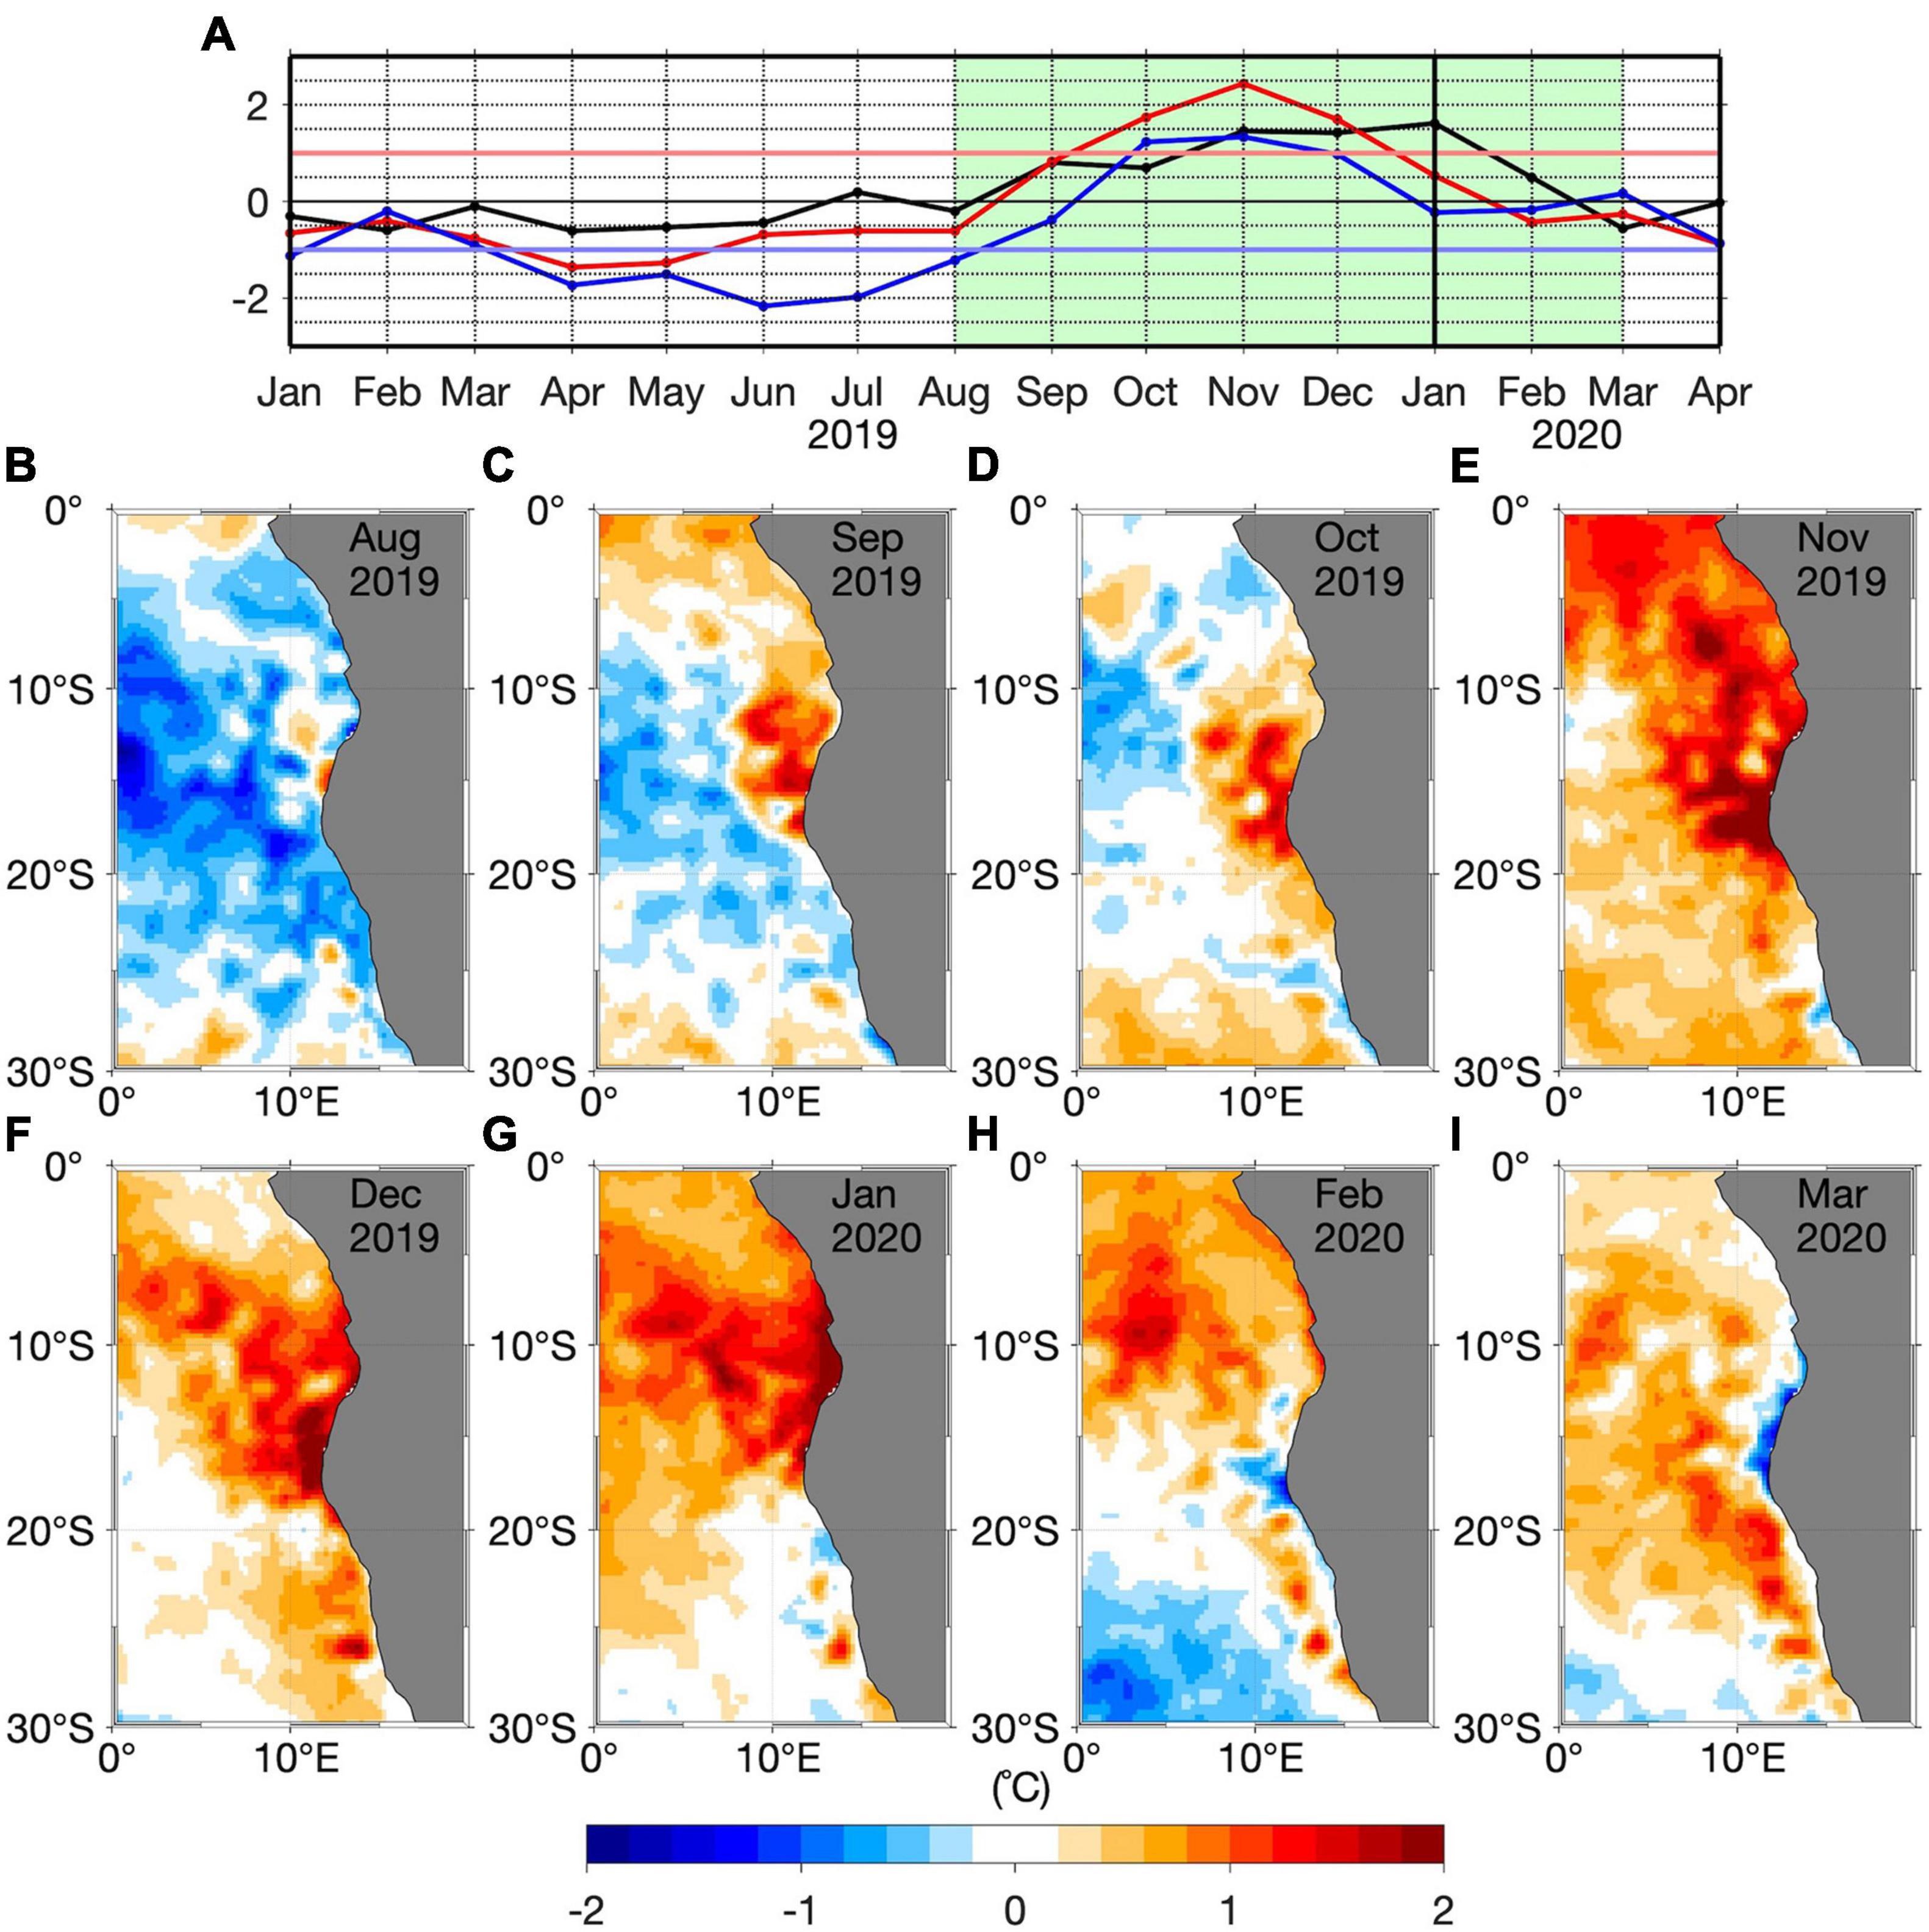
Figure 3. (A) Time series of the normalized detrended OI-SST monthly anomalies from January 2019 to April 2020 shown in Figure 2 for the regions of Southern Angola (black), Angola Benguela front (red) and Northern Namibia (blue). (B–I) Monthly detrended SST anomalies averaged from August 2019 to March 2020 (light green rectangle in panel A).
Role of Local Winds and Surface Heat Fluxes
Previous studies evidenced the impact of the local wind fluctuations on the SST variability in the southeastern Atlantic Ocean (Polo et al., 2008; Richter et al., 2010; Lübbecke et al., 2019). In September 2019, north-easterly wind anomalies are present south of 15°S along the West African coast, associated with a local negative SLP anomaly (Figure 4A). As the upwelling in northern Namibia is wind-driven (Jarre et al., 2015), the reduction of the prevailing southerly winds by the northerly wind anomalies south of 15°S is associated with reduced coastal upwelling, possibly resulting in the onset of the local warming observed in September 2019 (Figure 3C). In addition, the weakening of the local winds (Supplementary Figure 1A) is consistent with a reduction of the latent heat loss from the ocean to the atmosphere with anomalies greater than 20 W/m2 (Figure 5A) even though the specific humidity difference (qa – qw, Supplementary Figure 1D) might also contribute. Positive anomalies of qa – qw observed in Supplementary Figure 1D suggest that the air temperature at 10 m is higher than the SST. However, Supplementary Figure 1A reveals that the wind speed anomalies (<2 m/s) are the major contributor to the anomalous latent heat flux compared to qa – qw which shows quite weak anomalies (<1 g/kg) south of 15°S (Supplementary Figure 1D). It is thus unlikely that an enhanced air temperature played an important role in the reduction of the latent heat loss from the ocean to the atmosphere during the 2019 Benguela Niño, as was observed for other warm events such as the Ningaloo Niño in the southeast Indian Ocean (Zhang et al., 2018; Guo et al., 2020). We conclude that the reduction in coastal upwelling caused by weakened local winds and the reduction of the latent heat loss from the ocean to the atmosphere resulted in the warming south of 15°S in September 2019. The onset of the warming north of 15°S will be discussed below. However, the observed offshore cold SST anomalies in September 2019 (Figure 3C) seems to be damped by the reduction of the latent heat loss from the ocean to atmosphere (Figure 5A) resulting in reduced cold SST anomalies in October 2019 (Figure 3D). The amplitude of the latent heat flux anomaly has considerably reduced from September to October 2019 (<15 W/m2, Figure 5B), but remained positive south of 15°S. Also, a damping of the warm SST anomalies north of 25°S (Figure 3E) during the peak of the warm event in November 2019 is suggested by the presence of a strong latent heat loss from the ocean to the atmosphere (Figure 5C) along the Southwest African coast. The strong latent heat loss is explained in this case by the negative anomalies of qa – qw (<−2 g/kg) in the Angola Benguela front region (Supplementary Figure 1F) as the wind speed anomalies are quite weak (Supplementary Figure 1C). Negative anomalies of qa – qw highlight that in November 2019 the sea surface was warmer than the air above, due to strong sea surface temperature anomalies. Noteworthy, the similarity between the latent heat flux anomalies and the net surface heat flux anomalies, suggests the dominant role of the latent heat flux. Figure 5D shows that the ocean gains heat in September 2019 south of 15°S (>30 W/m2). Positive anomalies of net surface heat flux in October 2019 (Figure 5E) and still reduced upwelling-favoring winds (Figure 4B) could have maintained the local warm SST between September–October 2019 in the Angola Benguela front region. Consistent with Figure 5C, in November 2019, the net surface heat flux anomaly patterns show a damping of the warm SST anomalies (Figure 5F) with net surface heat flux anomalies of less than −30 W m–2.
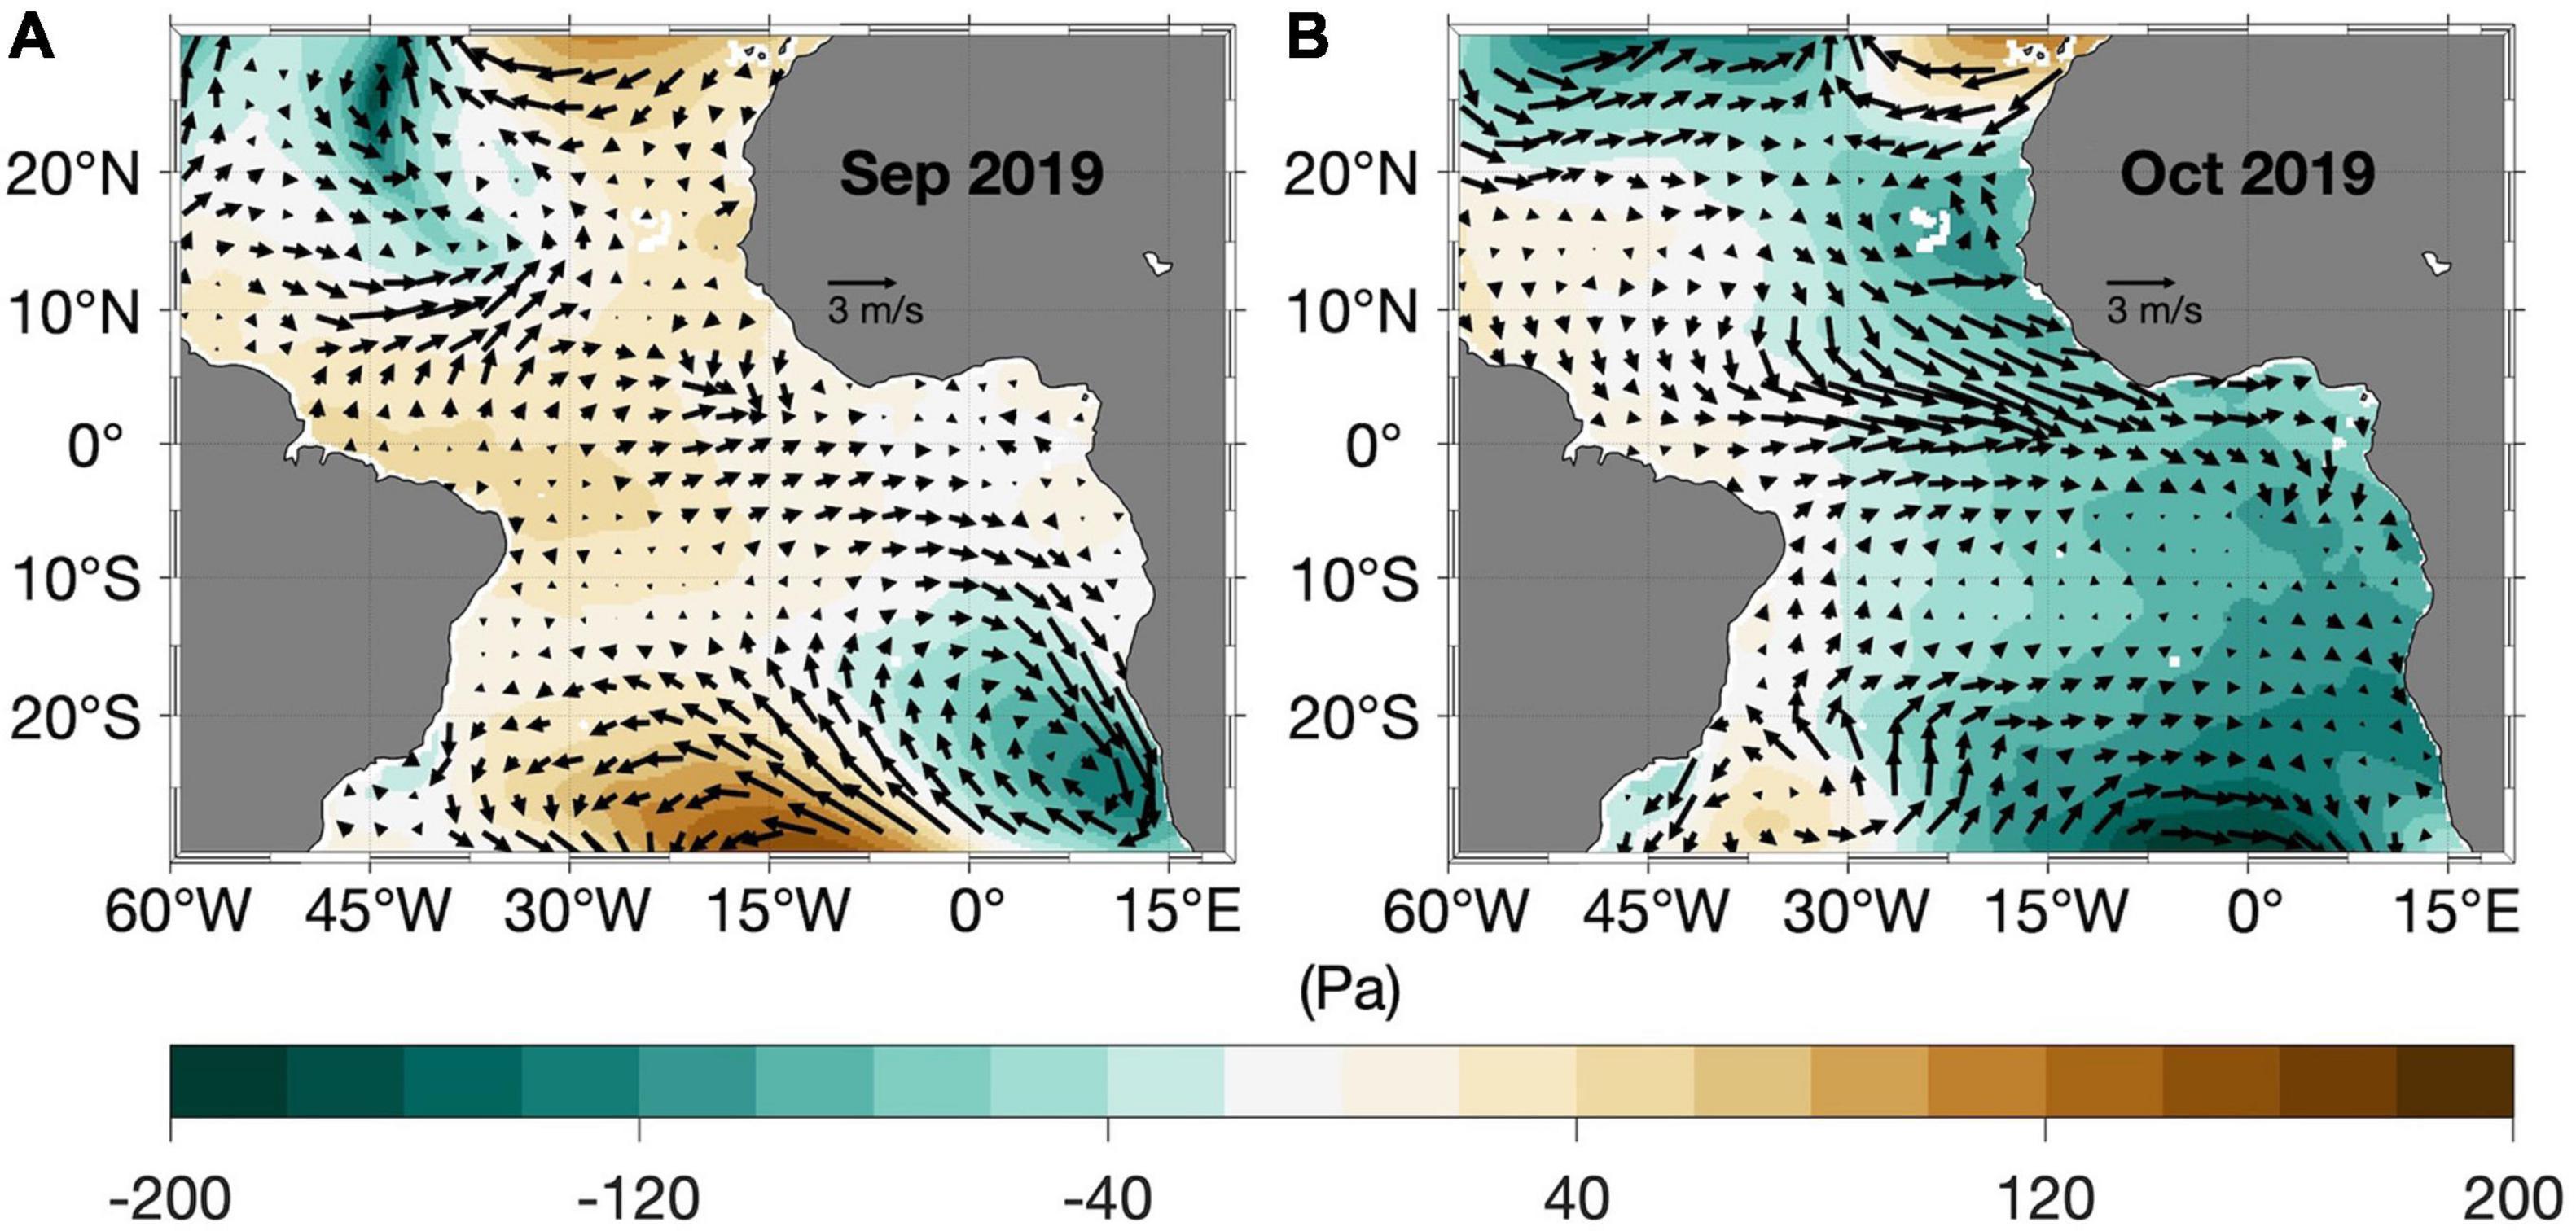
Figure 4. (A,B) Detrended anomalies of ERA5 monthly sea level pressure (SLP, shading) and surface winds (arrows) from September to October 2019. The anomalies are calculated relative to the period January 1982 and April 2020.
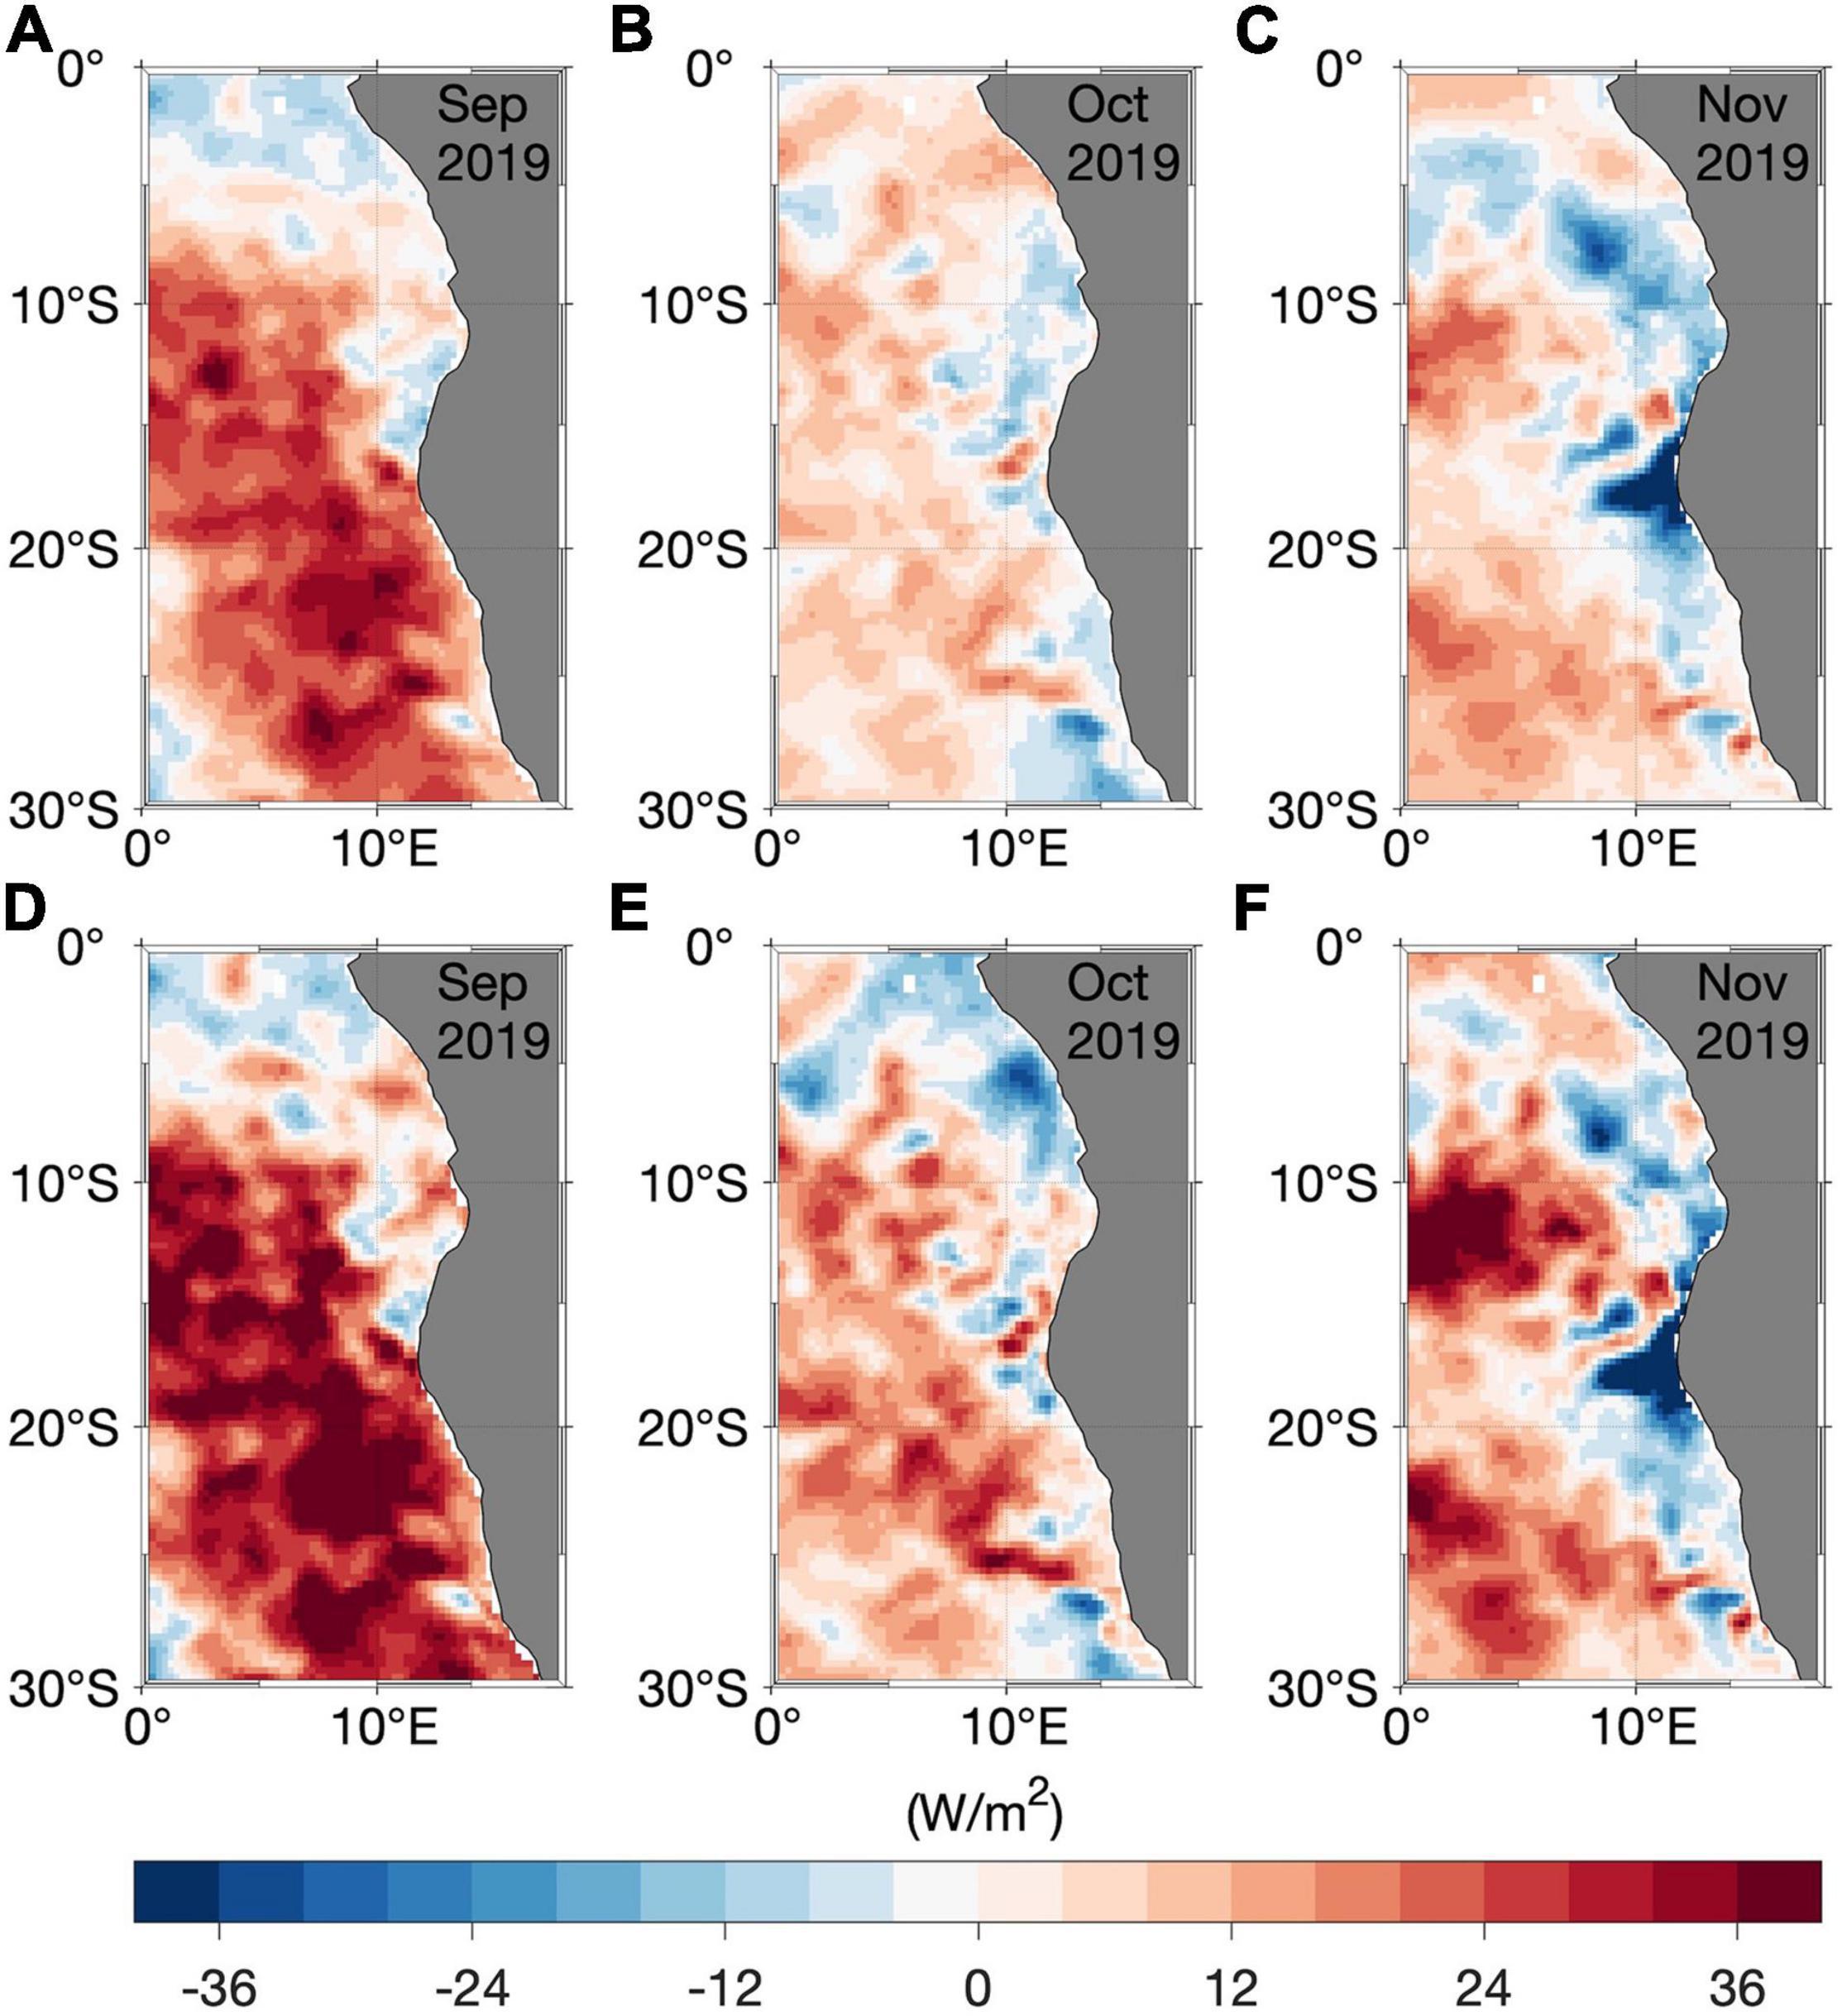
Figure 5. (A–C) Monthly detrended anomalies of ERA5 surface latent heat flux (positive values mean reduced latent heat loss from the ocean to atmosphere) from September to November 2019. (D–F) same as (A–C) but for the net surface heat flux anomalies. The anomalies are calculated relative to the period January 1982 and April 2020.
Upwelling is not only driven by the alongshore wind stress but also by the wind stress curl. Anomalies of the wind stress curl are therefore shown in Figures 6A–C from September to November 2019. Figure 6A depicts a positive anomaly of the near-coastal wind stress curl in September 2019 in the Southern Angola and Angola Benguela front regions (∼ 0.17 × 10⁻⁷ N m–3 and ∼ 0.3 × 10⁻⁷ N m–3, respectively) which also extends offshore. A positive local near-coastal wind stress curl anomaly means a weakening of the mean near-coastal cyclonic wind stress curl, corresponding to weakened Ekman suction, i.e., downwelling anomalies. The reduced local upwelling, particularly off Southern Angola favors the appearance of local positive SST anomalies which could explain the warming observed in September 2019 (Figure 3C) in the Southern Angola region as the local wind anomalies are quite weak (Figures 4A, 6A). In contrast, in the Angola Benguela front region, positive SST anomalies in September 2019 are generated by a combination of positive wind stress curl anomalies and southward wind anomalies (Figure 4A) resulting in weakened coastal upwelling (downwelling anomalies) and a reduction of the latent heat loss from the ocean to the atmosphere (Figure 5A). Slight negative wind stress curl anomalies are observed south of the Southern Angola region in October 2019 (Figure 6B). However, in November 2019, there is an offshore extension of the positive anomaly of wind stress curl (Figure 6C), which might be linked to the offshore warming observed in Figure 3E during the peak of the event.
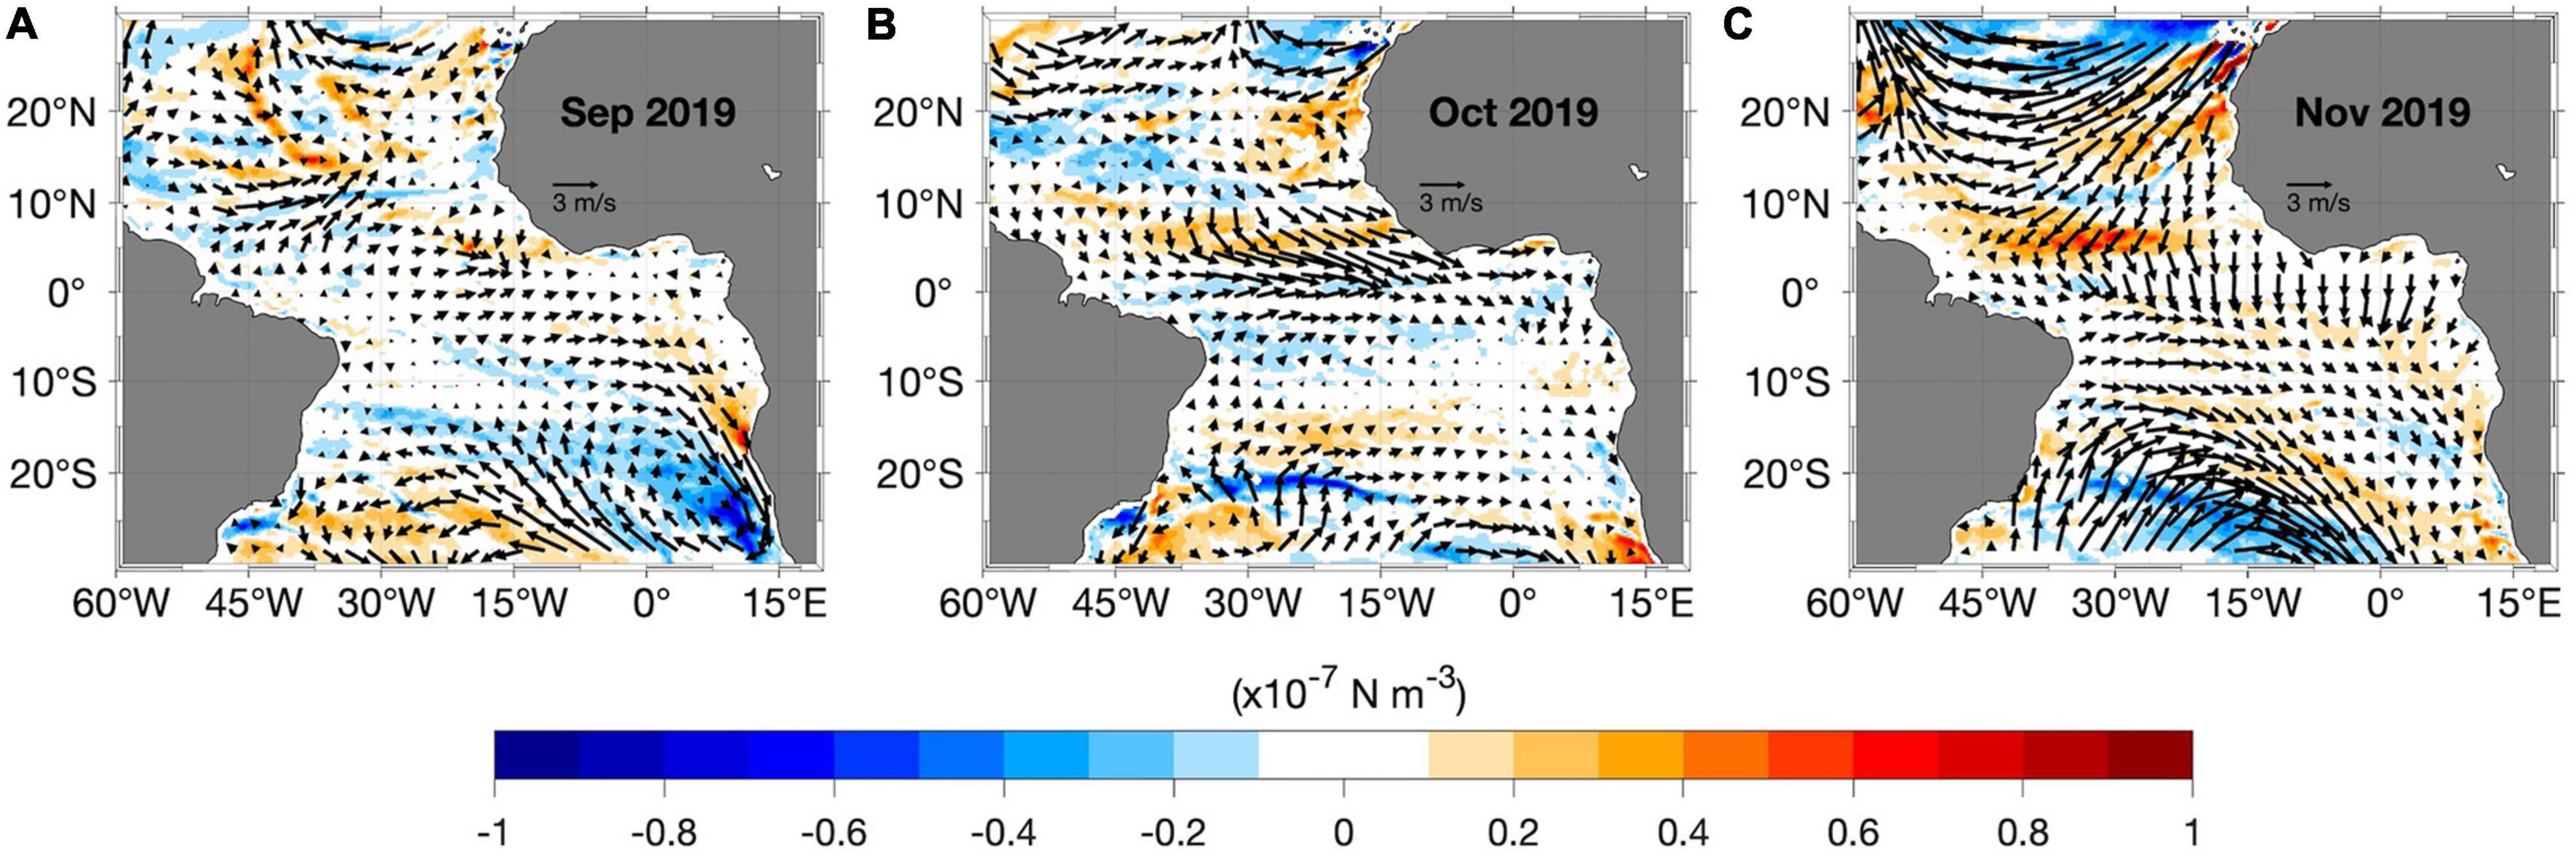
Figure 6. (A–C) Monthly detrended anomalies of wind stress curl (shading) estimated from ERA5 surface winds (arrows) from September to November 2019. The anomalies are calculated relative to the period January 1982 and April 2020.
Role of the Remote Forcing
Equatorial zonal wind stress fluctuations (Figure 4B) can excite EKWs impinging at the eastern boundary which force CTWs that propagate poleward along the West African coast and particularly in the Angola Benguela upwelling system. Figure 7A shows the zonal wind anomalies averaged between 40°W – 20°W and 3°S – 3°N (WAtl, blue box in Figure 7C). In the equatorial band, positive (negative) zonal wind anomalies mean weaker (stronger) easterly winds. The time series (Figures 7A,B) show westerly wind anomalies from January 2019 to April 2019 and again from July 2019 to March 2020 with the strongest anomaly occurring in October 2019 (>1 m/s), associated with the zonal SLP gradient observed in Figure 4B. A Hovmøller diagram of daily zonal wind anomalies in the equatorial Atlantic reveals that strong westerly wind anomalies (>1 m/s) prevail between the end of September and October 2019 (Supplementary Figure 2A). However, maximum westerly wind anomalies (>2 m/s) are located north of the equator around 2–7°N and from 35°W to 13°W (Figure 7C) with westerly wind anomalies still found at the equator. Climatologically, there are easterly winds in this region in October with a value of about −1 m/s (not shown). However, this area is also influenced by tropical depressions or cyclones. Particularly in October 2019, north of the equator, strong westerly wind anomalies are induced on the one hand by the zonal pressure gradient (Figure 4B) with positive/negative SLP anomalies to the west/east in the tropical Atlantic. On the other hand, at daily scale, there are strong cyclonic low-pressure events (not shown) that occurred in the area in the second half of October 2019 which could have contributed to maintain the westerly wind anomalies (>3.5 m/s). Figure 7C also shows a slight equatorward shift of the ITCZ in October 2019 (dashed green) compared to its mean October position (dashed blue line). This means that the convergence between the north-easterly and south-easterly trade winds occurred further south.
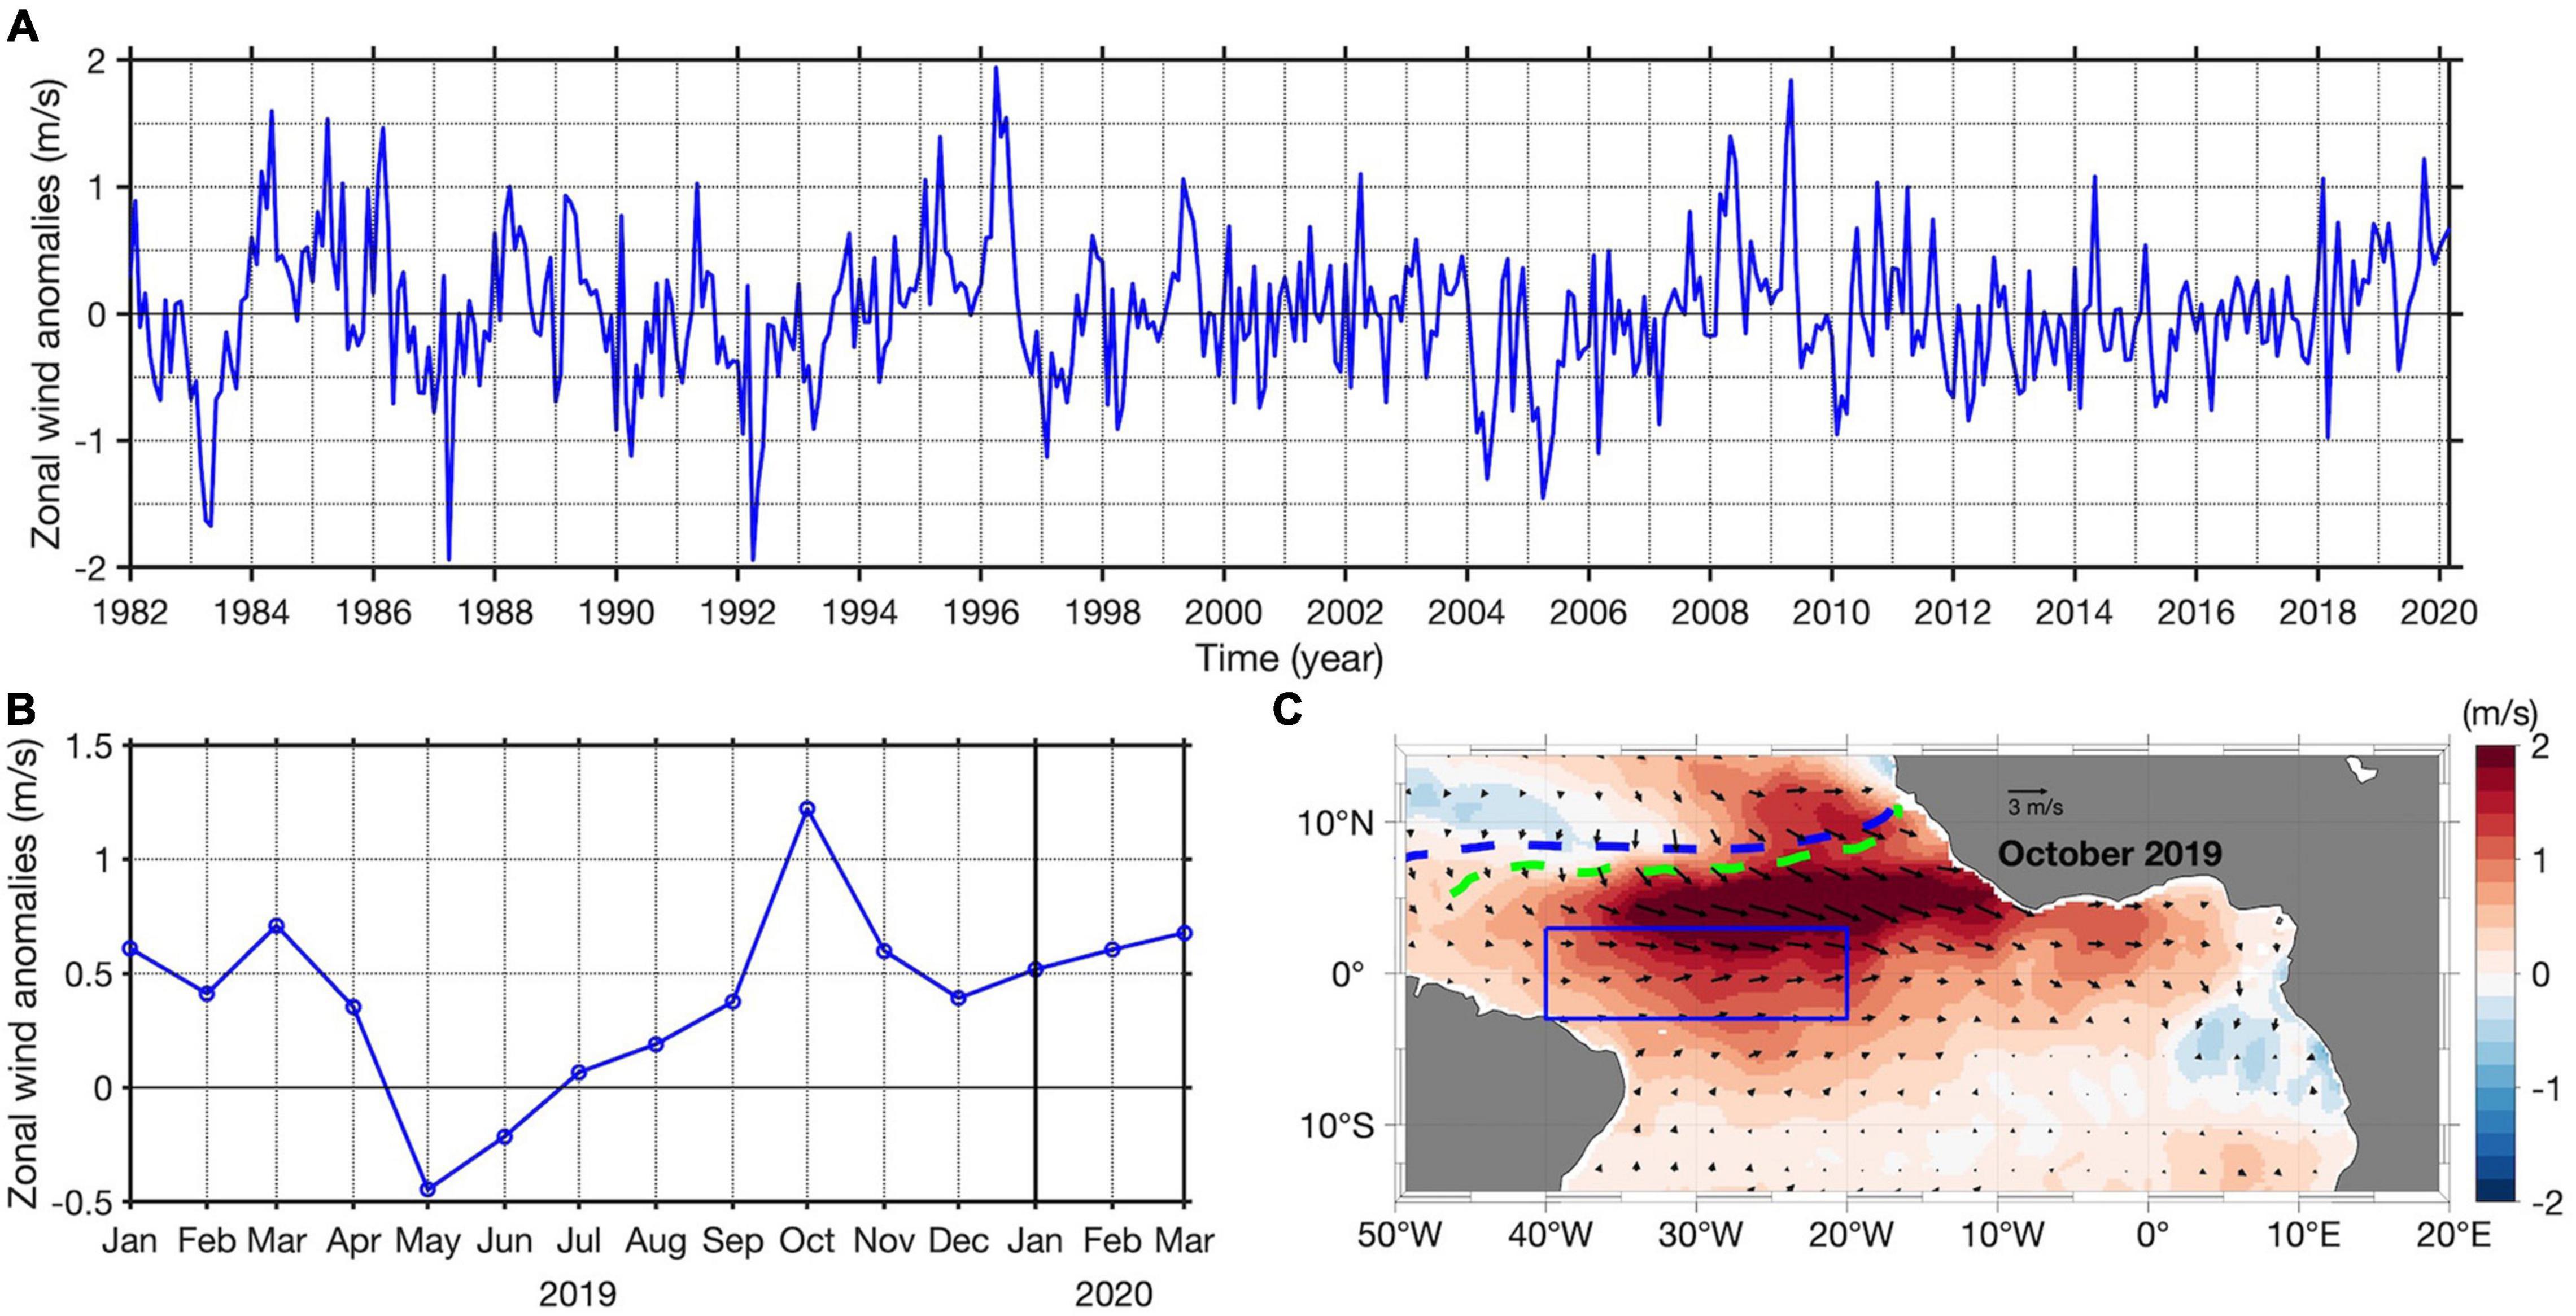
Figure 7. (A) Detrended anomalies of ERA5 zonal wind averaged between 40°W and 20°W, 3°S–3°N [WAtl, blue box in panel C] from January 1982 to April 2020. (B) Zoom in 2019–2020 of the zonal wind anomalies time series in panel A). (C) Detrended anomalies of zonal wind (shading) and surface winds (arrows) in October 2019. The dashed blue line represents the climatological mean position of the Intertropical convergence zone (ITCZ) in October. The dashed green line represents the position of the ITCZ during October 2019.
To investigate whether the wind anomalies generated EKWs, detrended sea level anomalies along the equatorial Atlantic and the West African coast are shown in Figure 8 between January 2019 and April 2020. Altimetry data are useful to monitor the equatorial wave propagations along the equatorial and coastal waveguides. Between August and September 2019, there are no signals in SLA characterizing the propagation of downwelling EKWs (Figure 8A) or subsequent CTWs (Figure 8B). Therefore, remote equatorial forcing through ocean dynamics has not contributed to the warming along the Southwest African coast in September 2019 (Figure 3C). In the equatorial Atlantic, positive SLA are observed starting in October 2019 which is consistent with the dynamic height anomalies from PIRATA data (not shown). However, compared to previous Benguela Niño events such as the one in 2010/2011 (Rouault et al., 2018), the SLA signal pointing to a downwelling EKW is relative weak. Moreover, an equatorial thermocline deeper than normal (>15 m) caused by the activity of the downwelling EKW is observed between October and November 2019 (Supplementary Figure 3) in the monthly detrended anomalies of 20°C isotherm depth (taken as a proxy for thermocline depth) from the ePIRATA data set in the equatorial Atlantic interpolated between the PIRATA mooring locations (35°W, 23°W, 10°W, and 0°E). Detrended anomalies of subsurface temperature in the upper 200 m interpolated between the PIRATA mooring locations along the Equator are shown in Figure 9 from August 2019 to March 2020 from the ePIRATA data. Between August and October 2019, weak positive temperature anomalies (<1.5°C) are observed in the eastern equatorial Atlantic in the upper 100 m (Figures 9A–C). Between 40- and 60-m depth, temperature anomalies (>2°C) are observed during the peak of the Benguela Niño in November and also in December 2019 in the eastern equatorial Atlantic (Figures 9D,E). The presence of strong positive temperature anomalies along the equator in November 2019 is in general agreement with the presence of westerly wind anomalies in October 2019 favoring the generation of a downwelling EKW (Figure 7C) which will deepen the equatorial thermocline (Supplementary Figure 3).
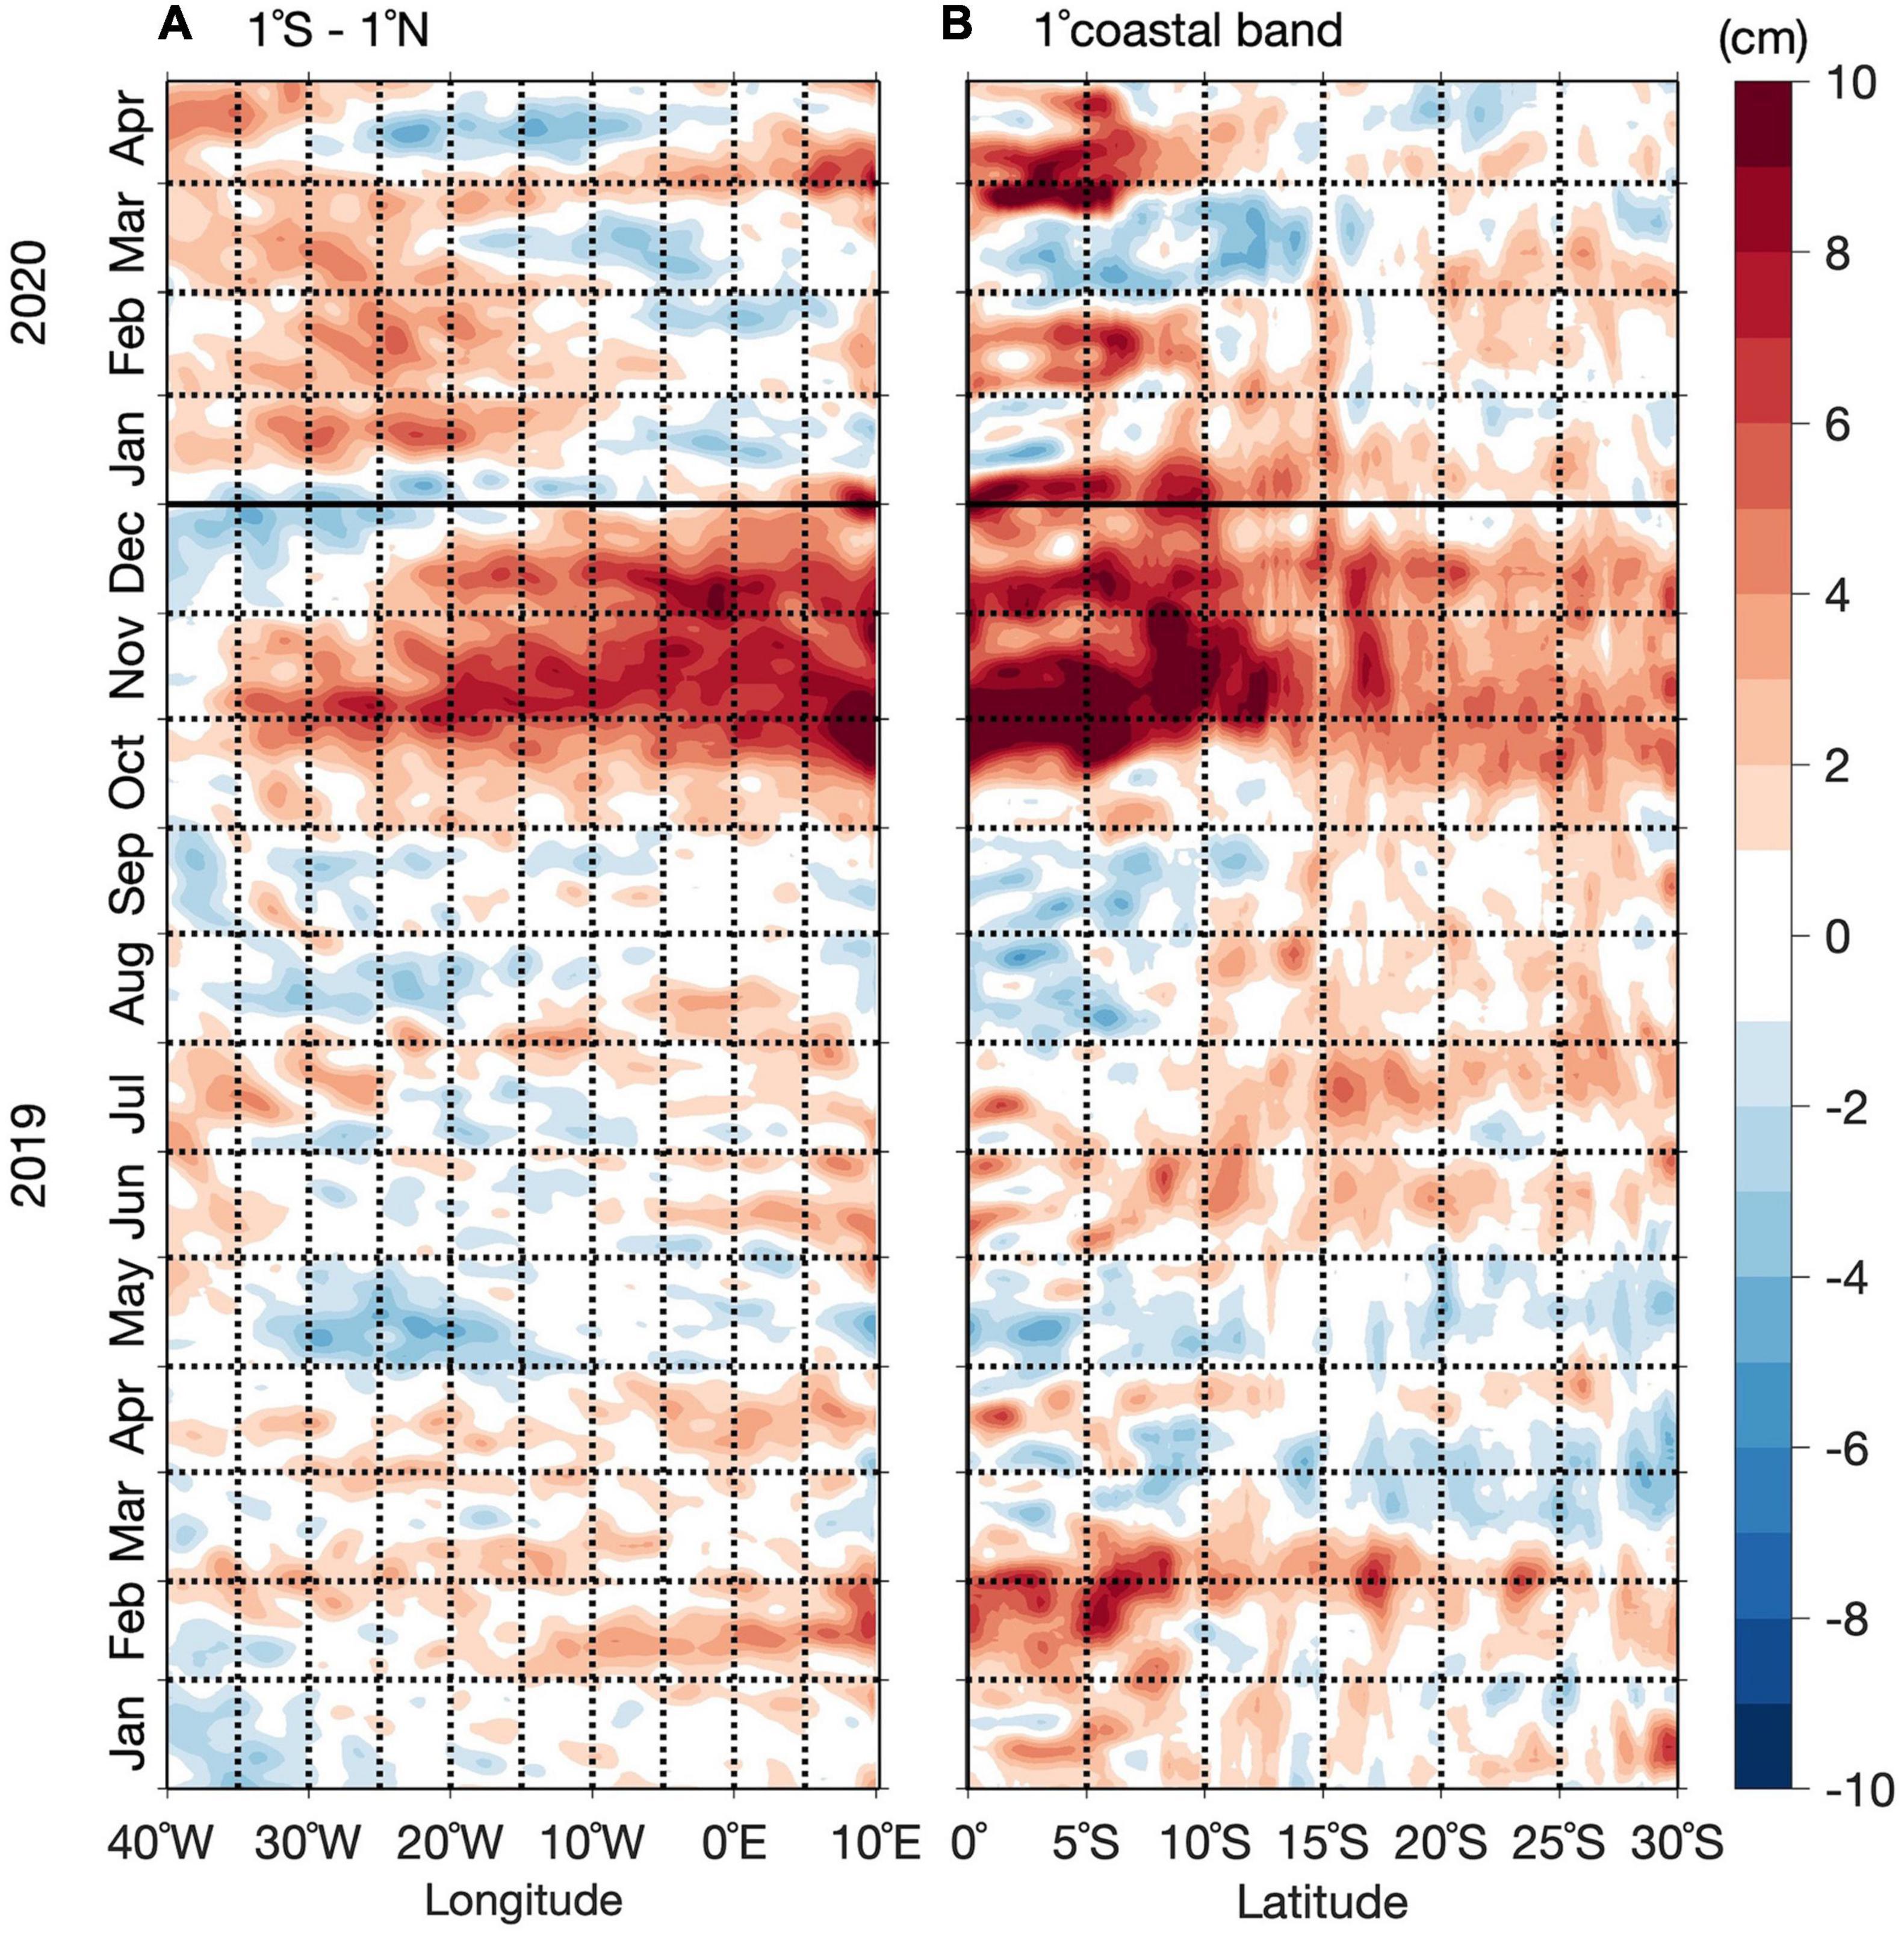
Figure 8. Hovmøller diagram of detrended SLA along the equator (averaged over 1°S – 1°N) from 40°W to the African coastline in panels (A,B) along the Southern African coast (averaged from the coast to 1° offshore) from 0°S to 25°S from January 2019 (bottom) to April 2020 (top). The anomalies are calculated relative to the period January 1993 to April 2020.
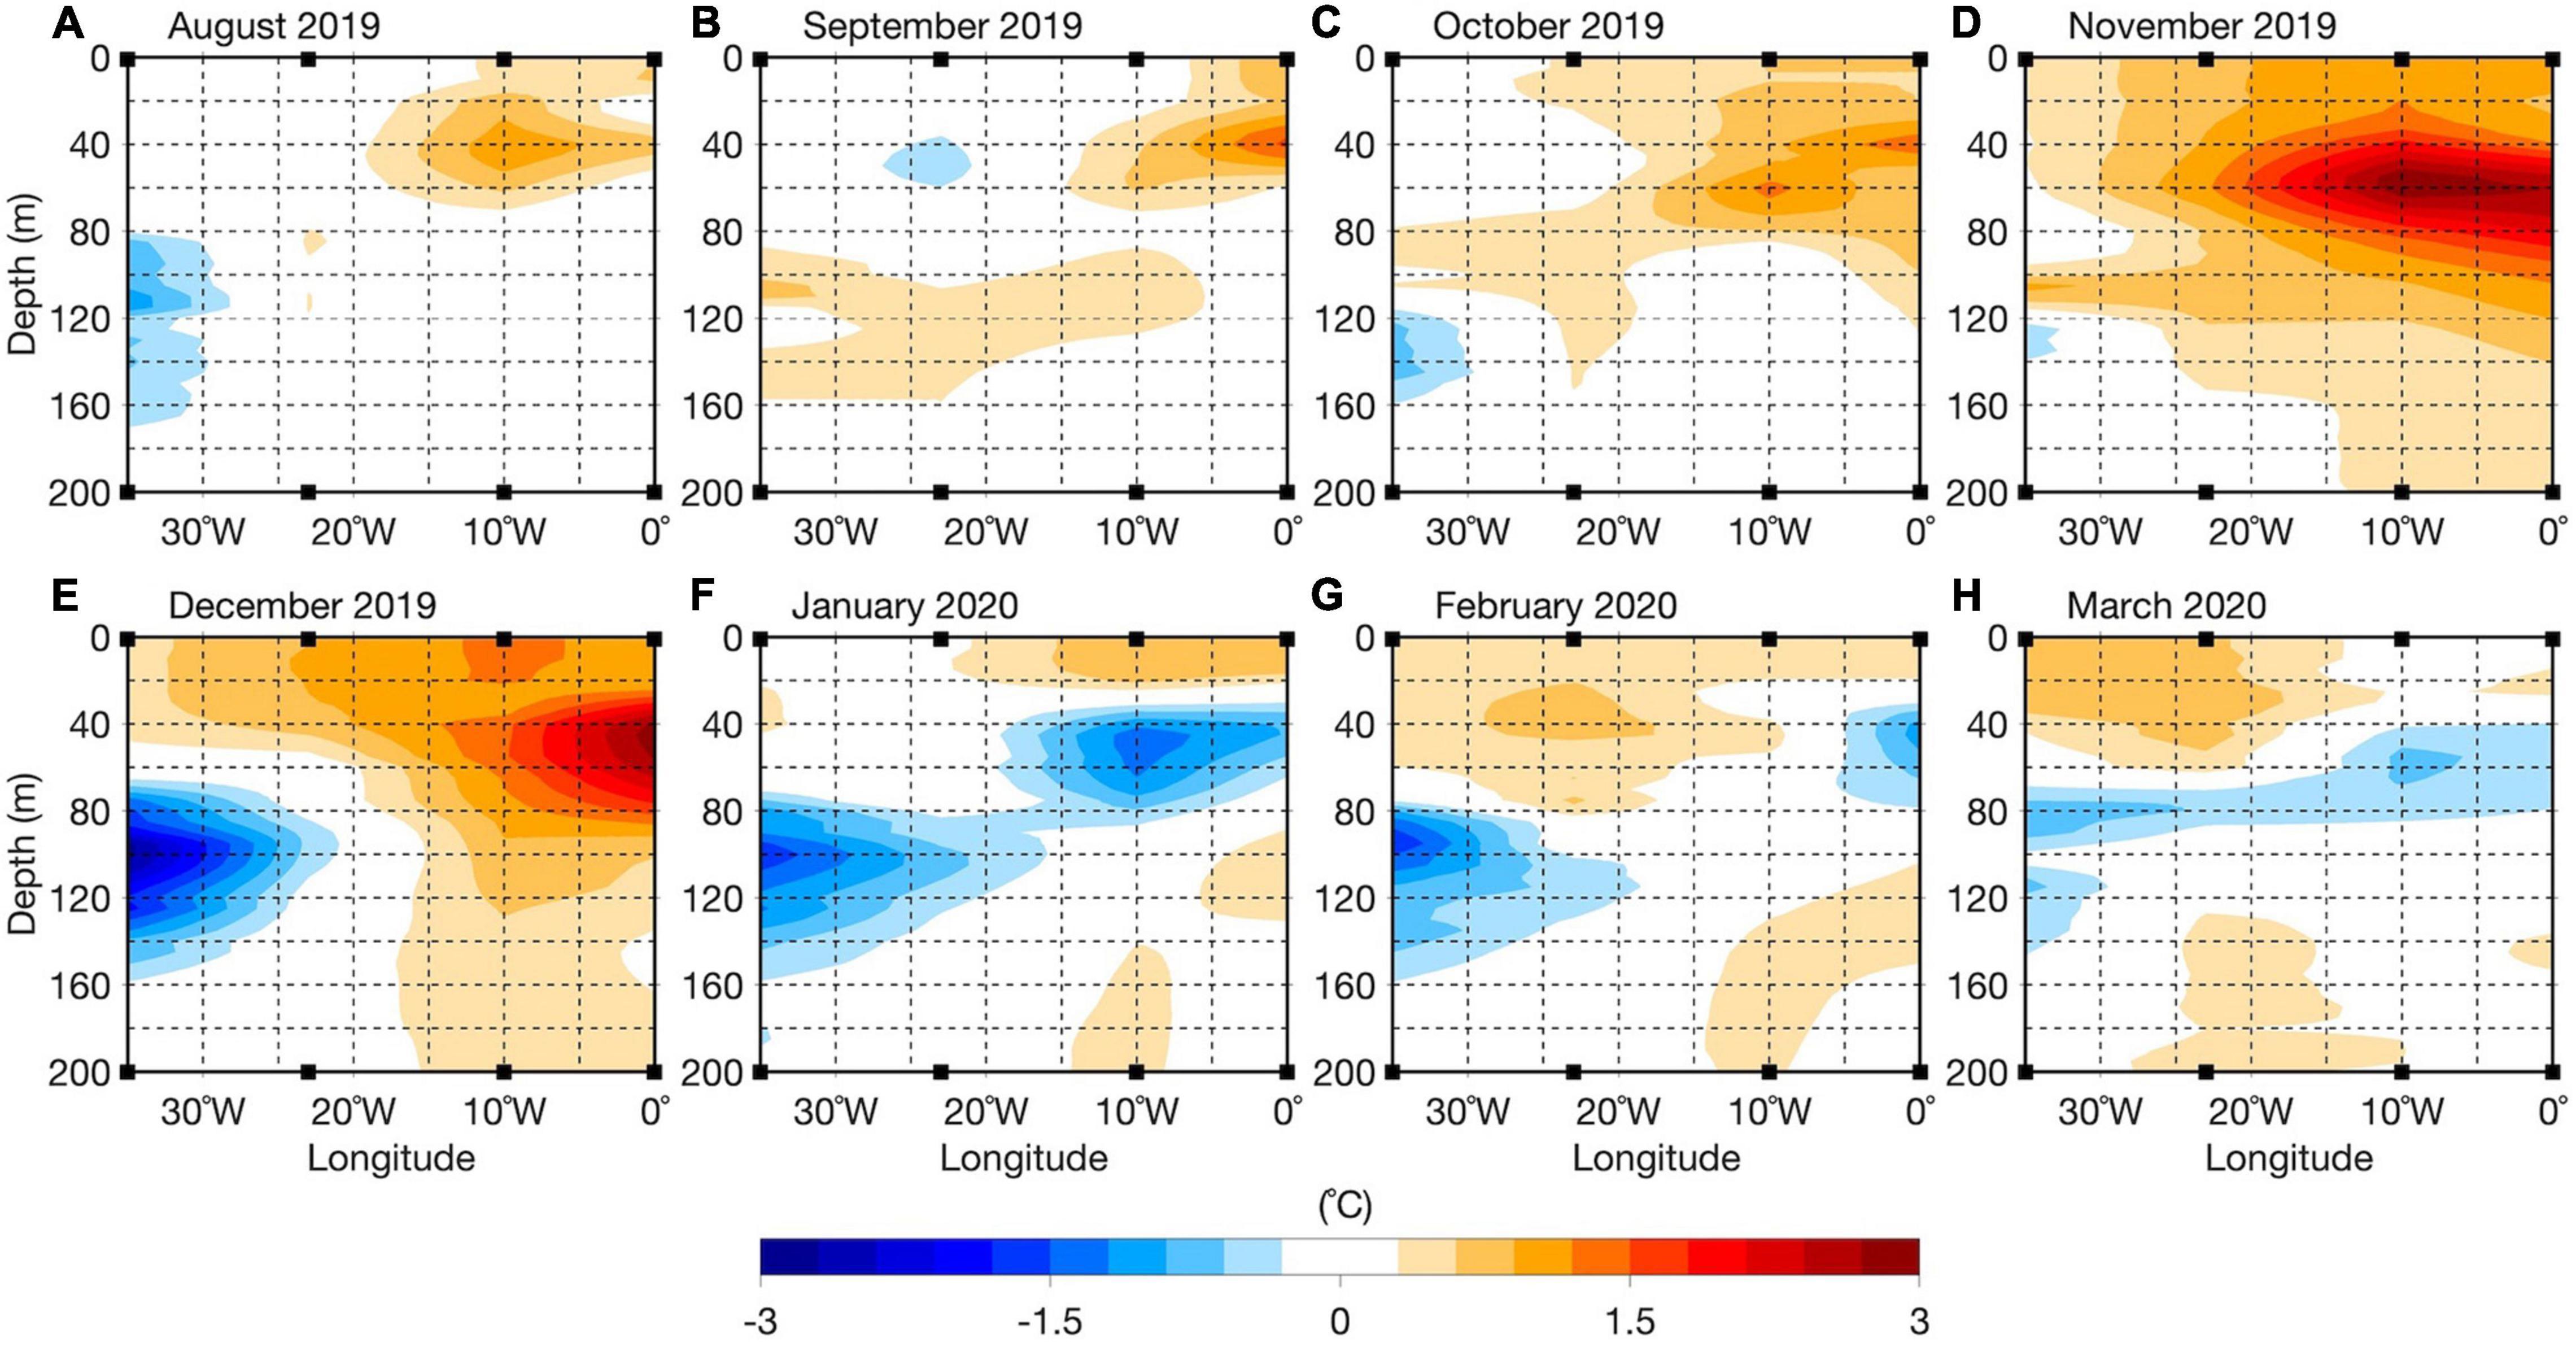
Figure 9. (A–H) Detrended anomalies of temperature in the top 200 m from ePIRATA from August 2019 to March 2020 computed using interpolated temperature fields from the four equatorial moorings located at 35°W, 23°W, 10°W, and 0°E (filled black squares on the x-axes). The data are available from September 1997 to August 2020.
An additional forcing of the eastern equatorial warming in November 2019 might come from the relaxed cross-equatorial southerly winds (Figure 10). Indeed, the Hovmøller diagram of monthly meridional wind anomalies in the equatorial Atlantic shows prevailing reduced southerly winds (<−1 m/s) in the eastern equatorial Atlantic (0–10°E) between mid-October 2019 and mid-February 2020 (Figure 10 and Supplementary Figure 2B). According to Philander and Pacanowski (1981), relaxation of cross-equatorial southerly winds causes a warming in the eastern equatorial Atlantic associated with a reduction of local upwelling. Indeed, Figure 10 shows that during November 2019, low (high) anomalies of SLA indicative of a shallow (deep) thermocline are observed north (south) of the equator associated with reduced cross-equatorial southerly winds. Along the equator, maximum SST anomalies (>1°C) is observed in November 2019 with strong anomalies of SLA (>6 cm) suggesting a deepening of the thermocline as observed in Supplementary Figure 3. We suggest that the reduction of the cross-equatorial southerly winds might have contributed to the eastern equatorial warming in November 2019 during the peak of the 2019 Benguela Niño. In December 2019, the temperature anomaly pattern shows a sign of an anomalous relaxation of the thermocline slope in the equatorial Atlantic with a deepening in the east and a shoaling in the west (Figure 9E). This is consistent with Figure 8A which shows negative (positive) anomalies of SLA in the western (eastern) equatorial Atlantic during December 2019 and also with the observed z20 anomalies (Supplementary Figure 3). However, in January 2020 (Figure 9F), a subsurface cooling around the thermocline level is observed in the eastern equatorial Atlantic. This might be caused by the eastward propagation of an upwelling Kelvin wave induced by an upwelling Rossby wave reflecting at the western boundary which is forced by westerly wind anomalies along the equator (Nagura and McPhaden, 2010) in October 2019. This mechanism is called the delayed action oscillator (e.g., Suarez and Schopf, 1988) causing a delayed negative feedback. In addition, upwelling Rossby waves triggering upwelling Kelvin waves at the western boundary could be forced by positive anomalies of wind stress curl north of the equator west of 25°W in November 2019 (Figure 6C) which might have contributed to enhance the upwelling SLA signal along the equator. Weak temperature anomalies (<0.3°C) are observed in the near-surface in the equatorial Atlantic in February 2020 (Figure 9G) and are shifted westward in March 2020 (>0.3°C, Figure 9H).
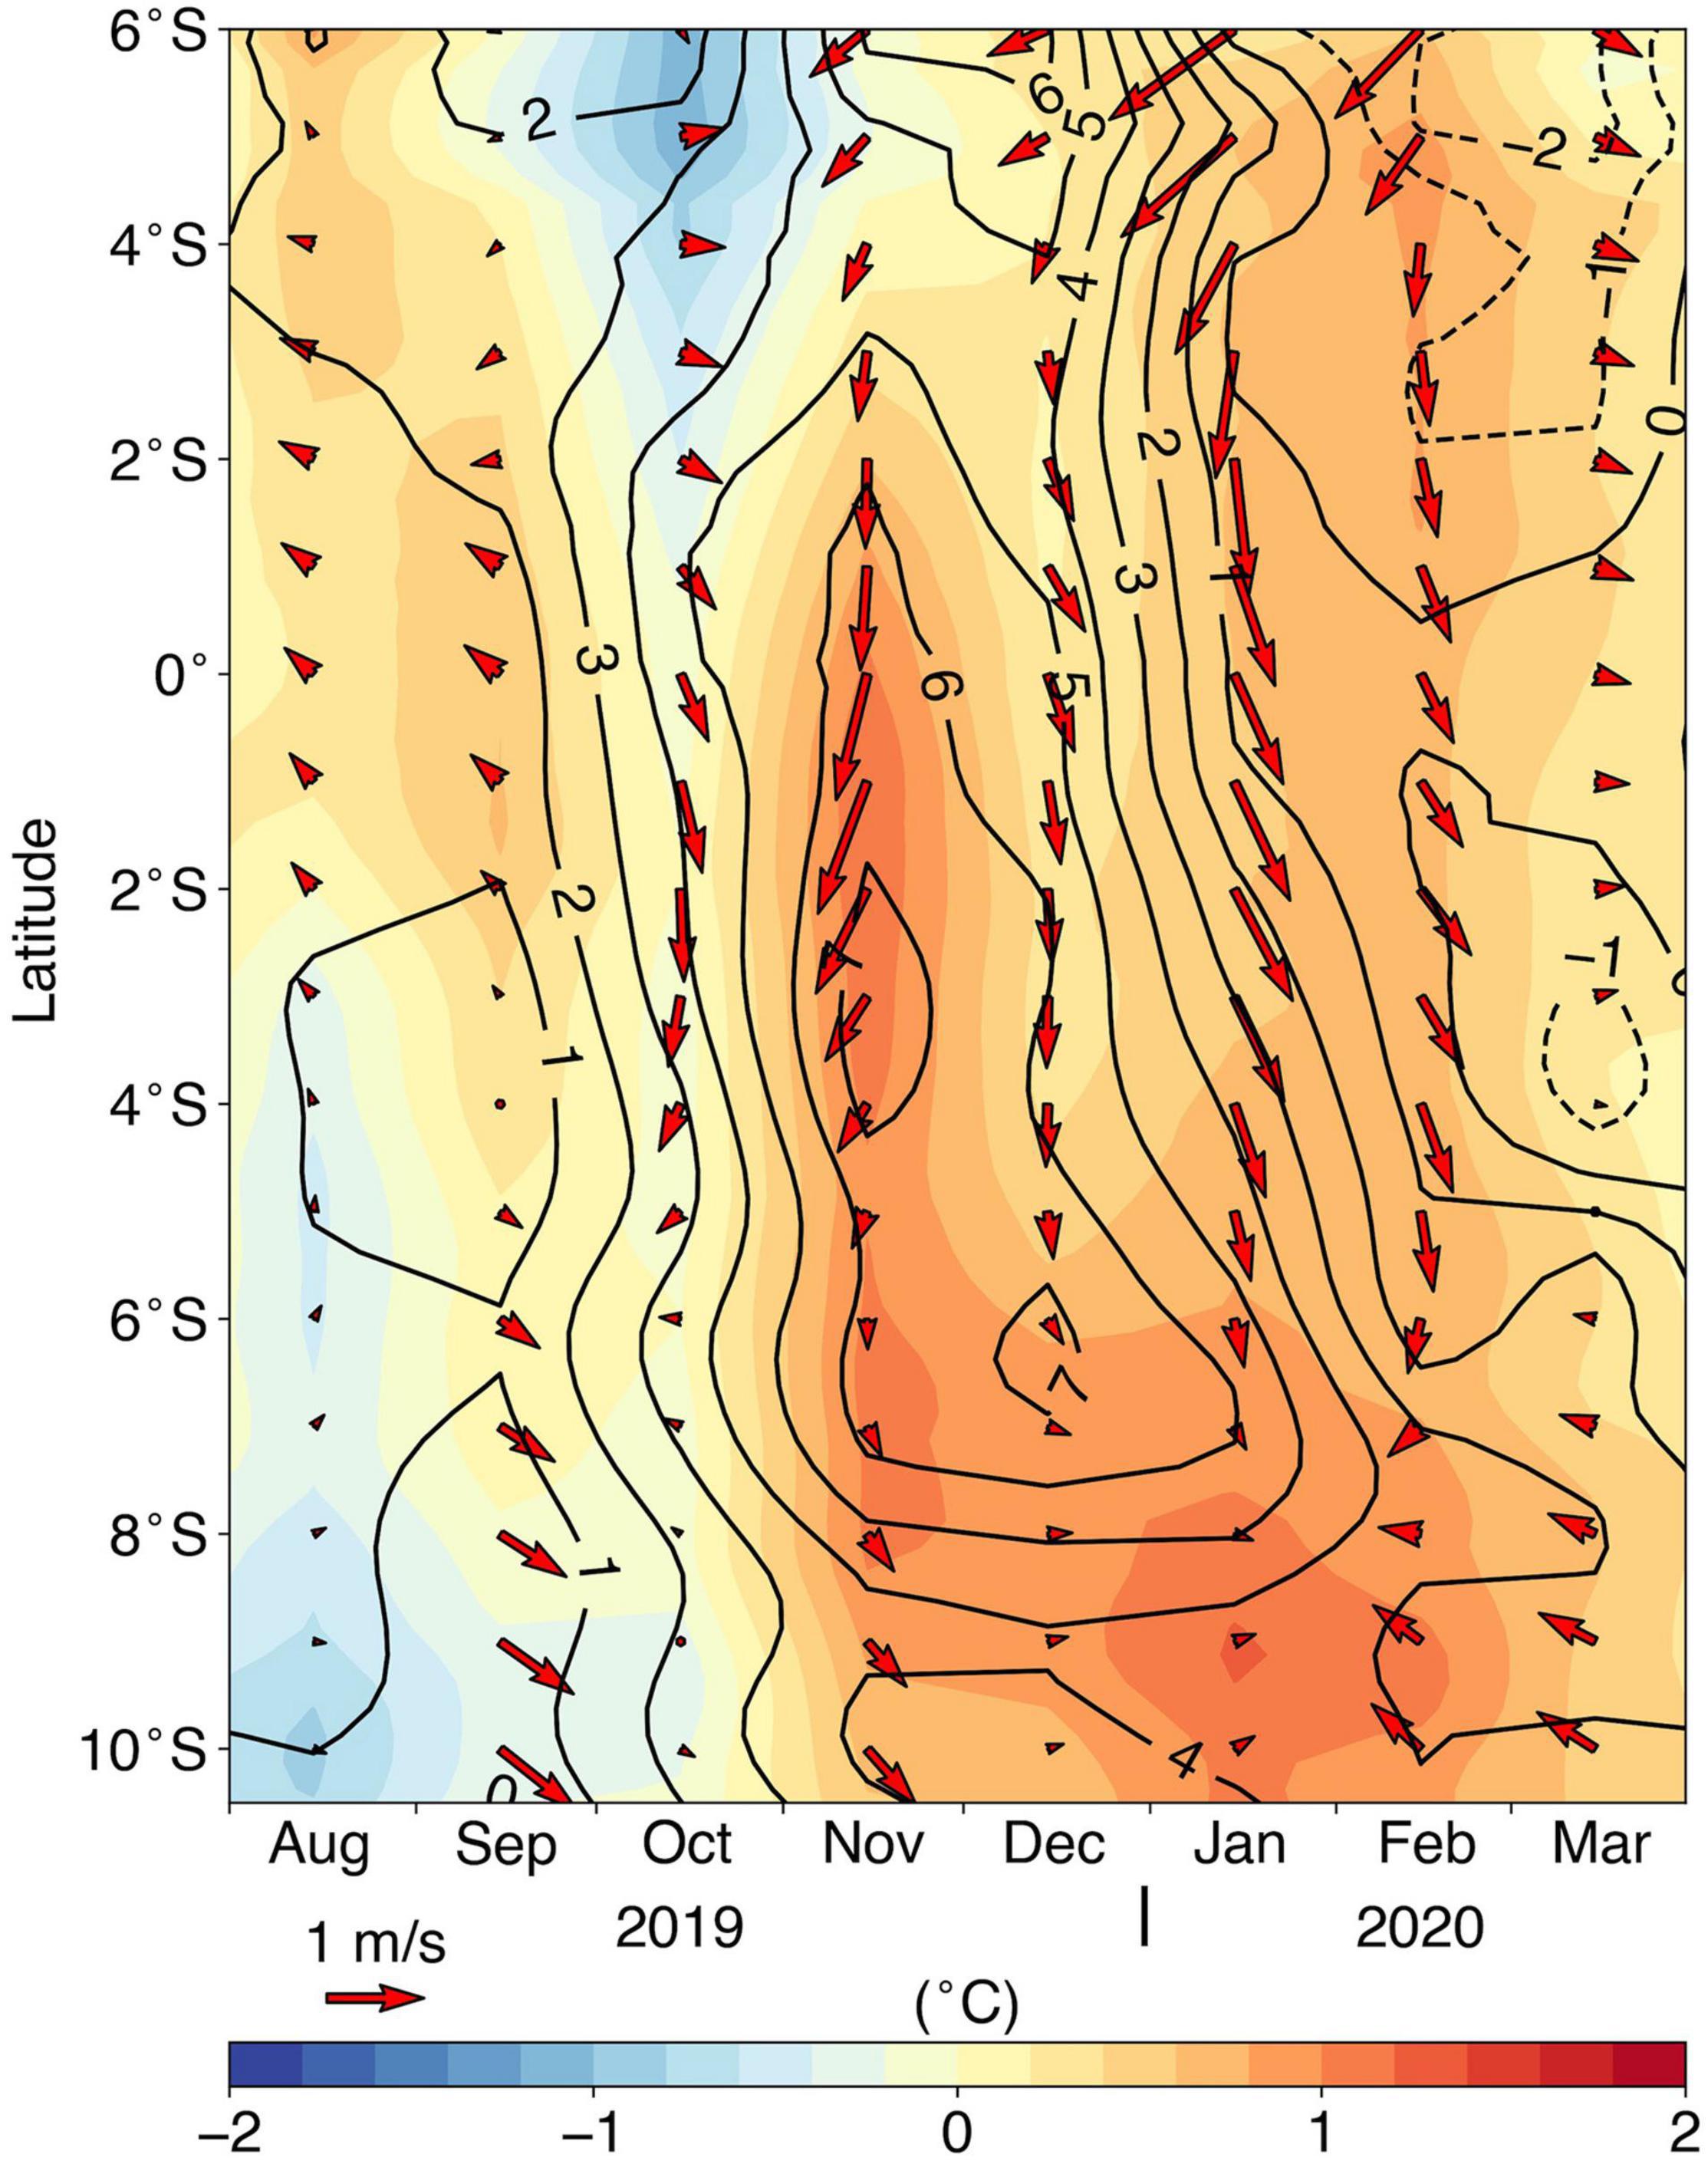
Figure 10. Hovmøller diagram of detrended monthly anomalies of SST (shading), SLA (contours), and surface winds (arrows) averaged between 0°E and 10°E from August 2019 to March 2020. Anomalies are computed relative to the period January 1982 and April 2020.
Along the West African coast, downwelling poleward CTW propagations associated with SLA greater than 10 cm are observed from October 2019 to January 2020 (Figure 8B). These downwelling CTWs are potentially triggered by the superposition of downwelling EKWs forced by westerly wind anomalies during October 2019 (Supplementary Figure 2A). There might be an additional contribution from the coastal northerly wind anomalies between 5°S and 12°S (∼−2 m/s) to force downwelling CTWs in December 2019 and January 2020 (not shown). Theses CTWs trigger positive SST anomalies along the West African coast (Figures 3D–F). The downwelling CTW propagating in January 2020 (first 10 days, Figure 8B) is at the origin of the peak in SST in the Southern Angola region in January (Figure 3G). As the signature of the CTW is weaker south of 15°S (cf. Figure 8B), it does not affect the regions further downstream. It is worth to mention that climatologically, this downwelling CTW propagates during the secondary, weaker upwelling season (December–January) off Angola. Similar to Figure 8, the detrended SST anomalies along the equator and the West African coast are presented in Figure 11. In agreement with the maps shown in Figure 3, weak positive SST anomalies (<1°C) are observed along the equator and the West African coast in September 2019 until 10°S. South of 10°S, positive SST anomalies (>1°C) are shown in the Southern Angola region (until mid-September 2019) and in the Angola Benguela front region associated with an anomalous southward position of the Angola Benguela SST front (Figure 11B, black line). Larger SST anomalies (>2°C) are observed south of 5°S between mid-November 2019 and January 2020. Interestingly, there might be a lag of about 14 days between the passage of the downwelling CTW at the end of October 2019 and the maximum SST anomalies (>2°C) recorded in mid-November 2019 indicative of a thermocline feedback. Relative to the climatology (Figure 11B, green line), a southward migration of the Angola Benguela SST front (Figure 11B, black line) is observed from November to December 2019 which is caused by the downwelling poleward CTW propagations during that period of the year (Figure 8B). The appearance of cold SST anomalies (<−1°C) south of 15°S between December 2019 and January 2020 indicates the demise of the coastal warm event. In contrast, the Southern Angola region records its largest SST anomalies (>2°C, Figures 3G, 11B) in January 2020 associated with a poleward downwelling CTW propagation (Figure 8B), before being stopped by the appearance of cold SST anomalies (<−1°C) in February 2020.
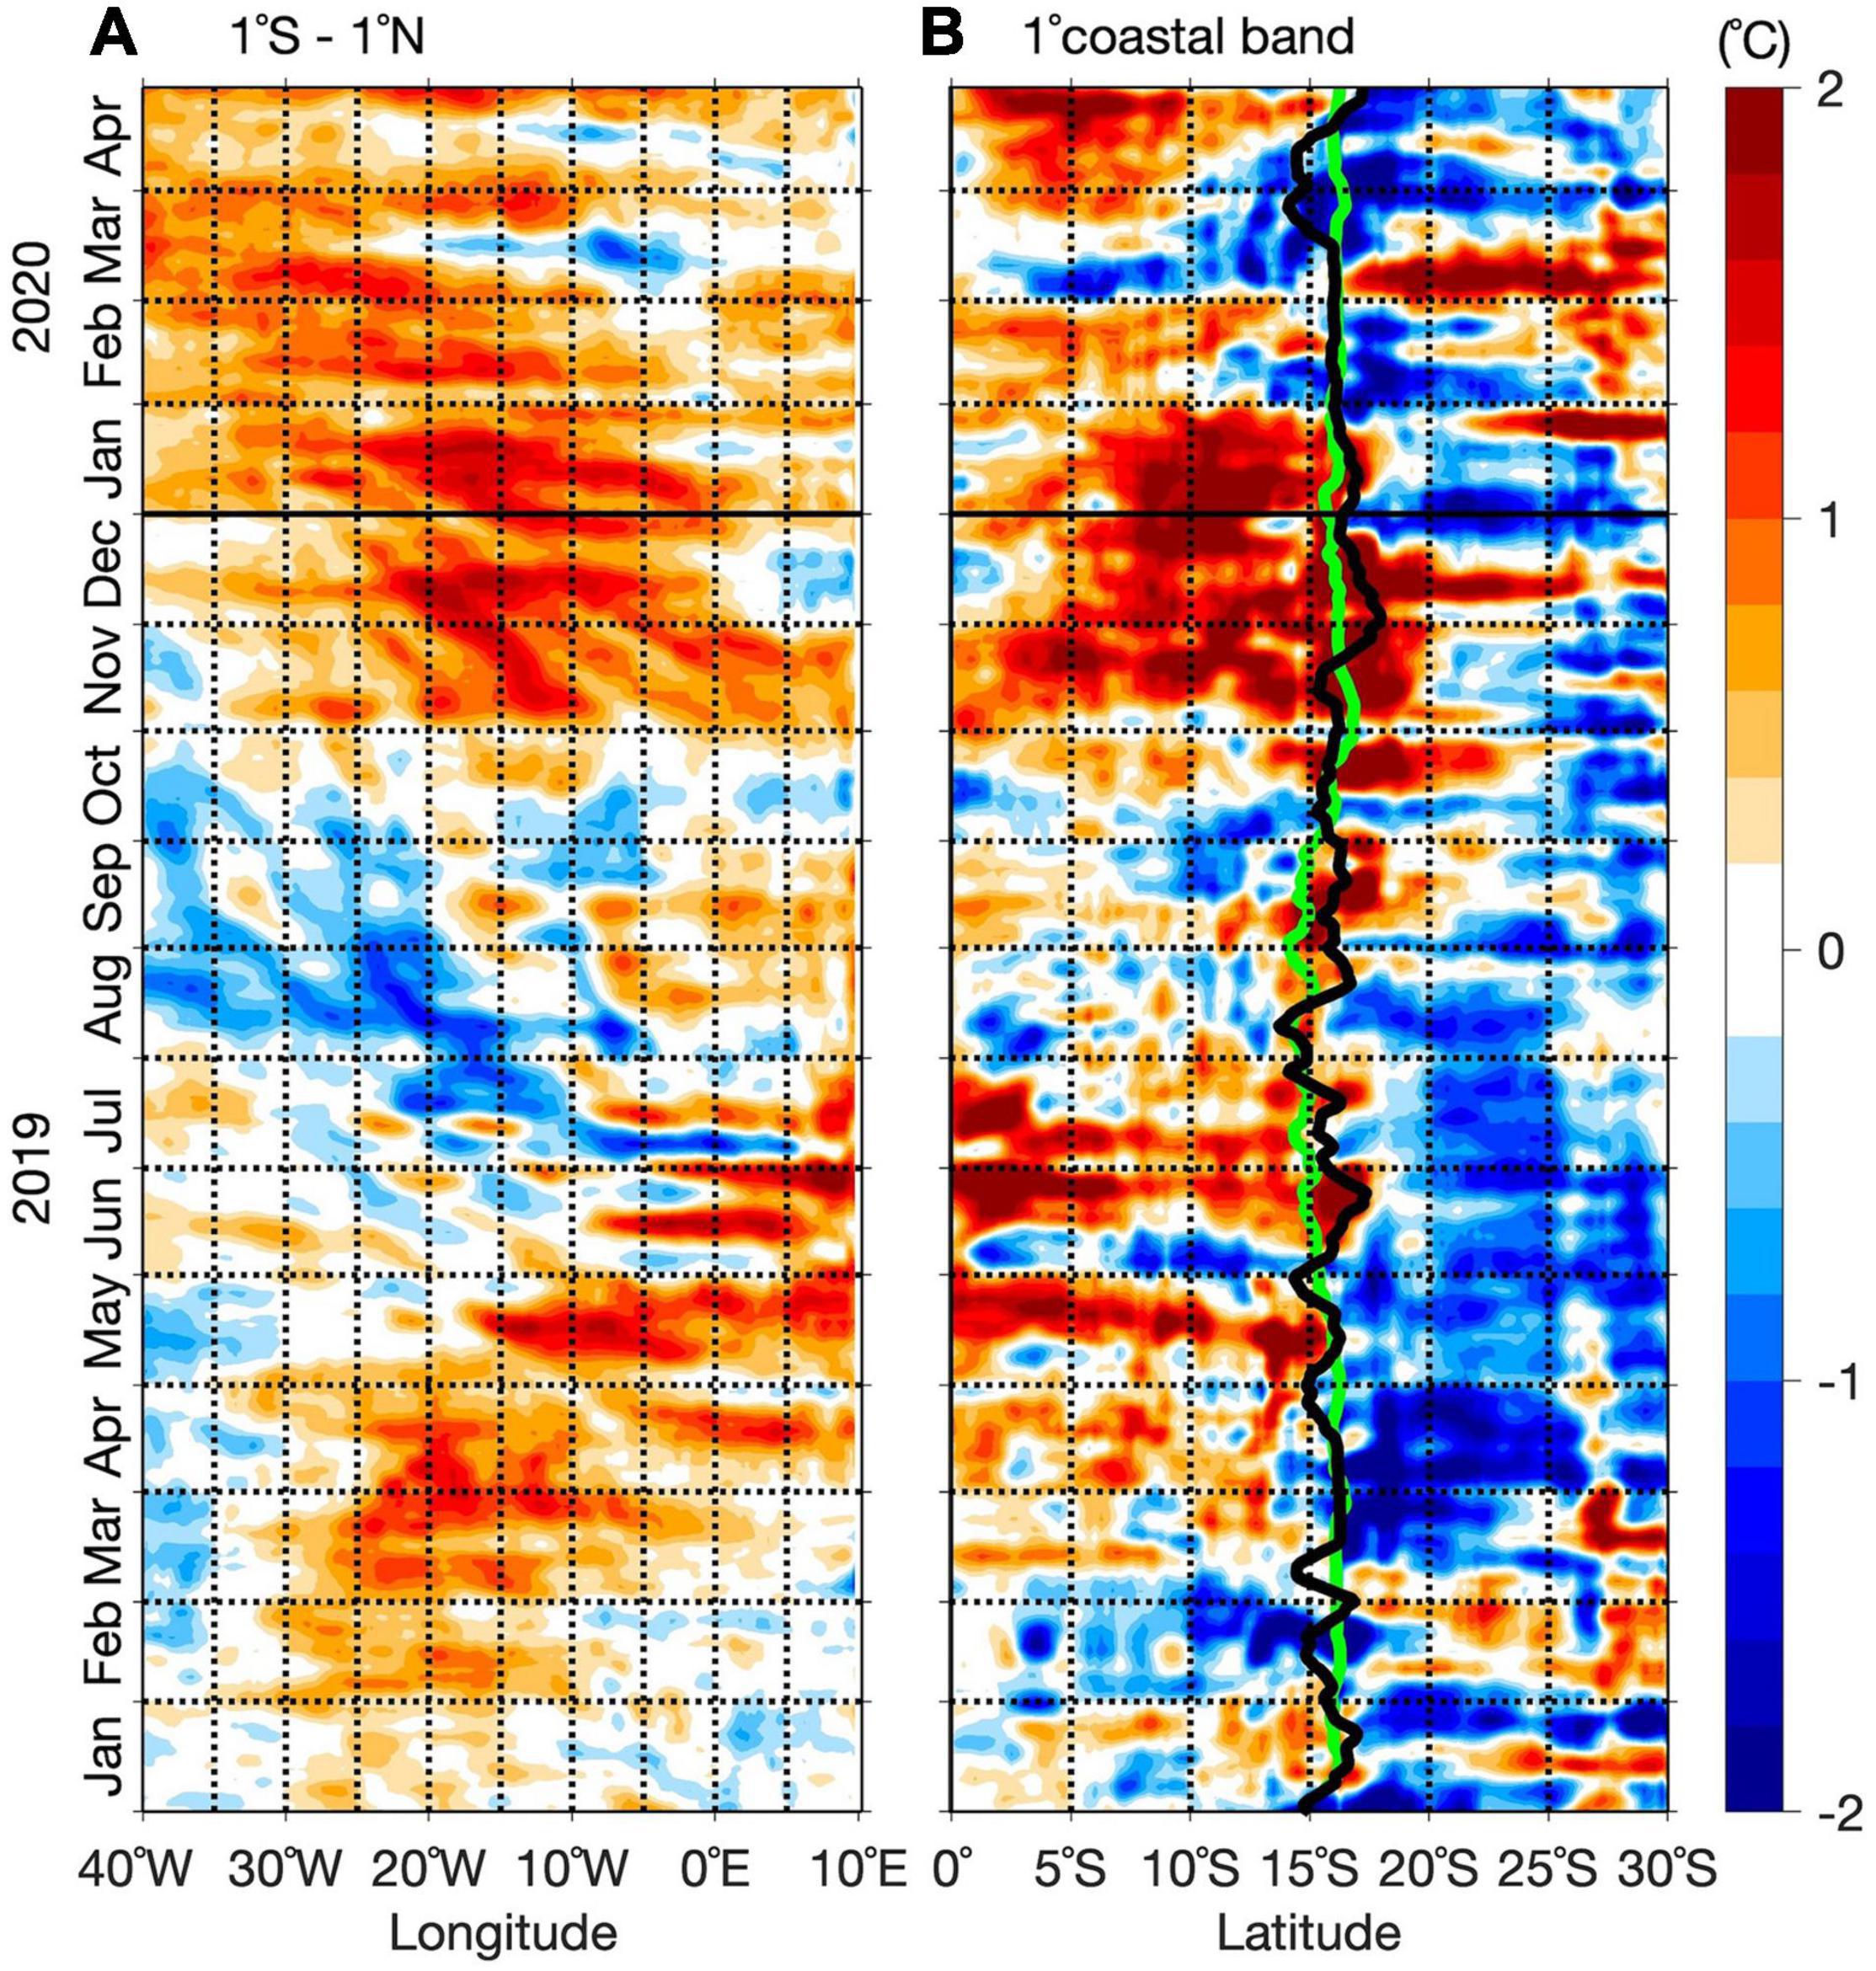
Figure 11. Hovmøller diagram of detrended anomalies of daily SST along the equator (averaged over 1°S – 1°N) from 40°W to the African coastline in panel (A) and along the Southern African coast (averaged from the coast to 1° offshore, in panel (B) from 0°S to 25°S from January 2019 (bottom) to April 2020 (top). Anomalies are computed relative to the period January 1982 and April 2020. The daily mean climatology (anomalies) of the location of the maximum meridional SST gradient is represented in green (black) over Figure 11B. A 10-day running mean is applied to smooth the data.
The southward shift of the ABF might be related to stronger poleward flow of warm water. The potential role of meridional advection is investigated using moored velocities off Angola (11°S) available since July 2013. Figure 12 presents the subsurface moored alongshore velocities with the surface alongshore geostrophic current from altimetry on top. The alongshore flow off Angola is not a steady flow and is constituted of alternating periods of northward and southward velocities with maximum velocity amplitude of about 40 cm/s. In October and November 2019 (peak of the event), an enhanced vertically coherent poleward flow (<−20 cm/s in the upper 100 m) is observed off Angola. Thus, the poleward flow in the upper 100 m might have contributed to the development of the 2019 Benguela Niño through advection of warm equatorial waters downstream. Using the meridional SST gradient averaged in the ABA (8°E-14°E; 10°S-20°S) and the near-surface absolute geostrophic velocity anomaly at the mooring position (13°00′E; 10°50′S), the SST change due to the resulting anomalous meridional advection can be quantified. In October (November) 2019, the meridional SST gradient of 5.3 × 10⁻⁶ (5 × 10⁻⁶) °C/m and the poleward near-surface velocity anomaly of 0.05 (0.08) m/s yields to an anomalous warming by poleward meridional heat advection of 0.67 (1.05) °C/month, respectively. The poleward meridional heat advection during the event was largest in October and November 2019. The averaged anomalous warming due to the meridional heat advection of 0.86°C/month overcomes the anomalous SST change between October and November 2019 that was 0.77°C/month suggesting the importance of other cooling mechanisms such as the negative feedback by the net surface heat flux discussed before (Figure 5F).
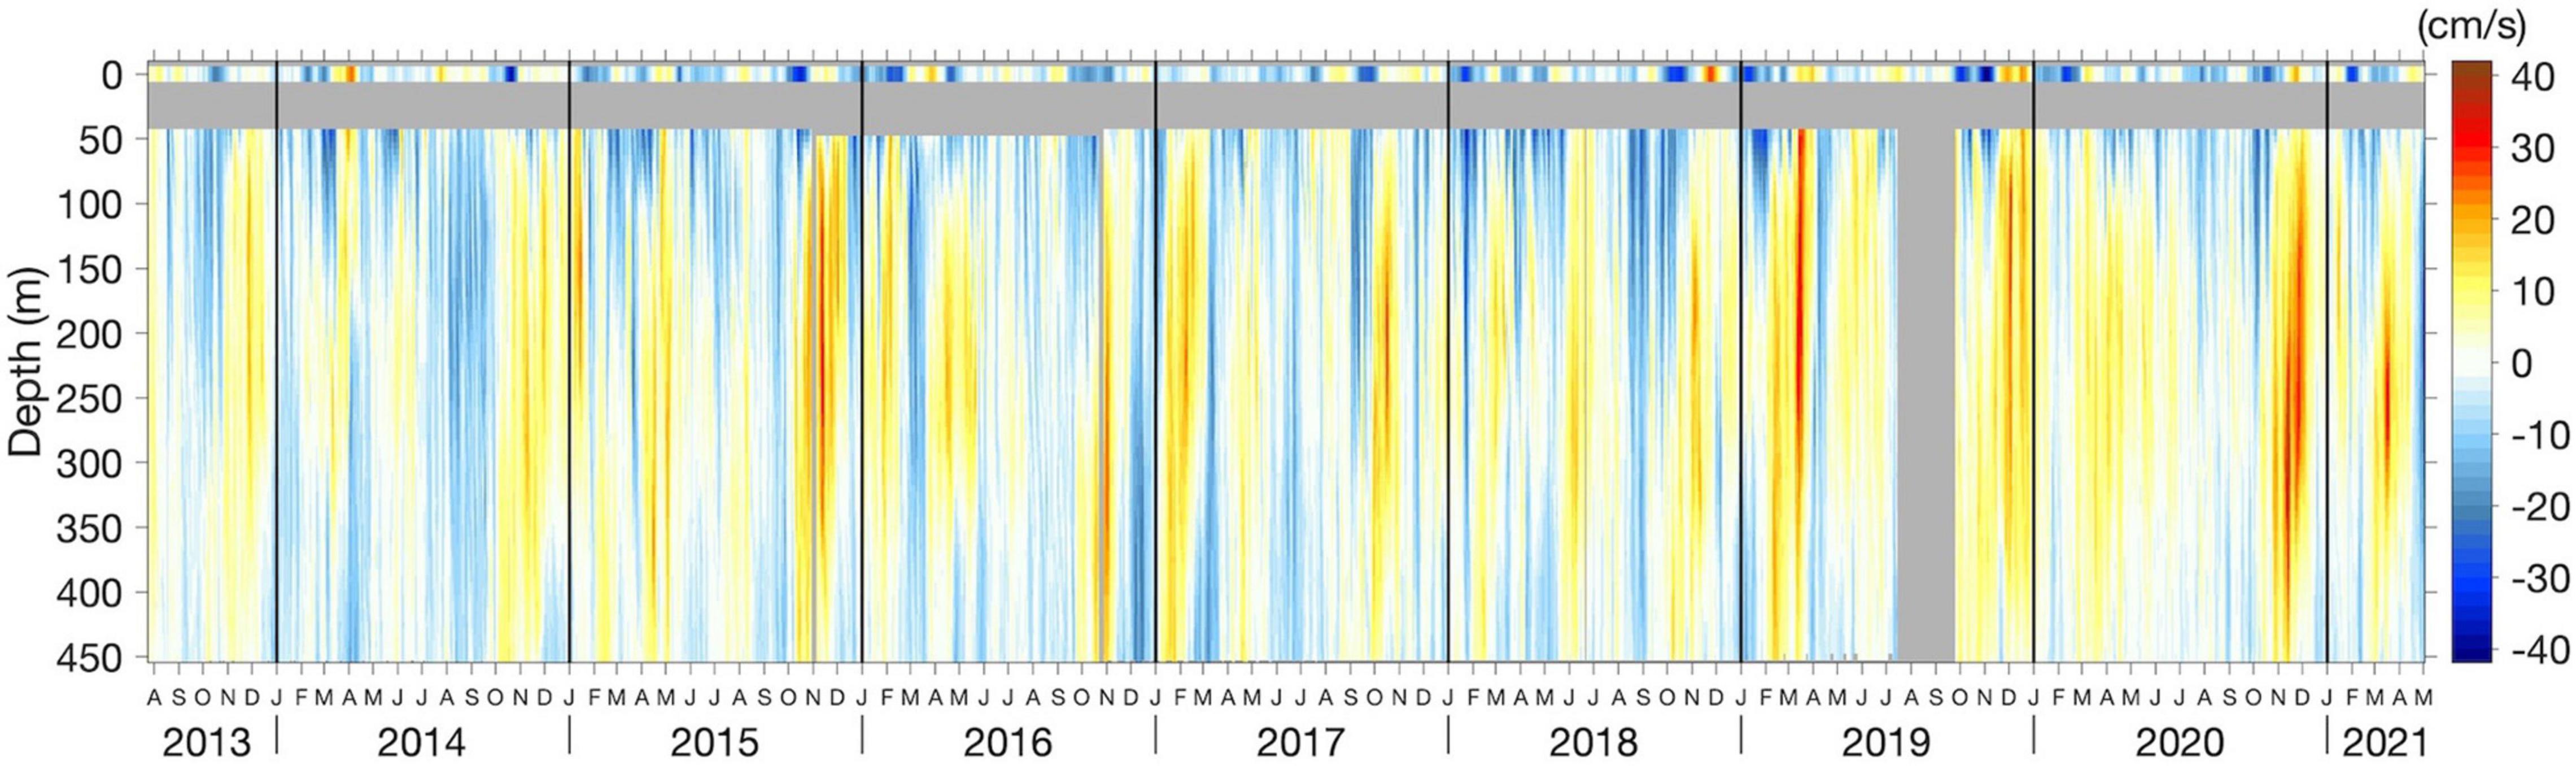
Figure 12. Time series of daily alongshore velocities of surface absolute geostrophic velocities from altimetry and from moored ADCP (from 45-m depth) at 11°S.
Link to the Net Primary Production
The Angola Benguela upwelling system which is part of the Benguela current large marine ecosystem is an area with high biological productivity (Jarre et al., 2015). Therefore, in this section, we look at the relation between the warm SST anomalies during the 2019 Benguela Niño and the local NPP. NPP values are derived using the Eppley vertically generalized production model in the southeast Atlantic Ocean. In general, the period from July to September represents the upwelling season off Angola which is typically associated with high NPP. However, note that the NPP is not necessarily only fuelled by local vertical processes (indicated here by the SST anomaly), but also by the nutrients from the Congo River discharge and the spreading of the river plume. The strongest impact of the Congo River is found between 3°S and 7°S (Figure 13). In August 2019, strong positive anomalies of NPP (1.5 gC m–2 day–1, Figure 13A) are observed along the West African coast collocating with cold SST anomalies. In September 2019, in the Southern Angola region, the positive local near-coastal wind stress curl anomaly, i.e., downwelling anomalies (Figure 6A) reducing the local upwelling and favoring the local warming, are associated with local lower than normal NPP (<−1.5 gC m–2 day–1, Figure 13B). Note that off Southern Angola, the NPP is climatologically high in August-September. One month later (October 2019), these negative anomalies of NPP appear slightly poleward (Figure 13C) compared to September 2019 and also collocate with positive SST anomalies. In November 2019 (Figure 13D) during the peak of the 2019 Benguela Niño, weak negative NPP anomalies (∼ -0.5 gC m–2 day–1) are observed in the Southern Angola and Angola Benguela front regions. Note that November-December corresponds to the period of the year when the climatology of the NPP shows the lowest values off Southern Angola. Weak precipitation anomalies are recorded over the land and the ocean in November 2019 (Supplementary Figure 4D) south of 10°S consistent with slightly negative SSS anomalies (<−1) observed during the same period (Supplementary Figure 5D). Figures 13E,F display quite similar amplitudes of negative NPP anomalies (∼ -1 gC m–2 day–1) in the Southern Angola and Angola Benguela front regions during December 2019 and January 2020. Likewise, north of 7°S, the distribution of the SSS anomaly in January to March 2020 looks very similar to the one of the NPP anomalies with positive NPP anomalies (Figures 13F–H) collocating with negative SSS anomalies (Supplementary Figures 5F–H). Indeed, in February to March 2020, the remarkable feature is the strong positive NPP anomalies (>2 gC m–2 day–1) observed offshore and north of 7°S where the freshwater from Congo River (river mouth is at about 6°S) are discharged into the Atlantic Ocean. Likewise, Supplementary Figure 4G also shows in February 2020 strong positive precipitation anomalies (>3 mm/day) over land and in the ocean. High precipitation over land will increase the discharge of the Congo River into the Atlantic Ocean which will bring more nutrients from land into the ocean and also contribute to reduce the SSS (Supplementary Figure 5) with the freshwater input. However, the strength of the NPP interannual variability in the offshore area in comparison to its seasonal variability (not shown) remains unclear, especially due to the interannual variability of the Congo River discharge and its spreading which is in fact very variable. We note that the low salinity waters are not spreading southward (Supplementary Figure 5) and are remaining north of 12°S during the warm event.
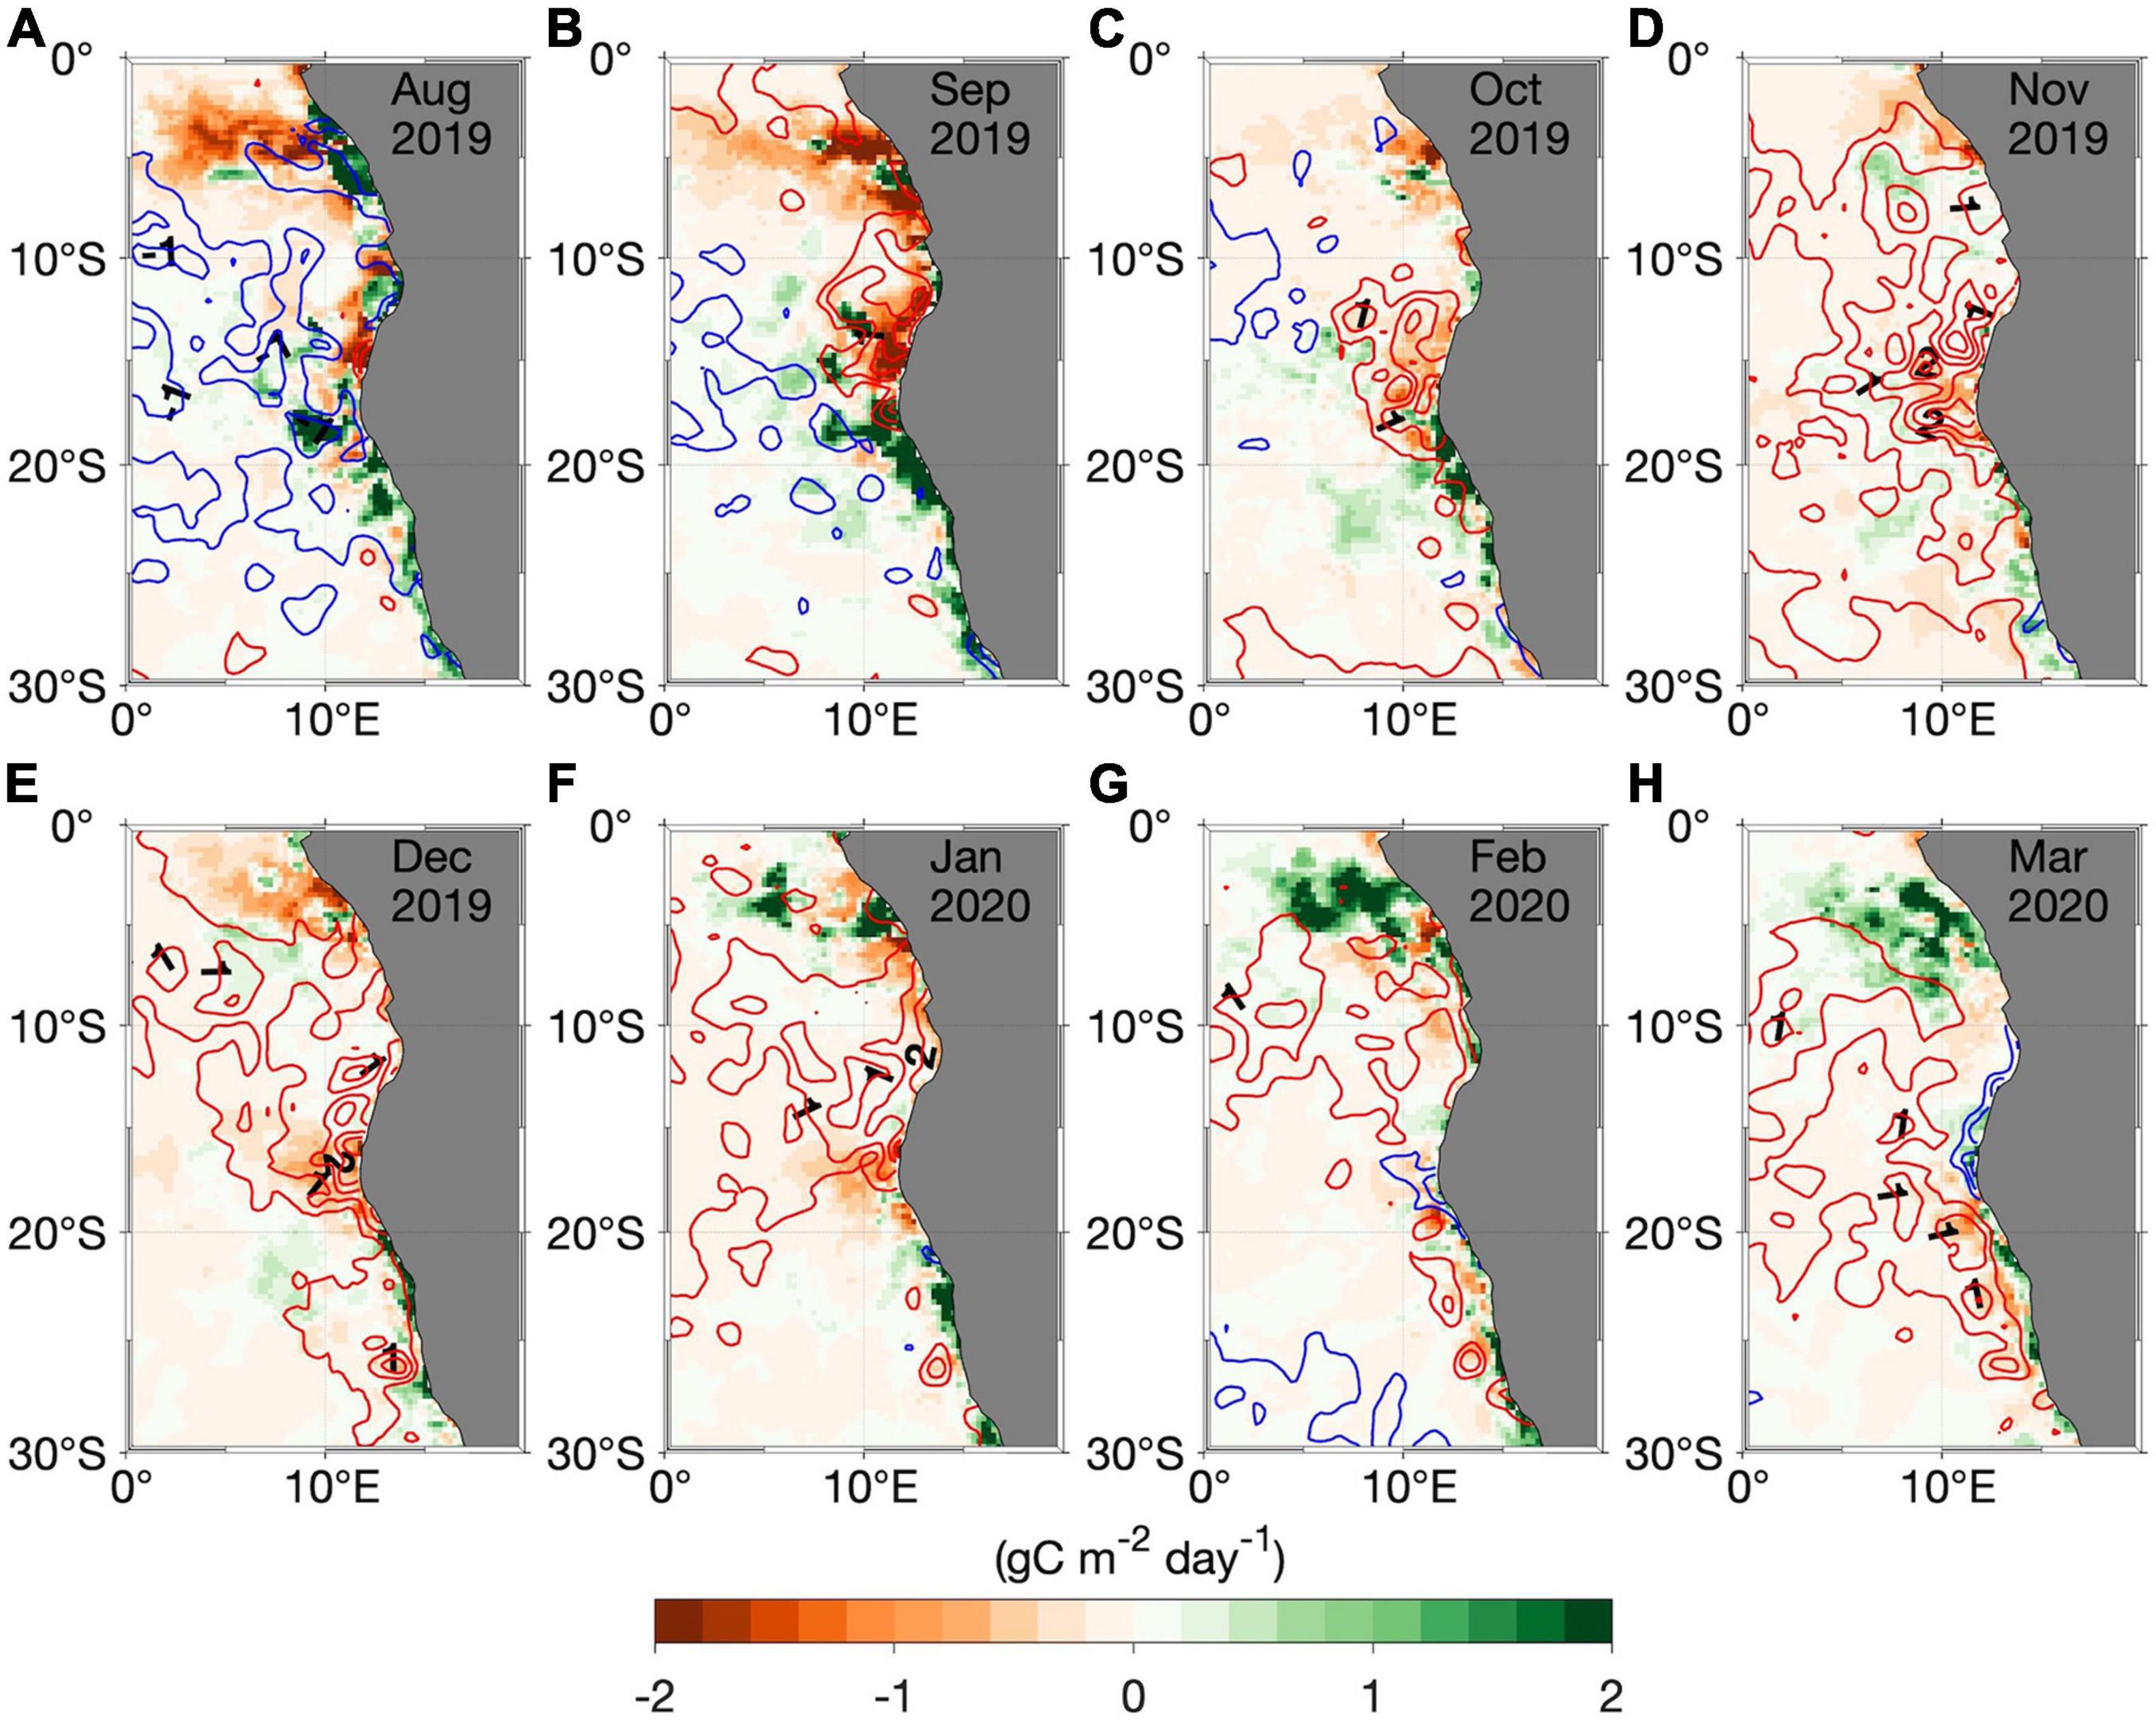
Figure 13. (A–H) Monthly NPP (SST) anomalies in shading (contours) in the southeast Atlantic from August 2019 to March 2020. Blue and red contour intervals are 0.5°C and represent negative and positive SST anomalies, respectively. The anomalies are calculated relative to the period July 2002 to July 2020 for NPP and January 1982 to April 2020 for SST.
Discussion and Summary
In this manuscript, the generation, development and the demise of the 2019 Benguela Niño have been investigated using observations and the ERA5 reanalysis product in the southeastern tropical Atlantic Ocean. Compared to previous Benguela Niño events that occur during boreal spring, the 2019 Benguela Niño developed at the end of the year with SST anomalies exceeding 2°C in November 2019 in the Angola Benguela front region (Figure 3E). The timing is quite similar to the one of the 2010/2011 Benguela Niño described in Rouault et al. (2018) with maximum amplitude of SST anomalies (>4°C) occurring in January 2011.
The 2019 Benguela Niño was forced by the combination of local and remote forcing contrary to the canonical Benguela Niños described in the literature (e.g., Rouault et al., 2007, 2018; Richter et al., 2010; Imbol Koungue et al., 2017). On the one hand, local processes dominated in September 2019 in the Southern Angola and the Angola Benguela front regions and generated an early warming. In the Southern Angola region, the occurrence of positive near coastal wind-stress curl anomalies (Figure 6A) has played a predominant role in warming the region by favoring a reduction of local upwelling. Also, in the Angola Benguela front region, the downwelling anomalies in combination with the reduction of the latent heat loss from the ocean to the atmosphere (Figure 5A) due to weakened alongshore winds (Figure 4A) have generated locally positive SST anomalies. Similar local processes have been identified among the triggering mechanisms of the 2016 warm event off Angola described by Lübbecke et al. (2019). On the other hand, the westerly wind anomalies observed in the western or central equatorial Atlantic (Figure 7C and Supplementary Figure 2A) have triggered downwelling EKWs during the present extreme warm event in October 2019, but with a weak signal in SLA in contrast to classical Benguela Niños (e.g., 2001 or 2010/2011, referred to in Rouault et al., 2007, 2018). Furthermore, three downwelling CTWs with SLA of more than 10 cm propagated along the West African coast (Figure 8B). They were potentially generated by the superposition of downwelling EKWs forced by westerly wind anomalies in October 2019 along the equator (Supplementary Figure 2A). The occurrence of these equatorial wind anomalies agrees with the results of Hu and Huang (2007) who showed from reanalysis data that locally forced warming over the Angola Benguela upwelling region is likely to generate westerly wind anomalies along the equatorial Atlantic 1 to 2 months later. This connection was also emphasized in a recent model study by Illig et al. (2020) on the timing of warm events off Angola and in the eastern equatorial Atlantic. For the 2019 extreme warm event, our results are consistent with the ones of Hu and Huang (2007) as the locally induced warming observed in September 2019 (Figure 3C) might have triggered westerly wind anomalies in October 2019 along the equator contributing to the generation of the Benguela Niño peaking in November 2019. This highlights that the two forcing mechanisms leading to the 2019 Benguela Niño are not independent.
In November 2019, strong positive temperature anomalies are observed along the equator (Figure 9D), consistent with the presence of westerly wind anomalies in October 2019 favoring the generation of a downwelling EKW (Figure 7C) which will anomalously deepen the equatorial thermocline (Supplementary Figure 3). Concomitantly, northerly wind anomalies (weakening of southerly winds) prevail east of 20°W from mid-October 2019 to mid-February 2020 (Figure 10 and Supplementary Figure 2B). A previous study of Philander and Pacanowski (1981) showed that in the eastern equatorial Atlantic, the weakening of the meridional wind could contribute to generate warm SST as both parameters are correlated. This highlights the importance of the meridional wind fluctuations at the eastern boundary (Figure 10) during the 2019 Benguela Niño.
CTWs are clearly visible with a strong signal in SLA (>10 cm, Figure 8B) at the end of October 2019, and about 2 weeks later strong positive SST anomalies (>2°C, Figure 11B) are recorded in the Angola Benguela upwelling system. This lag of ∼ 14 days nicely corresponds to the timescale of the thermocline feedback recently described in Imbol Koungue and Brandt (2021) at intraseasonal timescales off Southern Angola and found in the eastern equatorial Pacific (Zelle et al., 2004; Zhu et al., 2015).
Moreover, coastal northerly wind anomalies between 5°S and 12°S (∼−2 m/s) might be an additional local forcing of downwelling CTWs in December 2019 and January 2020 (not shown). This result is consistent with the one from the modeling study of Bachèlery et al. (2016a) which used a couple of sensitivity experiments to quantify the role of the local versus remote forcing in the southeastern tropical Atlantic. Their results suggested that at subseasonal timescales (<100 days), the coastal oceanic variability (currents, thermocline, and sea level) is mainly driven by local forcing.
During the peak of the event in November 2019, damping of positive SST anomalies by the latent heat flux is observed mostly in the Angola Benguela front region. Note that the latent heat flux has a major contribution in the net heat flux in the southeast Atlantic Ocean. The strong latent heat loss is mainly explained by qw (equation 2) which is higher than qa and meaning that the sea surface is warmer than the air above, due to strong sea surface temperature anomalies. Our findings agree with the ones of Florenchie et al. (2004) who showed using reanalysis data and model outputs, that local net heat flux act mainly through latent heat flux anomalies as a thermostat to regulate cold and warm SST. Figure 2 shows that since 2000, there are no extreme cold events identified along the Southwest African coast, and only three extreme warm events occurring at intervals of ∼ 9 to 10 years. This agrees with a recent study of Prigent et al. (2020b) that showed a reduction of the interannual SST variability in the Angola Benguela region by more than 30% in the post 2000 period compared to 1982–1999. They found that the remote equatorial forcing decreased after 2000, resulting in less Benguela Niño/Niña events.
In contrast to the 2016 warm event off Angola described in Lübbecke et al. (2019), the stratification caused by freshwater inputs (precipitation and river runoffs) has not played a role during the development of the 2019 Benguela Niño. Weak salinity anomalies south of 10°S (Supplementary Figure 5) were recorded along the Southwest coast of Africa mainly due to the absence of precipitation. However, positive precipitation anomalies were observed north of 10°S in October 2019 (Supplementary Figure 4C) during the 2019 Benguela Niño whereas anomalies of latent heat flux and net heat flux show opposite sign (Figures 5B,E) indicating that another term in the heat budget contributes more than the latent heat flux. Indeed, Figure 5B shows positive anomalies of latent heat flux (less heat loss from the ocean to the atmosphere) but Figure 5E displays negative anomalies of net heat flux (ocean loses heat). That is related to less shortwave radiation reaching the ocean surface due to more cloud cover (not shown) and causing a cooling (Figure 3D). This indicates that SST anomalies in this region could also respond to cloud cover (e.g., Xie and Carton, 2004). Our result agrees with the recent results from Nnamchi et al. (2021) which showed that the precipitation which is a good proxy for the diabatic heating, leads SST variability in the equatorial Atlantic. This means that the atmosphere forces the ocean, even though the region north of 10°S is dominated by ocean dynamics.
Off Southern Angola, the occurrence of positive anomalies of near-coastal wind-stress curl (downwelling anomalies) and the weakening of alongshore winds in the Angola Benguela front region, lead to a reduction of local upwelling which agrees with reduced NPP. Note that the NPP is not necessarily only fuelled by the strength of the vertical exchange, i.e., vertical mixing and upwelling (indicated here by the SST anomaly), but also by the lateral input of nutrients with the Congo River discharge and the spreading of the river plume. Therefore, it seems not straight forward to connect the positive SST anomaly to negative NPP anomalies due to the existing strong interannual variability and also due to the influence of the Congo River. Yet, at interannual timescales, there is to our knowledge no study that established the connection between SST and NPP along the eastern boundary.
Data Availability Statement
The original contributions presented in the study are included in the article/Supplementary Material, further inquiries can be directed to the corresponding author.
Author Contributions
RAIK designed the study, analyzed the data, and drafted the manuscript. All authors contributed to the writing of the manuscript.
Funding
Financial support was provided by funding from the EU H2020 under grant agreement 817578 TRIATLAS project. This study was further supported by the German Federal Ministry of Education and Research as part of the SACUS II (03F0751A) and BANINO (03F0795A) projects and Deutsche Forschungsgemeinschaft through several research cruises with RV Maria S. Merian, RV Meteor, and RV Sonne.
Conflict of Interest
The authors declare that the research was conducted in the absence of any commercial or financial relationships that could be construed as a potential conflict of interest.
Publisher’s Note
All claims expressed in this article are solely those of the authors and do not necessarily represent those of their affiliated organizations, or those of the publisher, the editors and the reviewers. Any product that may be evaluated in this article, or claim that may be made by its manufacturer, is not guaranteed or endorsed by the publisher.
Acknowledgments
We would like to acknowledge the efforts made by the PIRATA project for making the mooring data freely available. We thank the captains, crews, scientists, and technicians involved in several research cruises in the tropical Atlantic who contributed to collecting data used in this study. RAIK would like to thank Arielle Stela N. Imbol Nkwinkwa for the insightful discussion and the latent heat flux analysis.
Supplementary Material
The Supplementary Material for this article can be found online at: https://www.frontiersin.org/articles/10.3389/fmars.2021.800103/full#supplementary-material
Footnotes
- ^ http://marine.copernicus.eu/
- ^ https://www.esrl.noaa.gov/psd/data/gridded/
- ^ https://www.aoml.noaa.gov/phod/epirata/
- ^ http://sites.science.oregonstate.edu/ocean.productivity/index.php
References
Bachèlery, M. L., Illig, S., and Dadou, I. (2016a). Interannual variability in the South-East Atlantic Ocean, focusing on the Benguela Upwelling System: remote versus local forcing. Geophys. Res. Lett. Oceans 121, 284–310. doi: 10.1002/2015JC011168
Bachèlery, M.-L., Illig, S., and Dadou, I. (2016b). Forcings of nutrient, oxygen, and primary production interannual variability in the southeast Atlantic Ocean. Geophys. Res. Lett. 43, 8617–8625. doi: 10.1002/2016GL070288
Bachèlery, M. L., Illig, S., and Rouault, M. (2020). Interannual coastal trapped waves in the Angola-Benguela upwelling system and Benguela Niño and Niña events. J. Mar. Syst. 203:103262. doi: 10.1016/j.jmarsys.2019.103262
Blamey, L. K., Shannon, L. J., Bolton, J. J., Crawford, R. J. M., Dufois, F., Evers-King, H., et al. (2015). Ecosystem change in the southern Benguela and the underlying processes. J. Mar. Syst. 144, 9–29. doi: 10.1016/j.jmarsys.2014.11.006
Bourles, B., Araujo, M., McPhaden, M. J., Brandt, P., Foltz, G. R., Lumpkin, R., et al. (2019). PIRATA: a sustained observing system for tropical Atlantic climate research and forecasting. Earth Space Sci. 6, 577–616. doi: 10.1029/2018EA000428
Bourlès, B., Lumpkin, R., McPhaden, M. J., Hernandez, F., Nobre, P., Campos, E., et al. (2008). The pirata program. Bull. Am. Meteorol. Soc. 89, 1111–1126. doi: 10.1175/2008BAMS2462.1
Boutin, J., Vergely, J.-L., Reul, N., Catany, R., Koehler, J., Martin, A., et al. (2021). ESA Sea Surface Salinity Climate Change Initiative (Sea_Surface_Salinity_cci): Weekly Sea Surface Salinity Product, v03.21, for 2010 to 2020. NERC EDS Centre for Environmental Data Analysis. Available online at: https://catalogue.ceda.ac.uk/uuid/fad2e982a59d44788eda09e3c67ed7d5 (accessed October 08, 2021).
Boyer, D. C., Boyer, H. J., Fossen, I., and Kreiner, A. (2001). Changes in abundance of the northern Benguela sardine stock during the decade 1990–2000, with comments on the relative importance of fishing and the environment. Afr. J. Mar. Sci. 23, 67–84. doi: 10.2989/025776101784528854
Chavez, F. P., and Messié, M. (2009). A comparison of eastern boundary upwelling ecosystems. Prog. Oceanogr. 83, 80–96. doi: 10.1016/j.pocean.2009.07.032
Chenillat, F., Illig, S., Jouanno, J., Awo, F. M., Alory, G., and Brehmer, P. (2021). How do climate modes shape the chlorophyll-a interannual variability in the tropical Atlantic? Geophys. Res. Lett. 48:e2021GL093769. doi: 10.1029/2021GL093769
Florenchie, P., Lutjeharms, J. R. E., Reason, C. J. C., Masson, S., and Rouault, M. (2003). The source of Benguela Niños in the South Atlantic Ocean. Geophys. Res. Lett. 30:1505. doi: 10.1029/2003GL017172
Florenchie, P., Reason, C. J. C., Lutjeharms, J. R. E., Rouault, M., Roy, C., and Masson, S. (2004). Evolution of interannual warm and cold events in the southeast Atlantic Ocean. J. Clim. 17, 2318–2334. doi: 10.1175/1520-0442(2004)017<2318:eoiwac>2.0.co;2
Foltz, G. R., Schmid, C., and Lumpkin, R. (2018). An enhanced PIRATA data set for tropical Atlantic Ocean-atmosphere research. J. Clim. 31, 1499–1524. doi: 10.1175/JCLI-D-16-0816.1
Gammelsrød, T., Bartholomae, C. H., Boyer, D. C., Filipe, V. L. L., and O’Toole, M. J. (1998). Intrusion of warm surface water along the Angolan-Namibian coast in February–March 1995: the 1995 Benguela Niño. South Afr. J. Mar. Sci. 19, 41–56. doi: 10.2989/025776198784126719
Guo, Y., Li, Y., Wang, F., Wei, Y., and Rong, Z. (2020). Processes controlling sea surface temperature variability of Ningaloo Niño. J. Clim. 33, 4369–4389.
Hansingo, K., and Reason, C. J. C. (2009). Modelling the atmospheric response over southern Africa to SST forcing in the southeast tropical Atlantic and southwest subtropical Indian Oceans. Int. J. Climatol. 29, 1001–1012. doi: 10.1002/joc.1919
Hersbach, H., Bell, B., Berrisford, P., Hirahara, S., Horányi, A., Muñoz-Sabater, J., et al. (2020). The ERA5 global reanalysis. Q. J. R. Meteorol. Soc. 146, 1999–2049. doi: 10.1002/qj.3803
Hu, Z. Z., and Huang, B. (2007). Physical processes associated with the tropical Atlantic SST gradient during the anomalous evolution in the southeastern ocean. J. Clim. 20, 3366–3378. doi: 10.1175/JCLI4189.1
Illig, S., Bachèlery, M. L., and Lübbecke, J. F. (2020). Why do Benguela Niños lead Atlantic Niños? J. Geophys. Res. Oceans 125:e2019JC016003. doi: 10.1029/2019JC016003
Illig, S., and Bachèlery, M. L. (2019). Propagation of subseasonal equatorially-forced coastal trapped waves down to the Benguela upwelling system. Sci. Rep. 9:5306. doi: 10.1038/s41598-019-41847-1
Illig, S., Bachèlery, M. L., and Cadier, E. (2018). Subseasonal coastal-trapped wave propagations in the southeastern Pacific and Atlantic Oceans: 2. Wave characteristics and connection with the equatorial variability. J. Geophys. Res. Oceans 123, 3942–3961. doi: 10.1029/2017JC013540
Illig, S., Dewitte, B., Ayoub, N., Du Penhoat, Y., Reverdin, G., De Mey, P., et al. (2004). Interannual long equatorial waves in the tropical Atlantic from a high-resolution ocean general circulation model experiment in 1981–2000. J. Geophys. Res. 109:C02022. doi: 10.1029/2003JC001771
Imbol Koungue, R. A., and Brandt, P. (2021). Impact of intraseasonal waves on Angolan warm and cold events. J. Geophys. Res. Oceans 126:e2020JC017088. doi: 10.1029/2020JC017088
Imbol Koungue, R. A., Illig, S., and Rouault, M. (2017). Role of interannual Kelvin wave propagations in the equatorial Atlantic on the Angola Benguela Current system. J. Geophys. Res. Oceans 122, 4685–4703. doi: 10.1002/2016JC012463
Imbol Koungue, R. A., Rouault, M., Illig, S., Brandt, P., and Jouanno, J. (2019). Benguela Niños and Benguela Niñas in forced ocean simulation from 1958 to 2015. J. Geophys. Res. Oceans 124, 5923–5951. doi: 10.1029/2019JC015013
Imbol Nkwinkwa, N. A. S., Rouault, M., and Johannessen, J. A. (2019). Latent Heat Flux in the Agulhas Current. Remote Sens. 11:1576. doi: 10.3390/rs11131576
Jarre, A., Hutchings, L., Kirkman, S. P., Kreiner, A., Tchipalanga, P. C. M., Kainge, P., et al. (2015). Synthesis: climate effects on biodiver- sity, abundance and distribution of marine organisms in the Benguela. Fish. Oceanogr. 24, 122–149. doi: 10.1111/fog.12086
Johns, W. E., Brandt, P., Bourlès, B., Tantet, A., Papapostolou, A., and Houk, A. (2014). Zonal structure and seasonal variability of the Atlantic Equatorial Undercurrent. Clim. Dyn. 43, 3047–3069. doi: 10.1007/s00382-014-2136-2
Kopte, R., Brandt, P., Claus, M., Greatbatch, R. J., and Dengler, M. (2018). Role of equatorial basin-mode resonance for the seasonal variability of the Angola Current at 11°S. J. Phys. Oceanogr. 48, 261–281. doi: 10.1175/JPO-D-17-0111.1
Kopte, R., Brandt, P., Dengler, M., Tchipalanga, P. C. M., Macueìria, M., and Ostrowski, M. (2017). The angola current: flow and hydrographic characteristics as observed at 11°S. J. Geophys. Res. Oceans 122, 1177–1189. doi: 10.1002/2016JC012374
Koseki, S., and Imbol Koungue, R. A. (2020). Regional atmospheric response to the Benguela Niñas. Int. J. Climatol. 41, E1483–E1497. doi: 10.1002/joc.6782
Lübbecke, J., Brandt, P., Dengler, M., Kopte, R., Lüdke, J., Richter, I., et al. (2019). Causes and evolution of the southeastern tropical Atlantic warm event in early 2016. Clim. Dyn. 53, 261–274. doi: 10.1007/s00382-018-4582-8
Lübbecke, J. F., Böning, C. W., Keenlyside, N. S., and Xie, S. P. (2010). On the connection between Benguela and equatorial Atlantic Niños and the role of the South Atlantic Anticyclone. J. Geophys. Res. 115:C09015. doi: 10.1029/2009JC005964
Lutz, K., Rathmann, J., and Jacobeit, J. (2013). Classification of warm and cold water events in the eastern tropical Atlantic Ocean. Atmos. Sci. Lett. 14, 102–106. doi: 10.1002/asl2.424
Mohrholz, V., Schmidt, M., and Lutjeharms, J. R. E. (2001). The hydrography and dynamics of the Angola–Benguela frontal zone and environment in April 1999. South Afr. J. Sci. 97, 199–208.
Nagura, M., and McPhaden, M. J. (2010). Wyrtki Jet dynamics: seasonal variability. J. Geophys. Res. 115:C07009. doi: 10.1029/2009JC005922
Nnamchi, H. C., Latif, M., Keenlyside, N. S., Kjellsson, J., and Richter, I. (2021). Diabatic heating governs the seasonality of the Atlantic Niño. Nat. Commun. 12:376. doi: 10.1038/s41467-020-20452-1
Ostrowski, M., da Silva, J. C., and Bazik-Sangolay, B. (2009). The response of sound scatterers to El Niño- and La Niña-like oceanographic regimes in the southeastern Atlantic. ICES J. Mar. Sci. 66, 1063–1072. doi: 10.1093/icesjms/fsp102
Peng, Q., Xie, S., Wang, D., Kamae, Y., Zhang, H., Hu, S., et al. (2020). Eastern Pacific Wind Effect on the Evolution of El Niño: implications for ENSO Diversity. J. Clim. 33, 3197–3212.
Périgaud, C., Zebiak, S. E., Mélin, F., Boulanger, J.-P., and Dewitte, B. (1997). On the role of meridional wind anomalies in a coupled model of ENSO. J. Clim. 10, 761–773.
Philander, S. G. H., and Pacanowski, R. C. (1981). The oceanic response to cross-equatorial winds (with application to coastal upwelling in low latitudes). Tellus 33, 201–210. doi: 10.3402/tellusa.v33i2.10708
Polo, I., Lazar, A., Rodriguez-Fonseca, B., and Arnault, S. (2008). Oceanic Kelvin waves and tropical Atlantic intraseasonal variability: 1. Kelvin wave characterization. J. Geophys. Res. 113:C07009. doi: 10.1029/2007JC004495
Prigent, A., Lübbecke, J. F., Bayr, T., Latif, M., and Wengel, C. (2020a). Weakened SST variability in the tropical Atlantic Ocean since 2000. Clim. Dyn. 54, 2731–2744. doi: 10.1007/s00382-020-05138-0
Prigent, A., Koungue, I. R. A., Lübbecke, J. F., Brandt, P., and Latif, M. (2020b). Origin of weakened interannual sea surface temperature variability in the southeastern tropical Atlantic Ocean. Geophys. Res. Lett. 47:e2020GL089348. doi: 10.1029/2020GL089348
Pujol, M.-I., FaugeÌre, Y., Taburet, G., Dupuy, S., Pelloquin, C., Ablain, M., et al. (2016). DUACS DT2014: the new multi-mission altimeter data set reprocessed over 20 years. Ocean Sci. 12, 1067–1090. doi: 10.5194/os-12-1067-2016
Reason, C. J. C., Florenchie, P., Rouault, M., and Veitch, J. (2006). 10 Influences of large scale climate modes and Agulhas system variability on the BCLME region. Large Mar. Ecosyst. 14, 223–238. doi: 10.1016/s1570-0461(06)80015-7
Reynolds, R. W., Smith, T. M., Liu, C., Chelton, D. B., Casey, K. S., and Schlax, M. G. (2007). Daily high-resolution-blended analyses for sea surface temperature. J. Clim. 20, 5473–5496. doi: 10.1175/2007JCLI1824.1
Richter, I., Behera, S. K., Masumoto, Y., Taguchi, B., Komori, N., and Yamagata, T. (2010). On the triggering of Benguela Niños: remote equatorial versus local influences. Geophys. Res. Lett. 37:L20604. doi: 10.1029/2010GL0444461
Roch, M., Brandt, P., Schmidtko, S., Vaz Velho, F., and Ostrowski, M. (2021). Southeast tropical Atlantic changing from subtropical to tropical conditions. Front. Mar. Sci. 8:748383. doi: 10.3389/fmars.2021.748383
Rouault, M. (2012). Bi-annual intrusion of tropical water in the northern Benguela upwelling. Geophys. Res. Lett. 39:L12606. doi: 10.1029/2012GL052099
Rouault, M., Florenchie, P., Fauchereau, N., and Reason, C. J. C. (2003). South East tropical Atlantic warm events and southern African rainfall Geophys. Res. Lett. 30:8009. doi: 10.1029/2003GL014840
Rouault, M., Illig, S., Bartholomae, C., Reason, C. J. C., and Bentamy, A. (2007). Propagation and origin of warm anomalies in the Angola Benguela upwelling system in 2001. J. Mar. Syst. 68, 473–488. doi: 10.1016/j.jmarsys.2006.11.010
Rouault, M., Illig, S., Lübbecke, J., and Koungue, R. A. I. (2018). Origin, development and demise of the 2010–2011 Benguela Niño. J. Mar. Syst. 188, 39–48. doi: 10.1016/j.jmarsys.2017.07.007
Rouault, M., Servain, J., Reason, C. J. C., BourleÌs, B., Rouault, M. J., and Fauchereau, N. (2009). Extension of PIRATA in the tropical South-East Atlantic: an initial one-year experiment. Afr. J. Mar. Sci. 31, 63–71. doi: 10.2989/AJMS.2009.31.1.5.776
Servain, J., Busalacchi, A. J., McPhaden, M. J., Moura, A. D., Reverdin, G., Vianna, M., et al. (1998). A pilot research moored array in the tropical Atlantic (PIRATA). Bull. Am. Meteorol. Soc. 79, 2019–2031.
Shannon, L. V., Boyd, A. J., Brundrit, G. B., and Taunton-Clark, J. (1986). On the existence of an El Niño-type phenomenon in the Benguela system. J. Mar. Res. 44, 495–520. doi: 10.1357/002224086788403105
Silva, P., Wainer, I., and Khodri, M. (2021). Changes in the equatorial mode of the Tropical Atlantic in terms of the Bjerknes Feedback Index. Clim. Dyn. 56, 3005–3024. doi: 10.1007/s00382-021-05627-w
Suarez, M. J., and Schopf, P. S. (1988). A delayed action oscillator for ENSO. J. Atmos. Sci. 45, 3283–3287.
Tchipalanga, P., Dengler, M., Brandt, P., Kopte, R., Macueìria, M., Coelho, P., et al. (2018). Eastern boundary circulation and hydrography off Angola–building Angolan oceanographic capacities. Bull. Am. Meteorol. Soc. 99, 1589–1605. doi: 10.1175/BAMS-D-17-0197.1
Veitch, J. A., Florenchie, P., and Shillington, F. A. (2006). Seasonal and interannual fluctuations of the Angola–Benguela Frontal Zone (ABFZ) using 4.5 km resolution satellite imagery from 1982 to 1999. Int. J. Remote Sens. 27, 987–998. doi: 10.1080/01431160500127914
Xie, S. (1998). Ocean–atmosphere interaction in the making of the walker circulation and equatorial cold tongue. J. Clim. 11, 189–201.
Xie, S.-P., and Carton, J. A. (2004). “Tropical atlantic variability: patterns, mechanisms, and impacts,” in Earth’s Climate, eds C. Wang, S. Xie, and J. Carton (Washington, DC: AGU), doi: 10.1029/147GM07
Zelle, H., Appeldoorn, G., Burgers, G., and van Oldenborgh, G. J. (2004). The relationship between sea surface temperature and thermocline depth in the eastern equatorial Pacific. J. Phys. Oceanogr. 34, 643–655. doi: 10.1175/2523.1
Zeng, Z., Brandt, P., Lamb, K. G., Greatbatch, R. J., Dengler, M., Claus, M., et al. (2021). Three dimensional numerical simula- tions of internal tides in the Angolan upwelling region. J. Geophys. Res. Oceans 126:e2020JC016460. doi: 10.1029/2020JC016460
Zhang, L., Han, W. Q., Li, Y. L., and Shinoda, T. (2018). Mechanisms for Generation and Development of the Ningaloo Nino. J. Clim. 31, 9239–9259. doi: 10.1175/Jcli-D-18-0175.1
Keywords: Benguela Niños, interannual variability, local atmospheric forcing, equatorial and coastally trapped waves, Angola Current
Citation: Imbol Koungue RA, Brandt P, Lübbecke J, Prigent A, Martins MS and Rodrigues RR (2021) The 2019 Benguela Niño. Front. Mar. Sci. 8:800103. doi: 10.3389/fmars.2021.800103
Received: 22 October 2021; Accepted: 01 December 2021;
Published: 24 December 2021.
Edited by:
Zhiyu Liu, Xiamen University, ChinaReviewed by:
Yuanlong Li, Institute of Oceanology, Chinese Academy of Sciences (CAS), ChinaJin-Yi YU, University of California, Irvine, United States
Copyright © 2021 Imbol Koungue, Brandt, Lübbecke, Prigent, Martins and Rodrigues. This is an open-access article distributed under the terms of the Creative Commons Attribution License (CC BY). The use, distribution or reproduction in other forums is permitted, provided the original author(s) and the copyright owner(s) are credited and that the original publication in this journal is cited, in accordance with accepted academic practice. No use, distribution or reproduction is permitted which does not comply with these terms.
*Correspondence: Rodrigue Anicet Imbol Koungue, rodrigueanicet@gmail.com