Trophic Structure and Sources of Variation Influencing the Stable Isotope Signatures of Meso- and Bathypelagic Micronekton Fishes
 Travis M. Richards
 Tracey T. Sutton
 R. J. David Wells
- 1Department of Marine Biology, Texas A&M University at Galveston, Galveston, TX, United States
- 2Halmos College of Natural Sciences and Oceanography, Nova Southeastern University, Dania Beach, FL, United States
- 3Department of Wildlife and Fisheries Sciences, Texas A&M University, College Station, TX, United States
To better understand spatiotemporal variation in the trophic structure of deep-pelagic species, we examined the isotope values of particulate organic matter (POM) (isotopic baseline) and seven deep-pelagic fishes with similar diet compositions but contrasting vertical distributions across mesoscale features in the Gulf of Mexico using stable isotope and amino acid compound-specific isotope analyses. Species examined included four migratory (Benthosema suborbitale, Lepidophanes guentheri, Melamphaes simus, Sigmops elongatus) and three non-migratory zooplanktivorous fishes (Argyropelecus hemigymnus, Cyclothone obscura, Sternoptyx pseudobscura). Isotopic values of POM increased with depth, with meso- and bathypelagic samples characterized by higher δ13C and δ15N values relative to epipelagic samples. Despite similar diet compositions, mean δ15N values of fishes spanned 3.43‰ resulting in mean trophic position estimates among species varying by 1.09 trophic levels. Interspecific differences in δ15N were driven by higher δ15N values in the non-migratory and deepest dwelling C. obscura (10.61‰) and lower δ15N values in the migratory and shallowest dwelling L. guentheri (7.18‰) and B. suborbitale (8.11‰). Similarly, fish δ15NsourceAA values were correlated with depth, with the lowest values occurring in the migratory L. guentheri and B. suborbitale and highest values occurring in the non-migratory C. obscura. Our data suggest that depth-related trends in fish δ15N and δ15NsourceAA values are driven by shallower dwelling species feeding within epipelagic food webs supported by POM with lower δ15N values, while deeper dwelling, non-migratory species increasingly use food webs at depth supported by POM with elevated δ15N values. Horizontal isotopic variation was observed across a large mesoscale oceanographic feature (Loop Current), with POM, three migratory, and one non-migratory species characterized by higher δ13C and lower δ15N values in the anticyclonic Loop Current relative to surrounding water masses. Our results demonstrate that isotopic values of POM can vary significantly over relatively small horizontal and vertical scales and that baseline variation can be conserved in the signatures of higher-order consumers. By gaining a more thorough understanding of the sources contributing to isotopic variation of deep-pelagic fishes, this paper will inform the design and interpretation of future feeding studies in the pelagic realm and advances our knowledge of deep-pelagic food web structure.
Introduction
The deep-pelagic ocean provides a suite of ecosystem services, including carbon sequestration, nutrient regeneration, and waste absorption, which are vital to ocean health (Mengerink et al., 2014; Thurber et al., 2014). Although its importance is well established, the deep pelagic is chronically understudied, with knowledge of ecosystem function lagging behind coastal and shelf systems (Webb et al., 2010). Currently, natural resource extraction and fisheries are expanding into the deep ocean before management strategies can be developed, resulting in a concerted effort to characterize deep-pelagic ecosystems so that the effects of anthropogenic activities can be assessed (Ramirez-Llodra et al., 2011; Mengerink et al., 2014; Murawski et al., 2020). In particular, recent research has centered on understanding deep-pelagic food webs, as trophic interactions regulate animal populations (especially in ecosystems with no physical refuge), determine energy pathways, and influence the resilience of communities to perturbation (Winemiller and Polis, 1996; Chipps and Garvey, 2007).
A thorough understanding of deep-pelagic food webs necessitates detailed trophic information of micronekton, small (2–10 cm) swimming fishes, crustaceans, and cephalopods that represent a dominant proportion of the global nekton biomass (Irigoien et al., 2014; Vereshchaka et al., 2019). Ubiquitous throughout the world’s oceans, micronekton play important roles in ecological and biogeochemical processes that underpin ecosystem services including carbon sequestration and fisheries production (Angel, 1989; Longhurst et al., 1990). Many micronekton undergo diel vertical migrations (DVM) through the water column to feed within the epipelagic zone (0–200 m) at night before returning to daytime depths in the meso- (200–1,000 m) or bathypelagic zones (1,000–4,000 m). Through DVM, micronekton represent an important source of connectivity between the epi-, meso-, and bathypelagic zones and have been shown to be important prey of consumers throughout the water column (Sutton and Hopkins, 1996; Moteki et al., 2001; Choy et al., 2013). Additionally, by feeding heavily on zooplankton, micronekton link higher-order consumers with primary and secondary production (Hopkins and Gartner, 1992; Hopkins et al., 1996). Considering their high global abundance and importance to pelagic food webs, describing micronekton trophic structure is critical to increasing our understanding of deep-pelagic ecosystem structure and function.
Stable isotope analysis (SIA) is a tool commonly used to describe trophic structure in pelagic systems (Peterson and Fry, 1987; Vander Zanden and Rasmussen, 2001). Stable isotopes of carbon undergo small levels of fractionation during trophic transfer and can be used to delineate energy pathways from primary producers to consumers (DeNiro and Epstein, 1978; Wada et al., 1991). Nitrogen stable isotopes undergo larger levels of fractionation during trophic transfer and can be used to make estimations of trophic position and food chain length (Minagawa and Wada, 1984; Post, 2002). While the utility of SIA in ecology is well established, correct interpretation of SIA data is difficult, as numerous sources of variation unrelated to an organism’s diet can contribute to the isotopic signatures of consumers (Boecklen et al., 2011). For instance, because a consumer’s isotopic signature is determined by both its trophic position and the isotope value of basal carbon sources, high isotopic variability in primary producers over fine spatiotemporal scales can result in isotopic variation in consumers not reflective of a change in trophic status (Popp et al., 2007). Traditionally, variation at the base of the food web has been accounted for via comprehensive sampling of primary producers, which can be logistically challenging in pelagic systems. Amino acid compound-specific isotope analysis (AA-CSIA) allows for changes in trophic status to be distinguished from isotopic variation at the base of the food web (Popp et al., 2007; Bradley et al., 2015). The method uses two groups of individual amino acids that undergo differing levels of 15N enrichment during trophic transfer. “Source” amino acids undergo minimal 15N enrichment with each trophic step (<1‰) (e.g., phenylalanine, serine, glycine, lysine, tyrosine) and have been shown to accurately reflect the δ15N values of primary producers at the base of food webs (McClelland and Montoya, 2002; Popp et al., 2007; Chikaraishi et al., 2009). Comparatively, “trophic” amino acids (e.g., alanine, aspartic acid, glutamic acid, isoleucine, proline, valine) undergo larger, predictable levels of 15N enrichment and can be used to estimate trophic position (McClelland and Montoya, 2002; Chikaraishi et al., 2009). Because AA-CSIA incorporates both baseline and trophic information within a single sample, trophic position estimates can be made without having to characterize the isotopic values of primary producers (Popp et al., 2007; Bradley et al., 2015).
Delineations of energy pathways and trophic position estimations are critical to understanding deep-pelagic food webs and are uncommon for the Gulf of Mexico (GOM) and many pelagic systems (McClain-Counts et al., 2017; Richards et al., 2018). However, for SIA data to be interpreted correctly, a thorough understanding of how biological and environmental sources of variation affect isotope values of consumers is needed. Using SIA and AA-CSIA, we examined the isotope values of particulate organic matter (POM) and seven deep-pelagic fishes with similar diet compositions but contrasting vertical distributions over two sampling years and across a large mesoscale feature in the GOM. By selecting species with similar diet compositions and contrasting depth distributions, we aimed to highlight isotopic variation related to spatial and temporal factors while keeping variation related to diet at a minimum. The species selected included four vertical migrators (Myctophiformes: Benthosema suborbitale, Lepidophanes guentheri; Beryciformes: Melamphaes simus; Stomiiformes: Sigmops elongatus) and three non-migratory species (Stomiiformes: Argyropelecus hemigymnus, Cyclothone obscura, Sternoptyx pseudobscura). Vertically migrating species exhibited daytime depth distributions ranging from the upper mesopelagic zone (B. suborbitale) to the lower meso- and upper bathypelagic zones (M. simus) and nighttime distributions concentrated within the epi- and upper mesopelagic zones (Figure 1 and Table 1). Non-migratory species exhibited contrasting depth distributions ranging from the upper mesopelagic zone (A. hemigymnus) to the bathypelagic zone (C. obscura) (Figure 1 and Table 1). All species are zooplanktivorous and feed primarily on copepods (B. suborbitale, C. obscura, M. simus), a mixture of copepods and small euphausiids (L. guentheri, S. elongatus), copepods and ostracods (A. hemigymnus), and copepods and polychaetes (S. pseudobscura) (Hopkins and Baird, 1985; Hopkins and Gartner, 1992; Hopkins et al., 1996; Burghart et al., 2010).
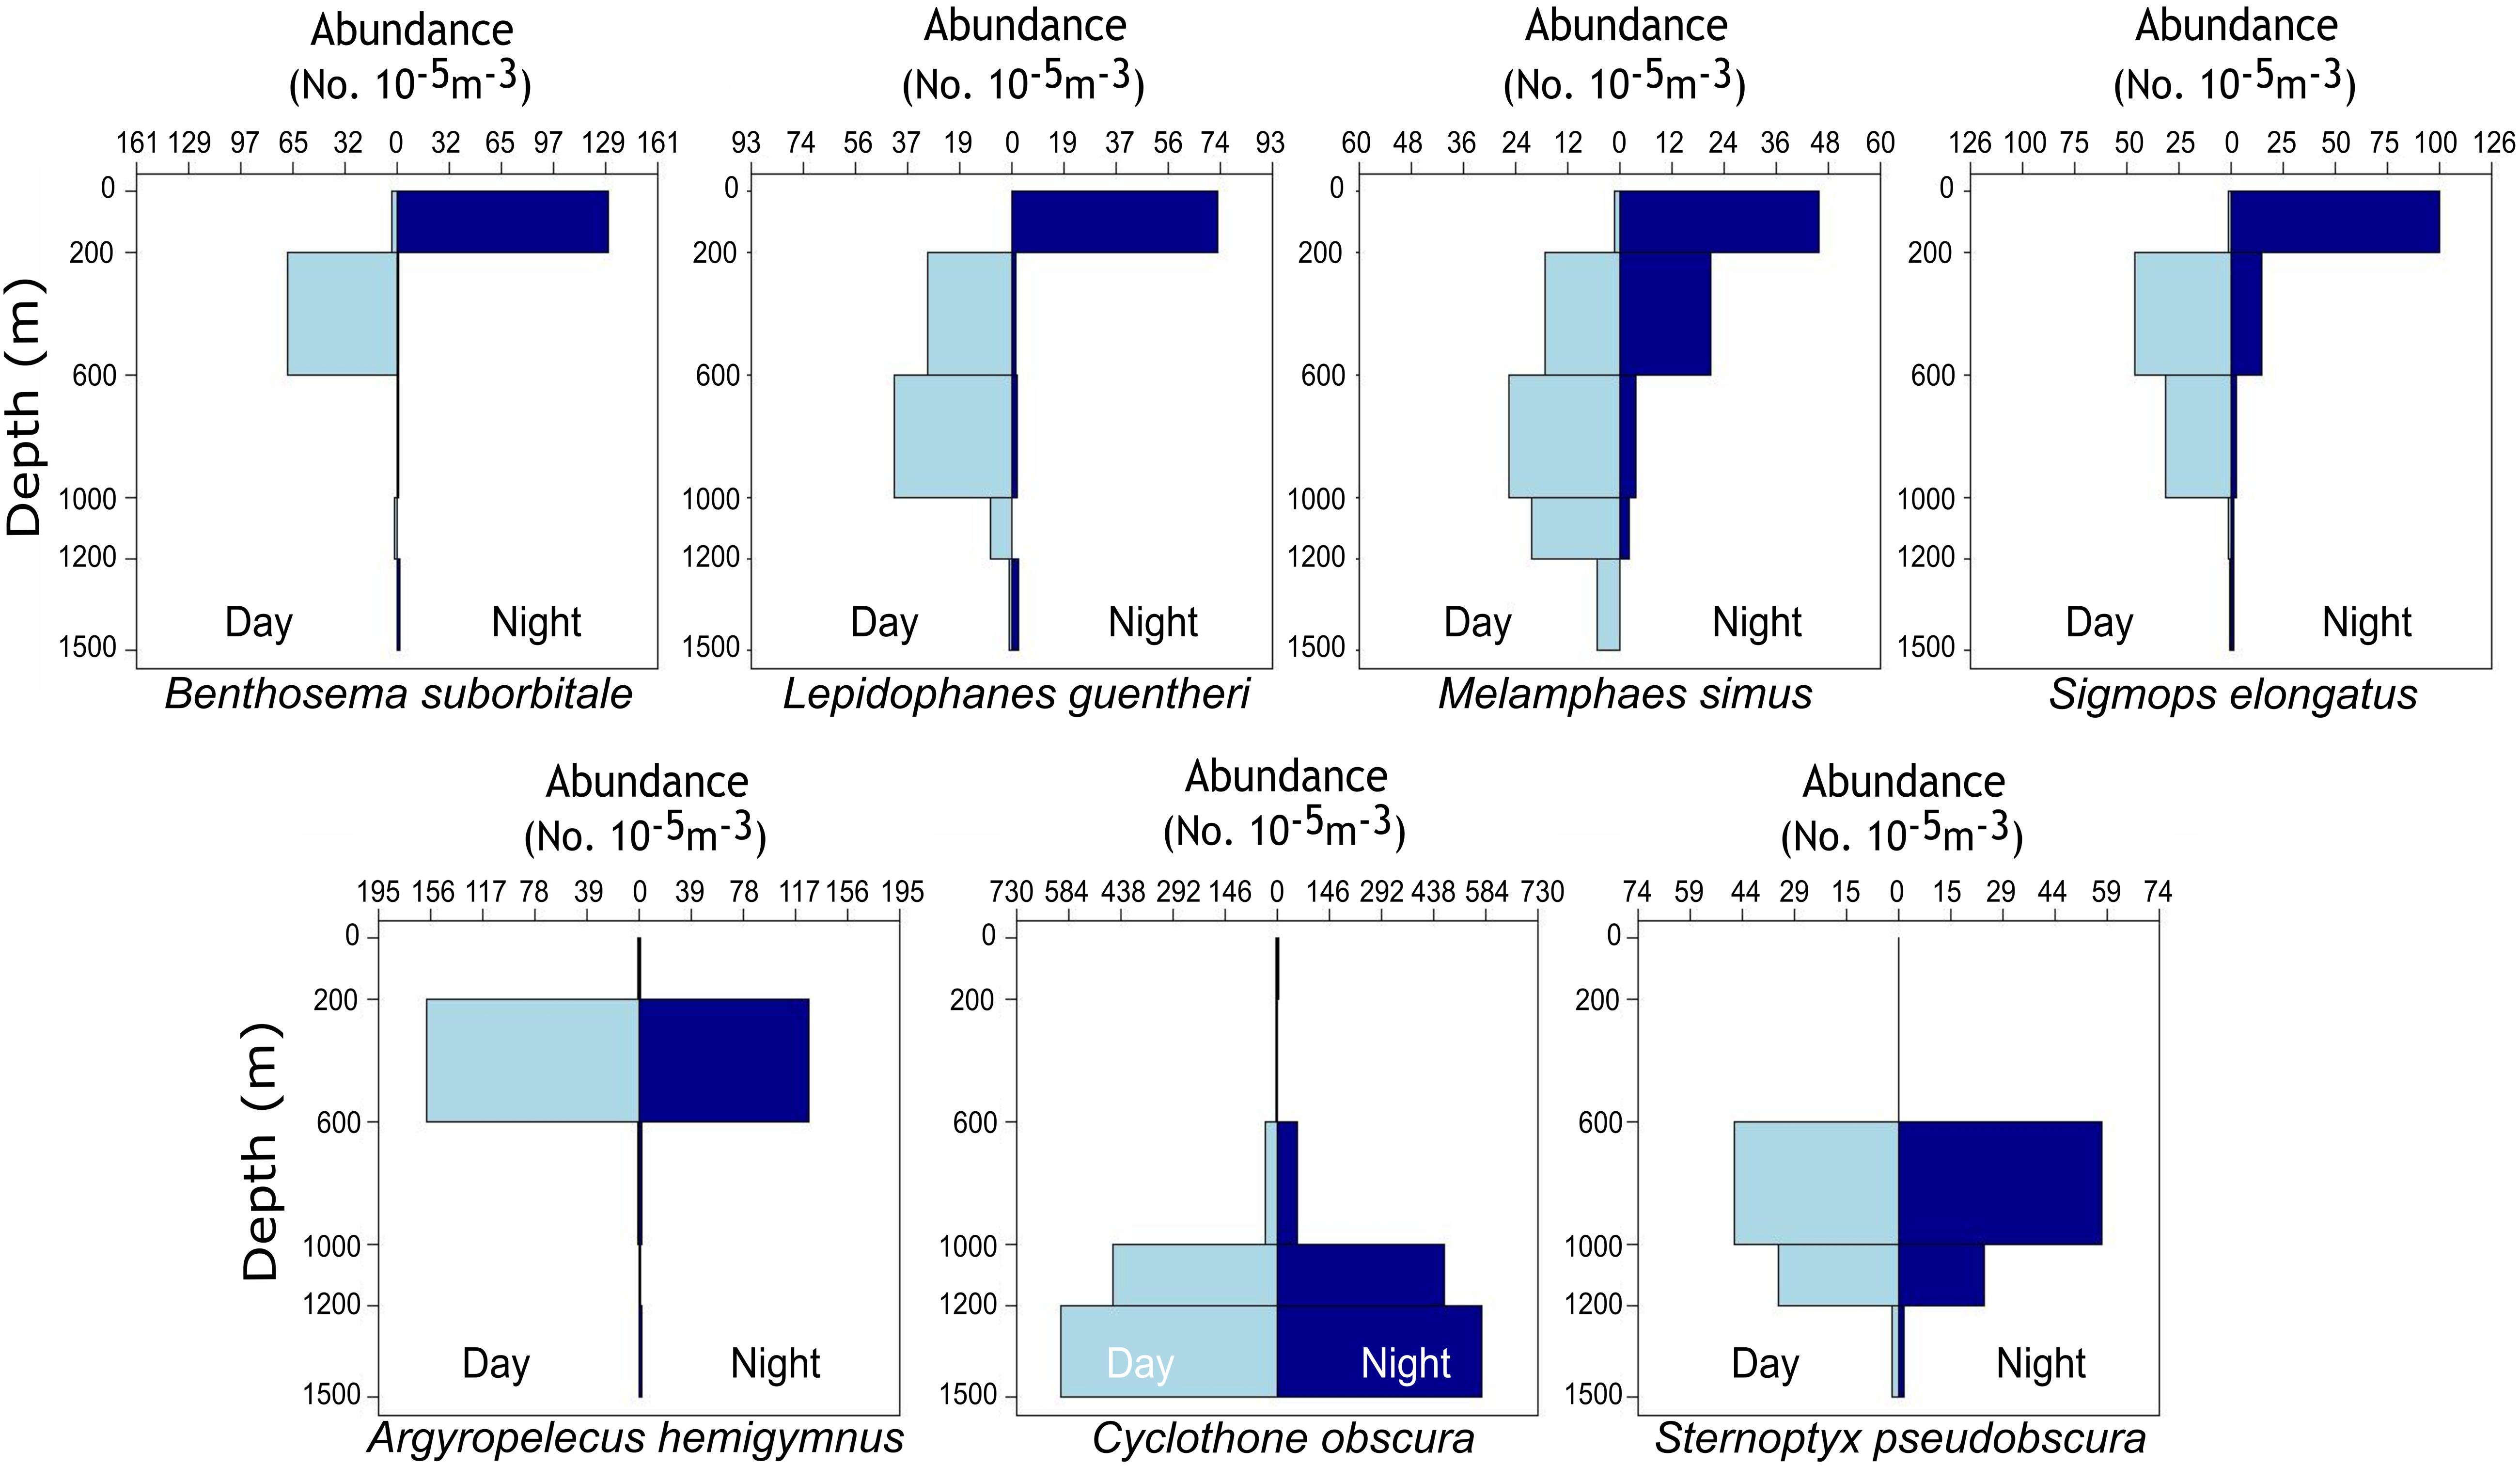
Figure 1. Vertical bar plots representing the standardized abundance of migratory (top row) and non-migratory (bottom row) species collected with day and night MOCNESS tows from 2015 to 2016. Plots represent catch data for each species combined across four oceanographic cruises and not data solely from individuals used for stable isotope analysis. Abundances were standardized by the volume of water filtered during MOCNESS tows as described in Cook et al. (unpublished data).
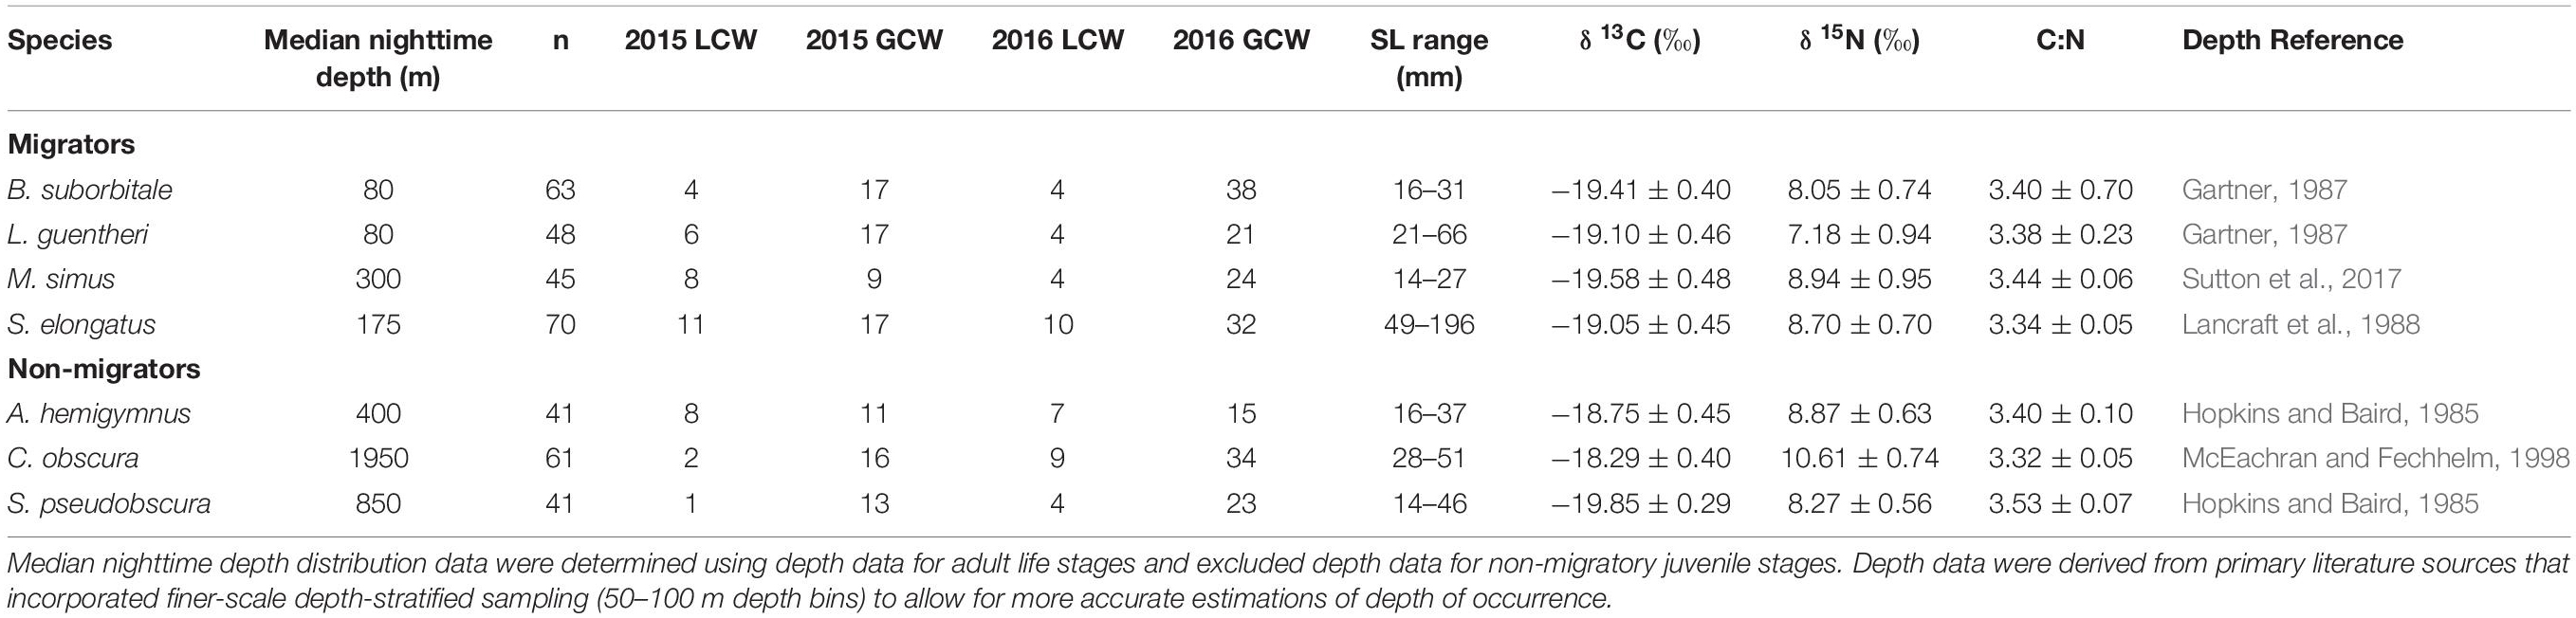
Table 1. Summary table depicting sample totals of deep-pelagic fishes for each sampling year and each water type (LCW, Loop Current Water; GCW, Gulf Common Water) and mean (± SD) δ13C, δ15N, and C:N values for each species.
Using these seven species of micronekton as model taxa, we ask the following questions: Does depth of occurrence and vertical migration type affect the stable isotope values of micronekton with similar diet compositions? Are differences among species driven by differences in diet or by variation at the base of the food web? Finally, how spatially (horizontal and vertical) variable are the isotopic values of primary producers and deep-pelagic micronekton in the GOM?
Materials and Methods
Study Design and Sample Collection
Sample collections for this study took place during four oceanographic cruises in 2015–2016, with cruises conducted in May (spring) and August (summer) of each year. While sampling stations for each cruise fell within the same geographic area, the stations visited varied due to the changing position of the Loop Current (Figure 2). Circulation in the eastern GOM is dominated by the anticyclonic Loop Current, which brings warm, oligotrophic water northward into the GOM before deflecting eastward and then exiting through the Florida Straits. Northward extension into the GOM by the Loop Current is highly variable and introduces significant spatial heterogeneity to the pelagic GOM (Vukovich and Crissman, 1986; Davis et al., 2002). Previous studies have shown that currents associated with the Loop Current and mesoscale eddies can act to concentrate primary and secondary production and in turn can alter the spatial distribution of higher-order consumers such as tunas, billfishes, and marine mammals (Davis et al., 2002; Rooker et al., 2013). In order to examine the influence of the Loop Current on deep-pelagic trophic structure, sampling sites were classified as either falling within Loop Current water (LCW) or within the surrounding water mass, hereafter referred to as Gulf common water (GCW), following designations described by Johnston et al. (2019). In addition to LCW and GCW sites, Johnston et al. (2019) identified sampling sites along the fronts between the Loop Current and Gulf common water that exhibited characteristics intermediate to the two water masses. These sites, classified as “mixed” by Johnston et al. (2019), did not yield SIA samples for this study.
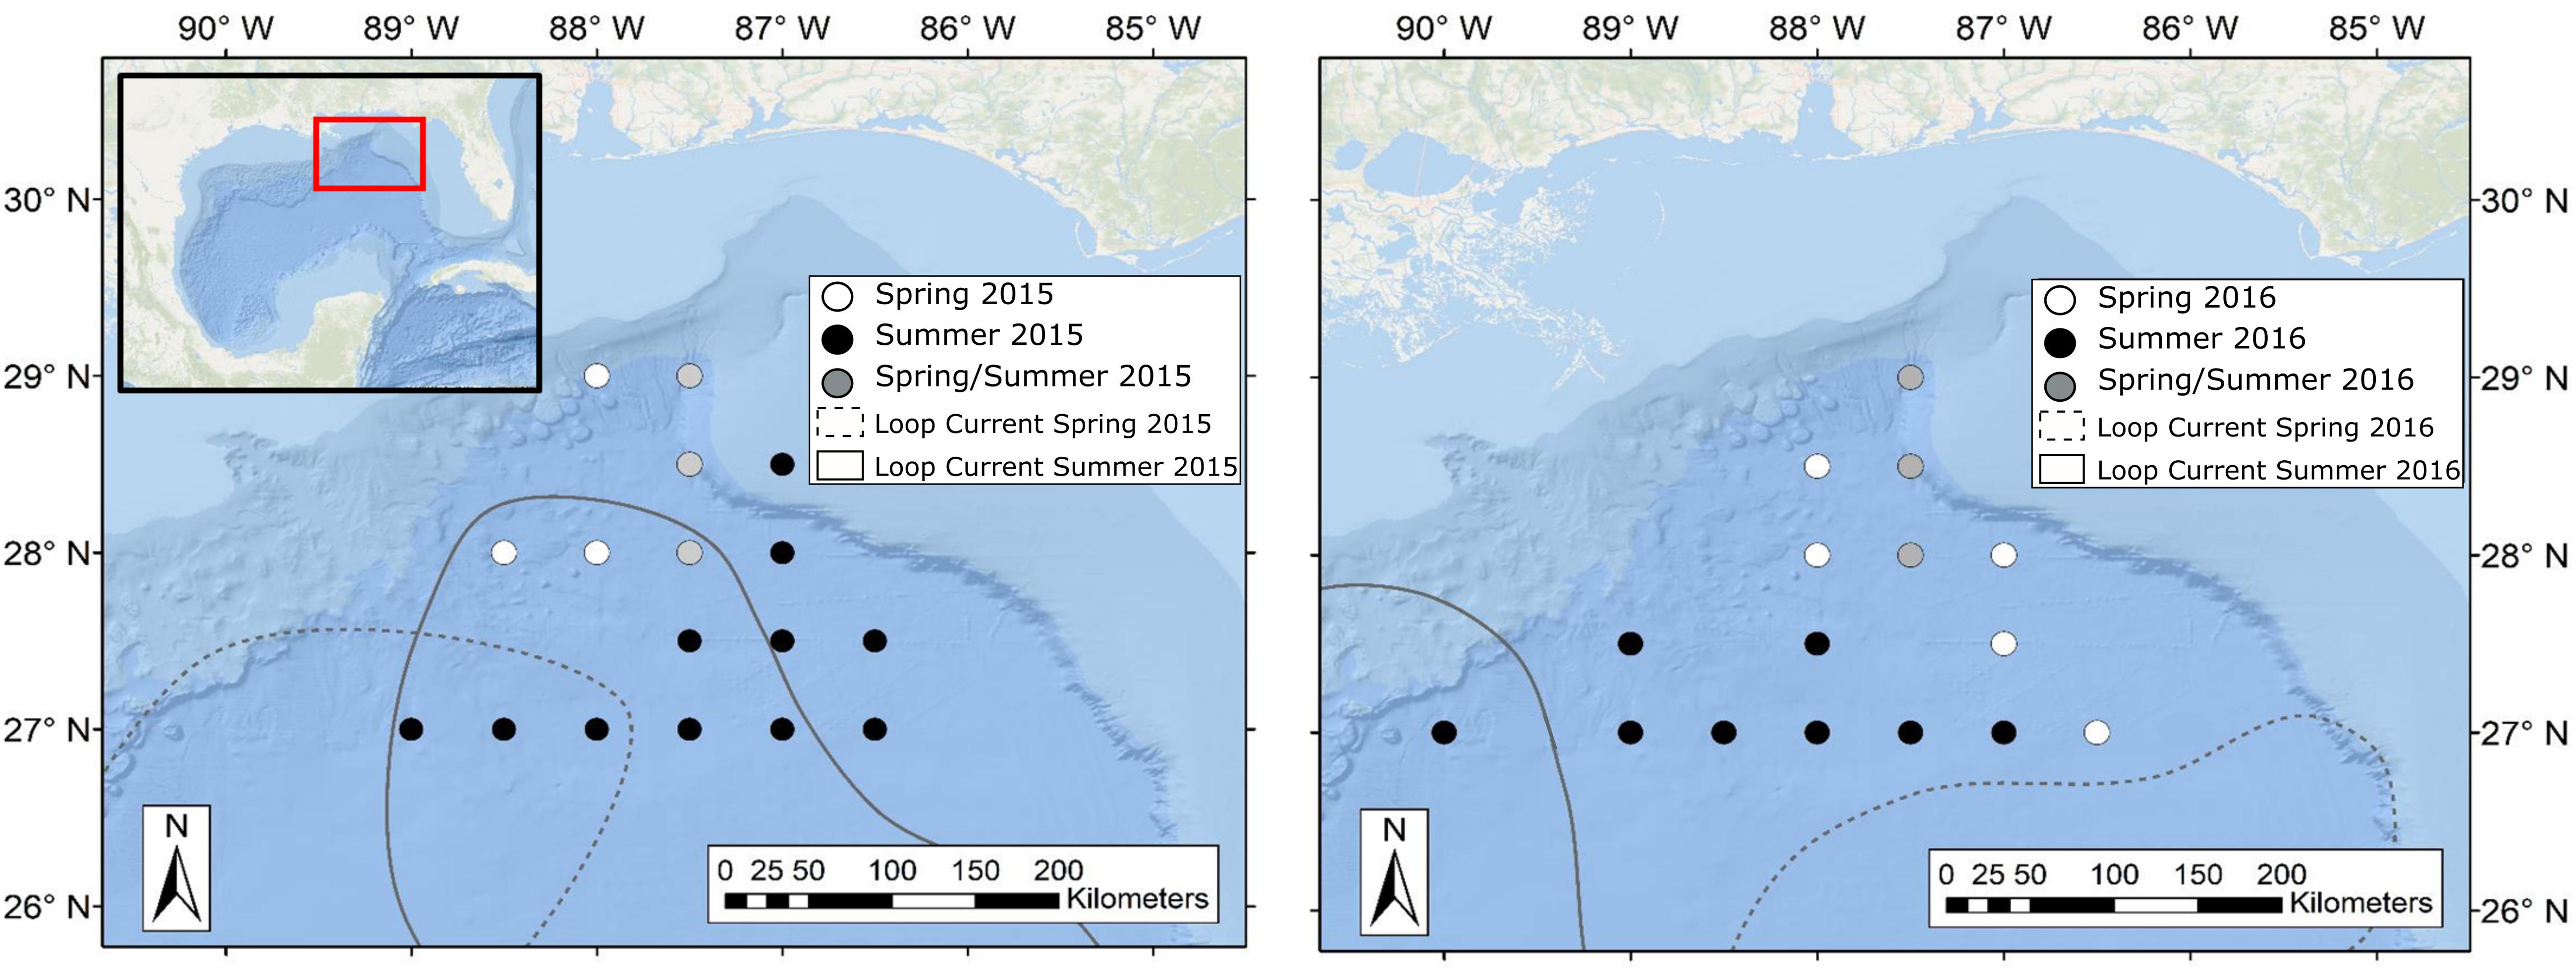
Figure 2. Maps of the northern Gulf of Mexico showing sample collection locations during spring (white circles), summer (black circles), and spring and summer (gray circles) for oceanographic cruises conducted in 2015 (left panel) and 2016 (right panel). Dashed and solid lines represent approximate location of the Loop Current defined by 20-cm sea surface height anomaly (SSHA) during spring and summer sampling periods, respectively. Water surrounding the Loop Current was classified as Gulf Common Water following Johnston et al. (2019). Loop Current positions were created using remotely sensed sea surface height data available through the Copernicus Marine Environmental Monitoring Service.
Micronekton were collected using a Multiple Opening and Closing Net with Environmental Sensing System (MOCNESS), which sampled discrete depth strata from the surface to 1,500 m depth. The depth strata sampled included 0–200 m (epipelagic), 200–600 m (upper mesopelagic), 600–1,000 m (lower mesopelagic), 1,000–1,200 m (bathypelagic), and 1,200–1,500 m (bathypelagic) (Milligan et al., 2018; Cook et al., unpublished data). Micronekton samples selected for SIA were measured to the nearest millimeter for standard length (SL) and frozen at −20°C. Samples selected for AA-CSIA, which were only collected during 2016, were stored in liquid nitrogen at sea before long-term storage at −80°C. In order to characterize the isotopic baseline, samples of particulate organic matter (POM) were collected from the surface, epi-, meso-, and bathypelagic zones at each station. Epi- and mesopelagic samples were collected from the deep chlorophyll maximum (mean depth, 76.6 m) and oxygen minimum zone (mean depth, 426.6 m), respectively, while bathypelagic samples were collected from maximum trawl depth (∼1,500 m). Exact depths for the deep chlorophyll maximum and oxygen minimum varied by station and were visually identified during the downcast of a CTD sensor conducted prior to MOCNESS deployment (Cook et al., unpublished data). Water collections for POM samples were made using 12-L Niskin bottles attached to the CTD rosette and filtered across pre-combusted (2 h at 450°C) 47-mm glass microfiber filters (GF/F) with a 0.7 μm pore size and frozen at −20°C.
Stable Isotope Analysis
Following collection at sea, white muscle tissue was dissected from the lateral musculature of micronekton, rinsed with deionized water, and examined under a microscope for the presence of bones. Cleaned samples were then lyophilized, homogenized, weighed (∼1 mg sample), and wrapped in tin capsules. Prior to SIA, samples of POM were placed in a drying oven at 60°C until a constant weight was achieved (∼24 h) and then folded and wrapped into tin capsules. The C:N of fishes in the present study were low (species mean C:N range, 3.32–3.53), suggesting lipids would not significantly confound the interpretation of δ13C values. Thus, all statistical analyses were performed on uncorrected δ13C values. Samples for SIA were analyzed at the University of California at Davis Stable Isotope Facility (UC Davis SIF) using an elemental analyzer (PDZ Europa ANCA-GSL) interfaced with an isotope ratio mass spectrometer (PDZ Europa 20–20). The long-term standard deviation for instrumentation precision at the UC Davis SIF for SIA is 0.2 and 0.3‰ for δ13C and δ15N, respectively. Isotopic ratios are presented in delta notation relative to the international standards Vienna PeeDee Belemnite (VPDB) and air for carbon and nitrogen, respectively.
Sample preparation for AA-CSIA followed a similar protocol to SIA except a larger amount of tissue (∼3 mg) was dissected, lyophilized, homogenized, and stored in 2-ml glass dram vials prior to submission. Sample preparation for AA-CSIA at UC Davis SIF followed protocols outlined in Yarnes and Herszage (2017). Briefly, samples were hydrolyzed with 6 M HCl to isolate amino acids before derivatization using esterification-acetylation to yield N-acetyl isopropyl esters. The nitrogen isotope compositions of the resulting N-acetyl amino acid isopropyl esters were determined using a gas chromatograph (Thermo Trace GC 1310) linked to an isotope-ratio mass spectrometer (Thermo Scientific Delta V Advantage IRMS) via a GC IsoLink II combustion interface. Samples were injected into a DB-1301 (Agilent Technologies) column (60 m × 0.25 mm × 1.0 μm film) at a temperature of 255°C (splitless, 1 min) under a constant flow rate of 1.2 ml/min. During analysis, all samples were analyzed in duplicate with triplicate measurements made if values exceeded expected measurement error ± 1‰ (Yarnes and Herszage, 2017). Norleucine was used as an internal standard during analysis, while two amino acid compounds developed by the UC Davis SIF were comeasured during analysis of fish samples and were used for calibration and normalization of amino acid data. Standard deviation for all amino acids averaged ± 0.38‰. The δ15Nsource AA values for each species are presented as the weighted mean of the four source amino acids phenylalanine, lysine, glycine, and serine, while δ15NTrophic AA represents the weighted mean of the three trophic amino acids alanine, leucine, and glutamic acid (Bradley et al., 2015; Gloeckler et al., 2018). Both source and trophic amino acids were weighted by the standard deviation of each amino acid (Bradley et al., 2015; Gloeckler et al., 2018).
Data Analysis
Interspecific differences in the δ13C and δ15N values of POM and fishes were examined using a three-factor multivariate analysis of variance (MANOVA), with δ13C and δ15N included as dependent variables and species, sampling year (2015, 2016), and water type (LCW, GCW) as independent variables. Following MANOVA, analysis of variance (ANOVA) was used to explore interspecific differences in δ13C and δ15N. Intraspecific variation in δ13C and δ15N was explored using ordinary least squares regression to characterize the relationship between standard length (SL) and δ13C and δ15N. For species with statistically significant relationships between length and δ13C or δ15N, length was used as a covariate in two-factor analysis of covariance (ANCOVA) to assess the effects of sampling year and water type on each isotope for each species. Similarly, variation in POM δ13C and δ15N within each depth zone was assessed using two-factor ANCOVA, with sampling year and water type included as independent variables and depth of water collection included as a covariate. Following ANOVA/ANCOVA, a posteriori differences among means were analyzed using Shaffer’s multiple comparison procedure (Shaffer’s MCP), as it is less affected by unbalanced sample sizes relative to other post hoc tests and adjusts to control for type I error during multiple comparisons (Shaffer, 1986; Bretz et al., 2016). ANOVA/ANCOVA tests met assumptions of normality and homoscedasticity, which were checked through visual inspection of residual plots and normal qq plots. All statistical analyses were performed in R (R version 3.6.0) using the car and multcomp packages (Hothorn et al., 2008; Fox and Weisberg, 2019).
Trophic Position Estimates
Trophic position (TP) estimates were made using both SIA and AA-CSIA data. TP estimations using SIA followed Eq. 1 where δ15Ni represents the nitrogen signature of an individual, δ15Nbase represents the nitrogen signature of the pyrosome, Pyrosoma atlanticum, and trophic enrichment factor (TEF) represents the enrichment of 15N with each trophic step (3.15‰ following Valls et al., 2014). Primary consumers are useful when setting isotopic baselines because their slower tissue turnover rates and longer generation times allow for the integration of isotopic baselines over broader spatiotemporal scales (Post, 2002). Pyrosomes are filter-feeding pelagic tunicates known to feed on POM and have been used as model primary consumers in several studies examining pelagic food web structure (Cherel et al., 2010; Ménard et al., 2014). The utility of pyrosomes to delineate isotopic baselines is enhanced in regions like the GOM, which are characterized by low chlorophyll α concentrations and phytoplankton communities dominated by small flagellates rather than diatoms, which have been shown to be unassimilated during pyrosome feeding (von Harbou et al., 2011; Pakhomov et al., 2019). The mean δ13C (-22.40 ± 0.63) and δ15N (3.15 ± 0.92) values of 22 P. atlanticum collected during this study were higher than δ13C and δ15N values of epipelagic POM, suggesting that pyrosomes are suitable for setting the isotopic baseline in the pelagic GOM.
Trophic position estimations using data derived from AA-CSIA followed Eq. 2. In the equation, δ15NTr–AA represents the weighted mean of the three trophic amino acids alanine, leucine, and glutamic acid, and δ15NSrc–AA represents the weighted mean of three source amino acids glycine, lysine, and phenylalanine (Bradley et al., 2015; Gloeckler et al., 2018). The terms β, which represents the difference in δ15N values of trophic and source amino acids of primary producers, and TEFTr–Src, which represents the average isotopic enrichment between trophic and source amino acids in consumers, were set to 3.6 and 5.7‰, respectively, following Bradley et al. (2015). As mentioned above, AA-CSIA samples and subsequent TP estimations using AA-CSIA were conducted during the 2016 sampling year only.
Results
POM SIA
Particulate organic matter isotope values were variable within each depth zone, with individual δ13C values spanning 4.0‰ in the bathypelagic zone and varying by as much as 6.69‰ in surface samples. Similarly, individual δ15N values spanned 4.25‰ in the mesopelagic zone and varied by as much as 6.7‰ in the epipelagic zone. POM δ13C values differed significantly among depth zones (ANOVA: F3,63 = 17.10, p < 0.001), with differences among zones interacting with year (F3,63 = 8.08, p < 0.001) due to lower δ13C values for meso- and bathypelagic samples in 2015 relative to 2016 (Supplementary Tables S1, S2). Generally, POM δ13C values were lowest in the epipelagic zone and highest in the mesopelagic zone, while surface and bathypelagic samples were intermediate (Table 2 and Figure 3A). POM δ15N values varied significantly among depth zones (ANOVA: F3,63 = 20.11, p < 0.001) and water types (F1,63 = 5.71, p < 0.05) (Supplementary Tables S1, S2), with δ15N values significantly higher in GCW (mean ± SD, 4.25 ± 1.81) relative to LCW (mean ± SD, 2.40 ± 2.60). Among depth zones, δ15N values of surface and epipelagic samples were similar (p > 0.05, Shaffer’s MCP) but significantly lower than meso- and bathypelagic samples (p < 0.05, Shaffer’s MCP for each), while POM δ15N values from the meso- and bathypelagic zones were statistically similar to each other (p > 0.05, Shaffer’s MCP) (Table 2 and Figure 3A).
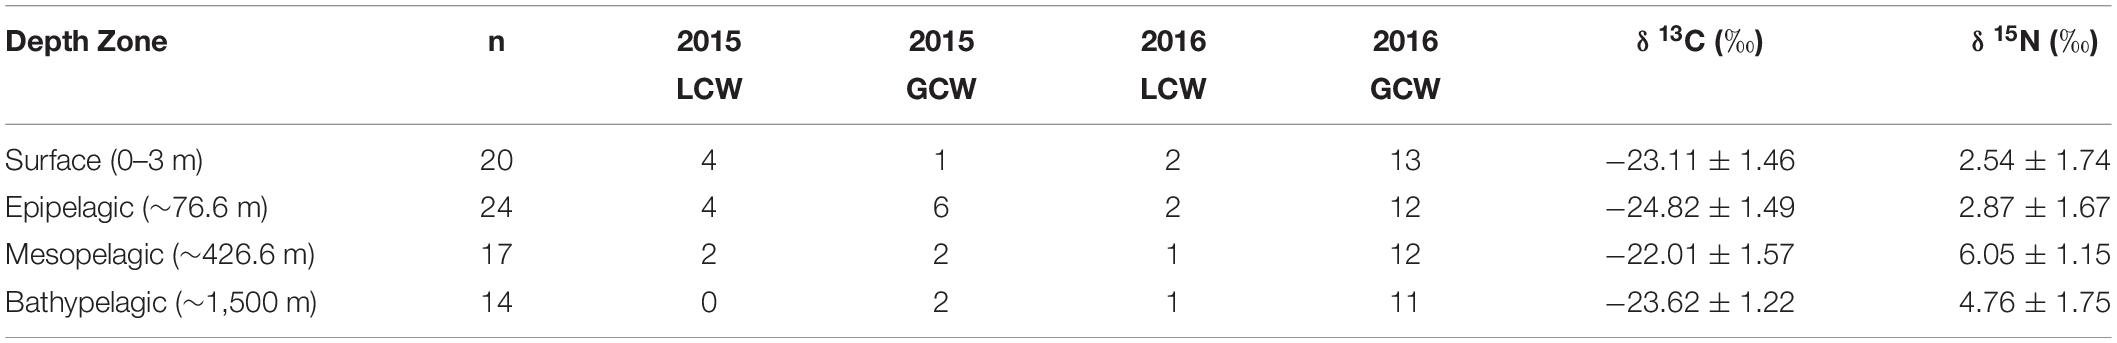
Table 2. Summary table depicting sample totals of particulate organic matter for each sampling period and mean (± SD) δ13C, δ15N, and C:N values for each depth zone.
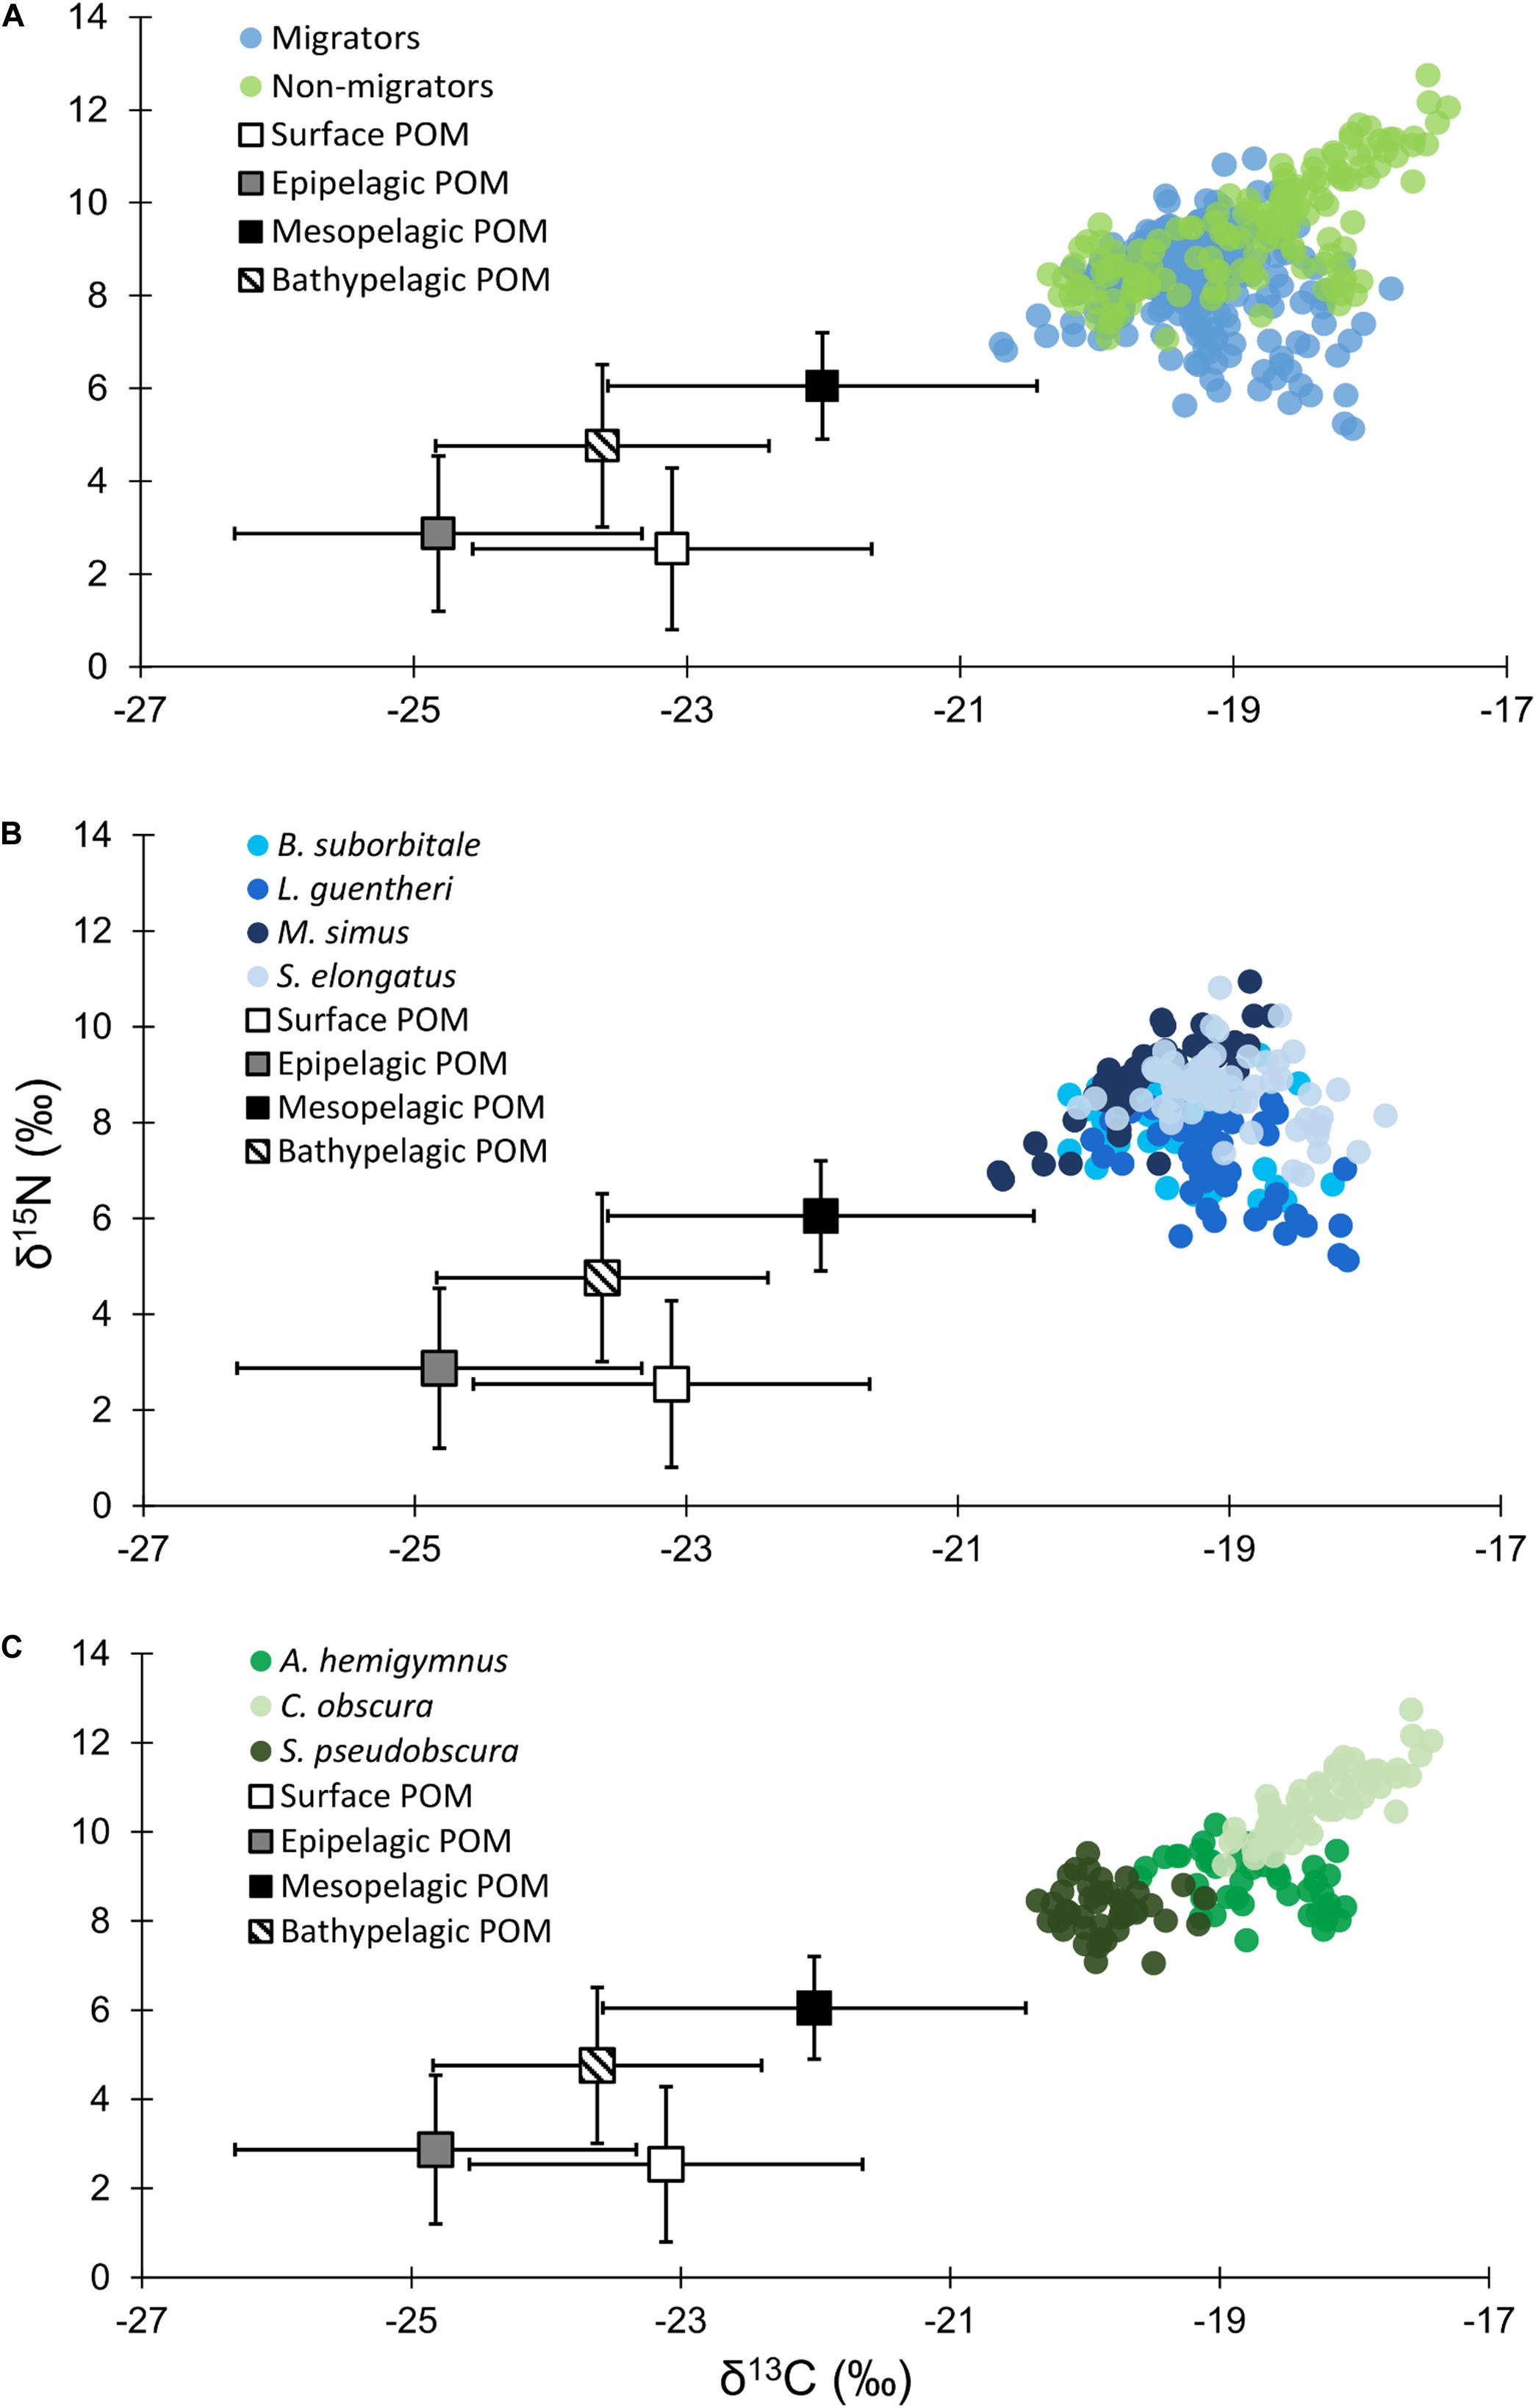
Figure 3. (A) Isotope biplot displaying mean (± SD) δ13C and δ15N values for particulate organic matter from each depth zone (squares) and individual δ13C and δ15N values for all vertically migrating (blue circles) and non-migrating (green circles) fish species. (B) Individual δ13C and δ15N values of vertically migrating species. (C) Individual δ13C and δ15N values of non-migrating species.
Within each depth zone, the influence of sampling year and water type on POM isotope values differed between δ13C and δ15N. Differences between sampling years were only observed in δ13C data, while differences between water types only occurred in δ15N data (Table 3). Significant interannual differences in δ13C values occurred in all depth zones, with surface and epipelagic POM δ13C values higher in 2015 relative to 2016, while meso- and bathypelagic samples were higher in 2016 relative to 2015 (p < 0.05, Shaffer’s MCP for each). Mean δ15N values from surface and epipelagic samples were lower in LCW relative to samples collected from GCW (p < 0.05, Shaffer’s MCP for each). No differences in δ13C and δ15N values were observed between water types in meso- or bathypelagic samples (Table 3).
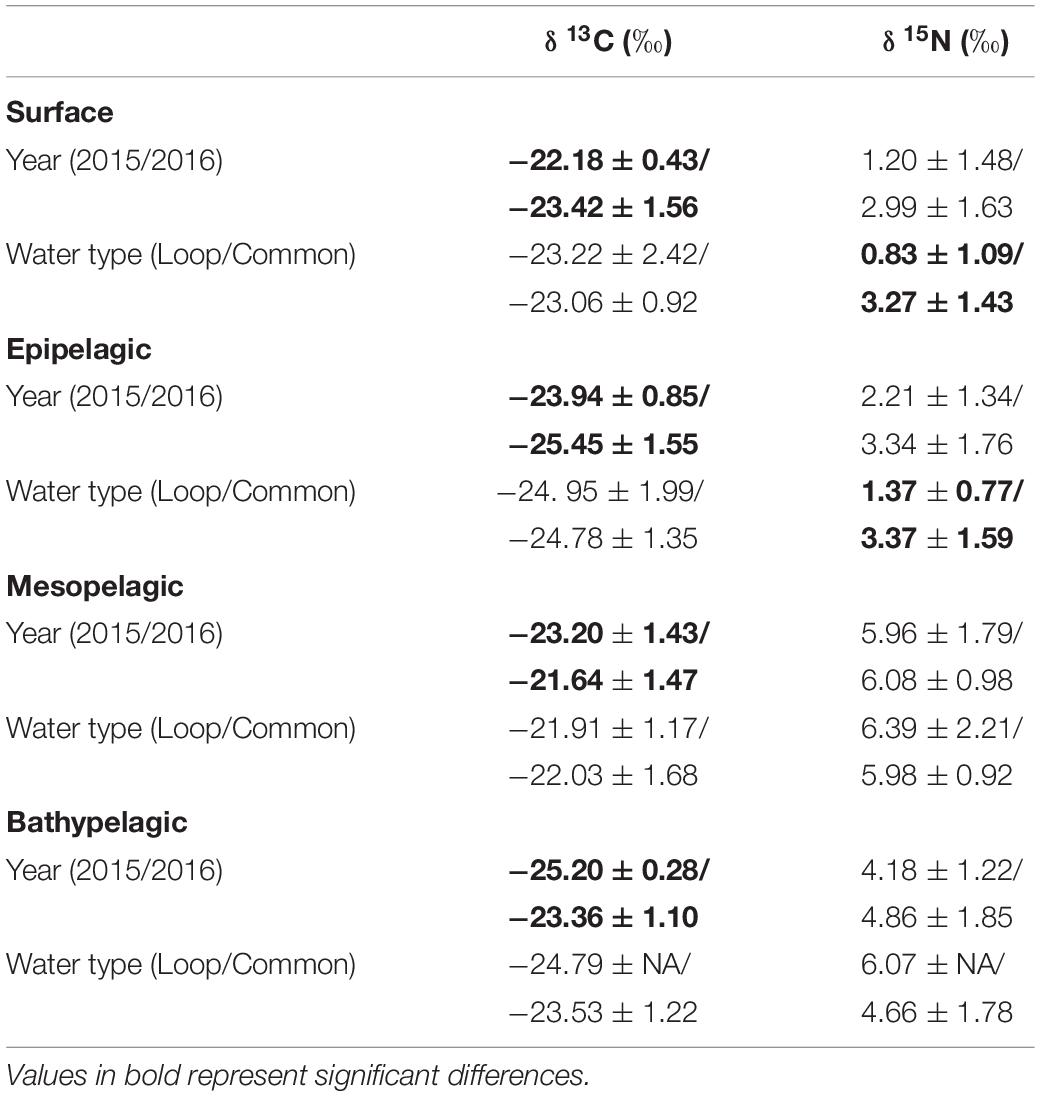
Table 3. Mean (± SD) δ13C and δ15N stable isotope ratios of particulate organic matter among sampling years (2015/2016) and water types (Loop Current/Common Water).
Deep-Pelagic Fish SIA
Despite feeding on similar prey, there was considerable variation in the δ13C and δ15N values of the seven species of fishes examined (Figure 3). The δ13C values of non-migratory fishes were more variable than migratory species, with δ13C values of non-migrators almost completely separated in isotope space from one another (Figure 3). Fish δ13C values differed significantly among species (ANOVA: F6,347 = 92.16, p < 0.001) and water types (F1,347 = 23.95, p < 0.001), with differences among species varying significantly between GCW and LCW (F6,347 = 5.08, p < 0.001) (Supplementary Tables S3, S4). In GCW, interspecific differences were driven by high δ13C values in C. obscura and low values in S. pseudobscura, with the four migratory species and the non-migratory A. hemigymnus displaying intermediate δ13C values (Figure 4). Interspecific differences for δ13C in LCW differed slightly due to higher δ13C values in A. hemigymnus, B. suborbitale, L. guentheri, and S. elongatus relative to samples from GCW (Figure 4).
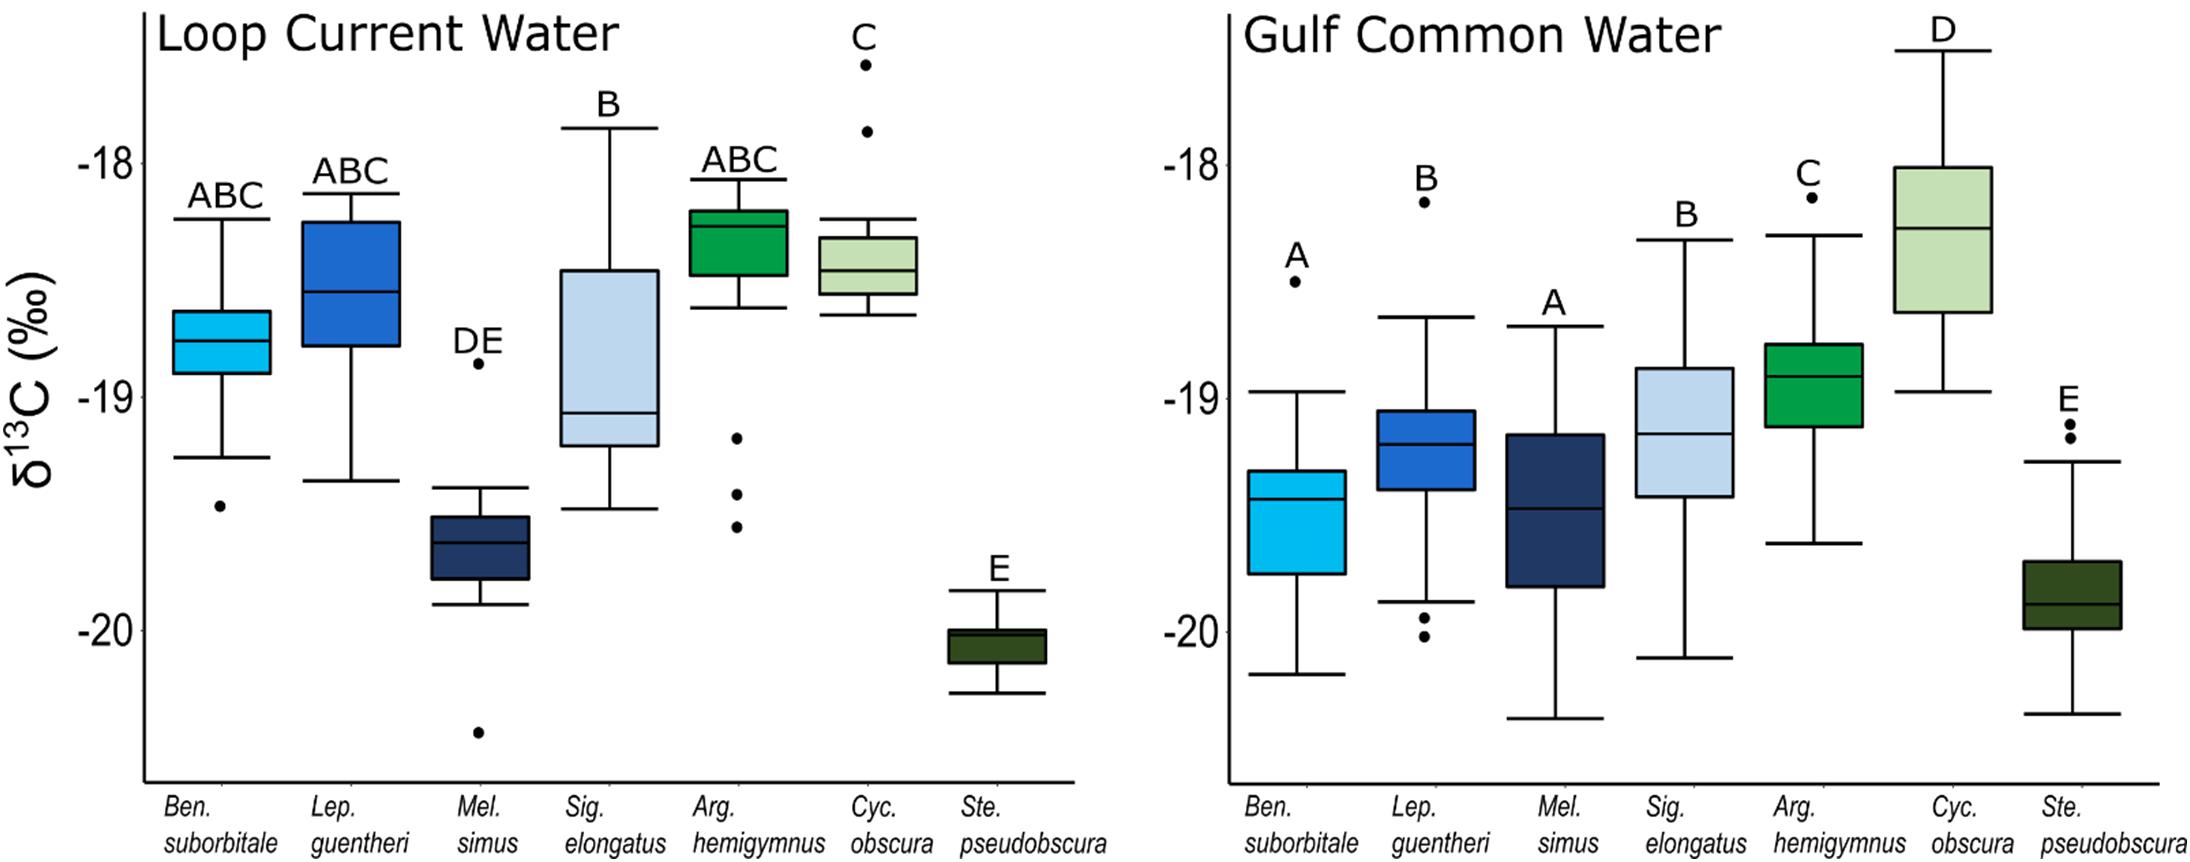
Figure 4. Boxplots depicting interspecific differences in mean (± SD) δ13C values for migratory (blue shades) and non-migratory (green shades) deep-pelagic fishes collected in Loop Current water and Gulf common water. Differing letters among species denote significant differences.
Individual fish δ15N values spanned 7.62‰, with mean δ15N values of non-migratory fishes encompassing a broader range (2.34‰) than migratory species (1.76‰). The δ15N values of fishes differed significantly among species (ANOVA: F6,347 = 131.24, p < 0.001), with interspecific differences varying between GCW and LCW (F6,347 = 7.28, p < 0.001). δ15N values of fishes also differed between years (F1,347 = 5.20, p < 0.05), with values slightly lower in 2015 relative to 2016, and differed between water types (F1,347 = 34.42, p < 0.001), with δ15N values lower in LCW relative to GCW (Supplementary Tables S3, S4). In both water types, differences among species were primarily driven by high δ15N values in C. obscura and low values in L. guentheri and B. suborbitale (Figure 5), while the migratory M. simus and S. elongatus and the non-migratory A. hemigymnus and S. pseudobscura were characterized by intermediate δ15N values (Figure 5).
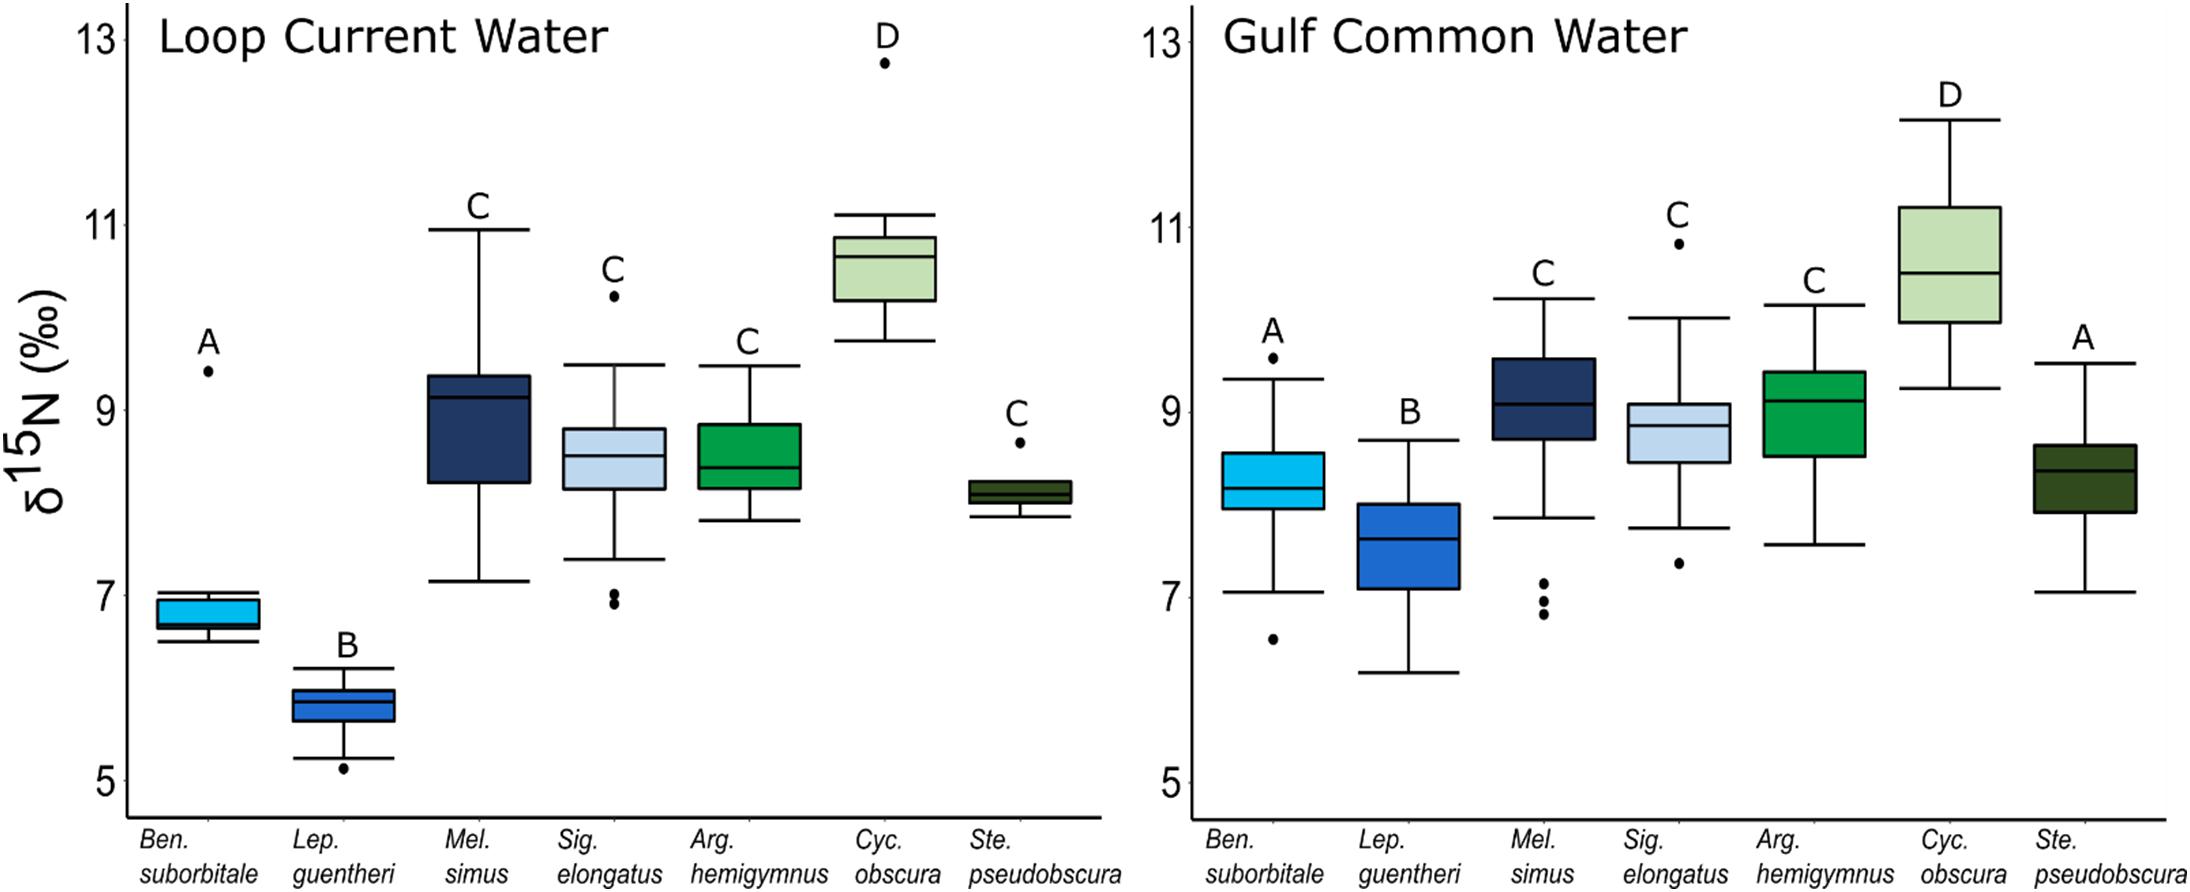
Figure 5. Boxplots depicting interspecific differences in mean (± SD) δ15N values for migratory (blue shades) and non-migratory (green shades) deep-pelagic fishes collected in Loop Current water and Gulf common water. Differing letters among species denote significant differences.
Standard length was correlated with δ13C and δ15N values in both migratory and non-migratory fishes. Specifically, statistically significant relationships between δ13C and standard length were observed in the migratory L. guentheri (p < 0.05; R2 = 0.11), M. simus (p < 0.001; R2 = 0.40), S. elongatus (p < 0.001; R2 = 0.15), and in the non-migratory C. obscura (p < 0.001; R2 = 0.25). Similarly, significant relationships between standard length and δ15N were observed for all migratory species: B. suborbitale (p < 0.01; R2 = 0.12), L. guentheri (p < 0.001; R2 = 0.43), M. simus (p < 0.001; R2 = 0.73), S. elongatus (p < 0.001; R2 = 0.23), and for the non-migratory C. obscura (p < 0.01; R2 = 0.15). Subsequent ANCOVA indicated the effect of sampling year and water type on isotope values varied by species, with no consistencies between migrators and non-migrators (Table 4). Intraspecific interannual variability was minimal, with no differences in δ13C observed between sampling years and interannual differences in δ15N only occurring in the migratory L. guentheri and non-migratory A. hemigymnus and S. pseudobscura (p < 0.05, Shaffer’s MCP for each). The effect of water type was more pronounced, with the migratory B. suborbitale, L. guentheri, and S. elongatus and the non-migratory A. hemigymnus possessing higher δ13C and lower δ15N values in LCW relative to GCW (p < 0.05, Shaffer’s MCP for each) (Table 4).
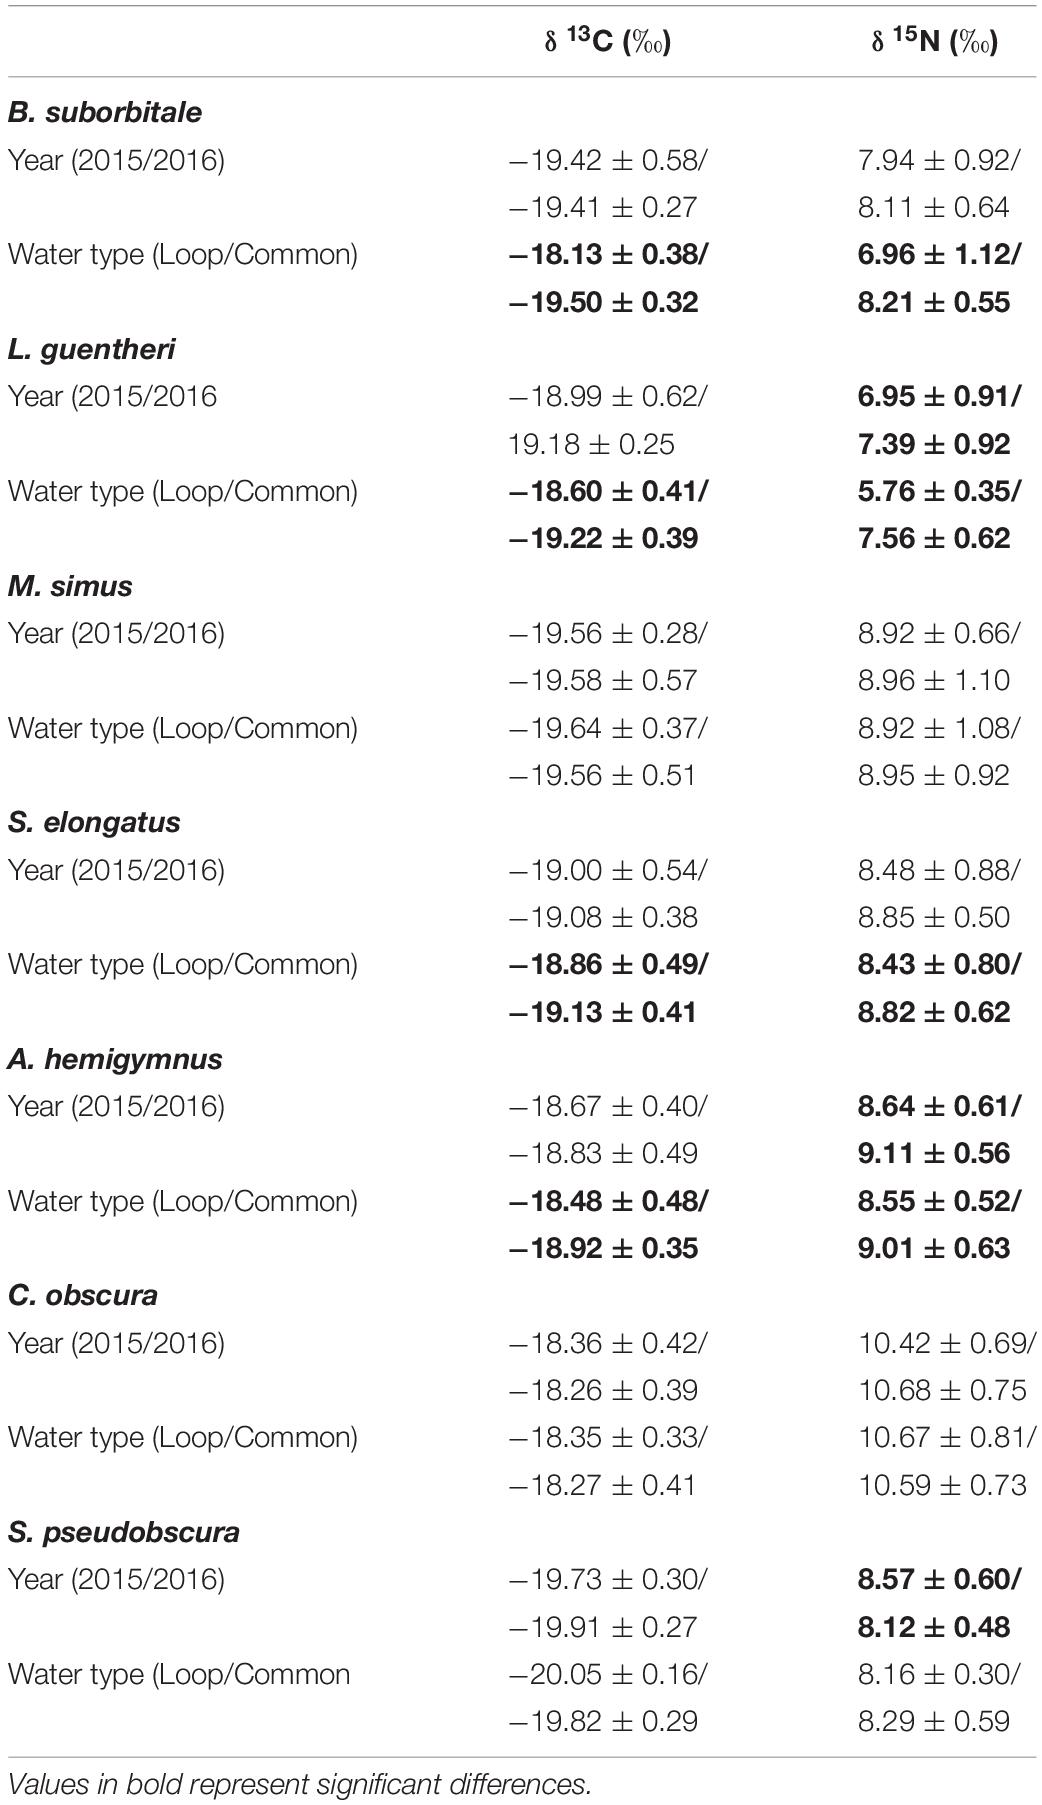
Table 4. Mean (± SD) δ13C and δ15N stable isotope ratios of deep-pelagic fishes between sampling years (2015/2016) and water types (Loop Current/Common Water).
AA-CSIA and Trophic Position Estimates
Mean δ15NsourceAA values of fishes echoed patterns in δ15N values, with the migratory L. guentheri and B. suborbitale displaying the lowest mean δ15NsourceAA values and the non-migratory and deepest dwelling C. obscura displaying the highest (Figure 6). The migratory M. simus and S. elongatus and non-migratory A. hemigymnus and S. pseudobscura had similar δ15NsourceAA values that fell between the end members of L. guentheri and C. obscura (Figure 6). Significant positive linear relationships were observed between bulk δ15N values and δ15NsourceAA values (p < 0.01; R2 = 0.90) (Figure 6A) and between mean δ15NsourceAA values and median nighttime depth (p < 0.05; R2 = 0.81) (Figure 6B). Mean TPSIA estimates spanned 1.09 trophic levels, with all species except C. obscura placed between the third and fourth trophic level (Table 5). Comparatively, TPAA–CSIA estimates exhibited a narrower range of 0.62 trophic levels and placed all species between the third and fourth trophic level. Differences in mean TP estimates between the two methods varied by species, with close agreement between estimates for S. pseudobscura, L. guentheri, and M. simus but a relatively large disparity in C. obscura, with TPAA–CSIA estimates 0.9 TLs lower than TPSIA estimates (Table 5).
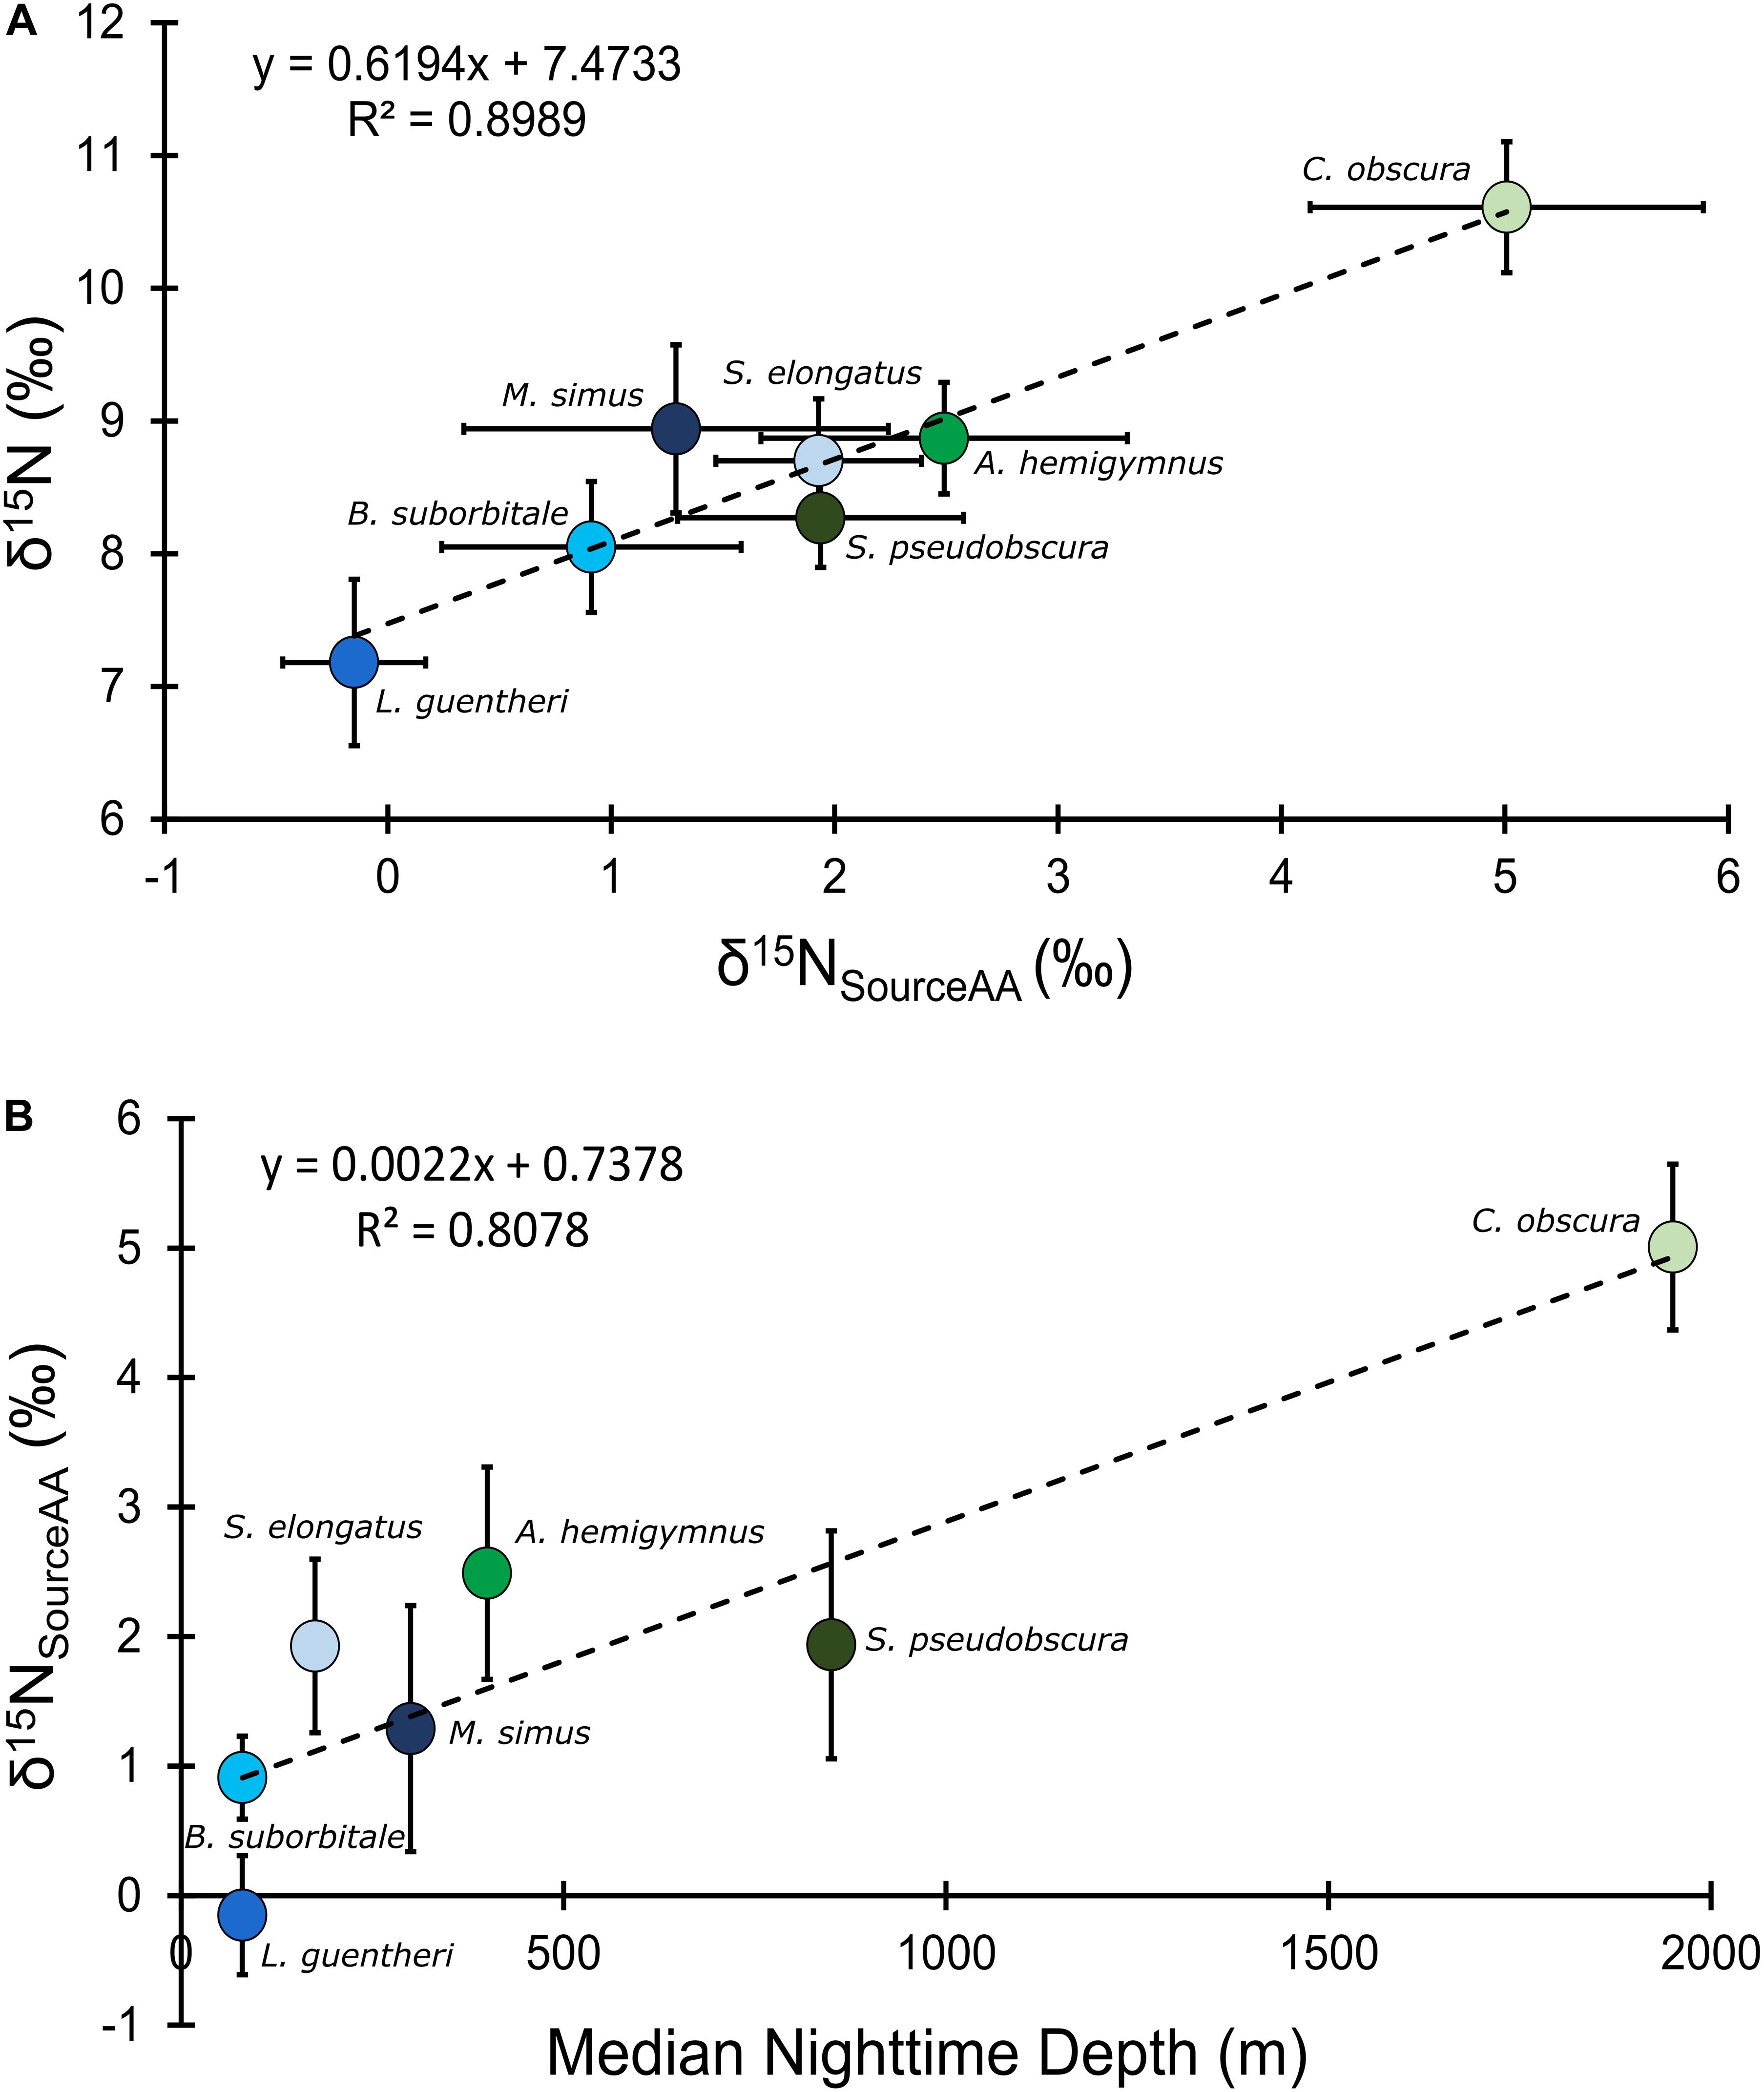
Figure 6. (A) Bulk tissue δ15N values of deep-pelagic fishes as a function of δ15NsourceAA values. (B) δ15NsourceAA values as a function of median nighttime depth of occurrence. δ15NsourceAA represents the averaged value for each fish species. Blue circles represent vertical migrators, green circles represent non-migrators, and error bars represent the standard error for each species.
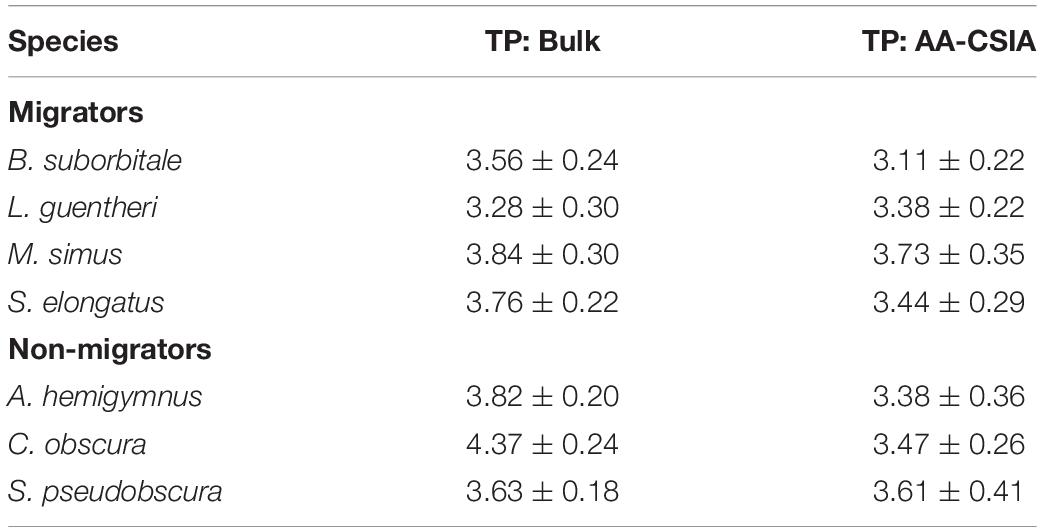
Table 5. Comparison of mean (± SD) trophic positions for each fish species created using bulk SIA and AA-CSIA.
Discussion
Variation in POM SIA
The isotopic values of POM varied considerably among and within the vertical depth zones of the northern GOM. The high level of variation is consistent with previous GOM studies that documented POM values collected from similar depths spanning 6–10‰ and 5–13‰ for δ13C and δ15N, respectively, Fernández-Carrera et al. (2016). Despite the high degree of variation, POM δ13C and δ15N values differed among depth zones, with a pattern of enrichment between the epipelagic and meso- and bathypelagic zones. The observed enrichment, particularly in 15N, between epipelagic and deep-pelagic samples (>200 m) is consistent with previous studies, which showed that POM values increase most strongly above 200 m (3–10‰), then remain relatively constant through the meso- and bathypelagic zone, as we found (Altabet, 1988; Altabet et al., 1991; Emeis et al., 2010; Fernández-Carrera et al., 2016).
The isotopic enrichment of POM with depth observed in our samples has been documented in pelagic systems throughout the world’s oceans and is attributed to microbial degradation as POM sinks through the water column (Altabet, 1988; Mintenbeck et al., 2007; Hannides et al., 2013). During microbial reworking, bonds containing 14N are preferentially broken, leaving the residual material isotopically heavier and isotopically distinct from newly formed particles in the epipelagic zone (Mintenbeck et al., 2007; Hannides et al., 2013). Additionally, as POM sinks, microbial activity and disturbance from zooplankton swimming and feeding enhances physical degradation resulting in different size fractions that vary from large (>53 μm), fast sinking particles to small (0.7–53 μm), suspended particles (Altabet, 1988; Gloeckler et al., 2018). SIA and AA-CSIA of POM has shown that small suspended particles at depths >200 m have δ15N and δ15NsourceAA values that are enriched relative to newly formed particles (of both size classes) near the ocean’s surface and to large particles throughout the meso- and bathypelagic zones (Hannides et al., 2013; Gloeckler et al., 2018). The finding that δ15N and δ15NsourceAA values of POM undergo distinct changes with depth provides important context, as it suggests that variation among higher-order consumers could reflect variation at the base of the food web and not a change in trophic status.
Variation in Deep-Pelagic Fish SIA
The isotopic values of deep-pelagic fishes differed significantly among species, with variation among species appearing to be depth related. The low δ13C and δ15N values among migratory species, which share broadly overlapping depth distributions, suggest a shared reliance on recently formed primary production within the epipelagic zone. In contrast, the variation in δ13C values of non-migratory species was significant, with minimal isotopic overlap among species. The pattern of 13C enrichment within non-migratory species is interesting, as it did not perfectly align with vertical distributions due to lower δ13C values in S. pseudobscura relative to the shallower dwelling A. hemigymnus. The low δ13C values in S. pseudobscura, which were similar to δ13C values of the migratory B. suborbitale and L. guentheri, suggest that S. pseudobscura uses food webs supported by production derived in the epipelagic zone despite a depth of distribution that centers below 700 m. In contrast, higher δ13C values in A. hemigymnus and C. obscura suggests that both species feed within food webs supported by POM with higher δ13C values within the meso- and bathypelagic zone.
Depth-driven variation in micronekton δ15N values has been observed in deep-pelagic assemblages in the Atlantic (Parzanini et al., 2017), Pacific (Gloeckler et al., 2018; Romero-Romero et al., 2019), and Mediterranean Sea (Valls et al., 2014), and our data suggest that depth is an important factor influencing the δ15N values of GOM assemblages as well. For example, δ15N values were lower in B. suborbitale and L. guentheri, which have epipelagic nighttime distributions, relative to M. simus and A. hemigymnus, which have nighttime distributions in the mesopelagic zone. Additionally, the highest δ15N values belonged to the non-migratory C. obscura, which has the deepest depth of occurrence of the species examined. The trend of higher δ15N values in deeper-dwelling species was not reflected in the values of S. pseudobscura, which was isotopically similar to B. suborbitale and characterized by lower δ15N values relative to the shallower dwelling species such as M. simus, S. elongatus, and A. hemigymnus. Despite a center of distribution below 700 m, the δ15N values for S. pseudobscura suggests the use of food webs with similar isotopic baselines to those of migratory species foraging in the upper meso- and epipelagic zones (Hopkins and Baird, 1985; Hopkins et al., 1996). Diet analysis of S. pseudobscura in the GOM has shown selection for epipelagic prey, with >90% of the identified copepod species consumed by S. pseudobscura possessing population centers above 75 m (Hopkins et al., 1996). To date, there has been no explanation for the occurrence of epipelagic prey in S. pseudobscura, but downwelling of prey items, net feeding, and the hypothesis that epipelagic copepods are the prey of S. pseudobscura’s prey have been ruled out during previous investigations (Hopkins and Baird, 1985; Hopkins et al., 1996). While our results cannot offer a mechanism to link S. pseudobscura to epipelagic prey, the isotopic similarities between S. pseudobscura and migratory species provides additional support for the assertion that S. pseudobscura feeds at depth in the lower meso- and upper bathypelagic zones on prey with δ15N values indicative of an epipelagic origin and offers an interesting example of vertical connectivity in GOM pelagic food webs.
Interspecific differences in δ15N values could be influenced by slight differences in the diet compositions of the species examined and should be considered. With the exception of large S. elongatus and S. pseudobscura, which can feed on decapod crustaceans and fishes, all species have diets composed of small crustaceans, including frequent consumption of copepods from the genus Pleuromamma (Hopkins and Baird, 1985; Hopkins et al., 1996; Burghart et al., 2010). Based on available diet data, hypothesized trophic structure would suggest S. elongatus and S. pseudobscura occupy trophic positions higher than the other five species. Assuming dietary relationships among taxa remain similar to those outlined by Hopkins et al. (1996), observed interspecific variation in δ15N was greater than, and different from, variation predicted from feeding patterns. Specifically, that M. simus, A. hemigymnus, and C. obscura, which feed on copepods and ostracods, possess δ15N values similar to S. elongatus and elevated relative to S. pseudobscura, is counter to known diet data. Interspecific differences in δ15N values instead suggests differences among species are driven by differential use of food webs supported by isotopically distinct POM pools, with deeper-dwelling species more likely to use food webs at depth supported by small, suspended particles with elevated δ13C and δ15N values.
The δ15NsourceAA values in fishes were variable but reflected trends in δ15N, with lower δ15NsourceAA values in the shallowest migratory species (L. guentheri, B. suborbitale) and higher values in the deepest dwelling C. obscura. The contrasting δ15NsourceAA values provides further evidence supporting the assertion that variation among species is underpinned by differential use of food webs supported by POM with isotopically distinct signatures. Similar results were reported in the Pacific by Gloeckler et al. (2018) who found that micronekton δ15NsourceAA values increased with depth, suggesting that non-migratory species inhabiting the lower meso- and bathypelagic zones increasingly rely on food webs supported by small, suspended particles relative to species in the epi- and upper mesopelagic zones.
It is noteworthy that C. obscura appears to receive carbon from deep-suspended particles, as it was the second most abundant species collected during midwater sampling of the GOM behind its congener, Cyclothone pallida (Sutton et al., 2017). The δ15NsourceAA values of C. pallida, which has a median depth distribution slightly shallower than C. obscura, displayed elevated δ15NsourceAA values (4.3 ± 2.7) and appeared to be supported by small, suspended particle-based food webs in the Pacific (Gloeckler et al., 2018). Members of the genus Cyclothone are one of the most numerous vertebrates on the planet (Nelson et al., 2016), and it is interesting that two highly abundant deep-pelagic species appear to feed within food webs supported by suspended particles at depth, which, until recently, were not known to significantly contribute to the production of deep-pelagic micronekton (Gloeckler et al., 2018). While C. pallida and C. obscura both appear to utilize suspended particle-based food webs, Gloeckler et al. (2018) found that δ15NsourceAA values for the upper mesopelagic Cyclothone braueri and C. alba more closely resembled source values of large, sinking particles in the epi- and mesopelagic zones. The contrasting δ15NsourceAA values among members of Cyclothone again suggests that utilization of small particle food webs appears to be primarily driven by differences in depth distribution among species (Gloeckler et al., 2018).
Effects of Water Type on Isotopic Values
The δ15N values of surface and epipelagic POM and four fish species were significantly lower in LCW relative to samples collected in GCW. The magnitude of isotopic variation between the two water types appeared to be depth related, as differences in POM δ15N values were greatest at the surface and decreased with increasing depth (Table 3). Similarly, differences in fish δ13C and δ15N values between water types were greatest for species with epipelagic nighttime distributions (B. suborbitale and L. guentheri), less pronounced in species with mesopelagic nighttime distributions (S. elongatus, A. hemigymnus), and absent for the deepest dwelling C. obscura. The pattern of higher δ13C and δ15N values in anticyclonic features like the Loop Current is consistent with previous investigations of epipelagic micronekton and zooplankton in the northern GOM (Dorado et al., 2012; Wells et al., 2017). Interestingly, the mean differences in δ15N values observed between fish collected in LCW and GCW, which ranged from 1.80‰ (L. guentheri) to 0.39‰ (S. elongatus), were less than the isotopic differences observed in surface-dwelling flying fishes (1.95‰) and Sargassum-associated crustaceans (5.4‰) collected from anticyclonic (Loop Current) and cyclonic features by Wells et al. (2017).
Isotopic differences in POM and micronekton collected within cyclonic and anticyclonic features are driven by differences in nitrogen cycling, which result in isotopically distinct nitrogen sources fueling production at the base of the food web (Montoya et al., 2002; Dorado et al., 2012; Wells et al., 2017). The Loop Current and other anticyclonic features in the GOM are areas of convergence, characterized by increased stratification and downwelling, which depresses nitracline depths and limits the amount of isotopically enriched deepwater nitrate entering the photic zone (Biggs et al., 1988; Biggs, 1992). In the absence of new, upwelled nitrate, phytoplankton in the Loop Current and anticyclones have been shown to be supported by regenerated nitrogen and by isotopically light nitrogen derived from diazotrophy (cyanobacteria Trichodesmium spp.), resulting in phytoplankton with lower δ15N values that can then be reflected in the δ15N values of higher-order consumers (Montoya et al., 2002; Dorado et al., 2012). By contrast, phytoplankton in cyclonic eddies or in neritic waters (i.e., common water) are largely supported by isotopically enriched deepwater nitrate or isotopically enriched dissolved inorganic nitrogen associated with the terrestrial environment and Mississippi River leading to higher δ15N values in phytoplankton and higher-order consumers (Dorado et al., 2012). Although turnover rates for deep-pelagic fishes are unknown, B. suborbitale, L. guentheri, and S. elongatus have life spans of 1–3 years, so assumed tissue turnover rates of several weeks are reasonable (Lancraft et al., 1988; Gartner, 1991). While the currents associated with the anticyclonic Loop Current are not strong enough to trap micronekton, the Loop Current and associated eddies can be 100 s of kilometers in diameter, persist for months to years, and dominate circulation in the upper layer of the GOM (Vukovich and Crissman, 1986; Biggs, 1992). Thus, due to the persistence of the Loop Current over timescales greater than hypothesized tissue turnover rates, the conservation of isotopic baselines unique to a particular water type in micronekton is feasible, particularly for short-lived species with relatively shallow distributions. Due to a lack of appropriate samples and funding, we were unable to explicitly test the hypothesis that differing sources of nitrogen-drive isotopic differences between water types using AA-CSIA. While these results should be interpreted carefully due to low sample sizes in LCW, our results, combined with those of previous studies in the GOM, suggest that distinct isotopic baselines within mesoscale features can be conserved in deep-pelagic micronekton and should be considered when examining the trophic structure of pelagic assemblages.
In summary, we found marked differences in the δ13C and δ15N values of seven micronekton species with similar diet compositions over relatively small vertical and horizontal spatial scales in the pelagic GOM. Variation in δ13C and δ15N values among species was related to depth of occurrence and migration type, with deeper-dwelling, non-migratory species typically having higher δ13C and δ15N values relative to shallower-dwelling, migratory species. Depth-related trends in δ15N were similar in δ15NsourceAA data, with higher δ15NsourceAA values in species occupying deeper depths. Taken together, the correlation between depth and δ15N and δ15NsourceAA data suggests that deeper-dwelling species increasingly rely on food webs supported by small, suspended POM particles, which possess higher δ15N and δ15NsourceAA values relative to newly formed particles in the epipelagic zone. Additionally, we observed significant differences in the δ13C and δ15N values of epipelagic POM and micronekton collected in the anticyclonic Loop Current relative to surrounding water masses (LCW). Isotopic differences in samples collected from the two water masses is driven by differences in nitrogen cycling, which results in isotopically distinct nitrogen sources fueling production at the base of the food web. These results suggest the trophic structure of GOM deep-pelagic assemblages is influenced by both feeding relationships and nutrient source dynamics at the base of the food web, which can vary over small spatial scales. By highlighting factors contributing to variation in isotopic values of deep-pelagic species, this study broadens our understanding of deep-pelagic trophic structure and will inform the interpretation of SIA data in future studies of pelagic systems.
Data Availability Statement
The isotope data used in this study are publicly available through the Gulf of Mexico Research Initiative Information & Data Cooperative (GRIIDC) at https://data.gulfresearchinitiative.org (doi: 10.7266/n7-bf8a-hq12; doi: 10.7266/N75D8Q7Z).
Ethics Statement
The animal study was reviewed and approved by the Institutional Animal Care and Use Committee.
Author Contributions
TR, TS, and RW contributed to the concept and initial study design. TR and TS collected samples, while TR conducted laboratory and statistical analyses and data interpretation and wrote the first draft of the manuscript. All authors contributed to the manuscript revisions. TS and RW have read and approved the submitted version of the manuscript.
Funding
This research was made possible by a grant from The Gulf of Mexico Research Initiative.
Conflict of Interest
The authors declare that the research was conducted in the absence of any commercial or financial relationships that could be construed as a potential conflict of interest.
Acknowledgments
We would like to thank the crew of the r/v Point Sur for their help operating the MOCNESS. We thank Charles Kovach, Cole Easson, Jacqueline Long, Shaojie Sun, and Lindsay Freed for their help filtering water for POM. We are grateful to April Cook for her organization of the DEEPEND micronekton database and for her help constructing Figure 1.
Supplementary Material
The Supplementary Material for this article can be found online at: https://www.frontiersin.org/articles/10.3389/fmars.2020.507992/full#supplementary-material
References
Altabet, M. A. (1988). Variations in nitrogen isotopic composition between sinking and suspended particles: implications for nitrogen cycling and particle transformation in the open ocean. Deep Sea Res. Part A Oceanogr. Res. Papers 35, 535–554. doi: 10.1016/0198-0149(88)90130-6
Altabet, M. A., Deuser, W. G., Honjo, S., and Stienen, C. (1991). Seasonal and depth-related changes in the source of sinking particles in the North Atlantic. Nature 354:136. doi: 10.1038/354136a0
Angel, M. V. (1989). Vertical profiles of pelagic communities in the vicinity of the Azores Front and their implications to deep ocean ecology. Prog. Oceanogr. 22, 1–46. doi: 10.1016/0079-6611(89)90009-8
Biggs, D. C. (1992). Nutrients, plankton, and productivity in a warm−core ring in the western Gulf of Mexico. J. Geophys. Res. Oceans 97, 2143–2154. doi: 10.1029/90jc02020
Biggs, D. C., Vastano, A. C., Ossinger, R. A., Gil-Zurita, A., and Perez-Franco, A. (1988). Multidisciplinary study of warm and cold-core rings in the Gulf of Mexico. Mem. Soc. Cienc. Nat. La Salle, Venezuela 48, 12–31.
Boecklen, W. J., Yarnes, C. T., Cook, B. A., and James, A. C. (2011). On the use of stable isotopes in trophic ecology. Annu. Rev. Ecol. Evol. Syst. 42, 411–440.
Bradley, C. J., Wallsgrove, N. J., Choy, C. A., Drazen, J. C., Hetherington, E. D., Hoen, D. K., et al. (2015). Trophic position estimates of marine teleosts using amino acid compound specific isotopic analysis. Limnol. Oceanogr. Methods 13, 476–493. doi: 10.1002/lom3.10041
Bretz, F., Hothorn, T., and Westfall, P. (2016). Multiple Comparisons Using R. London: Chapman and Hall/CRC.
Burghart, S. E., Hopkins, T. L., and Torres, J. J. (2010). Partitioning of food resources in bathypelagic micronekton in the eastern Gulf of Mexico. Mar. Ecol. Prog. Series 399, 131–140. doi: 10.3354/meps08365
Cherel, Y., Fontaine, C., Richard, P., and Labatc, J. P. (2010). Isotopic niches and trophic levels of myctophid fishes and their predators in the Southern Ocean. Limnol. Oceanogr. 55, 324–332. doi: 10.4319/lo.2010.55.1.0324
Chikaraishi, Y., Ogawa, N. O., Kashiyama, Y., Takano, Y., Suga, H., Tomitani, A., et al. (2009). Determination of aquatic food−web structure based on compound−specific nitrogen isotopic composition of amino acids. Limnol. Oceanogr. Methods 7, 740–750. doi: 10.4319/lom.2009.7.740
Chipps, S. R., and Garvey, J. E. (2007). “Assessment of food habits and feeding patterns,” in Analysis and Interpretation of Freshwater Fisheries Data, eds C. S. Guy and M. L. Brown (Bethesda, MD: American Fisheries Society), 473–514.
Choy, C. A., Portner, E., Iwane, M., and Drazen, J. C. (2013). Diets of five important predatory mesopelagic fishes of the central North Pacific. Mar. Ecol. Prog. Series 492, 169–184. doi: 10.3354/meps10518
Davis, R. W., Ortega-Ortiz, J. G., Ribic, C. A., Evans, W. E., Biggs, D. C., Ressler, P. H., et al. (2002). Cetacean habitat in the northern oceanic Gulf of Mexico. Deep Sea Res. Part I Oceanogr. Res. Papers 49, 121–142. doi: 10.1016/s0967-0637(01)00035-8
DeNiro, M. J., and Epstein, S. (1978). Influence of diet on the distribution of carbon isotopes in animals. Geochim. Cosmochim. Acta 42, 495–506. doi: 10.1016/0016-7037(78)90199-0
Dorado, S., Rooker, J. R., Wissel, B., and Quigg, A. (2012). Isotope baseline shifts in pelagic food webs of the Gulf of Mexico. Mar. Ecol. Prog. Series 464, 37–49. doi: 10.3354/meps09854
Emeis, K. C., Mara, P., Schlarbaum, T., Möbius, J., Dähnke, K., Struck, U., et al. (2010). External N inputs and internal N cycling traced by isotope ratios of nitrate, dissolved reduced nitrogen, and particulate nitrogen in the eastern Mediterranean Sea. J. Geophys. Res. Biogeosci. 115:G04041.
Fernández-Carrera, A., Rogers, K. L., Weber, S. C., Chanton, J. P., and Montoya, J. P. (2016). Deep Water Horizon oil and methane carbon entered the food web in the Gulf of Mexico. Limnol. Oceanogr. 61, S387–S400.
Fox, J., and Weisberg, S. (2019). An R Companion to Applied Regression, 3rd Edn. Thousand Oaks CA: Sage.
Gartner, J. V. Jr. (1987). The lanternfishes (Pisces: Myctophidae) of the eastern Gulf of Mexico. Fish. Bull. US 85, 81–98.
Gartner, J. V. (1991). Life histories of three species of lanternfishes (Pisces: Myctophidae) from the eastern Gulf of Mexico. Mar. Biol. 111, 11–20. doi: 10.1007/bf01986339
Gloeckler, K., Choy, C. A., Hannides, C. C., Close, H. G., Goetze, E., Popp, B. N., et al. (2018). Stable isotope analysis of micronekton around Hawaii reveals suspended particles are an important nutritional source in the lower mesopelagic and upper bathypelagic zones. Limnol. Oceanogr. 63, 1168–1180. doi: 10.1002/lno.10762
Hannides, C. C., Popp, B. N., Choy, C. A., and Drazen, J. C. (2013). Midwater zooplankton and suspended particle dynamics in the North Pacific Subtropical Gyre: a stable isotope perspective. Limnol. Oceanogr. 58, 1931–1946. doi: 10.4319/lo.2013.58.6.1931
Hopkins, T. L., and Baird, R. C. (1985). Feeding ecology of four hatchetfishes (Sternoptychidae) in the eastern Gulf of Mexico. Bull. Mar. Sci. 36, 260–277.
Hopkins, T. L., and Gartner, J. V. (1992). Resource-partitioning and predation impact of a low-latitude myctophid community. Mar. Biol. 114, 185–197. doi: 10.1007/bf00349518
Hopkins, T. L., Sutton, T. T., and Lancraft, T. M. (1996). The trophic structure and predation impact of a low latitude midwater fish assemblage. Prog. Oceanogr. 38, 205–239. doi: 10.1016/s0079-6611(97)00003-7
Hothorn, T., Bretz, F., and Westfall, P. (2008). Simultaneous inference in general parametric models. Biometrical J. 50, 346–363. doi: 10.1002/bimj.200810425
Irigoien, X., Klevjer, T. A., Røstad, A., Martinez, U., Boyra, G., Acuña, J. L., et al. (2014). Large mesopelagic fishes biomass and trophic efficiency in the open ocean. Nat. Commun. 5:3271.
Johnston, M. W., Milligan, R. J., Easson, C. G., DeRada, S., English, D. C., Penta, B., et al. (2019). An empirically validated method for characterizing pelagic habitats in the Gulf of Mexico using ocean model data. Limnol. Oceanogr. Methods 17, 362–375.
Lancraft, T. M., Hopkins, T. L., and Torres, J. J. (1988). Aspects of the ecology of the mesopelagic fish Gonostoma elongatum(Gonostomatidae, Stomiiformes) in the eastern Gulf of Mexico. Mar. Ecol. Prog. Series Oldendorf. 49, 27–40. doi: 10.3354/meps049027
Longhurst, A. R., Bedo, A. W., Harrison, W. G., Head, E. J. H., and Sameoto, D. D. (1990). Vertical flux of respiratory carbon by oceanic diel migrant biota. Deep Sea Res. Part A Oceanogr. Res. Papers 37, 685–694. doi: 10.1016/0198-0149(90)90098-g
McClain-Counts, J. P., Demopoulos, A. W., and Ross, S. W. (2017). Trophic structure of mesopelagic fishes in the Gulf of Mexico revealed by gut content and stable isotope analyses. Mar. Ecol. 38:e12449. doi: 10.1111/maec.12449
McClelland, J. W., and Montoya, J. P. (2002). Trophic relationships and the nitrogen isotopic composition of amino acids in plankton. Ecology 83, 2173–2180. doi: 10.1890/0012-9658(2002)083[2173:tratni]2.0.co;2
McEachran, J. D., and Fechhelm, J. D. (1998). Fishes of the Gulf of Mexico, Volume 1: Myxiniformes to Gasterosteiformes. Austin: University of Texas Press, 1120.
Mengerink, K. J., Van Dover, C. L., Ardron, J., Baker, M., Escobar-Briones, E., Gjerde, K., et al. (2014). A call for deep-ocean stewardship. Science 344, 696–698. doi: 10.1126/science.1251458
Ménard, F., Benivary, H. D., Bodin, N., Coffineau, N., Le Loc’h, F., Mison, T., et al. (2014). Stable isotope patterns in micronekton from the Mozambique Channel. Deep Sea Res. Part II Top. Stud. Oceanogr. 100, 153–163. doi: 10.1016/j.dsr2.2013.10.023
Milligan, R. J., Bernard, A. M., Boswell, K. M., Bracken-Grissom, H. D., D’Elia, M. A., DeRada, S., et al. (2018). The application of novel research technologies by the deep pelagic nekton dynamics of the Gulf of Mexico (DEEPEND) consortium. Mar. Technol. Soc. J. 52, 81–86. doi: 10.4031/mtsj.52.6.10
Minagawa, M., and Wada, E. (1984). Stepwise enrichment of 15N along food chains: further evidence and the relation between δ15N and animal age. Geochim. Cosmochim. Acta 48, 1135–1140. doi: 10.1016/0016-7037(84)90204-7
Mintenbeck, K., Jacob, U., Knust, R., Arntz, W. E., and Brey, T. (2007). Depth-dependence in stable isotope ratio δ15N of benthic POM consumers: the role of particle dynamics and organism trophic guild. Deep Sea Res. Part I Oceanogr. Res. Papers 54, 1015–1023. doi: 10.1016/j.dsr.2007.03.005
Montoya, J. P., Carpenter, E. J., and Capone, D. G. (2002). Nitrogen fixation and nitrogen isotope abundances in zooplankton of the oligotrophic North Atlantic. Limnol. Oceanogr. 47, 1617–1628. doi: 10.4319/lo.2002.47.6.1617
Moteki, M., Arai, M., Tsuchiya, K., and Okamoto, H. (2001). Composition of piscine prey in the diet of large pelagic fish in the eastern tropical Pacific Ocean. Fish. Sci. 67, 1063–1074. doi: 10.1046/j.1444-2906.2001.00362.x
Murawski, S. A., Hollander, D. J., Gilbert, S., and Gracia, A. (2020). “Deepwater oil and gas production in the Gulf of Mexico and related global trends,” in Scenarios and Responses to Future Deep Oil Spills, eds S. Murawski et al. (Cham: Springer), 16–32. doi: 10.1007/978-3-030-12963-7_2
Nelson, J. S., Grande, T. C., and Wilson, M. V. (2016). Fishes of the World. Hoboken, NJ: John Wiley & Sons.
Pakhomov, E. A., Henschke, N., Hunt, B. P., Stowasser, G., and Cherel, Y. (2019). Utility of salps as a baseline proxy for food web studies. J. Plankton Res. 41, 3–11. doi: 10.1093/plankt/fby051
Parzanini, C., Parrish, C. C., Hamel, J. F., and Mercier, A. (2017). Trophic ecology of a deep-sea fish assemblage in the Northwest Atlantic. Mar. Biol. 164:206.
Peterson, B. J., and Fry, B. (1987). Stable isotopes in ecosystem studies. Annu. Rev. Ecol. Syst. 18, 293–320. doi: 10.1146/annurev.es.18.110187.001453
Popp, B. N., Graham, B. S., Olson, R. J., Hannides, C. C., Lott, M. J., López−Ibarra, G. A., et al. (2007). Insight into the trophic ecology of yellowfin tuna, Thunnus albacares, from compound−specific nitrogen isotope analysis of proteinaceous amino acids. Terrestrial Ecol. 1, 173–190.
Post, D. M. (2002). Using stable isotopes to estimate trophic position: models, methods, and assumptions. Ecology 83, 703–718. doi: 10.1890/0012-9658(2002)083[0703:usitet]2.0.co;2
Ramirez-Llodra, E., Tyler, P. A., Baker, M. C., Bergstad, O. A., Clark, M. R., Escobar, E., et al. (2011). Man and the last great wilderness: human impact on the deep sea. PLoS One 6:e22588. doi: 10.1371/journal.pone.0022588
Richards, T. M., Gipson, E. E., Cook, A., Sutton, T. T., and Wells, R. D. (2018). Trophic ecology of meso-and bathypelagic predatory fishes in the Gulf of Mexico. ICES J. Mar. Sci. 76, 662–672. doi: 10.1093/icesjms/fsy074
Romero-Romero, S., Choy, C. A., Hannides, C. C., Popp, B. N., and Drazen, J. C. (2019). Differences in the trophic ecology of micronekton driven by diel vertical migration. Limnol. Oceanogr. 64, 1473–1483. doi: 10.1002/lno.11128
Rooker, J. R., Kitchens, L. L., Dance, M. A., Wells, R. D., Falterman, B., and Cornic, M. (2013). Spatial, temporal, and habitat-related variation in abundance of pelagic fishes in the Gulf of Mexico: potential implications of the Deepwater Horizon oil spill. PLoS one 8:e76080. doi: 10.1371/journal.pone.0076080
Shaffer, J. P. (1986). Modified sequentially rejective multiple test procedures. J. Am. Stat. Assoc. 81, 826–831. doi: 10.1080/01621459.1986.10478341
Sutton, T. T., Cook, A. B., Moore, J. A., Frank, T., Judkins, H., Vecchione, M., et al. (2017). Inventory of Gulf Oceanic Fauna Data including Species, Weight, and Measurements. Meg Skansi Cruises from Jan. 25–Sept. 30, 2011 in the Northern Gulf of Mexico. Distributed by: Gulf of Mexico Research Initiative Information and Data Cooperative (GRIIDC). Corpus Christi, TX: Harte Research Institute, Texas A &M University.
Sutton, T. T., and Hopkins, T. L. (1996). Trophic ecology of the stomiid (Pisces: Stomiidae) fish assemblage of the eastern Gulf of Mexico: strategies, selectivity and impact of a top mesopelagic predator group. Mar. Biol. 127, 179–192. doi: 10.1007/bf00942102
Thurber, A. R., Sweetman, A. K., Narayanaswamy, B. E., Jones, D. O., Ingels, J., and Hansman, R. L. (2014). Ecosystem function and services provided by the deep sea. Biogeosciences 11, 3941–3963. doi: 10.5194/bg-11-3941-2014
Valls, M., Olivar, M. P., de Puelles, M. F., Molí, B., Bernal, A., and Sweeting, C. J. (2014). Trophic structure of mesopelagic fishes in the western Mediterranean based on stable isotopes of carbon and nitrogen. J. Mar. Syst. 138, 160–170. doi: 10.1016/j.jmarsys.2014.04.007
Vereshchaka, A. L., Lunina, A. A., and Sutton, T. (2019). Assessing deep-pelagic shrimp biomass to 3000 m in the Atlantic ocean and ramifications of upscaled global biomass. Sci. Rep. 9:5946.
von Harbou, L., Dubischar, C. D., Pakhomov, E. A., Hunt, B. P., Hagen, W., and Bathmann, U. V. (2011). Salps in the Lazarev Sea, Southern Ocean: I. Feeding dynamics. Mar. Biol. 158, 2009–2026. doi: 10.1007/s00227-011-1709-4
Vukovich, F. M., and Crissman, B. W. (1986). Aspects of warm rings in the Gulf of Mexico. J. Geophys. Res. Oceans 91, 2645–2660. doi: 10.1029/jc091ic02p02645
Wada, E., Mizutani, H., and Minagawa, M. (1991). The use of stable isotopes for food web analysis. Crit. Rev. Food Sci. Nutr. 30, 361–371. doi: 10.1080/10408399109527547
Webb, T. J., Berghe, E. V., and O’Dor, R. (2010). Biodiversity’s big wet secret: the global distribution of marine biological records reveals chronic under-exploration of the deep pelagic ocean. PLoS One 5:e10223. doi: 10.1371/journal.pone.0010223
Wells, R. D., Rooker, J. R., Quigg, A., and Wissel, B. (2017). Influence of mesoscale oceanographic features on pelagic food webs in the Gulf of Mexico. Mar. Biol. 164:92.
Winemiller, K. O., and Polis, G. A. (1996). “Food webs: what can they tell us about the world?” in Food Webs, eds G. A. Polis and K. O. Winemiller (Boston, MA: Springer), 1–22. doi: 10.1007/978-1-4615-7007-3_1
Yarnes, C. T., and Herszage, J. (2017). The relative influence of derivatization and normalization procedures on the compound−specific stable isotope analysis of nitrogen in amino acids. Rapid Commun. Mass Spectrom. 31, 693–704. doi: 10.1002/rcm.7832
Keywords: micronekton, stable isotope analysis, mesopelagic, bathypelagic, Gulf of Mexico, lanternfish, hatchetfish, bristlemouths
Citation: Richards TM, Sutton TT and Wells RJD (2020) Trophic Structure and Sources of Variation Influencing the Stable Isotope Signatures of Meso- and Bathypelagic Micronekton Fishes. Front. Mar. Sci. 7:507992. doi: 10.3389/fmars.2020.507992
Received: 28 October 2019; Accepted: 28 September 2020;
Published: 05 November 2020.
Edited by:
Luis Cardona, University of Barcelona, SpainReviewed by:
Jeffrey C. Drazen, University of Hawai‘i at Mânoa, United StatesAinhoa Bernal Bajo, Institute of Marine Sciences, Spanish National Research Council, Spain
Copyright © 2020 Richards, Sutton and Wells. This is an open-access article distributed under the terms of the Creative Commons Attribution License (CC BY). The use, distribution or reproduction in other forums is permitted, provided the original author(s) and the copyright owner(s) are credited and that the original publication in this journal is cited, in accordance with accepted academic practice. No use, distribution or reproduction is permitted which does not comply with these terms.
*Correspondence: Travis M. Richards, Travis.Richards3@gmail.com