Stable Isotope (δ13C, δ15N, δ18O, δD) Composition and Nutrient Concentration of Red Sea Primary Producers
 Carlos M. Duarte1*
  Antonio Delgado-Huertas2
  Andrea Anton1
  Paloma Carrillo-de-Albornoz1
  Daffne C. López-Sandoval1
  Susana Agustí1
  Hanan Almahasheer3
  Núria Marbá4
  Iris E. Hendriks4
  Dorte Krause-Jensen5,6
  Neus Garcias-Bonet1
- 1Red Sea Research Center, King Abdullah University of Science and Technology, Thuwal, Saudi Arabia
- 2Instituto Andaluz de Ciencias de la Tierra, CSIC-UGR, Armilla, Spain
- 3Department of Biology, College of Science, Imam Abdulrahman Bin Faisal University, Dammam, Saudi Arabia
- 4Global Change Research Group, Mediterranean Institute for Advanced Studies (IMEDEA, CSIC-UIB), Esporles, Spain
- 5Department of Bioscience, Aarhus University, Silkeborg, Denmark
- 6Department of Bioscience, Arctic Research Centre, Aarhus University, Aarhus, Denmark
Measurements of isotopic composition of marine primary producers are a valuable tool to follow and trace the source and cycling of organic matter in the marine systems, as well to describe the physiological status of aquatic photosynthetic organisms. Although stable isotope data abounds in the literature, relatively limited information regarding the isotopic signatures of marine primary producers is available for the Red Sea. Here we present data on carbon concentration (and nitrogen when possible) of phytoplankton, macroalgae, seagrasses, mangroves and salt-marsh plants, and examine how their isotopic signatures differed among plant types across a north-south gradient in the Red Sea. We also tested the potential use of deuterium, δD, to distinguish among primary producers whose carbon isotopic values may overlap. Our findings showed a clear differentiation of carbon and nitrogen content between the different groups of primary producers, as well as between species. Seagrasses and mangroves had on average larger carbon (30 and 49% of C, respectively) and nitrogen content (1.8% N) than other groups. In terms of stable carbon isotopes, seagrasses, and macroalgae tended to be heavier (−7.3 and −13.3%0, respectively) than halophytes, mangroves, and phytoplankton, which showed statistically similar and lighter δ13C values (between −24 and −26%0). There was a tendency for the nitrogen isotopic composition of seagrass and macroalgae to become lighter from the southern to the northern Red Sea, in parallel to a decline in nitrogen concentration in the tissues, indicative of a higher dependence of nitrogen fixation as a source of nitrogen toward the more oligotrophic northern Red Sea. Our results showed an overlap in the δ13C and δ15N values between macroalgae and seagrasses; however, their δD values were significantly different (seagrasses −56.6 ± 2.8%0 and macroalgae −95.7 ± 3.4%0). This remarkable difference offers a promising alternative for ecological studies where a similar range of isotopic values could mask different potential sources.
Introduction
The stable isotope composition of marine primary producers is a fundamental property that informs of their physiology and status (Farquhar et al., 1989; Descolas-Gros and Fontungne, 1990; Maberly et al., 1992; Hemminga and Mateo, 1996; Burkhardt et al., 1999), their sources of nitrogen (Dawson et al., 2002), and allows tracing their contribution in both supplying carbon to the marine food web (Peterson and Fry, 1987) and depositing carbon to the sediment (Kennedy et al., 2010). While in continental plants carbon isotope composition depends mainly of specific enzymatic mechanisms of primary production (e.g., C3, C4, or CAM) and WUE (Water Use Efficiency), in marine plants, all C3 (RuBisCO) depends on the supply and source of carbon (CO2 or HCO3-) and specific mechanisms of primary production (e.g., C3 or C4), light level, plant size and growth rate, among others (Farquhar et al., 1989; Descolas-Gros and Fontungne, 1990; Maberly et al., 1992; Hemminga and Mateo, 1996; Burkhardt et al., 1999; Raven et al., 2002). As such, the isotope composition differs significantly from phytoplankton, with δ13C signatures of about −22%0, to seagrasses, often growing under CO2-limitation leading to heavy isotopic signatures with values of around −8%0 (Hemminga and Mateo, 1996). Nitrogen isotopes give information of the source of nitrogen, with nitrogen fixation characterized by values similar to atmospheric N values (i.e., δ15N around −2 to +1%0, Wada and Hattori, 1976), comparable to those derived from fertilizer applications (McClelland et al., 1997), and recycled nitrogen, including heavy (+5%0; Liu et al., 1996) nitrogen isotopes in nitrate in deep ocean waters, and even heavier isotopes associated with human and animal waste inputs (+10 to +20%0, McClelland et al., 1997). Recently, deuterium isotopes (δD) were identified as a way to improve the discrimination of sources of organic matter in food web studies, as the deuterium isotopic signature (δD) of marine plants varies greatly, although the reasons for this variability are not entirely understood (Wilkinson et al., 2015).
Whereas, stable isotope data abound for many ecosystems, these are relatively sparse for the Red Sea, including reports on the stable isotope composition of seston and coral reef biota (Kurten et al., 2014), and stable C and N isotope composition of primary producers in the central Red Sea (Almahasheer et al., 2017).
Here we report the stable isotope composition (δ13C, δ15N, δ18O, and δD) and carbon and nitrogen concentration of primary producers (phytoplankton, macroalgae, seagrass, mangroves, and salt-marsh plants) in the Red Sea. We do so by reporting the results of 597 samples collected along 93 sites distributed from 17.3° North to 28.1° South, and including 37 coastal plant species (8 seagrass species, 23 macroalgae species, 1 mangrove species, and 5 salt-marsh species) as well as mixed phytoplankton communities sampled as seston. We then examined whether their stable isotope signatures differ among plant types, species and across latitude in the Red Sea. Additionally, we assessed the potential of Deuterium isotopes, δD, to discriminate between macroalgae and seagrass, for which proximity in carbon isotope composition often makes their source discrimination difficult based on C isotopes (Kennedy et al., 2010). Specifically, we test the following hypothesis, (1) that the existence of a south to north gradient in nutrient supply and oligotrophy, with nutrient inputs occurring from the south and the waters becoming more oligotrophic toward the north (e.g., Ngugi et al., 2012), should be reflected in a gradient in nitrogen isotopic composition, from positive values in the south to values near 0, consistent with a prevalence of nitrogen fixation (e.g., Hemminga and Mateo, 1996; Kennedy et al., 2004; Papadimitriou et al., 2005) toward the north; (2) that mangroves, with a C3 photosynthetic pathway are likely to have the lightest carbon isotopic composition, whereas seagrasses, which are often carbon-limited, should show the heavier isotopic values (e.g., Hemminga and Mateo, 1996); and (3) that carbon and nitrogen isotopic values are likely to overlap between seagrass and macroalgae, in particular, so that additional isotopes, such as oxygen, δ18O, and deuterium isotopes, δD (e.g., Wilkinson et al., 2015), will be required to be able to discriminate organic matter derived from these primary producers in trophic studies.
Methods
Study Site
We sampled 93 stations in five habitats along the Red Sea including 16 mangrove stations, 2 saltmarsh stations, 33 seagrass stations, 36 coral reef stations, and 6 pelagic open water stations (Figure 1).
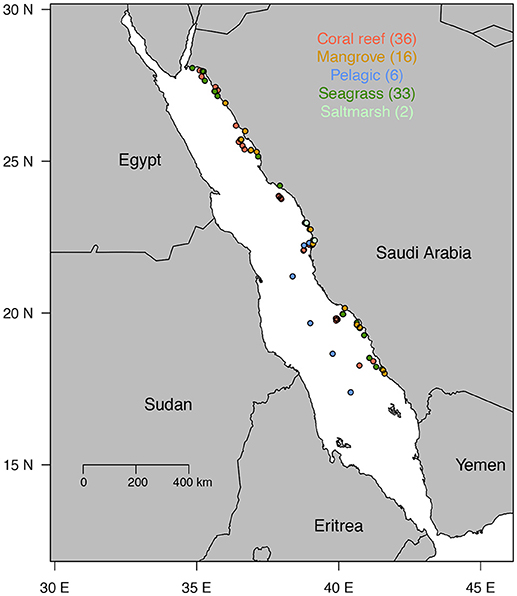
Figure 1. Map indicating the study sites. Colors represent the different types of habitats with in parenthesis the number of sites surveyed for each habitat.
Coastal Habitats Sampling
Coastal habitats were sampled during four coastal cruises onboard the R/V Thuwal on February 2016, January 2017, March 2017, and July 2017 [for further details on cruises and survey methods see (Garcias-Bonet and Duarte, 2017; Anton et al., 2018a)]. Those stations located in the central Red Sea were sampled using small boats on November 2014, February 2016, January 2017, March 2017, and July 2017. We sampled one mangrove species (Avicennia marina), 5 halophyte species (Anabasis setifera, Salicornia sp., Suaeda monoica, Zygophyllumm cocenium, and one unknown species), 8 species of seagrasses (Cymodocea nodosa, Enhalus acoroides, Halodule uninervis, Halophila decipiens, Halophila ovalis, Halophila stipulacea, Thalassia hemprichii, and Thalassodendron ciliatum) and 23 species of macroalgae (Amphiroa fragilissima, Caulerpa racemosa, Caulerpa serrulata, Caulerpa sp., Caulerpa taxifolia, Colpomenia sinuosa, Dictyosphaeria cavernosa, Dictyota sp., Galaxaura sp., a green filamentous alga, Halimeda tuna, Halymenia sp., Lobophora variegata, Mesophylium mesomorphum, Padina pavonica, Padina sp., Sargassum ilicifolium, Sargassum sp., Turbinaria ornata, Tydemania expeditionis, Udotea flabellum, and 2 unknown macroalgal species) (Table 1). At each station, we collected macrophyte blades from the most common macrophyte species. We sampled 4 mangrove leaves, 4 halophyte leaves, 4 seagrass shoots for the small size seagrass species, 4 second-youngest leaves for the larger-sized seagrass species, and 4 blades for each macroalgal species. The samples were transported onboard or back to the laboratory and processed immediately.

Table 1. Summary with information of the 93 surveyed study sites in the Arabian Red Sea.
Coastal Habitats Sample Processing
Seagrass and macroalgae blades were rinsed with seawater collected from the same location and epiphytes were carefully removed. Mangrove, halophyte, seagrass, and macroalgae blades were dried at 60°C until constant weight was reached. Dried macrophyte tissue samples were ground and acidified to remove inorganic carbon before the carbon (C) and nitrogen (N) content and stable isotopic composition (δ13C, δ15N, δ18O, and δD) analyses. Specifically, carbonates were removed from macrophyte tissues by exposing the samples to chloride baths and vapors (1M HCl) overnight after which samples were re-dried at 60°C.
Macrophyte Carbon and Nitrogen Content and Isotopic Composition (δ13C, δ15N, δ18O, and δD) Analyses
Elemental C and N content analysis of macrophyte blade samples were performed with an Organic Elemental Analyser Flash 200 (Thermo Fisher Scientific, Massachusetts, USA). The accuracy was <0.2, <0.1, and <0.08% for C, N, and H, respectively. The isotopic composition analyses of macrophyte blades were performed by elemental analysis isotope ratio mass spectrometry at the UH Hilo Analytical Laboratory (USA) and the Stable Isotope Laboratory of the Instituto Andaluz de Ciencias de la Tierra (CSIC-UGR, Spain) and by cavity ring-down spectroscopy at the Tarek Ahmed Juffali Research in Red Sea Ecology Laboratory (KAUST, Saudi Arabia). Stable isotope (δ13C and δ15N) analysis of macrophyte samples collected on November 2014 were performed on Delta V mass spectrometer with Conflo III coupled to a Costech 4010 elemental analyzer (Thermo Scientific, Massachusetts, USA). Isotopic composition (δ13C, δ15N, δ18O, and δD) analyses of macrophyte samples collected from February 2016 to March 2017 were performed on a Carlo Elba NC1500 (Milan, Italy) elemental analyzer coupled on-line via a ConFlow III with a Delta Plus XP (Thermo-Finnigan, Bremen, Germany) mass spectrometer (EA-IRMS). Commercial CO2 and N2 were used as the internal standard for the C and N isotopic analyses.
For δ13C analysis, we used internal standards of −30.63 and −11.65%0 (V-PDB), and for δ15N analysis, we used internal standards of −1.02 and +16.01%0 (AIR). The analytical precision was better than ±0.1%0 for δ 15N and δ 13C, calculated from standards systematically interspersed in sample batches and after the correction of the mass spectrometer daily drift. The standard for reporting C measurements is V-PDB (Vienna-PDB) and for N measurements atmospheric nitrogen (AIR).
Isotopic composition (δ13C) analysis of macrophyte samples collected on July 2017 was performed by cavity ring-down spectroscopy (CM-CRDS G2201-I, Picarro, California, USA) attached to a combustion module (Costech Analytical Technologies Inc., California, USA). Dried and acidified macrophyte tissue samples were encapsulated in tin capsules. We used internal standards and three certified solid C standards from the Reston Stable Isotope Laboratory (United States Geological Survey, USGS, Virginia, USA): USG62 (Caffeine, δ 13C = −14.79 %0), USG40 (glutamic acid, δ 13C = −26.39 %0), and USG41a (L- glutamic acid enriched in 13C, δ 13C = +36.55%0). The analytical precision and accuracy of δ13C measurements were ±0.13 and ±0.69%0, respectively.
The stable isotopic composition was calculated as:
where:
For the δ18O and δD analysis of macrophyte tissues, samples were loaded in silver capsules, subjected to vacuum (10−3 mbar) and heat (70°C) for 48 h in a metallic carousel. Then, argon was introduced to reach atmospheric pressure, avoiding any contamination with atmospheric water vapor. Samples were passed through a ceramic column containing a glassy carbon tube at 1450°C to produce H2 and CO gases (Sharp et al., 2001) in a high-temperature reactor (TC/EA) coupled on-line via a ConFlow III interface to a Delta XP isotope ratio mass spectrometer (Thermo-Finnigan, Bremen). These gases were separated by chromatography using a helium carrier gas stream. To avoid memory effects, each sample was analyzed 6 times, discarding the first 3 analyses and averaging the last 3 measurements. Commercial CO and H2 bottles and different standards, previously calibrated vs. V-SMOW (IAEA international standards), were used as internal standards for the hydrogen isotopic analysis. The analytical precision and accuracy of δ18O and δD were ±0.3 and ±1%0, respectively, calculated from standards systematically interspersed in sample batches and after the correction of the mass spectrometer daily drift. The standard for reporting oxygen and hydrogen is V-SMOW (Vienna Standard Mean Ocean Water).
Pelagic Open Water Sampling
Red Sea pelagic open water samples were collected during an offshore scientific cruise on board the R/V Al Azizi along a latitudinal transect (17–21° N) on March 2018 and from a station located off-shore the central Red Sea, between May to December 2017. During the transect, water samples were taken at five different depths (100, 60, 22, 8, and 1% of the photosynthetic active radiation, PAR) using a multi-sample/carousel rosette system equipped with 12 Niskin bottles. The samples from the central Red Sea were collected from surface waters (~2 m) with a manually deployed Niskin bottle.
Pelagic Open Water Sample Processing and Carbon Isotope (δ13C) Analysis
After water collection, a 1-L sample from each depth was filtered onto a pre-combusted 15 mm Whatman GF/F filter and then placed in a small Petri dishes that remained overnight with 100–150 μL of 50% HCl to remove inorganic carbonates. Analyses were performed on desiccated filters, for 24 h, in a desiccator. Filters were encapsulated in tin capsules, and carbon isotope (δ13C) composition was analyzed by cavity ring-down spectroscopy (CM-CRDS G2201-I, Picarro, California, USA) attached to a combustion module (Costech Analytical Technologies Inc., California, USA). Cavity ring-down spectrometer calibration was performed as described in the macrophyte analysis section. The stable isotopic composition was calculated as described in the macrophyte analysis section.
Statistical Analyses
Differences among types of primary producers were tested using ANOVA, with significant differences between specific groups assessed using Tukey post-hoc HSD test, and the relationships between pairs of variables were assessed using linear regression analysis, after checking the compliance of the data with the assumptions of the analysis. Discriminant analysis was used to test the power of combinations of stable isotopes to resolve differences between primary producer types, specifically seagrass and macroalgae. Principal component analysis was used to explore the contribution of the different tissue properties measured (concentration and isotopic composition of elements) to variability within and among primary producer groups. All analyses were conducted in the JMP vs. 13 statistical analysis software.
Results
The nitrogen concentration in the plant tissues increased with increasing carbon concentration (Figure 2, R2 = 0.42, P < 0.0001), and the different primary producer types differed significantly both in carbon and nitrogen concentration (Table 2, ANOVA, P < 0.0001). The carbon and nitrogen concentrations increased from macroalgae, which had the lowest C and N concentration, to seagrass and mangroves, which had the highest C and N concentrations (Table 2). Seagrass had the lowest C/N ratio, followed by macroalgae, while halophytes and mangroves had similar high C/N ratios (Table 2, ANOVA and Tukey post-hoc HSD test, P < 0.0001).
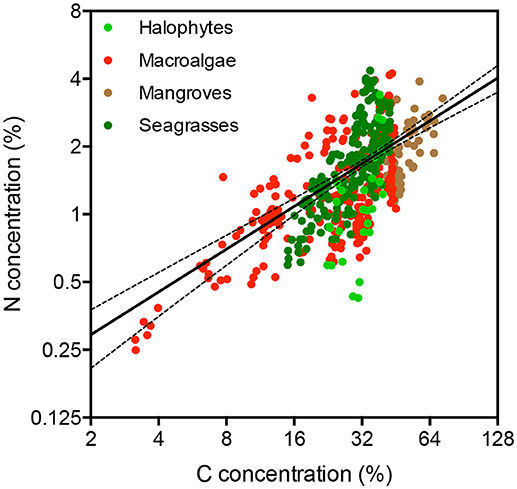
Figure 2. Relationship between nitrogen and carbon concentration in the tissues of Red Sea mangroves (brown dots), halophytes (light green dots), seagrasses (dark green dots), and macroalgae (red dots). The solid line shows the fitted regression line across all plant types ±95% CI of the slope.
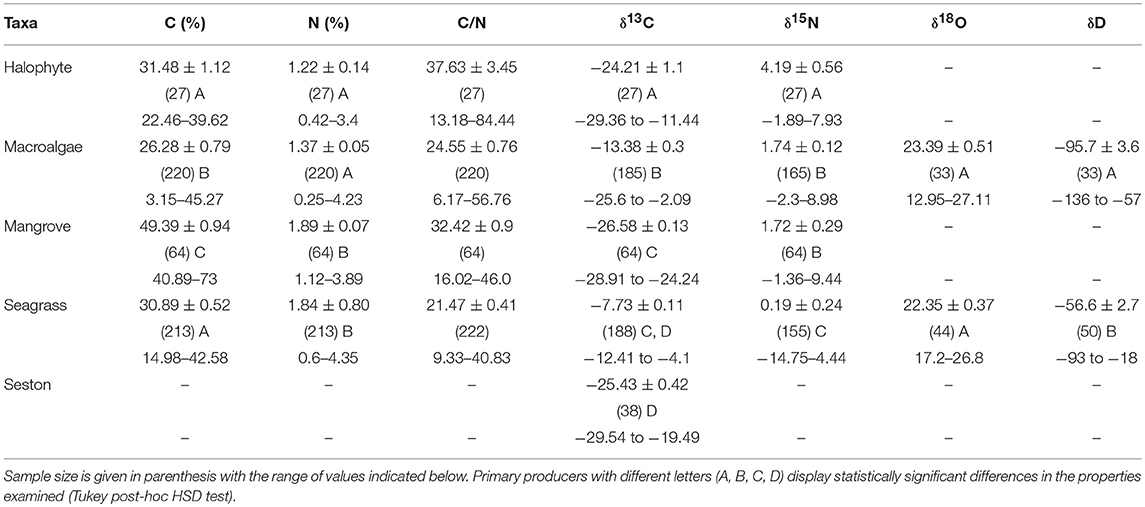
Table 2. Mean ± SE of the concentration of carbon (C) and nitrogen (N) and the C/N and the stable isotopes of carbon (δ13C), nitrogen (δ15N), oxygen (δ18O), and hydrogen (δD) measured in the blades of the different taxa of primary producers.
Macroalgae and, particularly, seagrasses presented heavy carbon isotopic composition, while seston, halophytes, and mangroves had similar light values (Table 2, ANOVA, P < 0.0001, and Tukey post-hoc HSD test, P < 0.01). Seagrasses had the lightest nitrogen isotopic composition, whereas macroalgae and mangroves had similar, intermediate nitrogen isotopic composition and halophytes had the heaviest composition (Table 2, ANOVA, P < 0.0001, and Tukey post-hoc HSD test, P < 0.0001). Oxygen isotopic composition, δ18O, ranged broadly among seagrass and macroalgae, but did not differ significantly among these two groups of primary producers (Table 2). Carbon and nitrogen isotopes were analyzed using two different instruments each. Whereas standards were used to ensure the accuracy of results, the differences in instrumentation may have introduced some bias in the comparison of isotopic values among primary producers (Mill et al., 2008). However, provided the broad ranges of isotopic values covered (Tables 1, 2), these possible biases are unlikely to affect the comparisons drawn here.
Deuterium isotopes clearly discriminated seagrasses (−56.6 ± 2.8%0) from the lighter δD values of macroalgae (−95.7 ± 3.4%0), with a mean difference in excess of 39%0 units (Table 2, ANOVA, P < 0.0001). The combined use of δD and δ13C isotopes improved the capacity to discriminate between seagrass and macroalgae (Discriminant analysis, R2 = 0.72, misclassification error 9.6%, Figure 3). Indeed, δD and δ13C isotopes thresholds corresponding to the lower values found here for seagrass leaves (δD >−92.89%0 and δ13C >−9.93%0) largely discriminates between seagrass (heavier isotopic composition) and macroalgae tissues (lighter isotopic composition), including only 4 (i.e., 12%) seaweed samples in isotopic ranges characterized by isotopic signatures (δD >−92.89%0 and δ13C >−9.93%0) above those thresholds (Figure 3).
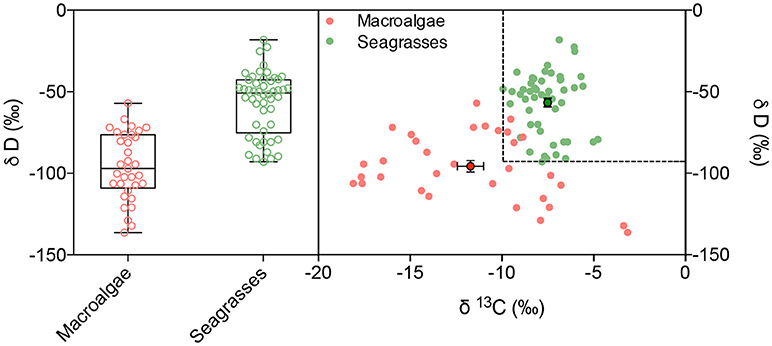
Figure 3. Deuterium stable isotope concentration (left) and the relationship between δ13C and δD (right) on the blades of macroalgae and seagrasses, indicated in red and green, respectively. Dashed lines indicate the minimum values of δ13C and δD for seagrass tissues. Mean ± SE values of δ13C and δD values are shown with dots and error bars.
Macroalgal N was significantly lower for macroalgae growing in coral reefs than for those growing in seagrass meadows or mangrove forests (ANOVA and Tukey HSD test, P < 0.001), whereas their carbon concentration was the highest when growing in mangrove forests (ANOVA and Tukey HSD test, P < 0.001). There was no difference in the C, N, and D isotopic composition of macroalgae with habitat (P > 0.05). There was a tendency for the nitrogen isotopic composition of seagrass and macroalgae, but not that of mangroves, to become lighter from the southern to the northern Red Sea, in parallel to a decline in nitrogen concentration of the tissues, indicative of a higher dependence of nitrogen fixation as a source of nitrogen toward the more oligotrophic northern Red Sea (Figure 4).
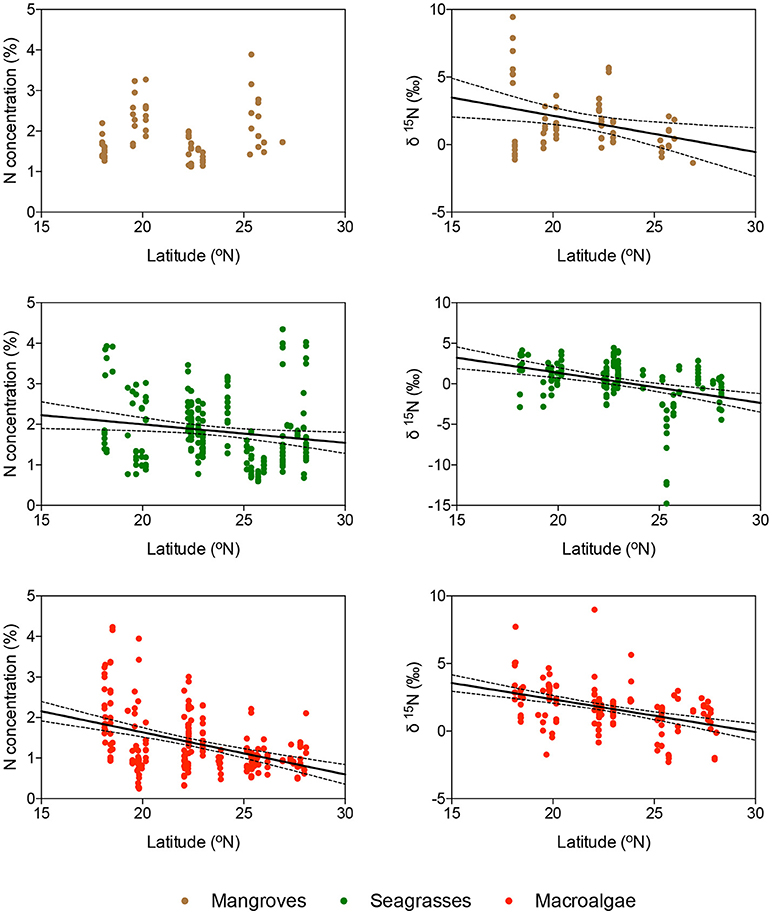
Figure 4. Relationship between latitude and the concentration of nitrogen (panels on the left) and the δ15N composition (panels on the right) of the blades of (from top to bottom) mangroves, seagrasses, and macroalgae, indicated in brown, green, and red, respectively. Solid lines show the fitted linear regression equations and dotted lines show the 95% c.l. of the slope. Only significant regressions are shown.
Principal component analysis showed that the combination of carbon and nutrient concentration and stable isotope composition separated the different primary producers (Figure 5). The first principal component had the highest positive loadings for %C and %N and the most negative loadings for δ18O and δ13C, accounting for 36.1% of the variance in the data. The second principal component had the highest positive loadings for δD and %N and the most negative loadings for C/N and δ15N, accounting for 25.8% of the variance in the elemental composition of Red Sea primary producers (Figure 5).
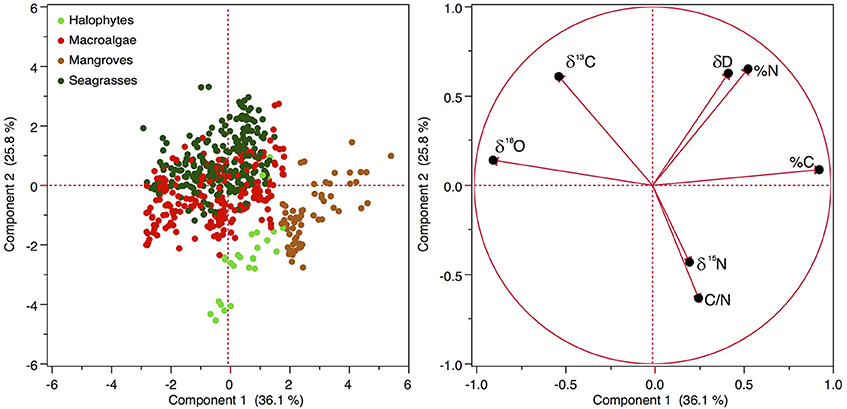
Figure 5. Principal component analysis of the 5 types of primary producers according to the concentration of the stable isotopes (δ13C, δ15N, δ18O, and δD) and carbon and nitrogen and the ratio C/N in the plant tissues. Seston samples were excluded from the analysis as it was missing δ18O and δD, so the loadings of seston on the axis are biased.
Much of the variability within plant types was attributable to differences among species. Nitrogen and carbon isotopes differed significantly among halophyte species (Figure 6). Carbon isotopes differed greatly between macroalgal species, which had similar nitrogen isotopic composition, except for Dystiosphaeria cavernosa, which had significantly lighter N isotopic composition than most other macroalgal species (Figure 6). Deuterium isotopes also differed significantly (P < 0.05) between macroalgal species. Seagrass species also differed significantly in C, N, and Deuterium isotopes, with Enhalus acoroides characterized by remarkably heavy carbon isotopic composition and H. uninervis having the heaviest deuterium isotope composition (Figure 6).
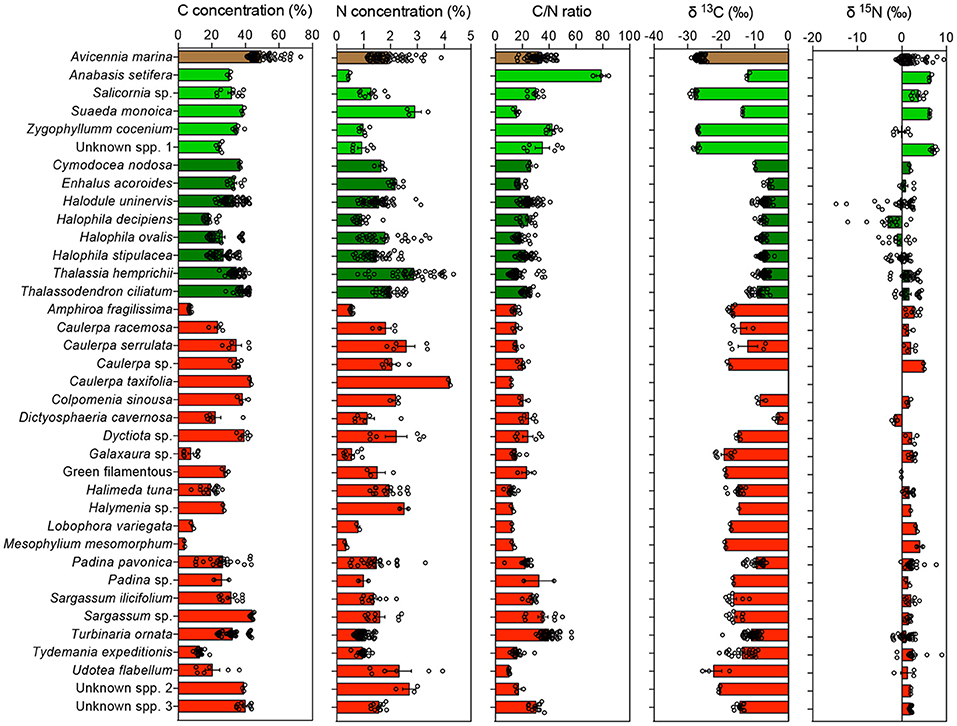
Figure 6. Mean ± SE of the concentration of carbon (C), the concentration of nitrogen (N), the C/N ratio, the carbon (δ13C), and nitrogen (δ15N) isotopic composition measured in the blades of the different species of primary producers, color-coded by taxa. Mangroves, halophytes, seagrasses, and macroalgae are indicated in brown, light green, dark green, and red, respectively. Empty dots indicate individual measurements for each species and location.
Discussion
The results provide a comprehensive resource on carbon and nitrogen of primary producers for isotopic studies in the Red Sea, and characterize the variability in C and N concentration, which was coupled across primary producers, and isotopic composition among plant types as well as within species among the same group, except mangroves, for which A. marina comprises over 99% of the Red Sea cover, and seston, for which species-specific analyses were not possible. Much of the variability within the different primary producers reported here was attributable to differences among species, but differences among types of primary producers were also important. However, seagrass and macroalgal nitrogen concentration tended to decline with increasing latitude, reflecting the south to north oligotrophication gradient derived from the role of the inflow of Indian Ocean waters through the Bab al Mandel straight as the main nutrient supply to the Red Sea (e.g., Ngugi et al., 2012). The variability in isotopic composition of Red Sea primary producers may, however, be larger than represented here, as variability may occur with depth and season (Fourqurean et al., 2007; Viana and Bode, 2015), which were not comprehensively sampled here.
Seagrasses tended to be isotopically heavy in terms of carbon, consistent with previous results (Hemminga and Mateo, 1996; Kennedy et al., 2004; Papadimitriou et al., 2005). This reflects the fact that their photosynthesis tends to be carbon-limited, and consequently, have less isotopic discrimination of 13C. In addition, almost all samples were collected in shallow waters, where most seagrass habitats are found in the Red Sea, and where seagrass carbon isotopic composition is expected to be heavier (e.g., Fourqurean et al., 2007). Their nitrogen isotopic composition suggests nitrogen fixation as the main source of nitrogen for these plants, in agreement with previous reports on seagrass stable N isotopic composition (Hemminga and Mateo, 1996; Kennedy et al., 2004; Papadimitriou et al., 2005; Garcias-Bonet et al., 2016). Nitrogen fixation rates are typically high in seagrass sediments, due to mutualistic or symbiotic association exists between the seagrasses and heterotrophic nitrogen fixers in the rhizosphere (Welsh, 2000), with additional, but much smaller, contributions of epiphytic diazotrophs (e.g., Moriarty and O'Donohue, 1993). The trend toward a lighter, closer to atmospheric signal, of the nitrogen isotopic composition of macroalgae and seagrass from south to north, in parallel with a decline in nitrogen concentration in the tissues, indicates that the importance of nitrogen fixation as a source of nitrogen increases toward the more oligotrophic waters of the northern Red Sea. A recent study from the UK also shows variation in the δ15N signal of seagrass tissue in response to exposure to eutrophication (Jones et al., 2018). The consistent latitudinal pattern of decline in δ15N signal of Red Sea primary producers, together with the parallel decline in nitrogen concentration on plant tissues, represents a isoscape (sensu Bowen, 2010) that can be used to predict or interpolate expected isotopic values at Red Sea locations not sampled here (Bowen, 2010).
The nitrogen isotopic composition of Red Sea seagrass ranged widely (−14.75 > δ15N < +4.44%0 vs. AIR) including some extremely negative values. High variability in the δ15N signal of seagrass tissue has been shown in the past, in particular in relation to eutrophication (Jones et al., 2018) and sewage inputs (δ15N > 6%0, Costanzo et al., 2001). None of the seagrass sampled here were collected near human populations, which are limited along the Saudi coast of the Red Sea, so sewage inputs are unlikely to affect seagrass δ15N values. Values approaching +5%0 (AIR) are characteristic of nitrate from deep ocean waters (Sigman et al., 1999, 2009), where NOx may exceed 20 μmol L−1 (Churchill et al., 2014; Zarokanellos et al., 2017), as well as waters dominated by recycled processes where an enrichment in 15N in the dissolved nitrate pool occurs due to Rayleigh fractionation by preferential uptake of 14N (Churchill et al., 2014). These positive values may also result from denitrification in oxygen-depleted waters (Somes et al., 2010) as a source of reduced nitrogen, which typically dominate in the seagrass rhizosphere, for seagrass (, ) since this process involves an important isotopic fractionation between 15 and 35%0 (Robinson, 2001). Likewise, nitrogen inputs with atmospheric dust deposition may also support negative isotopic values, as nitrogen isotopic values in adjacent desert areas are characterized by values ranging from −6.9 to +1.9%0 (Wankel et al., 2010). δ15N values next to zero or slightly positive are consistent with nitrogen fixation as the main nitrogen source for these plants, as often reported for seagrass tissues (Hemminga and Mateo, 1996; Kennedy et al., 2004; Papadimitriou et al., 2005; Garcias-Bonet et al., 2016). There was no relationship between the δ15N composition of the seagrass tissues and their C/N ratio, which were expected from relationships between nitrogen fixation rates, which affect the δ15N composition of the plants, and their C/N ratio reported in the past (Cook et al., 2015; Russell et al., 2016).
Seagrass, macroalgae, and mangroves showed a trend toward declining nitrogen isotopic values from south to north, spanning from positive (+3 to +15%0) values in the south to values around 0 to +1%0 in the Northern Red Sea (Figure 4). The positive values in the south correspond to nitrate inputs from the Indian Ocean (Brandes et al., 1998) through the Strait of Bab-EI-Mandab, specifically Gulf of Aden Intermediate Water, which inflow is higher during summer/autumn (Wafar et al., 2016). In contrast, the values near 0 in the Northern Red Sea signal at a prevalence of nitrogen fixation as a source of nitrogen.
Macroalgae overlapped with seagrass in both carbon and nitrogen isotopic composition but showed a broader range consistent with the greater diversity of phylogenetic form and physiology of this polyphyletic group. Hence, stable isotopes of C and N used elsewhere to apportion the sources of carbon in food webs (e.g., Peterson and Fry, 1987) and sediment carbon stocks (e.g., Kennedy et al., 2004; Papadimitriou et al., 2005), cannot discriminate seagrass from macroalgae-derived carbon in the Red Sea (e.g., Almahasheer et al., 2017). However, the exploratory analyses of deuterium isotopes conducted here confirmed earlier reports from lakes (Cole et al., 2011) and coastal studies (Wilkinson et al., 2015), in that deuterium isotopes can discriminate among primary producers that overlap in carbon isotope values. Indeed, deuterium isotopes differed significantly between Red Sea seagrass and macroalgae and, together with carbon isotopes, helped discriminate seagrass from macroalgae. Carbon isotopes combined with deuterium isotopes could, therefore, be useful in discriminating the sources of organic matter in food webs or sediment deposits. This requires extreme care for sediments, as any traces of water, which contains large amounts of deuterium, may bias the values. Hence, relatively long desiccation times are required for studies involving plant stem and sediment samples (West et al., 2006).
Mangroves, salt-marshes and seston had similar ranges of δ15N values but differed in δ13C values, with halophytes having in general heavier values (−29.36 to −11.44%0 vs. V-PDB) than mangroves (−28.91 to −24.24%0 vs. V-PDB) and seston (−29.54 to −19.49%0 vs. V-PDB). Whereas the nitrogen isotopic composition of seston was not resolved here, earlier analyses of Red Sea seston point at nitrogen isotopic values of, on average, +2 to + 4.8%0 (Kurten et al., 2014; Almahasheer et al., 2017), within the range found for halophytes and mangroves in this study (Table 2).
Overall, isotopic composition values of Red Sea primary producers were consistent with values reported elsewhere (Hemminga and Mateo, 1996; Kennedy et al., 2004; Papadimitriou et al., 2005; Fourqurean et al., 2007). However, seston values tended to show isotopically-lighter carbon values compared to previous reports while those of seagrass tended toward the isotopically-heavier range of values reported for seagrasses in the past. The exploratory evaluation of deuterium isotopes confirms that its use holds promise to overcome the limitations of carbon isotopes (Wilkinson et al., 2015) in source apportioning using mixing models to discriminate between isotopically-overlapping plant types (e.g., macroalgae and seagrass in the Red Sea), supporting a range of applications including food web studies (e.g., Layman et al., 2012) and studies of the contributions of different primary producers to sediment organic carbon pools.
Author Contributions
All authors designed the research, conducted sampling and analyses, contributed to writing the manuscript and approved the submission. CD, AA, and NG-B analyzed the data.
Funding
This research was funded by King Abdullah University of Science and Technology through base-line funding to CD and SA, with references BAS/1/1071-01-01 and BAS/1/1072-01-01, and CCF funding to CD. IH was supported by a Ramon y Cajal Fellowship RYC2014-14970, cofounded by the Conselleria d'Innovació, Recerca i Turisme of the Balearic Government (Pla de ciència, tecnologia, innovació i emprenedoria 2013-2017) and the Spanish Ministry of Economy, Industry, and Competitiveness.
Conflict of Interest Statement
The authors declare that the research was conducted in the absence of any commercial or financial relationships that could be construed as a potential conflict of interest.
Acknowledgments
We thank Vijayalaxmi Dasari, Isidora Mendia Saez de Zuazola, Mongi Ennasri, Nadia Haj Salah, and Arsenio Granados for support in the laboratory analysis and CMOR, Amr Gusti, Mohammed Aljehdali, and the RV Thuwal crew for logistical support.
References
Almahasheer, H., Serrano, O., Duarte, C. M., Arias-Ortiz, A., Masque, P., and Irigoien, X. (2017). Low Carbon sink capacity of Red Sea mangroves. Sci. Rep. 7:9700. doi: 10.1038/s41598-017-10424-9
Anton, A., Delgado-Huertas, A., Carrillo-de-Albornoz, P., Lopez-Sandoval, D. C., Agusti, S., Almahasheer, H., et al. (2018b). Dataset for the stable isotope (δ13C, δ15N, δD) composition and nutrient concentration of Red Sea primary producers. PANGAEA. doi: 10.1594/PANGAEA.892848
Anton, A., Hendriks, I. E., Marbà, N., Krause-Jensen, D., Garcias-Bonet, N., and Duarte, C. M. (2018a). Iron deficiency in seagrasses and macroalgae in the red sea is unrelated to latitude and physiological performance. Front. Mar. Sci. 5:74. doi: 10.3389/fmars.2018.00074
Bowen, G. (2010). Isoscapes: spatial pattern in isotopic biogeochemistry. Annu. Rev. Earth Planet. Sci. 38, 161–187. doi: 10.1146/annurev-earth-040809-152429
Brandes, J. A., Devol, A. H., Yoshinari, T., Jayakumar, D. A., and Naqvi, S. W. A. (1998). Isotopic composition of nitrate in the central Arabian Sea and eastern tropical North Pacific: a tracer for mixing and nitrogen cycles. Limnol. Oceanogr. 43, 1680–1689. doi: 10.4319/lo.1998.43.7.1680
Burkhardt, S., Riebesell, U., and Zondervan, I. (1999). Effects of growth rate, CO2 concentration, and cell size on the stable carbon isotope fractionation in marine phytoplankton. Geochim. Cosmochim. Acta 63, 3729–3741. doi: 10.1016/S0016-7037(99)00217-3
Churchill, J. H., Bower, A. S., McCorkle, D. C., and Abualnaja, Y. (2014). The transport of nutrient-rich Indian Ocean water through the Red Sea and into coastal reef systems. J. Mar. Res. 72, 165–181. doi: 10.1357/002224014814901994
Cole, J. J., Carpenter, S. R., Kitchell, J., Pace, M. L., Solomon, C. T., and Weidel, B. (2011). Strong evidence for terrestrial support of zooplankton in small lakes based on stable isotopes of carbon, nitrogen, and hydrogen. Proc. Natl. Acad. Sci. U.S.A. 108, 1975–1980. doi: 10.1073/pnas.1012807108
Cook, P. L. M., Evrard, V., and Woodland, R. J. (2015). Factors controlling nitrogen fixation in temperate seagrass beds. Mar. Ecol. Progr. Ser. 525, 41–51. doi: 10.3354/meps11247
Costanzo, S. D., O'Donohue, M. J., Dennison, W. C., Loneragan, N. R., and Thomas, M. (2001). A new approach for detecting and mapping sewage impacts. Mar. Pol. Bull. 42, 149–156. doi: 10.1016/S0025-326X(00)00125-9
Dawson, T. E., Mambelli, S., Plamboeck, A. H., Templer, P. H., and Tu, K. P. (2002). Stable isotopes in plant ecology. Annu. Rev. Ecol. Syst. 33, 507–559. doi: 10.1146/annurev.ecolsys.33.020602.095451
Descolas-Gros, C., and Fontungne, M. (1990). Stable carbon isotope fractionation by marine phytoplankton during photosynthesis. Plant Cell Environ. 13, 207–218. doi: 10.1111/j.1365-3040.1990.tb01305.x
Farquhar, G. D., Hubick, K. T., Condon, A. G., and Richards, R. A. (1989). “Carbon isotope fractionation and plant water-use efficiency,” in Stable Isotopes in Ecological Research Ecological Studies, eds P. W. Rundel, J. R. Ehleringer, and K. A. Nagy (New York, NY: Springer), 21–40.
Fourqurean, J. W., Marba, N., Duarte, C. M., Diaz-Almela, E., and Ruiz-Halpern, S. (2007). Spatial and temporal variation in the elemental and stable isotopic content of the seagrasses Posidonia oceanica and Cymodocea nodosa from the Illes Balears, Spain. Mar. Biol. 151, 219–232. doi: 10.1007/s00227-006-0473-3
Garcias-Bonet, N., Arrieta, J. M., Duarte, C. M., and Marbà, N. (2016). Nitrogen-fixing bacteria in Mediterranean seagrass (Posidonia oceanica) roots. Aquat. Bot. 131, 57–60. doi: 10.1016/j.aquabot.2016.03.002
Garcias-Bonet, N., and Duarte, C. M. (2017). Methane production by seagrass ecosystems in the Red Sea. Front. Mar. Sci. 4:340. doi: 10.3389/fmars.2017.00340
Hemminga, M. A., and Mateo, M. A. (1996). Stable carbon isotopes in seagrasses: variability in ratios and use in ecological studies. Mar. Ecol. Prog. Ser. 140, 285–298. doi: 10.3354/meps140285
Jones, B. L., Cullen-Unsworth, L. C., and Unsworth, R. K. F. (2018). Tracking nitrogen source using δ15N reveals human and agricultural drivers of seagrass degradation across the British Isles. Front. Plant Sci. 9:133. doi: 10.3389/fpls.2018.00133
Kennedy, H., Beggins, J., Duarte, C. M., Fourqurean, J. W., Holmer, M., Marba, N., et al. (2010). Seagrass sediments as a global carbon sink: Isotopic constraints. Glob. Biogeochem. Cycles 24:GB4026. doi: 10.1029/2010GB003848
Kennedy, H., Gacia, E., Kennedy, D. P., Papadimitriou, S., and Duarte, C. M. (2004). Organic carbon sources to SE Asian coastal sediments. Estuar. Coast. Shelf Sci. 60, 59–68. doi: 10.1016/j.ecss.2003.11.019
Kurten, B., Al-Aidaroos, A. M., Struck, U., Khomayis, H. S., Gharbawi, W. Y., and Sommer, U. (2014). Influence of environmental gradients on C and N stable isotope ratios in coral reef biota of the Red Sea, Saudi Arabia. J. Sea Res. 85, 379–394. doi: 10.1016/j.seares.2013.07.008
Layman, C. A., Araujo, M. S., Boucek, R., Hammerschlag-Peyer, C. M., Harrison, E., Jud, Z. R., et al. (2012). Applying stable isotopes to examine food-web structure: an overview of analytical tools. Biol. Rev. 87, 545–562. doi: 10.1111/j.1469-185X.2011.00208.x
Liu, K. K., Su, M. J., Hsueh, C. R., and Gong, G. C. (1996). The nitrogen isotopic composition of nitrate in the Kuroshio Water northeast of Taiwan: evidence for nitrogen fixation as a source of isotopically light nitrate. Mar. Chem. 54, 273–292. doi: 10.1016/0304-4203(96)00034-5
Maberly, S., Raven, J., and Johnston, A. (1992). Discrimination between C-12 and C-13 by marine plants. Oecologia 91, 481–492. doi: 10.1007/BF00650320
McClelland, J. W., Valiela, I., and Michener, R. H. (1997). Nitrogen-stable isotope signatures in estuarine food webs: a record of increasing urbanization in coastal watersheds. Limnol. Oceanogr. 42, 930–937. doi: 10.4319/lo.1997.42.5.0930
Mill, A. C., Sweeting, C. J., Barnes, C., Al-Habsi, S. H., and MacNeil, M. A. (2008). Mass-spectrometer bias in stable isotope ecology. Limnol. Oceanogr. 6, 34–39. doi: 10.4319/lom.2008.6.34
Moriarty, D. J. W., and O'Donohue, M. J. (1993). Nitrogen fixation in seagrass communities during summer in the Gulf of Carpentaria, Australia. Mar. Freshw. Res. 44, 117–127.
Ngugi, D. K., Antunes, A., Brune, A., and Stingl, U. (2012). Biogeography of pelagic bacterioplankton across an antagonistic temperature–salinity gradient in the Red Sea. Mol. Ecol. 21, 388–405. doi: 10.1111/j.1365-294X.2011.05378.x
Papadimitriou, S., Kennedy, H., Kennedy, D. P., Duarte, C. M., and Marba, N. (2005). Sources of organic matter in seagrass-colonized sediments: a stable isotope study of the silt and clay fraction from Posidonia oceanica meadows in the western Mediterranean. Org. Geochem. 36, 949–961. doi: 10.1016/j.orggeochem.2004.12.002
Peterson, B., and Fry, B. (1987). Stable isotopes in ecosystem studies. Annu. Rev. Ecol. Syst. 18, 293–320. doi: 10.1146/annurev.es.18.110187.001453
Raven, J. A., Johnston, A. M., Kübler, J. E., Korb, R., McInroy, S. G., Handley, L. L., et al. (2002). Mechanistic interpretation of carbon isotope discrimination by marine macroalgae and seagrasses. Funct. Plant Biol. 29, 355–378. doi: 10.1071/PP01201
Robinson, D. (2001). delta N-15 as an integrator of the nitrogen cycle. Trends Ecol. Evol. 16, 153–162. doi: 10.1016/S0169-5347(00)02098-X
Russell, D. G., Warry, F., and Cook, P. L. M. (2016). The balance between nitrogen fixation and denitrification on vegetated and non-vegetated intertidal sediments. Limnol. Oceanogr. 61, 2058–2075. doi: 10.1002/lno.10353
Sharp, Z. D., Atudorei, V., and Durakiewicz, T. (2001). A rapid method for determination of hydrogen and oxygen isotope ratios from water and hydrous minerals. Chem. Geol. 178, 197–210. doi: 10.1016/S0009-2541(01)00262-5
Sigman, D. M., Altabet, M. A., McCorkle, D. C., Francois, R., and Fischer, G. (1999). The delta N-15 of nitrate in the Southern Ocean: consumption of nitrate in surface waters. Glob. Biogeochem. Cycles 13, 1149–1166. doi: 10.1029/1999GB900038
Sigman, D. M., DiFiore, P. J., Hain, M. P., Deutsch, C., Wang, Y., Karl, D. M., et al. (2009). The dual isotopes of deep nitrate as a constraint on the cycle and budget of oceanic fixed nitrogen. Deep-Sea Res. Part Oceanogr. Res. Pap. 56, 1419–1439. doi: 10.1016/j.dsr.2009.04.007
Somes, C. J., Schmittner, A., Galbraith, E. D., Lehmann, M. F., Altabet, M. A., Montoya, J. P., et al. (2010). Simulating the global distribution of nitrogen isotopes in the ocean. Glob. Biogeochem. Cycles 24:GB4019. doi: 10.1029/2009GB003767
Viana, I. G., and Bode, A. (2015). Variability in δ15N of intertidal brown algae along a salinity gradient: differential impact of nitrogen sources. Sci. Total Environ. 512, 167–176. doi: 10.1016/j.scitotenv.2015.01.019
Wada, E., and Hattori, A. (1976). Natural abundance of 15N in particulate organic matter in the North Pacific Ocean. Geochim. Cosmochim. Acta 40, 249–251. doi: 10.1016/0016-7037(76)90183-6
Wafar, M., Ashraf, M., Manikandan, K. P., Qurban, M. A., and Kattan, Y. (2016). Propagation of Gulf of Aden Intermediate Water (GAIW) in the Red Sea during autumn and its importance to biological production. J. Mar. Syst. 154, 243–251. doi: 10.1016/j.jmarsys.2015.10.016
Wankel, S. D., Chen, Y., Kendall, C., Post, A. F., and Paytan, A. (2010). Sources of aerosol nitrate to the Gulf of Aqaba: evidence from delta N-15 and delta O-18 of nitrate and trace metal chemistry. Mar. Chem. 120, 90–99. doi: 10.1016/j.marchem.2009.01.013
Welsh, D. T. (2000). Nitrogen fixation in seagrass meadows: regulation, plant–bacteria interactions and significance to primary productivity. Ecol. Lett. 3, 58–71. doi: 10.1046/j.1461-0248.2000.00111.x
West, A. G., Patrickson, S. J., and Ehleringer, J. R. (2006). Water extraction times for plant and soil materials used in stable isotope analysis. Rapid Commun. Mass Spectrom. 20, 1317–1321. doi: 10.1002/rcm.2456
Wilkinson, G. M., Cole, J. J., and Pace, M. L. (2015). Deuterium as a food source tracer: sensitivity to environmental water, lipid content, and hydrogen exchange. Limnol. Oceanogr. Methods 13, 213–223. doi: 10.1002/lom3.10019
Keywords: stable isotopes, nitrogen, carbon, deuterium, oxygen
Citation: Duarte CM, Delgado-Huertas A, Anton A, Carrillo-de-Albornoz P, López-Sandoval DC, Agustí S, Almahasheer H, Marbá N, Hendriks IE, Krause-Jensen D and Garcias-Bonet N (2018) Stable Isotope (δ13C, δ15N, δ18O, δD) Composition and Nutrient Concentration of Red Sea Primary Producers. Front. Mar. Sci. 5:298. doi: 10.3389/fmars.2018.00298
Received: 18 May 2018; Accepted: 07 August 2018;
Published: 24 August 2018.
Edited by:
Laura Anne Bristow, University of Southern Denmark Odense, DenmarkReviewed by:
Perran Cook, Monash University, AustraliaAntonio Bode, Instituto Español de Oceanografía (IEO), Spain
Copyright © 2018 Duarte, Delgado-Huertas, Anton, Carrillo-de-Albornoz, López-Sandoval, Agustí, Almahasheer, Marbá, Hendriks, Krause-Jensen and Garcias-Bonet. This is an open-access article distributed under the terms of the Creative Commons Attribution License (CC BY). The use, distribution or reproduction in other forums is permitted, provided the original author(s) and the copyright owner(s) are credited and that the original publication in this journal is cited, in accordance with accepted academic practice. No use, distribution or reproduction is permitted which does not comply with these terms.
*Correspondence: Carlos M. Duarte, carlos.duarte@kaust.edu.sa