Carbon Dioxide Emissions along the Lower Amazon River
 Henrique O. Sawakuchi1,2*
  Vania Neu3
  Nicholas D. Ward4,5
  Maria de Lourdes C. Barros1
  Aline M. Valerio6 William Gagne-Maynard2
  Alan C. Cunha7
  Diani F. S. Less7 Joel E. M. Diniz7
  Daimio C. Brito7 Alex V. Krusche1
  Jeffrey E. Richey2
- 1Centro de Energia Nuclear na Agricultura, Universidade de São Paulo, Piracicaba, Brazil
- 2School of Oceanography, University of Washington, Seattle, WA, USA
- 3Instituto Sócio Ambiental e dos Recursos Hídricos, Universidade Federal Rural da Amazônia, Belém, Brazil
- 4Whitney Laboratory for Marine Bioscience, University of Florida, St. Augustine, FL, USA
- 5Marine Sciences Laboratory, Pacific Northwest National Laboratory, Sequim, WA, USA
- 6Departamento de Sensoriamento Remoto, Instituto Nacional de Pesquisas Espaciais, São José dos Campos, Brazil
- 7Departamento de Meio Ambiente e Desenvolvimento, Universidade Federal do Amapá, Macapá, Brazil
A large fraction of the organic carbon derived from land that is transported through inland waters is decomposed along river systems and emitted to the atmosphere as carbon dioxide (CO2). The Amazon River outgasses nearly as much CO2 as the rainforest sequesters on an annual basis, representing ~25% of global CO2 emissions from inland waters. However, current estimates of CO2 outgassing from the Amazon basin are based on a conservative upscaling of measurements made in the central Amazon, meaning both basin and global scale budgets are likely underestimated. The lower Amazon River, from Óbidos to the river mouth, represents ~13% of the total drainage basin area, and is not included in current basin-scale estimates. Here, we assessed the concentration and evasion rate of CO2 along the lower Amazon River corridor and its major tributaries, the Tapajós and Xingu Rivers. Evasive CO2 fluxes were directly measured using floating chambers and gas transfer coefficients (k600) were calculated for different hydrological seasons. Temporal variations in pCO2 and CO2 emissions were similar to previous observations throughout the Amazon (e.g., peak concentrations at high water) and CO2 outgassing was lower in the clearwater tributaries compared to the mainstem. However, k600-values were higher than previously reported upstream likely due to the generally windier conditions, turbulence caused by tidal forces, and an amplification of these factors in the wider channels with a longer fetch. We estimate that the lower Amazon River mainstem emits 20 Tg C year−1 within our study boundaries, or as much as 48 Tg C year−1 if the entire spatial extent to the geographical mouth is considered. Emissions from the Xingu and Tapajós lower tributaries contribute an additional 2.3 Tg C year−1. Including these values with updated basin scale estimates and estimates of CO2 outgassing from small streams we estimate that the Amazon running waters outgasses as much as 0.95 Pg C year−1, increasing the global emissions from inland waters by 15% for a total of 2.45 Pg C year−1. These results highlight the lower reaches of large rivers as a missing gap in basin-scale and global carbon budgets. In the case of the Amazon River, the previously unstudied tidally-influenced reaches contribute to 5% of CO2 emissions from the entire basin.
Introduction
Rivers are no longer viewed as passive conduits from land to sea but, rather, play an active role in processing organic carbon derived from land and returning it to the atmosphere as carbon dioxide (CO2) (Cole et al., 2007; Battin et al., 2009). The remaining organic and inorganic carbon that is exported to the coastal ocean is further processed, released to the atmosphere, or stored in marine waters and sediments (Medeiros et al., 2015; Ibanhez et al., 2016). Streams, rivers, and lakes have most recently been estimated to emit 2.1 Pg C year−1 to the atmosphere (Raymond et al., 2013), increasing from past estimates of 1.4 Pg C year−1 (Tranvik et al., 2009), and 0.8 Pg C year−1 (Cole et al., 2007). Although data coverage is more sparse, wetlands, which were not included in estimates by Raymond et al. (2013), emit another ~2.1 Pg C year−1 (Aufdenkampe et al., 2011). These combined estimates, along with storage and export terms, imply that roughly 5.7 Pg C year−1 is transported through inland waters, with nearly 75% of this carbon being returned to the atmosphere (Le Quéré et al., 2015). Tropical regions have been identified as hotspots for aquatic CO2 outgassing, representing ~75% of global emissions, yet they are under-represented in global datasets, particularly with respect to direct measurements of fluxes and concentrations, which allows quantification of gas transfer velocity values that are used in regional and global models (Regnier et al., 2013; Wehrli, 2013).
The Amazon River is the largest river system in the world, responsible for 20% of the fresh water discharge to world's oceans and 25% of the emissions of CO2 from inland waters to the atmosphere, globally (Richey et al., 2002; Raymond et al., 2013). The influence of the Amazon River on primary productivity in the Atlantic Ocean can be seen from space, driving a net uptake of CO2 in the plume (Subramaniam et al., 2008). The source of dissolved CO2 in large river systems shifts from headwaters to higher order rivers/streams. In small headwater streams the primary source is subsurface flow from riparian soils (Johnson et al., 2008). The relative contribution from soil respiration decreases compared to in situ production via microbial respiration as stream order increases (Butman and Raymond, 2011). The breakdown of young terrestrially-derived organic carbon (OC) by heterotrophic river microbes is thought to be the primary source of CO2 in the Amazon River mainstem (Mayorga et al., 2005; Ward et al., 2013, 2016), although plant respiration and OC decomposition in floodplains also contribute to CO2 supersaturation (Abril et al., 2014).
The majority of geochemical studies in the Amazon River have focused on the central Amazon, which represents about 30% of the 6 million km2 drainage basin (Hedges et al., 1986, 2000; Moreira-Turcq et al., 2003). For example, the current basin-scale CO2 budget for the Amazon River is based on aereal outgassing rates determined for this corridor, and outgassing rates were conservatively assumed to be 50% less in unstudied regions outside of the central corridor (Richey et al., 2002). The lower reaches of the Amazon River, between the historic gauging station, Óbidos, and ~800 km downstream to the mouth, have not been included in current basin-scale budgets. This represents ~13% of the basin's total surface area (in terms of land, not water surfaces) and is characterized by expansive floodplains and flooded forests, which likely provide large inputs of OC and CO2 to the river. In fact, 75% of the particulate OC load is lost between Óbidos and the mouth largely due to degradation, while dissolved OC concentrations slightly increase due to constant inputs from the watershed and floodplains that balance OC degradation (Seidel et al., 2015; Ward et al., 2015). Tidal effects can be detected more than halfway upstream to Óbidos with flow completely reversing near the mouth. These forces increase water residence time and along with strong winds and wide channels (2–15 km) with a long fetch, create rough water surface conditions that likely promote CO2 degassing. Including a quantitative evaluation of CO2 emissions in this unique reach of the river is critical for constraining the basin scale carbon budget, which directly influences global estimates.
This study provides the first detailed evaluation of CO2 concentrations and fluxes along the lower Amazon River and its major tributaries, the Xingu and Tapajós rivers. Direct measurements of CO2 outgassing were made with floating domes for each hydrologic period (i.e., low, rising, high, and falling water) from 2014 to 2016 along with measurements of CO2 concentrations and calculations of gas transfer velocities. Total CO2 evasion was estimated for three discreet sections of the lower river: (1) the Amazon River main channel from Óbidos to the downstream study boundaries near Macapá, (2) the lower regions of the Tapajós and Xingu tributaries, and (3) the extended region from Macapá to the actual geographic river mouth. These estimates were used to calculate a range of updated basin scale CO2 outgassing budgets based on previous estimates (Richey et al., 2002; Rasera et al., 2013), which were compared with global budgets.
Methods
Study Area
A series of four expeditions were performed from 2014 to 2016 along the lower reach of the Amazon River, from Óbidos, the furthest downstream gauging station in the Amazon River mainstem, to the last two well-constrained channels near the river mouth at Macapá, ~650 km downstream from Óbidos (Figure 1-Area 1). Tides drive a ~3 m semi-diurnal variation in river depth, completely reversing river flow with no salinity intrusion. The river continues to widen and channelize between large islands an additional 150 km downstream of Macapá before being entirely disconnected from land and the riparian zone/floodplains (Figure 1-Area 2). The water entering the ocean can remain completely fresh at the surface as much as 60 km offshore from this point (Figure 1-Area 3; Molinas et al., 2014).
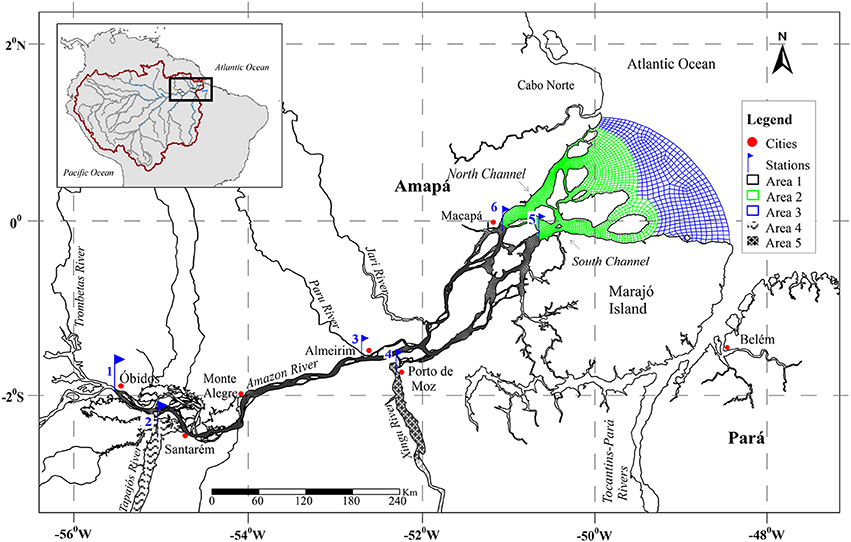
Figure 1. Lower Amazon River showing the sampled stations and the mainstem river areas considered.
Between Óbidos and the ocean, an additional ~20% discharge is added by lowland tributaries, primarily from the Tapajos and Xingu rivers, which are the largest clear water tributaries in the Amazon basin (Sioli, 1985; Mayorga and Aufdenkampe, 2002). The lower Amazon River, from Óbidos to the river mouth, is characterized by an intricate mixture of large channels, clear water tributaries, floodplain lakes and flooded forests, representing ~13% of the total Amazon River drainage basin. Measurements of pCO2 and fluxes were carried out at different sites along the Amazon River main channel—Óbidos; Almeirim, which is halfway to the river mouth; and the north and south channels near Macapá—along with measurements near the outflow of the Tapajós and Xingu rivers (Table 1, Figure 1).
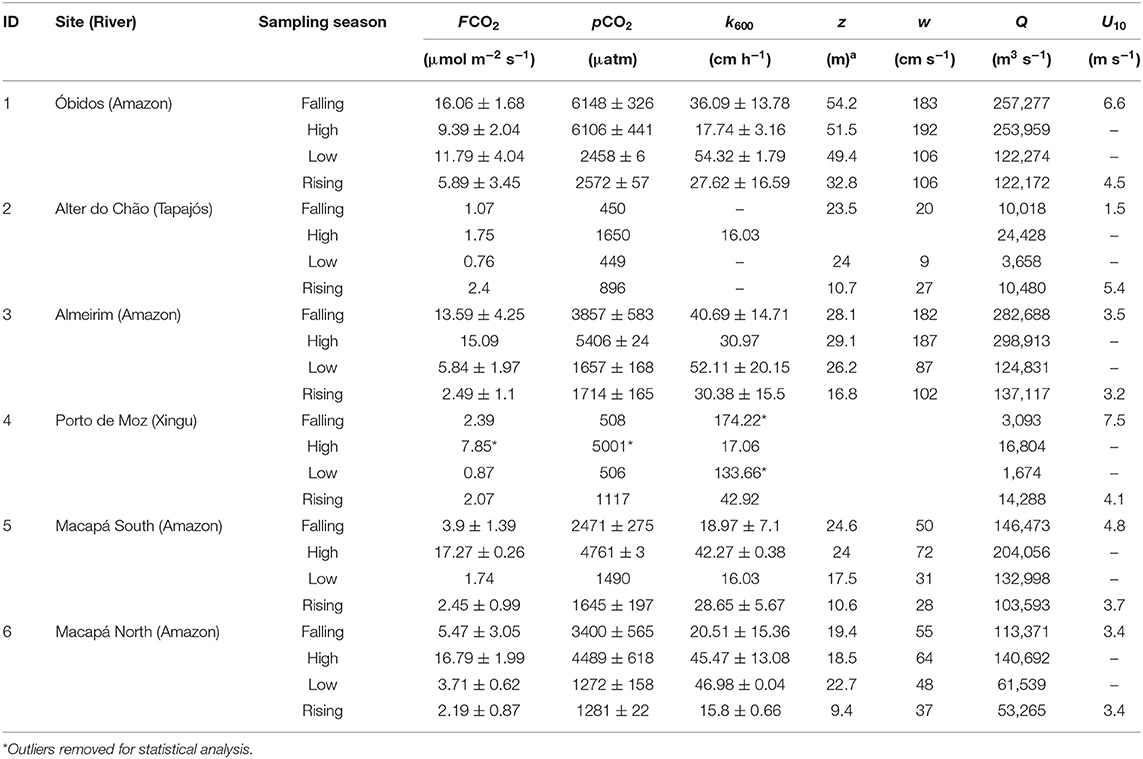
Table 1. CO2 fluxes to atmosphere (FCO2), partial pressure of CO2 in the water (pCO2), gas transfer velocity (k600) measurements according to site and season (mean ± SD) and measurements of mean depth (z), water velocity (w), discharge (Q) and wind speed (U10).
Partial Pressure of CO2 and Flux Measurements
Measurements of the partial pressure of CO2 (pCO2), CO2 fluxes (FCO2), and calculations of gas transfer velocity (k) were made during each hydrological season (low, rising, high, and falling water). For Amazon River mainstem sites measurements were made at three sub-stations distributed equidistantly across the channel profile (e.g., center and left/right margin). Only a single station was sampled in the Tapajós and Xingu tributaries.
pCO2 was determined using a plexiglas equilibration chamber filled with glass beads to enhance gas transfer interfaced to an Infrared Gas Analyzer (LICOR Instruments, LI-820) (Frankignoulle et al., 2001; Abril et al., 2014). Briefly, a submersible pump delivered approximately 1.5 L of water per minute flowing from the top to the bottom of the chamber, leaving approximately 0.4 L of internal air headspace. The equilibrated headspace was circulated from the top to the bottom of the chamber through a desiccating water trap, filled with Drierite for drying the air before enter in the gas analyzer using a small diaphragm pump (AS-200; Spectrex), at a flow rate of 150 mL min−1. Values were recorded once pCO2 readings remained stable.
Evasive CO2 fluxes were directly measured from the river surface using a light weight floating chamber made of polypropylene and covered with reflective alumina tape to avoid internal heating (Galfalk et al., 2013). A floating collar made with a Styrofoam rod was attached around the chamber covering as little area as possible and positioned to leave the chamber edges submersed 2.5 cm into the water. The chamber was round with a volume and area of 7,500 ml and 0.071 m2, respectively, and was interfaced to a second portable Infrared Gas Analyzer (LICOR Instruments, LI-820) using the same type of air pump and water trap as the equilibration chamber. Flux measurements started only after atmospheric air concentration readings by the analyzer were stable. The chamber was deployed for approximately 5 min and then lifted up to equilibrate with atmospheric air concentrations prior to the next measurement. On average three measurements were carried out for each location while drifting with the boat to avoid creating extra turbulence.
The flux of CO2 across the air-water interface (FCO2, mol m−2 s−1) can be described by the following equation:
where d(pCO2)/dt is the slope of the CO2 accumulation in the chamber (μatm h−1), V is the chamber volume (m3), TK is air temperature (in degrees Kelvin, K), A is the surface area of the chamber at the water surface (m2), and R is the gas constant (L atm K−1 mol−1) (Frankignoulle, 1988). Measurements were discarded if the r2-value from the slope of pCO2 vs. time was lower than 0.90.
Gas Transfer Velocity (k) Estimation
Despite the difficulty of directly measuring piston velocity (k), it can be estimated by the relation between the diffuse flux and the difference among surface water and air-equilibrium concentrations given by the followering equation (Wanninkhof et al., 2009):
where F is flux (mol m−2 d−1), k the piston velocity (m d−1), Cw is the concentration of CO2 measured in the water (mol m−3), and C0 is the CO2 concentration at the water surface in exchange with the atmosphere, where Cw, 0 is given by the CO2 partial pressure and solubility (i.e., Cw, 0 = K0× pCO2w, 0). Thus, we have:
where Ko (mol m−3 Pa−1) is the aqueous-phase solubility of CO2 as a function of temperature, pCO2w and pCO20 are the partial pressures (Pa) of CO2 in water and air inside the chamber, Then, substituting into Equation 1 and integrating partial pressure from time i to f, this equation can be rewritten as:
where V is the chamber volume (cm3), A is the chamber area (cm2), α is the Ostwald solubility coefficient (dimensionless), t is time (h), and the subscripts i and f refer to initial and final times and partial pressures. The Ostwald solubility coefficient can be calculated from K0 as a function of temperature as described by Wanninkhof et al. (2009), given by K0 = α(RTw)−1, where R (m3 Pa K−1 mol−1) is the ideal gas constant and Tw (K) is the water temperature.
After solving k, flux measurements, water and air concentration of CO2 using the equation 2, and later normalized into k600-values using the followering equations (Jahne et al., 1987; Wanninkhof, 1992; Alin et al., 2011) derived from Equations 1–2:
where kT is the measured k-value at in situ temperature (T), ScT is the Schmidt number calculated as a function of temperature (T):
Hydrological and Climatological Characterization
Discharge, water velocity, and river depth were measured across the Amazon River channel sites during all cruises using a Sontek River Surveyor M9 Portable nine-beam 3.0/1.0/0.5 MHz acoustic Doppler Current Profiler (ADCP). Cross-channel ADCP transects were performed three to four times in the upstream sites with no tidal influence and 8–11 times through a complete tidal cycle (10–13 h) in sites with tidal influence in order to assess river velocity over the span of a tidal cycle and accurately calculate the total Amazon River discharge (Ward et al., 2015). Discharge measurements were not conducted in the Xingu River neither during high water season at Tapajós River. For the purpose of qualitative comparisons, we obtained data on average discharge, at the time of sampling or from long-term monthly or weekly averages from the nearest monitoring station(s) to fill these gaps. The hydrological stations searched were Óbidos at the Amazon River, Itiatuba at Tapajós River, and Altamira at the Xingu River. For sites in the Amazon, hydrological data came from the Brazilian national water agency web site (Agência Nacional de Águas, http://www.snirh.gov.br/hidroweb/).
Wind speed was measured during falling and rising water cruises with a weather station (Onset HOBO) installed on the boat or with a handheld weather station (Kestrel 5500). Wind speed was normalized to 10 m height (U10) according to Alin et al. (2011) using the following equation:
where ūz is the is mean wind speed (m s−1) at the height z, u* is friction velocity (m s−1), κ is von Karman's constant (~0.40), and z0 is roughness length (10−5 m). Friction velocity was first calculated by rearranging equation (6) to solve for u* and using the mean wind speed measured at 1.5 m as ūz. Monthly historical wind data for comparison was obtained from the National Institute of Meteorology web site (Instituto Nacional de Meteorologia, http://www.inmet.gov.br).
Water temperature was measured with a Thermo-Orion 290APlus probe submerged in a continuously overflowing graduated cylinder.
Annual CO2 Emissions from the Lower Amazon River
Data for the Tapajós and Xingu rivers were only acquired at one station near their river mouth. In both rivers the approximately last 100 km area is characterized as Rias, which have lake-like sedimentary dynamics (Archer, 2005). Thus, we only included this area of the tributaries for the outgassing budget for the lower Amazon River. We divided the main channel into two zones: (Area 1) our study boundaries from Óbidos to Macapá, which has a surface area of 7,118 km2, and (Area 2) the region extending from Macapá to the geographical river mouth, which has an additional surface area of 11,261 km2 (Figure 1). Although it has never been studied, we assume that Area 2 will have similar geochemical characteristics as the region near Macapá considering there are still inputs from land and the Amazon River water discharged to the ocean still remains completely fresh at the surface up to ~100 km further offshore (Figure 1-Area 3; Molinas et al., 2014).
The CO2 outgassing budget for Area 1 was determined by multiplying the average FCO2 measured along the study boundaries by the surface area. For Area 2 we used the seasonal average FCO2 measured across the North and South Macapá stations combined. FCO2 results from each cruise were applied to a 3-month period for the particular hydrologic period and the sum of these values was used to represent annual estimates.
The surface area of the lower Amazon River main channel and lower regions of the Tapajós and Xingu rivers were estimated using the mesh generation tool of SisBaHiA (Base System for Environmental Hydrodynamic; www.sisbahia.coppe.ufrj.br). The finite element methods and mesh generation techniques used in SisBaHiA is detailed in Ern and Guermond (2004). Basically, the mesh is composed of biquadratic quadrilateral elements with specific area and the sums represent the total area of the studied surface.
Statistical Analyses
Statistical evaluations of the FCO2 in the Lower Amazon River were done through non-parametric analysis due to the lack of normal distribution of the data (Shapiro–Wilk, p < 0.05, rejecting the null hypothesis of normality). Evaluation of the differences between broad hydrological settings such as tidally-influenced and tributaries vs. upstream mainstem locations were carried out by the Mann-Whitney test, and differences between sites were assessed by the Kruskal-Wallis test. The relationship among physical characteristics were done using Spearman correlation test. All analyses were performed with R (http://www.r-project.org).
Results
FCO2 Fluxes and pCO2
The average pCO2 and FCO2 including all seasons and sites measured in the lower Amazon River and its tributaries was 2914 ± 1768 μatm and 6.31 ± 5.66 μmol m−2 s−1, respectively. Tributaries had significantly lower pCO2 and FCO2 compared to the mainstem stations (Mann-Whitney, p < 0.05) with values of 1322 ± 1545 μatm and 2.4 ± 2.3 μmol m−2 s−1, respectively, in the tributaries and 3218 ± 1656 μatm and 6.9 ± 5.8 μmol m−2 s−1, respectively, in the mainstem (Figure 2). Both tributaries are considered clear water and are characterized by low suspended sediment loads and high primary productivity (Ward et al., 2015), which results in the fixation of dissolved CO2 and reduction in pCO2 and FCO2. For this reason, the tributaries were considered separately from the mainstem for further comparisons.
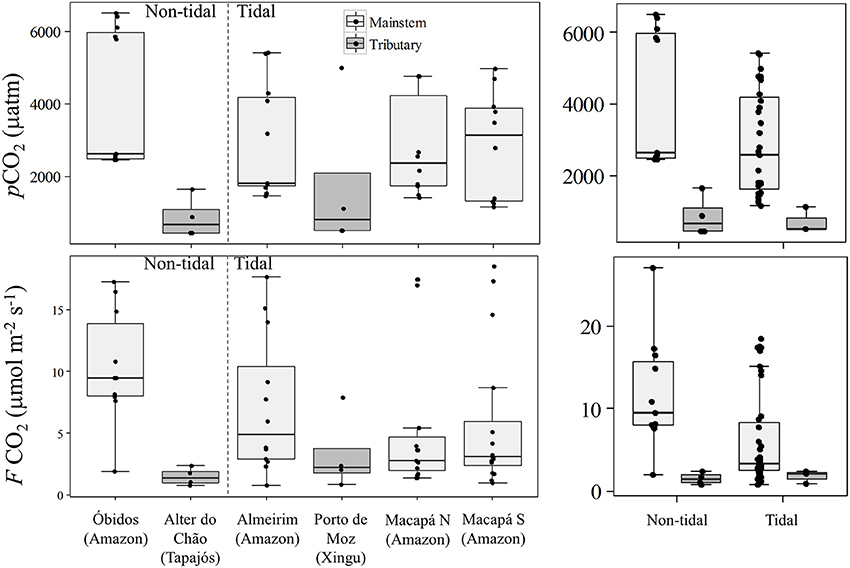
Figure 2. Box plots showing the overall variability in pCO2 and CO2 flux to atmosphere in the Lower Amazon River mainstem and in two of the major Lower Amazon tributaries situated in the non-tidal or tidal river.
The outlier data points observed in the Xingu River (Figure 2) for both pCO2 and FCO2 occurred during the high water season (Table 1) likely because of the delivery of different source of water coming from a floodplain area that discharges just upstream of the sampling station during the high water season. For example, pCO2 values as high as 10,000 ppm were observed at the confluence of the Xingu River and the Jaraçu River, which connects the Amazon and Xingu rivers through an extensive floodplain network (Ward et al., 2016). The intrusion of high suspended sediment water from a small channel was clearly observed during the high water sampling. Thus, the sampled water was a mixture of Xingu River water and Amazon River water fed through floodplains. Since this data point does not represent pure Xingu River water, the value was not considered in further comparisons.
There was no significant difference in pCO2 and FCO2 between the two tributaries (Mann-Whitney, p > 0.05), and pCO2 was also not statistically different between the mainstem stations. Nevertheless, FCO2 was significantly different between stations in the mainstem (Kruskal-Wallis, p < 0.05), with higher fluxes measured further upstream (Figure 2). Tidal and non-tidally influenced sites in the mainstem and tributaries were compared in order to evaluate the effects of tides play on pCO2 and FCO2. Tidally-influenced stations in the mainstem had slightly lower pCO2 and FCO2 than the non-tidal stations (Mann-Whitney, p < 0.05). No difference in pCO2 or FCO2 was observed between the Tapajos (non-tidal) and Xingu (tidal) rivers.
Seasonal variation was recognized for both pCO2 and FCO2 in the mainstem (Kruskal-Wallis, p < 0.001) with the highest values observed during the high water season and lowest values during the lower water season (Figure 3). pCO2 was substantially higher in the Tapajós River during the high water season (Table 1). Although high pCO2 and FCO2 during high water in the Xingu River was attributed to floodplains fed by Amazon River source water, this was not the case in the Tapajós River (i.e., only pure Tapajós River water was present at the sampling station). However, the tributaries were only sampled at one location in the center of the channel, which limited our ability to make statistical inferences regarding seasonal differences.
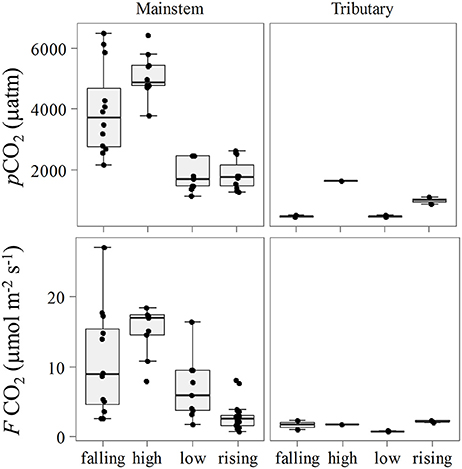
Figure 3. Seasonal variation of pCO2 and FCO2 for the mainstem and tributaries.
Evaluation of k600
The average k600 estimated for all stations was 33.60 ± 15.72 cm h−1. There were no statistically significant differences between the mainstem and tributaries or non-tidal and tidal stations (Figure 4; Mann-Whitney, p > 0.05). The average k600 for the mainstem sites was 33.71 ± 15.63 cm h−1 compared to 32.58 ± 19.10 cm h−1 for the tributaries. Considering tidal vs. non-tidal stations, average k600-values were 33.80 ± 16.97 cm h−1 and 33.53 ± 15.50 cm h−1, respectively.
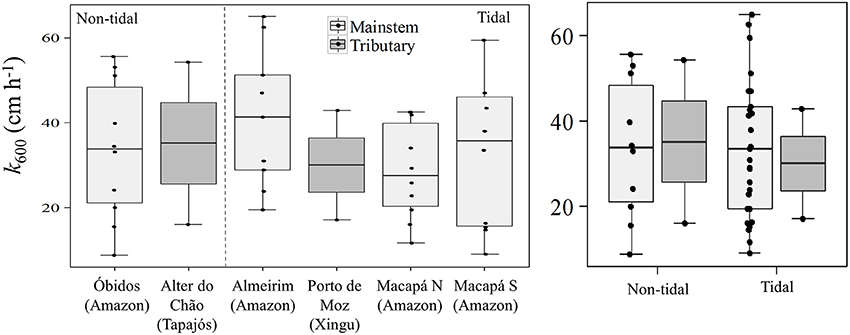
Figure 4. Box plots showing the overall variability of k600 in the Lower Amazon River mainstem and in the tributaries situated in the non-tidal or tidal river.
The primary control on k600 appeared to be seasonality considering the lack of spatial differences (Figure 5). We observed higher values of k600 during the low water season in the mainstem (Kruskal-Wallis, p < 0.05), and during the rising water period in the tributaries (Figure 3). For the mainstem this pattern is in agreement with the historical monthly average of wind speed (Figure 6).
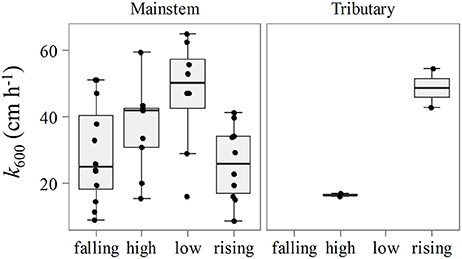
Figure 5. Seasonal variation of k600 for the mainstem and tributaries.
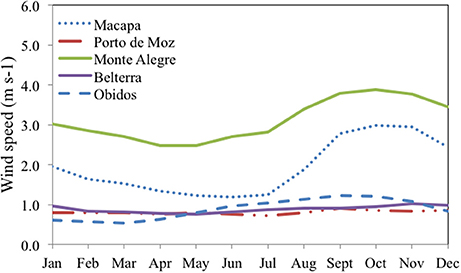
Figure 6. Monthly averages from 2000 to 2016 of wind speed measured in stations located in the lower Amazon. Belterra station located near Tapajos River, Porto de Moz in Xingu River and Óbidos, Monte Alegre and Macapá in the Amazon River.
Environmental Characterization and Correlations with FCO2, pCO2, and k600
The mean annual discharge (Q) at the mouth of the Amazon River to the ocean (i.e., the sum discharge measured near the mouth across the Macapá South and North channels, which integrate the discharge from all non-measured tributaries upstream) was 238,997 m3 s−1, ranging from 156,858 to 344,680 m3 s−1 during low and high water periods, respectively (Figure 7). Water speed (w) for the mainstem sites ranged from 45 to 147 cm s−1.
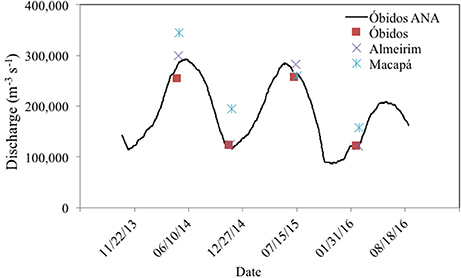
Figure 7. Discharge measurements in the four cruises in the different hydrological phases compared with data from the Brazilian Water Agency (ANA) monitoring station at Óbidos.
Wind speed (U10) was measured in the river during the falling and rising water seasons and averaged 4.00 ± 1.95 m s−1, ranging from 1.21 to 10.65 m s−1. Mean values measured at each station in each season are shown on Table 1. To better assess the annual variability of wind speed in the lower Amazon River we evaluated the historical monthly average using data from 2000 to 2016 for stations located in cities along the lower Amazon River monitored by the Brazilian Institute of Meteorology (INMET). Higher wind speeds and higher seasonal variation were observed in the stations further downstream from Óbidos.
A Spearman correlation test was performed considering all stations to evaluate the relationship between pCO2, FCO2, and k600 with hydrological parameters and wind. A correlation matrix was generated for inter-comparisons of all these parameters among each other (Table 2). The strongest positive correlation was observed between pCO2 and FCO2 (r = 0.8, p < 0.001). However, pCO2 was also positively correlated with all three measured hydrological parameters (Table 2). FCO2 was correlated with depth (z) and k600, while discharge (Q) was correlated with water speed, which in turn was correlated with depth. Unbinned wind speed did not present any direct correlation with any parameter considered in this study. However, average binned k600 for U10 bins of 0.5 m s−1 presented a stronger positive correlation (Figure 8; Spearman, r = 0.7, p < 0.05).
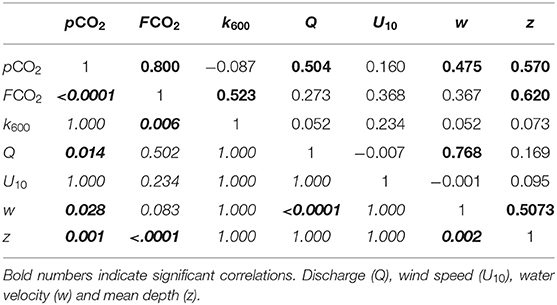
Table 2. Spearman correlation matrix showing the r-values in the top right side of the diagonal and adjusted p-values in the bottom left side in italic.
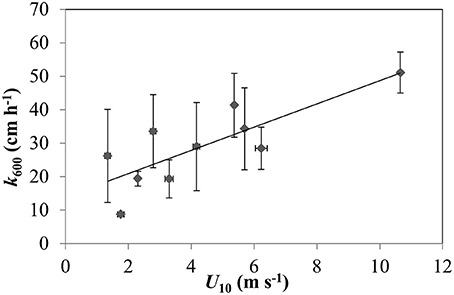
Figure 8. Relationship between k600 binned averages with wind speed (U10) bins of 0.5 m s−1 (Spearman, r = 0.7, p < 0.05).
Upscaling CO2 Emissions from the Lower Amazon River
The total flux of CO2 from the main channel of the lower Amazon River was calculated for two zones (Figure 1) for each 3-month hydrologic period and annually (Table 3). The most conservative estimates (Area 1) only included the boundaries of this study, from Óbidos to Macapá, which had an average wetted surface area of 7,118 km2. The flux of CO2 from Area 1 was 20 Tg C year−1. Area 2 extends from Macapá to the region of the mouth where the connection to land terminates, which had an additional surface area of 11,261 km2. Area 2 had a total CO2 flux of 28 Tg C year−1, based on an extrapolation of average values measured across the north and south Macapá channels (Table 3). The sum of fluxes for these two zones, or the total emissions from Óbidos to the actual river mouth was 48 Tg C year−1. The emissions from the lower Tapajós and Xingu rivers were 1.40 and 0.86 Tg C year−1, respectively. Including these two tributaries to the budget would add more 2.26 Tg C year−1.
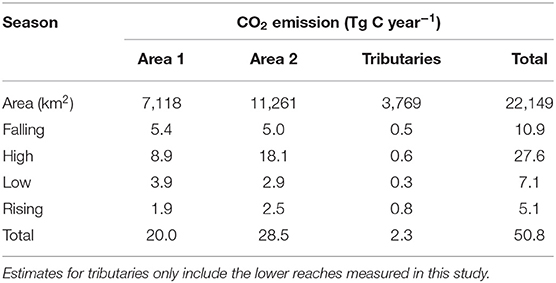
Table 3. Seasonal CO2 emissions in the Amazon river channel considering different areas.
Discussion
In this study we measured pCO2 and CO2 fluxes from the water to atmosphere along with discharge, water current velocity and wind speed in the Lower Amazon River channel, from the last gauging station at Óbidos to the mouth. The two major clear water tributaries of the Amazon River had lower pCO2 and FCO2 values than the Amazon River mainstem, which is consistent with other studies (Alin et al., 2011; Rasera et al., 2013). This was expected based on the lower suspended sediment loads, which enables high rates of primary productivity as indicated by enhanced levels of Chlorophyll-a (Sioli, 1985; Mayorga and Aufdenkampe, 2002; Ward et al., 2015).
Previous pCO2 measurements for sites within our study boundaries ranged from 1600 to 6037 μatm in the mainstem and from 70 to 1070 μatm in the tributaries, agreeing well with our observations (Alin et al., 2011; Borges et al., 2015). Direct FCO2 measurements in the lower Amazon River mainstem and Tapajós River have only been reported by Alin et al. (2011) and ranged from 1.87 to 10.62 μmol m−2 s−1 in the mainstem and from 0.04 to 6.36 μmol m−2 s−1 in the Tapajós River, which is also similar to our measurements. The seasonal trend observed in pCO2 in the lower Amazon River follows the hydrologic cycle as observed by Richey et al. (2002), with maximum CO2 concentrations during high water and minimal concentrations during the lower water season. FCO2 measurements followed the same trend since it was strongly correlated with pCO2 (Table 2).
Despite the similar ranges of pCO2 and FCO2 our range of k600 was considerably higher than Alin et al. (2011). This can mostly be attributed to the higher wind speeds recorded in the river during our measurements compared with Alin et al. (2011). The furthest downstream station sampled by Alin et al. (2011) was near Santarém, which is roughly 500 km upstream of Macapá. We observed a downstream increase in wind speeds (Figure 6), which should lead to higher k600 values considering the typical correlation between wind speed and k600 in large rivers (Borges et al., 2004b; Alin et al., 2011; Rasera et al., 2013). Although we did not find any correlation between direct k600 calculations and the hydrological parameters or wind, the average binned k600 for U10 bins of 0.5 m s−1 presents a stronger positive correlation here and in the aforementioned studies (Figure 8). Channel width and the fetch length (i.e., the distance traveled by wind or waves across open water) also increases downstream, which amplifies the effects of wind, waves, and currents on surface water texture and turbulence. For example, the Amazon River is characterized by large sweeping curves and relatively narrow channels upstream of Santarém, which limits wave formation, whereas the main channel remains fairly straight for ~250 km between Santarém and Almeirim, and remains straight again after a slight turn to the northwest for 2,250 km between Almeirim and Macapá.
The gas exchange coefficient and its variability within a system is among the most important factors controlling CO2 emissions from different parts of a large basin (Raymond and Cole, 2001; Borges et al., 2004a,b; Alin et al., 2011; Striegl et al., 2012). In shallower streams and rivers where turbulence is high due to bottom friction, k600 can be expressed as a function of the water flow speed and depth, where shallower and faster streams tend to have higher k600-values than slower streams (Raymond and Cole, 2001). In the Yukon basin, tributaries had higher k-values for CO2 than the mainstem, and in the mainstem k increased downstream (Striegl et al., 2012). In the Amazon, a similar trend was observed where k600 was higher in rivers with narrower channels (< 100 m wide) (Rasera et al., 2008; Alin et al., 2011).
In larger rivers and estuaries the main driving factors controlling k600 is wind and water currents, which in turn are attributed to a balance between several factors (e.g., discharge, tidal range and fetch) (Alin et al., 2011). In the Scheldt estuary water current is an important factor controlling k600 but its significance decreases with increasing wind speed (Borges et al., 2004b). In the Amazon and Mekong rivers, water currents are generally higher than in estuaries but with a more limited fetch and lower wind speeds (Alin et al., 2011). However, as previously mentioned, fetch dramatically increases along the lower Amazon River (Figure 1). The factors controlling k in large river basins is a mixture of all those described above. Wind are generally higher than those in headwater streams and current velocities are typically faster than in estuaries (Beaulieu et al., 2012). Additionally, the effect of wind on the water turbulence can be related to the water body orientation, shape, size, and direction of wind and water current. When wind and water currents are directionally opposed they can interact synergistically to produce unusually high k-values for any given wind speed (Zappa et al., 2007; Beaulieu et al., 2012). Prevailing winds in the lower Amazon are from the NE, which is the opposite direction of river outflow from Almeirim and Macapá (during an outgoing tide when net discharge is positive).
In large rivers and estuaries, the simple parametrization of k as a function of wind speed tends to be site specific due to local climatological, geomorphological, and hydrological characteristics, implying substantial errors in flux estimates using generic wind based functions from different systems (Borges et al., 2004a; Zappa et al., 2007). Rasera et al. (2013) used more detailed estimates of k600, taking into account spatial variability including the difference between k600 for small (< 100 m wide) and large (>100 m) rivers in the Amazon River, which nearly doubled estimates of basin-scale CO2 emission from the Amazon basin estimated by Richey et al. (2002).
The lower Amazon River contains many of the features that would lead to very high gas transfer velocities and overall emissions. It is characterized by extremely wide channel(s) that flow in a convergent direction with the Intertropical Convergence Zone (ITCZ) creating a large fetch where the stronger winds can substantially increase turbulence, resulting in higher k600 as observed in this study. Not only are k-values high, but the lower river also has a very high amount of wetted surface area for CO2 to escape from, particularly in wide channels near the mouth.
Here we considered two different areas for upscaling annual CO2 emissions from the lower Amazon River. Our most conservative estimate, including the area from Óbidos to Macapá (Area 1), was 20 Tg C year−1. Area 2, which extends to the geographic terminus of the river, is a relatively short distance compared to Area 1, but covers 58% more surface area than the Óbidos to Macapá reach (Table 3). Applying the average FCO2 observed near Macapá, we estimate Area 2 to emit 28 Tg C year−1, which combined with the upstream section totalize 48 Tg C year−1. Emissions from the Xingu and Tapajós tributaries contribute an additional 2.3 Tg C year−1, resulting in a total flux of 51 Tg C year−1 from the lower Amazon River basin. This estimate for the lower Amazon River, alone, is roughly 53% in magnitude compared to CO2 emissions from all rivers in the conterminous United States (97 Tg C year−1; Butman and Raymond, 2011) and ~12% of past estimates of basin-scale emissions from the Amazon (0.47 Pg C year−1; Richey et al., 2002).
Adding our estimations of the fluxes estimated for Area 1 and the sum of Area 1 and 2 to estimations by Richey et al. (2002) increases basin-scale CO2 outgassing to 0.49 and 0.52 Pg C year−1, respectively. A recent re-evaluation of basin-wide outgassing estimates upstream of Óbidos was done using a combination of direct flux measurements and more detailed k-values calculations along with observations by Alin et al. (2011) for tributaries and streams. It was estimated that basin scale CO2 outgassing upstream from Óbidos was roughly 0.8 Pg C year−1 (Rasera et al., 2013). First order streams add an additional 0.1 Pg C year−1 to basin scale CO2 fluxes in the Amazon basin (Johnson et al., 2008). Adding our estimates for the lower river to these values results in basin-wide budgets of 0.92 Pg C year−1 and 0.95 Pg C year−1 for Area 1 and the sum of Area 1 and 2, respectively (Table 4). Replacing these new estimates for the Amazon in the global CO2 budget by Raymond et al. (2013) increases the global budget by as much as 18% for a total of 2.48 Pg C year−1.
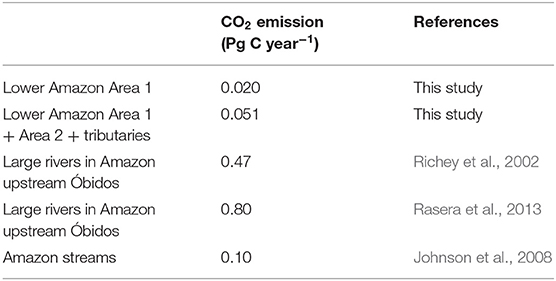
Table 4. CO2 emission estimates for rivers and streams in the Amazon.
In the case of this updated global budget, the Amazon River represents 38% of global CO2 emissions. However, the contribution of other tropical rivers to the global budget are likely also underestimated considering that most tropical rivers are even less well-characterized than the Amazon, particularly in the lower reaches, where we've demonstrated that emissions can be high relative to the rest of the basin. Furthermore, we have not included the entirety of the Amazon in our newest budgets. For example, the Tapajós and Xingu rivers were not included due to their large spatial expanse and minimal data coverage. The lower portion of these tributaries, alone (Figure 1), emit roughly 2.3 Tg C year−1, and these estimates do not encompass their entire surface area nor potentially elevated CO2 concentrations closer to their headwaters.
Another factor that can lead to an underestimation of basin-wide budgets is not including Amazon River water that travels further offshore from Area 2 and along the coastline. For example, the Amazon River can remain unmixed with the ocean as far as 60 km offshore from Area 2 (Molinas et al., 2014). Abril et al. (2014) estimated that only 18% of the CO2 from a point source would be degassed in a stretch of approximately 150 km downstream in the Amazon River taking into account a k-value of 15 cm h−1 and water current of 150 cm s−1. Thus, it is reasonable to assume that the mouth of the Amazon is the last point source of CO2 to the Amazon plume, sustaining significant emissions for a significant distance offshore. This region, along with near-shore coastal waters, is not included in any studies of CO2 cycling in the Amazon River plume in the Atlantic Ocean due to a lack of sampling and terrestrial contamination of remote sensing products by adjacency effect near-shore (Cooley et al., 2007; Subramaniam et al., 2008). We estimate that Area 3 may emit up to an additional 31 Tg C year−1, but note that this is a simple calculation based on measurements at Macapá. Further exploration of this offshore area is essential for constraining the total basin-wide CO2 flux. Although it is too early to confidently incorporate this offshore freshwater region (Area 3) into basin-wide budgets, this rough estimation highlights that expansive regions of offshore freshwater plumes may be an important missing gap in aquatic carbon budgets.
Concluding Remarks
Numerous studies in the Amazon River have demonstrated its importance on global carbon budgets (Richey et al., 2002; Johnson et al., 2008; Rasera et al., 2013; Scofield et al., 2016). However, a missing gap in the continuum that connects the river network to the ocean has been neglected. Here we show that the lower reaches of the Amazon River are an active area in terms of freshwater CO2 emissions from the Amazon, and perhaps the world, although, lower river reaches have yet to be adequately studied in other comparable tropical systems. A mixture of vast floodplains, tidally-flooded forests, and the surrounding watershed supplies the lower river with both CO2 (Abril et al., 2014) and organic carbon, which is broken down extensively by heterotrophic bacteria (Ward et al., 2013, 2016). The downstream expansion of channel width and the alignment of a long fetch opposing the prevailing winds, which also increase toward the mouth, leads to high CO2 emissions attributed to higher k-values in the lower river.
The enormous surface area of the lower Amazon River (18,379 km2) is slightly less than half of the area of rivers and stream in the conterminous United States (Butman and Raymond, 2011), and similarly emits roughly half as much CO2 to the atmosphere. This area alone releases an amount of CO2 in the same order of magnitude than the uptake by the Amazon River plume in the Atlantic Ocean (Kortzinger, 2003; Cooley et al., 2007; Subramaniam et al., 2008). We argue that the region where freshwater extends offshore should be included in basin-scale budgets considering that studies in the plume do not cover this area, however, there is no available data in this region to date. There is a pressing need to perform measurements of pCO2 and FCO2 along lower rivers and near-shore plume waters, which are currently large missing gaps in our coverage of regional and global scale carbon budgets.
Author Contributions
JR, AK, HS, and NW responsible for the conception and design of the work. HS, VN, AV, WG, DL, and JD executed in situ measurements. HS, VN developed the data calculation and interpretation. MB conceived the areal estimations. JR, AK, HS, and NW organized overall project logistics. AC, DL, JD, and DB organized local logistics. All authors critically revised the manuscript and approved the final submission. All authors also agreed to be accountable for all aspects of the work related to the accuracy or integrity of any part of the work are appropriately investigated and resolved.
Funding
This study was supported by FAPESP Grants 12/51187-0, 2014/21564-2, and 2015/09187-1, NSF DEB Grant #1256724, and NSF IGERT grant DGE-125848.
Conflict of Interest Statement
The authors declare that the research was conducted in the absence of any commercial or financial relationships that could be construed as a potential conflict of interest.
Acknowledgments
We thank Alexandra Montebello, for assistance in the laboratory at CENA. Gilvan Portela de Oliveira and Geison Carlos Xisto da Silva for logistical support in Macapá, Cica and the crew of the B/M Mirage for contributions made during the river cruises. Open access publication fees were supported by the Gordon and Betty Moore Foundation.
References
Abril, G., Martinez, J. M., Artigas, L. F., Moreira-Turcq, P., Benedetti, M. F., Vidal, L., et al. (2014). Amazon River carbon dioxide outgassing fuelled by wetlands. Nature 505, 395–398. doi: 10.1038/nature12797
Alin, S. R., Rasera, M. F. F. L., Salimon, C. I., Richey, J. E., Holtgrieve, G. W., Krusche, A. V., et al. (2011). Physical controls on carbon dioxide transfer velocity and flux in low-gradient river systems and implications for regional carbon budgets. J. Geophys. Res. Biogeosci. 116:G01009. doi: 10.1029/2010jg001398
Archer, A. W. (2005). “Review of amazonian depositional systems,” in Fluvial Sedimentology VII, eds M. S. Blum and S. Leclair (Oxford: Blackwell Publishing Ltd.), 17–39.
Aufdenkampe, A. K., Mayorga, E., Raymond, P. A., Melack, J. M., Doney, S. C., Alin, S. R., et al. (2011). Riverine coupling of biogeochemical cycles between land, oceans, and atmosphere. Front. Ecol. Environ. 9, 53–60. doi: 10.1890/100014
Battin, T. J., Luyssaert, S., Kaplan, L. A., Aufdenkampe, A. K., Richter, A., and Tranvik, L. J. (2009). The boundless carbon cycle. Nat. Geosci. 2, 598–600. doi: 10.1038/ngeo618
Beaulieu, J. J., Shuster, W. D., and Rebholz, J. A. (2012). Controls on gas transfer velocities in a large river. J. Geophys. Res. Biogeosci. 117:G02007. doi: 10.1029/2011jg001794
Borges, A. V., Abril, G., Darchambeau, F., Teodoru, C. R., Deborde, J., Vidal, L. O., et al. (2015). Divergent biophysical controls of aquatic CO2 and CH4 in the World's two largest rivers. Sci. Rep. 5:15614. doi: 10.1038/srep15614
Borges, A. V., Delille, B., Schiettecatte, L. S., Gazeau, F., Abril, G., and Frankignoulle, M. (2004a). Gas transfer velocities of CO2 in three European estuaries (Randers Fjord, Scheldt, and Thames). Limnol. Oceanogr. 49, 1630–1641. doi: 10.4319/lo.2004.49.5.1630
Borges, A. V., Vanderborght, J. P., Schiettecatte, L. S., Gazeau, F., Ferron-Smith, S., Delille, B., et al. (2004b). Variability of the gas transfer velocity of CO2 in a macrotidal estuary (the Scheldt). Estuaries 27, 593–603. doi: 10.1007/bf02907647
Butman, D., and Raymond, P. A. (2011). Significant efflux of carbon dioxide from streams and rivers in the United States. Nat. Geosci. 4, 839–842. doi: 10.1038/ngeo1294
Cole, J. J., Prairie, Y. T., Caraco, N. F., McDowell, W. H., Tranvik, L. J., Striegl, R. G., et al. (2007). Plumbing the global carbon cycle: integrating inland waters into the terrestrial carbon budget. Ecosystems 10, 171–184. doi: 10.1007/s10021-006-9013-8
Cooley, S. R., Coles, V. J., Subramaniam, A., and Yager, P. L. (2007). Seasonal variations in the Amazon plume-related atmospheric carbon sink. Glob. Biogeochem. Cycles 21:GB3014. doi: 10.1029/2006gb002831
Ern, A., and Guermond, J.-L. (2004). Theory and Practice of Finite Elements. New York, NY: Springer-Verlag.
Frankignoulle, M. (1988). Field-measurements of air sea CO2 exchange. Limnol. Oceanogr. 33, 313–322.
Frankignoulle, M., Borges, A., and Biondo, R. (2001). A new design of equilibrator to monitor carbon dioxide in highly dynamic and turbid environments. Water Res. 35, 1344–1347. doi: 10.1016/s0043-1354(00)00369-9
Galfalk, M., Bastviken, D., Fredriksson, S., and Arneborg, L. (2013). Determination of the piston velocity for water-air interfaces using flux chambers, acoustic Doppler velocimetry, and IR imaging of the water surface. J. Geophys. Res. Biogeosci. 118, 770–782. doi: 10.1002/jgrg.20064
Hedges, J. I., Clark, W. A., Quay, P. D., Richey, J. E., Devol, A. H., and Santos, U. D. (1986). Compositions and fluxes of particulate organic material in the Amazon River. Limnol. Oceanogr. 31, 717–738.
Hedges, J. I., Mayorga, E., Tsamakis, E., McClain, M. E., Aufdenkampe, A., Quay, P., et al. (2000). Organic matter in Bolivian tributaries of the Amazon River: a comparison to the lower mainstream. Limnol. Oceanogr. 45, 1449–1466. doi: 10.4319/lo.2000.45.7.1449
Ibanhez, J. S. P., Araujo, M., and Lefevre, N. (2016). The overlooked tropical oceanic CO2 sink. Geophys. Res. Lett. 43, 3804–3812. doi: 10.1002/2016gl068020
Jahne, B., Munnich, K. O., Bosinger, R., Dutzi, A., Huber, W., and Libner, P. (1987). On the parameters influencing air-water gas exchange. J. Geophys. Res. Oceans 92, 1937–1949. doi: 10.1029/JC092iC02p01937
Johnson, M. S., Lehmann, J., Riha, S. J., Krusche, A. V., Richey, J. E., Ometto, J., et al. (2008). CO2 efflux from Amazonian headwater streams represents a significant fate for deep soil respiration. Geophys. Res. Lett. 35:L17401. doi: 10.1029/2008gl034619
Kortzinger, A. (2003). A significant CO2 sink in the tropical Atlantic Ocean associated with the Amazon River plume. Geophys. Res. Lett. 30:2287. doi: 10.1029/2003gl018841
Le Quéré, C., Moriarty, R., Andrew, R. M., Peters, G. P., Ciais, P., Friedlingstein, P., et al. (2015). Global carbon budget 2014. Earth Syst. Sci. Data 7, 47–85. doi: 10.5194/essd-7-47-2015
Mayorga, E., and Aufdenkampe, A. K. (2002). “Processing of bioactive elements in the amazon river system,” in The Ecohydrology of South American Rivers and Wetlands, ed M. E. McClain (Wallingford: IAHS Press), 1–24.
Mayorga, E., Aufdenkampe, A. K., Masiello, C. A., Krusche, A. V., Hedges, J. I., Quay, P. D., et al. (2005). Young organic matter as a source of carbon dioxide outgassing from Amazonian rivers. Nature 436, 538–541. doi: 10.1038/nature03880
Medeiros, P. M., Seidel, M., Ward, N. D., Carpenter, E. J., Gomes, H. R., Niggemann, J., et al. (2015). Fate of the Amazon River dissolved organic matter in the tropical Atlantic Ocean. Glob. Biogeochem. Cycles 29, 677–690. doi: 10.1002/2015gb005115
Molinas, E., Vinzon, S. B., Vilela, C. D. X., and Gallo, M. N. (2014). Structure and position of the bottom salinity front in the Amazon Estuary. Ocean Dynamics 64, 1583–1599. doi: 10.1007/s10236-014-0763-0
Moreira-Turcq, P., Seyler, P., Guyot, J. L., and Etcheber, H. (2003). Exportation of organic carbon from the Amazon River and its main tributaries. Hydrol. Processes 17, 1329–1344. doi: 10.1002/hyp.1287
Rasera, M. F. F. L., Ballester, M. V. R., Krusche, A. V., Salimon, C., Montebelo, L. A., Alin, S. R., et al. (2008). Estimating the surface area of small rivers in the southwestern Amazon and their role in CO2 outgassing. Earth Interactions 12, 1–16. doi: 10.1175/2008ei257.1
Rasera, M. F. F. L., Krusche, A. V., Richey, J. E., Ballester, M. V. R., and Victória, R. L. (2013). Spatial and temporal variability of pCO2 and CO2 efflux in seven Amazonian Rivers. Biogeochemistry 116, 241–259. doi: 10.1007/s10533-013-9854-0
Raymond, P. A., and Cole, J. J. (2001). Gas exchange in rivers and estuaries: choosing a gas transfer velocity. Estuaries 24, 312–317. doi: 10.2307/1352954
Raymond, P. A., Hartmann, J., Lauerwald, R., Sobek, S., McDonald, C., Hoover, M., et al. (2013). Global carbon dioxide emissions from inland waters. Nature 503, 355–359. doi: 10.1038/nature12760
Regnier, P., Friedlingstein, P., Ciais, P., Mackenzie, F. T., Gruber, N., Janssens, I. A., et al. (2013). Anthropogenic perturbation of the carbon fluxes from land to ocean. Nat. Geosci. 6, 597–607. doi: 10.1038/ngeo1830
Richey, J. E., Melack, J. M., Aufdenkampe, A. K., Ballester, V. M., and Hess, L. L. (2002). Outgassing from Amazonian rivers and wetlands as a large tropical source of atmospheric CO2. Nature 416, 617–620. doi: 10.1038/416617a
Scofield, V., Melack, J. M., Barbosa, P. M., Amaral, J. H. F., Forsberg, B. R., and Farjalla, V. F. (2016). Carbon dioxide outgassing from Amazonian aquatic ecosystems in the Negro River basin. Biogeochemistry 129, 77–91. doi: 10.1007/s10533-016-0220-x
Seidel, M., Yager, P. L., Ward, N. D., Carpenter, E. J., Gomes, H. R., Krusche, A. V., et al. (2015). Molecular-level changes of dissolved organic matter along the Amazon River-to-ocean continuum. Mar. Chem. 177, 218–231. doi: 10.1016/j.marchem.2015.06.019
Sioli, H. (1985). Amazônia: Fundamentos de Ecologia da Maior Região de Florestas Tropicais. Petrópolis: Editora Vozes.
Striegl, R. G., Dornblaser, M. M., McDonald, C. P., Rover, J. R., and Stets, E. G. (2012). Carbon dioxide and methane emissions from the Yukon River system. Glob. Biogeochem. Cycles 26, GB0E05. doi: 10.1029/2012gb004306
Subramaniam, A., Yager, P. L., Carpenter, E. J., Mahaffey, C., Bjorkman, K., Cooley, S., et al. (2008). Amazon River enhances diazotrophy and carbon sequestration in the tropical North Atlantic Ocean. Proc. Natl. Acad. Sci. U.S.A. 105, 10460–10465. doi: 10.1073/pnas.0710279105
Tranvik, L. J., Downing, J. A., Cotner, J. B., Loiselle, S. A., Striegl, R. G., Ballatore, T. J., et al. (2009). Lakes and reservoirs as regulators of carbon cycling and climate. Limnol. Oceanogr. 54, 2298–2314. doi: 10.4319/lo.2009.54.6_part_2.2298
Wanninkhof, R. (1992). Relationship betwenn wind-speed and gas-exchange over the ocean. J. Geophys. Res. Oceans 97, 7373–7382. doi: 10.1029/92jc00188
Wanninkhof, R., Asher, W. E., Ho, D. T., Sweeney, C., and McGillis, W. R. (2009). Advances in quantifying air-sea gas exchange and environmental forcing. Ann. Rev. Mar. Sci. 1, 213–244. doi: 10.1146/annurev.marine.010908.163742
Ward, N. D., Bianchi, T. S., Sawakuchi, H. O., Gagne-Maynard, W., Cunha, A. C., Brito, D. C., et al. (2016). The reactivity of plant-derived organic matter and the potential importance of priming effects along the lower Amazon River. J. Geophys. Res. Biogeosci. 121, 1522–1539. doi: 10.1002/2016jg003342
Ward, N. D., Keil, R. G., Medeiros, P. M., Brito, D. C., Cunha, A. C., Dittmar, T., et al. (2013). Degradation of terrestrially derived macromolecules in the Amazon River. Nat. Geosci. 6, 530–533. doi: 10.1038/ngeo1817
Ward, N. D., Krusche, A. V., Sawakuchi, H. O., Brito, D. C., Cunha, A. C., Moura, J. M. S., et al. (2015). The compositional evolution of dissolved and particulate organic matter along the lower Amazon River—Óbidos to the ocean. Mar. Chem. 177, 244–256. doi: 10.1016/j.marchem.2015.06.013
Wehrli, B. (2013). Biogeochemistry: Conduits of the carbon cycle. Nature 503, 346–347. doi: 10.1038/503346a
Keywords: GHG emission, CO2 emission, Lower Amazon, CO2 outgassing, river, global CO2 emission
Citation: Sawakuchi HO, Neu V, Ward ND, Barros MdLC, Valerio AM, Gagne-Maynard W, Cunha AC, Less DFS, Diniz JEM, Brito DC, Krusche AV and Richey JE (2017) Carbon Dioxide Emissions along the Lower Amazon River. Front. Mar. Sci. 4:76. doi: 10.3389/fmars.2017.00076
Received: 03 October 2016; Accepted: 02 March 2017;
Published: 21 March 2017.
Edited by:
Marta Álvarez, Instituto Español de Oceanografía, SpainReviewed by:
Hugh Daigle, University of Texas at Austin, USAKatlin Louise Bowman, University of California, Santa Cruz, USA
Copyright © 2017 Sawakuchi, Neu, Ward, Barros, Valerio, Gagne-Maynard, Cunha, Less, Diniz, Brito, Krusche and Richey. This is an open-access article distributed under the terms of the Creative Commons Attribution License (CC BY). The use, distribution or reproduction in other forums is permitted, provided the original author(s) or licensor are credited and that the original publication in this journal is cited, in accordance with accepted academic practice. No use, distribution or reproduction is permitted which does not comply with these terms.
*Correspondence: Henrique O. Sawakuchi, riqueoliveira@yahoo.com.br