 Christopher J. Collins1
 Irene J. Chang2Sunhee Jung1
 Remwilyn Dayuha1Jeffrey R. Whiteaker3Gesmar R. S. Segundo4Troy R. Torgerson1,5
 Hans D. Ochs1,5
 Amanda G. Paulovich3
 Si Houn Hahn1,2,5*
- 1Seattle Children's Research Institute, Seattle, WA, United States
- 2Division of Medical Genetics, Department of Medicine, University of Washington School of Medicine, Seattle, WA, United States
- 3Fred Hutchinson Cancer Research Center, Seattle, WA, United States
- 4Setor de Alergia e Imunologia Pediátrica, Ambulatório de Pediatria, Departamento de Pediatria, Universidade Federal de Uberlândia, Uberlândia, Brazil
- 5Department of Pediatrics, University of Washington School of Medicine, Seattle, WA, United States
Background: Primary immunodeficiency disorders (PIDD) comprise a group of life-threatening congenital diseases characterized by absent or impaired immune responses. Despite the fact that effective, curative treatments are available with optimal clinical outcomes when diagnosed early, newborn screening does not exist for the majority of these diseases due to the lack of detectable, specific biomarkers or validated methods for population-based screening. Peptide immunoaffinity enrichment coupled with selected reaction monitoring mass spectrometry (immuno-SRM) is a sensitive proteomic assay, involving antibody-mediated peptide capture, that allows for concurrent quantification of multiple analytes. This assay has promise for use in potential newborn screening of PIDDs that lead to diminished or absent target proteins in the majority of cases.
Objective: To determine and evaluate if a multiplex assay based on immuno-SRM is able to reliably and precisely distinguish affected patients with X-linked agammaglobulinemia (XLA), Wiskott-Aldrich Syndrome (WAS), and CD3ϵ-associated severe combined immunodeficiency (SCID) from one another and from unaffected normal control dried blood spot (DBS) samples.
Methods: We performed a blinded, multiplexed analysis of proteolytically-generated peptides from WASp, BTK, and CD3ϵ (for WAS, XLA, and SCID, respectively) in DBS samples from 42 PIDD patients, 40 normal adult controls, and 62 normal newborns. The peptide ATPase copper transporting protein (ATP7B) 1056 was simultaneously monitored for quality assurance purposes.
Results: The immuno-SRM assays reliably quantified the target peptides in DBS and accurately distinguished affected patients from normal controls. Analysis of signature peptides found statistically significant reduction or absence of peptide levels in affected patients compared to control groups in each case (WASp and BTK: p = 0.0001, SCID: p = 0.05). Intra and inter-assay precision ranged from 11 to 22% and 11 to 43% respectively; linearity (1.39–2000 fmol peptide), and stability (≤ 0.09% difference in 72 h) showed high precision for the multiplexed assay. Inter-laboratory assay comparison showed high concordance for measured peptide concentrations, with R2 linearity ≥ 0.97 for the WASp 274, CD3ϵ 197, BTK 407, and ATP7B 1056 peptides.
Conclusion: Immuno-SRM-based quantification of proteotypic peptides from WASp, BTK, and CD3ϵ in DBS distinguishes relevant PIDD cases from one another and from controls, raising the possibility of employing this approach for large-scale multiplexed newborn screening of selective PIDDs.
Introduction
Primary immunodeficiency disorders (PIDDs) are a collection of diverse congenital diseases characterized by aberrant or impaired immune responses. These include X-linked agammaglobulinemia (XLA, OMIM# 300755) caused by pathogenic variants in BTK, X-linked Wiskott-Aldrich Syndrome (WAS, OMIM# 301000) due to pathogenic variants in WAS, and Severe Combined Immunodeficiency (SCID), which can be caused by over 20 different genetic defects associated with T cell deficiency (1). Although genetically and clinically heterogeneous, these disorders lead to fatal infections unless treated early with intravenous immunoglobulin (IVIG), anti-microbials, or curative enzyme replacement, hematopoietic stem cell transplant (HSCT), or in some cases gene therapy (2–5). Early detection of PIDD can be lifesaving, but unfortunately, most affected infants are diagnosed only after developing devastating infections due to the lack of specific identifiable biomarkers or effective population-based screening methods. While T-cell receptor excision circle (TREC) analysis and kappa-deleting element recombination circle (KREC) screening from dried blood spots (DBS) on filter paper exist for SCID and some X-linked or autosomal recessive agammagobulinemias, respectively, newborn screening (NBS) methods for other PIDD do not exist (6–9).
Tandem mass spectrometry (MS/MS) was first applied to NBS in the 1990s, paving the way for rapid screening of multiple metabolites and thus several diseases from DBS samples collected at birth (10–15). Selected reaction monitoring mass spectrometry (SRM-MS) performed on triple quadrupole mass spectrometers further enabled the precise, high-throughput, and analytically-robust quantification of specific biomarkers; as such, it is now the standard of care in clinical newborn screening laboratories across the world (10, 16, 17).
MS/MS relies on the measurement of concentrated upstream metabolites for the detection of inborn errors of metabolism with specific enzyme deficiencies (11). This excludes its application to diseases such as PIDD, where no accumulated metabolites are present or currently verified. For this reason, protein-based assays such as flow cytometry or western blotting have been used as first-line investigative methods for diseases such as WAS and its milder phenotype, X-linked thrombocytopenia (XLT), where most pathogenic variants lead to absent or decreased protein products (18, 19). These approaches require that intact blood samples or isolated peripheral blood mononuclear cells (PBMC) from patients be available, making population-based screening or testing of patients from resource-poor areas impossible.
SRM-MS utilizes proteolytically-generated signature peptides as stoichiometric surrogates of the protein of interest. This may, in turn, be used to estimate the number of a particular cell-type expressing that protein in a sample (i.e., quantification of CD3ϵ for an indication of the amount of CD3+ T-cells in blood).The high specificity of MS for each signature peptide is conferred by three physiochemical properties—its mass, retention times upon high-performance liquid chromatography (HPLC) separation, and resultant target-specific fragmentation patterns (20). Recently, LC-MS/MS has recently been used to screen for Adenosine Deaminase (ADA) deficient SCID (21). Despite these advances, with a typical limit of quantification ranging from 100 to 1,000 ng protein/mL, the use of complex matrices such as blood or plasma often precludes accurate quantification of extremely low-abundance targets by SRM-MS based assays. This limits its applicability to many PIDD including XLA, SCID, and WAS that result in absent or decreased levels of target proteins expressed only intracellularly (22).
Peptide immunoaffinity enrichment coupled to SRM (immuno-SRM), also referred to as Stable Isotope Standards and Capture by Anti-Peptide Antibodies (SISCAPA), increases the sensitivity of SRM-MS assays by utilizing anti-peptide antibodies to purify and enrich peptides of interest from a complex biologic sample prior to SRM-MS analysis (23–27). This additional peptide affinity step, coupled to SRM-MS, lowers the limit of detection to the low pg protein/mL range from 1 mL of plasma that is suitable for the accurate quantification of very low abundance proteins in complex matrices such as DBS (24, 28–30).
We have previously demonstrated the ability of liquid chromatography (LC)-MS/MS to detect signature peptides from CD3ϵ, WASp, and BTK in proteolytically digested human PBMC lysates. WASp and BTK were chosen because mutations in these proteins are the source of WAS and XLA, respectively. In contrast, CD3ϵ was chosen in an attempt to develop a universal marker for the genetically heterogenous SCID. We hypothesized that the T-Cell lymphopenia exhibited by SCID patients would lead to a demonstrable decrease in CD3ϵ, itself a T-Cell marker. One or two surrogate signature peptides were chosen for each target protein based on factors including amenability to MS detection, uniqueness in the proteome, and absence of common single nucleotide polymorphisms. A decrease in protein concentration brought on by pathogenic mutations would therefore be reflected in a reduction in the measured concentration of signature peptides.
In a blinded study, peptide levels were quantified in normal control PMBCs but nearly undetectable in a disease-specific fashion in affected patients (31). We then applied the same proteomic method to show elevated levels of α-aminoadipic semialdehyde antiquitin and piperideine-6-carboxylate in DBS of patients with pyridoxine-dependent seizures, revealing the possibility of its application to NBS (32). To improve the sensitivity and reproducibility of the assay, we harnessed the immuno-SRM platform to quantify very low abundance peptides in DBS such as surrogate peptides of the ATP7B protein from patients with Wilson disease (WD). Our results demonstrated immuno-SRM's capability to detect ATP7B peptides in the low picomolar (pmol) range and reproducibly differentiating between patients with WD from unaffected controls (33). The goal of our present study is to expand this immuno-SRM method to the multiplexed analysis of a large cohort of patients with SCID, WAS, or XLA. Blinded analysis of patients and normal controls will test the potential utility of immuno-SRM for high-throughput and multiplexed, population-based newborn screening.
Materials and Methods
Patient Samples
This protocol was approved by the institutional review board of Seattle Children's Hospital. All subjects gave written informed consent in accordance with the Declaration of Helsinki. PIDD and normal control blood samples were obtained from the Seattle Children's Immunology Diagnostic Laboratory. Newborn DBS collected prior to March 2015 were retrieved from the Washington State Newborn Screening Laboratory (Shoreline, WA) after IRB approval. XLA DBS were collected from 20 suspected Vietnamese patients and shipped per regular mail to Seattle Children's Hospital. Genotypes of these patients by Sanger sequencing was previously reported (34). In total, DBS samples from 42 PIDD patients and 40 normal controls were obtained. Normal control and PIDD patient DBS were prepared by pipetting 70 μL of blood/12 mm spot onto filter paper cards (Protein Saver 903 Card, Whatman, Piscayaway,NJ), allowed to dry at room temperature overnight, and stored in sealed plastic bags at −80°C until use. Affected patient samples were shipped at room temperature from collection locations and stored at −80°C until use.
Immuno-SRM Assay Reagents
ProteaseMAX Surfactant (no. V2072) and proteomics grade trypsin (no. V5113) were purchased from Promega (Madison, WI). Bovine serum albumin standard (200 mg/mL), and (3-[3-cholamidopropyl = dimethylammonio]-1-propanesulfonate) (CHAPS, no. PI28300) detergent were obtained from Fisher Scientific. Ammonium bicarbonate (40867-50G-F) was purchased from Fluka Analytical. Acetonitrile (no. A955), water (no. W6, LCMS optima grade), formic acid (no. PI28905), and phosphate-buffered saline (PBS, no. 10010-023) were obtained from Thermo Fisher Scientific (Waltham, MA).
Heavy stable isotope-labeled peptides were obtained from Anaspec (Fremont, CA). The stable isotope-labeled peptides were purified >95% by HPLC and the C-terminal arginine or lysine was labeled with [13C and 15N] atoms, resulting in a mass shift of +8 or +10 Da, respectively. Aliquots were stored in 5% acetonitrile/0.1% formic acid at −20°C until use.
Antibodies were immobilized on 2.8 μm Dynabeads Protein G magnetic beads (no. 10004D, Invitrogen, Carlsbad, CA) in a 1 μg antibody-to-2.5 μL of beads ratio. In brief, 250 μL of the beads were added to 1.5 mL Eppendorf tubes (022363204 Eppendorf) and washed twice with 250 μL of 1 × PBS + 0.03% CHAPS, followed by the addition of 100 μg of antibody and 1 × PBS + 0.03% CHAPS (no. 28300, Thermo Scientific) to yield a total 250 μL of volume. The antibodies were allowed to couple to the beads overnight with tumbling at 4°C. The next day, the antibodies were immobilized onto the beads with chemical cross-linking. Briefly, antibody beads were collected using magnetic pulldown, excess PBS was discarded, and 300 μL of freshly prepared 20 mM DMP (dimethyl pimelimidate dihydrochloride, no. D8388, Sigma) in 200 mM triethanolamine, pH 8.5 (no. T58300, Sigma) was added. The samples were tumbled for 30 min at room temperature, and the DMP in triethanolamine was discarded. Two-Hundred and Fifty microliter of 150 mM monoethanolamine (no. 411000, Sigma) was added and the beads were tumbled at room temperature for 30 min. The antibody beads were washed twice using 250 μL of 5% acetic acid + 0.03% CHAPS (5 min of tumbling at room temperate each time), and washed once more using 250 μL of 1 × PBS + 0.03% CHAPS. The ATP7B, BTK, WASp, and CD3ϵ antibody-linked beads were then washed and incubated in 5% acetic acid + 3% acetonitrile (ACN), washed with 250 uL of 1xPBS + 0.03% CHAPS, and the latter two steps were repeated once. All antibody-linked beads were washed with 250 μL of 1 × PBS + 0.03% CHAPS until neutral pH (7.0) was achieved, then resuspended in 250 μL of 1 × PBS + 0.03% CHAPS and 2.5 uL of NaN3 (52002-5G Sigma Aldrich) for anti-fungal properties and stored at 4°C until use.
DBS Protein Extraction and Trypsin Digestion
All protein extraction and trypsin digestion steps were performed at Seattle Children's Research Institute (SCRI). For each sample (blinded normal controls or patients), one entire DBS spot (13 mm) containing ~70 μL blood was perforated into approximately 17 punches at 3-mm diameter with a standard leather punch tool. Final sample representation was WAS: n = 11, XLA: n = 26, SCID: n = 3 and normal controls (n = 40). The punches were placed in a 1.5 mL eppendorf tube, and 490 μL of 0.1% ProteaseMax in 50 mM ammonium biocarbonate (pH 8) was added into each tube. The tubes were vortexed for 1 h on the Eppendorf MixMate (Eppendorf, Hamburg, Germany), after which 10 μL of each sample were aliquoted and diluted 200-fold for Bradford assay to determine protein concentration. Disulfide bond reduction was performed with 2 M DTT at 5 mM, and an additional 490 μL of 0.1% ProteaseMax in 50 mM ammonium biocarbonate (pH 8) was added into each tube before incubation in 37°C water bath for ~30 min. Trypsin was then added at a 1:50 enzyme to protein ratio (w/w), and acetonitrile was added to a final concentration of 15%. The mixture was incubated in a 37°C water bath overnight for digestion before centrifugation for 10 min at 13,000 RPM before each supernatant was transferred to a new tube and dried in the Savant™ SpeedVac™ High Capacity Concentrator (Thermo Fisher Scientific (Waltham, MA). All trypsinized DBS digests were stored at −80°C until use.
For samples analyzed from the Washington State NBS laboratory, Five or Six 3-mm punches were used for protein extraction and digestion (n = 62). Procedures were identical to those for previous samples except that volumes were reduced as follows: 150 μL of 0.1% ProteaseMax and 0.78 μL DTT for each addition.
Liquid Chromatography–Tandem Mass Spectrometry
Enriched samples were analyzed at two sites (one at SCRI and one at Fred Hutchinson Cancer Research Center), to examine the inter-laboratory variability in data acquisition, utilizing two separate LC-MS/MS systems and instrument configurations (described below). Measured peptide concentrations were then compared for method validation. Peptide parent and daughter ion spectra have been previously reported (31).
At Seattle Children's Research Institute: Instruments included a Waters Xevo TQ-XS MS with ionkey source technology connected to Waters M-Class Gradient and Loading pumps (Waters, Milford MA). Chromatographic solvents were A: H2O + 0.1% Formic Acid (FA) and B: ACN + 0.1% FA. Initially, peptides mixtures were loaded onto a M-Class Trap Symmetry 300 μm × 50 mm C18 column (100 Å, 5 μm) utilizing a constant flow of 98:2 A:B at 20 uL/min for 3 min. Subsequently, the flow was reversed and peptides were separated using gradient flow across a 150 μm × 100 mm BEH C18 ikey (130 Å, 1.7 μm). Gradient method programming is shown in Table 1. The peptides monitored in this location were BTK 407, WASp 289, WASp 274, ATP7B 1056, and CD3ϵ 197.
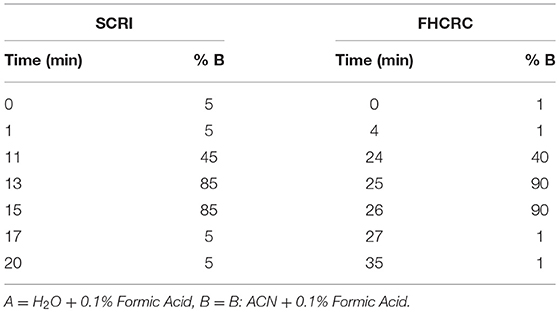
Table 1. LC method setup for signature peptide separation at Seattle Children's Research Institute and Fred Hutchinson Cancer Research Center.
Parameters for transitions and collision energy (CE) were taken from a linear regression of previously optimized values in Skyline and those generated using Waters intellistart technology to identify the most intense fragments upon ionization. SRM transitions were acquired at unit/unit resolution in both the Q1 and Q3 quadrupoles with 5 ms dwell time and 3 ms pause between mass ranges, resulting in a cycle time of 1.5 s. All samples were run in a blinded fashion.
Fred Hutchinson Cancer Research Center: LC-MS was conducted on a SCIEX 5500 QTRAP mass spectrometer interfaced with an Eksigent 425 LC and Nanoflex Chip system. Chromatographic solvents were A: H2O + 0.1% Formic Acid (FA) and B: 90% ACN + 0.1% FA. Peptides were loaded on a 0.2 × 0.5 mm trap column (Reprosil-Pur AQ C18, 3 um, 120 A) at 2% B using a flow rate of 4 uL/min for 4 min. Peptides were eluted on a 0.075 × 150 mm column (Reprosil-Pur AQ C18, 3 um, 120 A) at 300 nL/min. The gradient program is shown in Table 1.
Collision energy settings were taken from Skyline (35). Transitions were acquired at unit/unit resolution with a 10 ms dwell time and 5 ms pause between mass ranges resulting in a cycle time of 0.75 s. All data were acquired in a blinded fashion.
Data Analysis
All SRM data were analyzed and plotted using Skyline (MacCoss Lab Software, open source, Seattle, WA, https://skyline.ms/project/home/begin.view) (35). Endogenous target peptide concentrations were quantified by comparing the ratio of the peak area of the signature peptide to its IS added at a known concentration (100 fmol). Statistics were generated using Graphpad Prism (San Diego, CA). Receiver operating characteristic (ROC) curves were constructed using Graphpad Prism and a 95% confidence interval.
Selection of Surrogate Peptides and Antibody Production
Surrogate peptides for BTK, WASp, and CD3ϵ were selected by in silico trypsin digestion and NCBI BLAST tools. Final peptide selections were made according to accepted major criteria for immuno-SRM development including peptide length, lack of post-transcriptional modifications, and uniqueness in the human genome by BLAST searching as previously described (31, 36, 37). Peptide selection and monoclonal antibody production for ATP7B signature peptides have been previously reported (33). Crude peptides were then screened empirically to determine suitability for detection and quantification by LC-MS/MS.
Affinity-purified rabbit polyclonal antibodies (pAb) were successfully generated against five peptides by Pacific Immunology (Ramona, CA). Briefly, signature peptides were synthesized with an N-terminal cysteine, conjugated to keyhole limpet hemocyanin (KHL) for immunization. Two New Zealand white rabbits were injected per peptide. pAbs for all selected peptides successfully underwent affinity-purification from 25 mL of antiserum. A monoclonal antibody was used for ATP7B peptide capture as described (38).
Peptide Immunoaffinity Enrichment
Peptide immunoaffinity enrichment was performed at SCRI. DBS digests were resuspended in 1 × PBS + 0.03% CHAPS to yield a 1 μg/μL nominal protein digest concentration. Cross-linked, antibody-coated beads were added to a total mass of 2 μg pAb for each target along with 20 μL of 1M Tris pH 8.0 (15568-025 UltraPure Invitrogen). Isotope-labeled peptides were added as internal standards (IS). This suspension was incubated overnight with tumbling at 4°C to achieve peptide capture. The next day, the antibody bead: peptide complexes were washed twice with 100 μL PBS + 0.01% CHAPS and once in 100 μL 0.01% PBS + 0.01% CHAPS. Finally, the peptides were eluted by incubation in 30 μL of 5% acetic acid/3% ACN. Released peptides were stored at −80°C until analysis. For samples analyzed from the WA State NBS laboratory, procedures were identical to those for previous samples except that volumes were reduced as follows: 58.1 μL of 1x PBS + 0.03% CHAPS, 0.59 μg pAb for each peptide, 3.13 μL IS, and 12.5 μL TRIS.
Method Performance Assessment
A response curve was performed to determine assay linearity and sensitivity in a background matrix of DBS. Punches from normal control DBS (4 punches per sample) were extracted using extraction buffer (ProteaseMax, ammonium bicarbonate) in triplicate. Trypsin digestion was performed on the extracted protein, and the digests were pooled to create a common background matrix. Heavy stable isotope standards were spiked into the digest and serially diluted to create samples with varying peptide amounts (2000, 200, 12.5, 4.17, 1.39, 0.69 fmol). Samples were then processed as described above.
Repeatability and intra- and inter-assay precision were characterized by performing measurement of endogenous (light) peptide signal over 5 separate days. Each sample was analyzed in 5 complete process replicates (including punches, extraction, digestion, enrichment, and mass spectrometry) per day.
Stability was assessed by comparing the endogenous peptide detected in DBS stored at room temperature for 1 day and 3 days to peptide detected in DBS preserved at −80°C in a sealed container. Each sample was processed as described above in triplicate. Percent difference was calculated at each time point.
Inter-laboratory Validation of the Analytical Assay
DBS extractions, trypsin digestion, and peptide captures for patient samples were all performed exclusively at Seattle Children's Research Institute (SCRI). Peptide solutions eluted from antibody-beads were split into two 15 μl aliquots for analysis at SCRI and Fred Hutchinson Cancer Research Center (FHCRC) for inter-laboratory comparison of the analytical performance of the assay.
Results
Peptide Selection and Antibody Development
Selected peptide sequences, molecular weights, parent, and daughter ions are listed in Table 2.
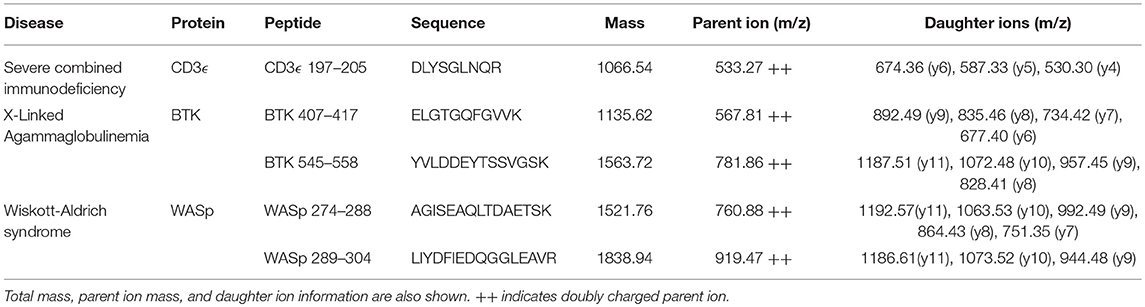
Table 2. Protein targets and sequences used for immuno-SRM study.
Fragmentation patterns for the peptides of interest have been previously reported (31). Affinity-purified polyclonal antibodies (Pacific Immunology, Ramona, CA) were generated against all five peptides and pursued for use in human samples because of their ability to successfully capture their target sequences and the absence of background signals brought on by copurified peptide contaminants (26, 28, 39).
Method Performance Assessment
Analytical figures of merit are reported in Table 3. Overall, the linear responses spanned a range from 1.39 to 2000 fmol of peptide (Figure 1).
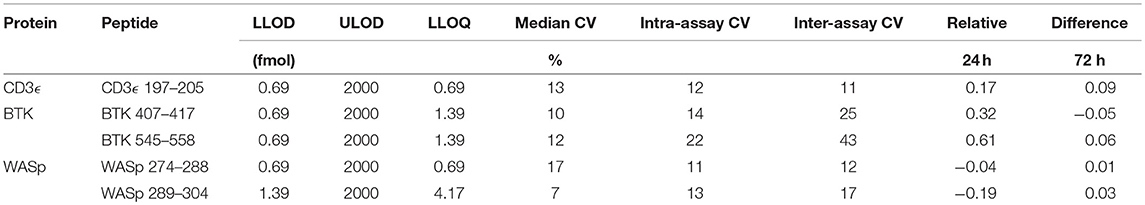
Table 3. Analytical performance of signature peptides.
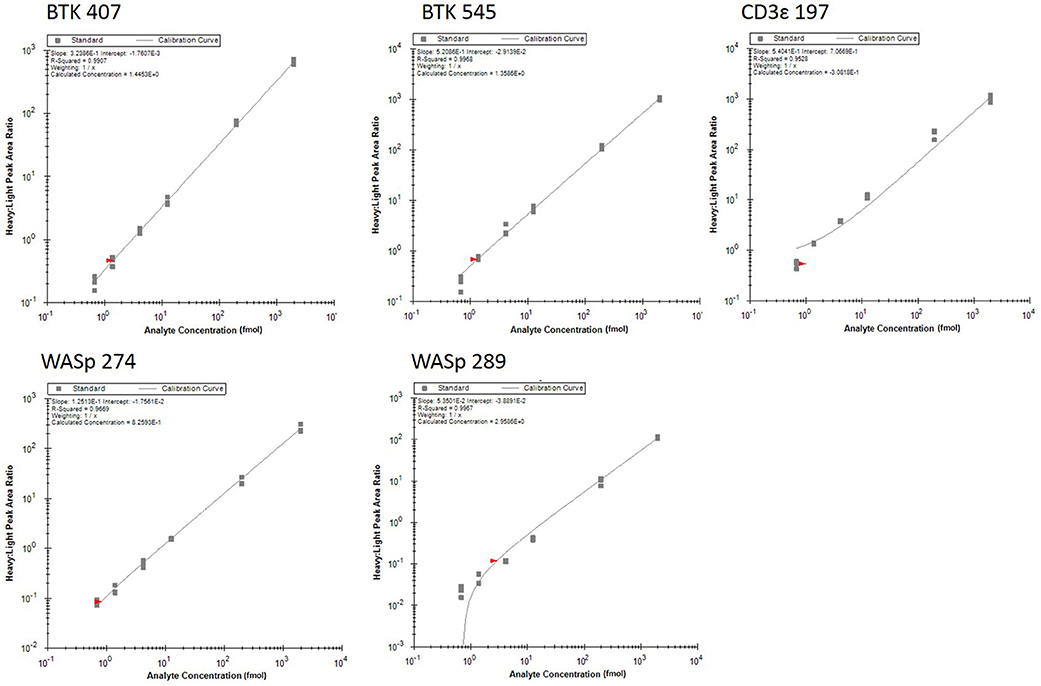
Figure 1. Response curves for peptides measured by the multiplexed immuno-SRM assay. Response curves plot the heavy: light peak area ratio as a function of heavy peptide concentration, measured in a background matrix of digested protein extracted from dried blood spots. The curves allow determination of the linear range and sensitivity of the assay. Each data point is plotted as a gray box and linear regression is plotted as a line. Regression fit parameters are reported in the corner of each plot.
The median coefficient of variation (CV) for all points on the response curve was 11%. Lower limits of quantification (LLOQ) were defined by the lowest point to yield a CV < 20%. LLOQs ranged from 0.69 to 12.5 fmol. There were five peptides detected above LLOQ in the DBS samples. Across all peptides, the mean intra-assay (i.e., within-day) variability ranged from 11 to 22% while the inter-assay (i.e., between-day) variability ranged from 11 to 43%. Of note, a single peptide (BTK 545-558) showed variability greater than 20% CV.
Finally, stability was assessed by comparing the endogenous (light) peptide detected in DBS stored at room temperature for 1 day and 3 days to peptide detected in DBS preserved at −80°C in a sealed container. Results are reported in Table 3. All five peptides had endogenous signal above the LLOQ and little variability over time. Representative SRM chromatograms for each peptide are shown in Figure 2.
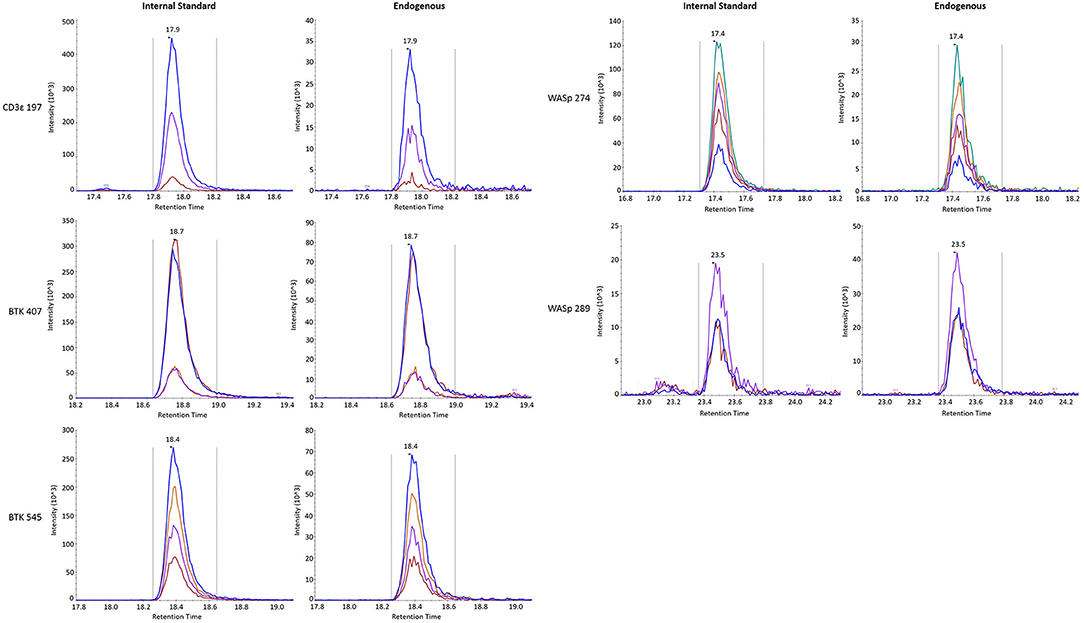
Figure 2. SRM traces for internal standard (Left) and endogenous (Right) signature peptides.
Overall, there was high level of agreement between the concentrations quantified from samples prepared at one site and analyzed by two separate instrumental analyses. Correlation plots comparing the two measurements, Figure 3, show the linearity of measured concentrations with R2 values ≥ 0.97 in the cases of primary peptides WASp 274, CD3ϵ 197, BTK 407, and ATP7B 1056. The measurements of WASp 289 were found to correlate with R2 = 0.85 and would therefore be used as a secondary marker (Figure 4).
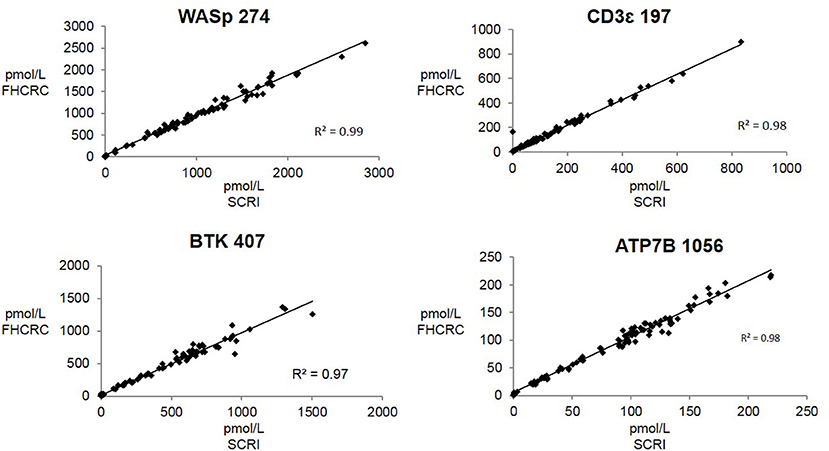
Figure 3. Inter-laboratory correlation in measured PIDD peptide concentrations. SCRI, Seattle Children's Research Institute; FHCRC, Fred Hutchinson Cancer Research Center.
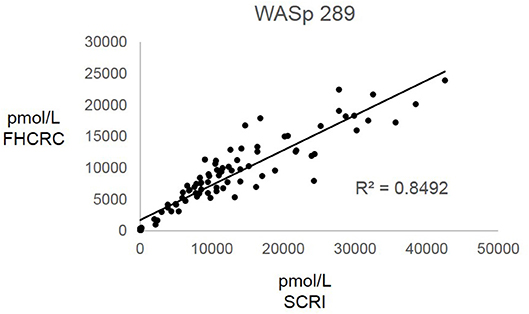
Figure 4. Inter-laboratory analytical validation of WASp 289. SCRI, Seattle Children's Research Institute; FHCRC, Fred Hutchinson Cancer Research Center.
Peptide Concentrations
After analysis, normal controls were unblinded to define normal ranges for affected patient comparison. The average peptide concentrations from normal controls were as follows (average ± SD): BTK 545 = 1038.44 ± 465.77 pmol/L, BTK 407 = 635.09 ± 260.40 pmol/L, WASp 289 = 10326.98 ± 4513.13 pmol/L, WASp 274 = 1176.96 ± 456.68 pmol/L, and CD3ϵ = 228.68 ± 150.98 pmol/L. Analysis of signature peptides found statistically significant (p < 0.05–0.0001) reductions in patient peptide levels relative to control groups in each case (Figure 5).
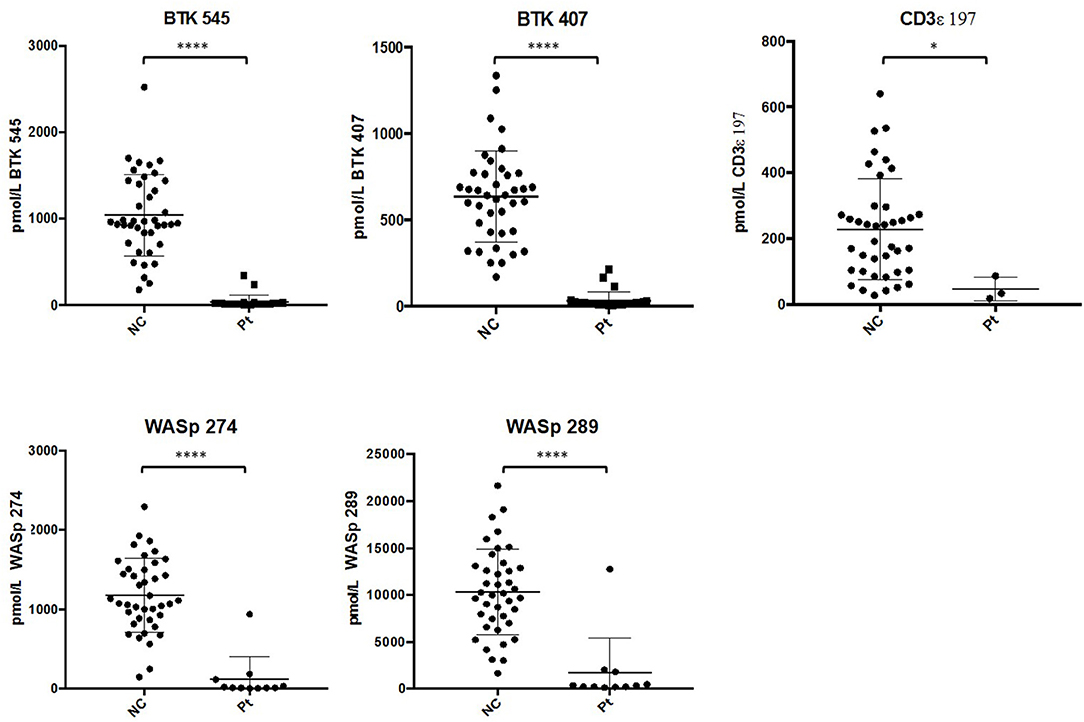
Figure 5. Differences in signature peptide levels between patients (WAS: n = 11, XLA: n = 26, SCID: n = 3) and normal controls (n = 40). Error bars indicate mean ± SD. WAS patient sample with high levels of WASp peptides was identified to be collected after bone marrow transplantation. ****p < 0.0001, *p < 0.05.
Peptide levels in the majority of affected patients were significantly diminished or absent (Table 4). For each patient, the concentration of ATP7B 1056 was also determined using previously developed immuno-SRM methodology (33). These protein concentrations served as quality control (QC) measurements and their consistency across samples was used to assess digestion and process reproducibility (Table 5).
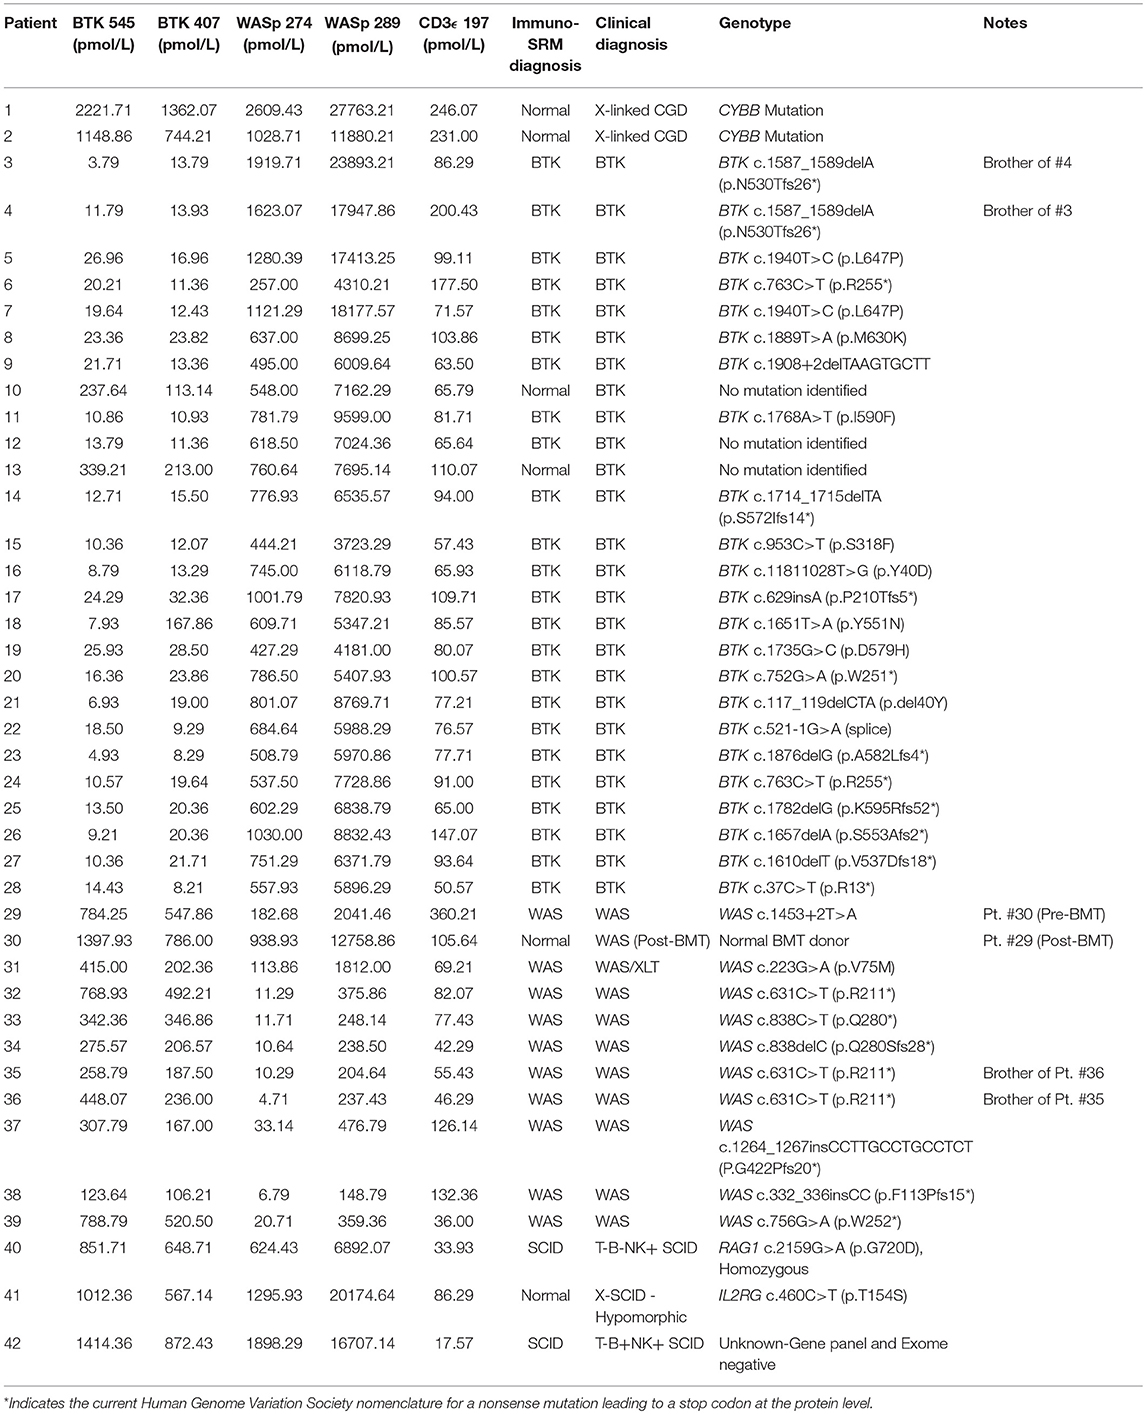
Table 4. Concentrations of signature peptides in a blinded patient cohort study.
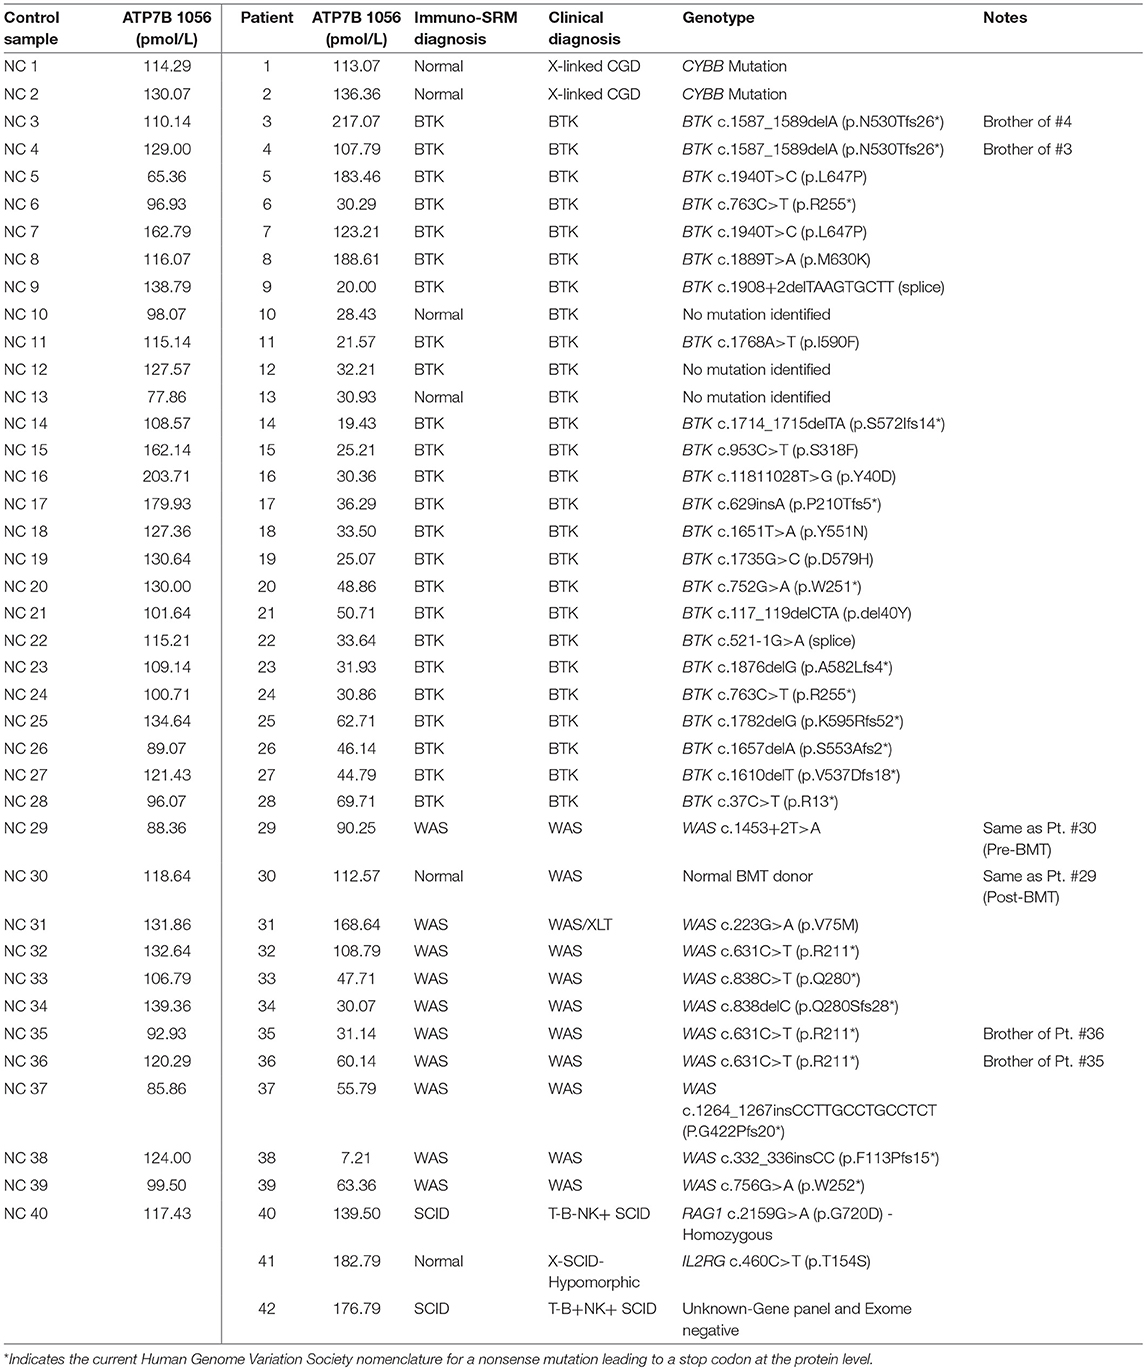
Table 5. ATP7B 1056 signature peptide concentrations.
Peptide concentration cutoffs for each PIDD diagnosis were arbitrarily set at −2 SD (BTK 545), −2.25 SD (BTK 407), −2.15 SD (WASp 274), −1.75 SD (WASp 289), and −1.25 SD (CD3ϵ). This translated to cutoff concentrations of 106.90 pmol/L (BTK 545), 49.19 pmol/L (BTK 407), 195.10 pmol/L (WASp 274), 2428.99 pmol/L (WASp 289), and 39.96 pmol/L (CD3ϵ). Use of these ranges resulted in 2 false positives in the normal controls. NC4 and NC20 were indicated to be WAS and SCID patients, respectively. NC signature peptide values are shown in Table 6.
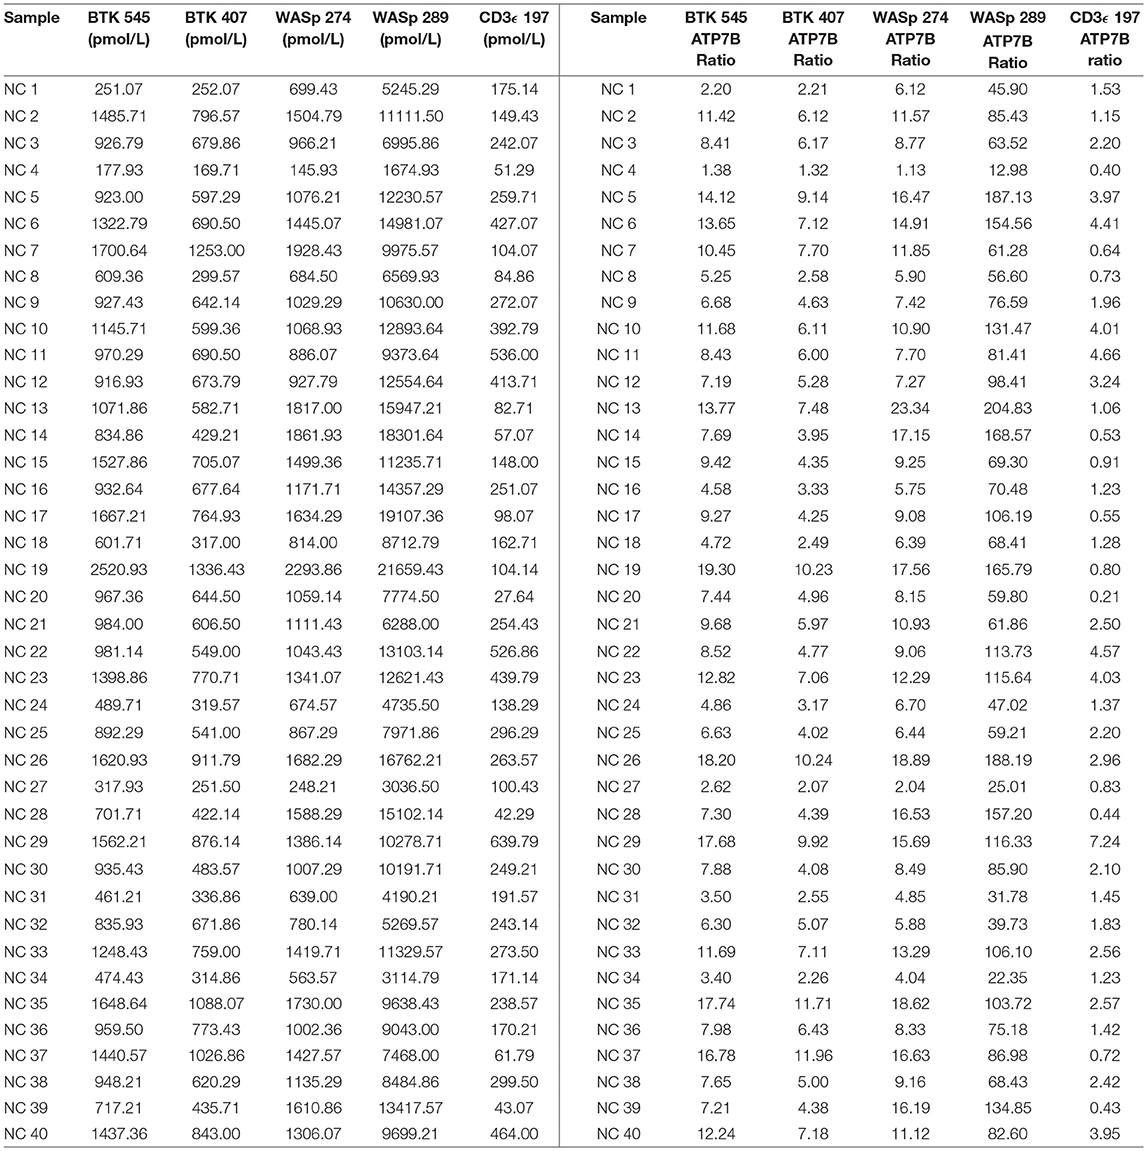
Table 6. Quantification of signature peptides in normal controls from a blinded cohort study.
Using these cutoffs, the specific PIDD diagnosis was predicted for each patient. Predicted diagnoses showed excellent agreement with clinical or genetic diagnoses as shown in Table 4. Every molecularly-confirmed case of WAS and BTK was also diagnosed by immuno-SRM analysis. Two patients, Patient 10 and 13, who were clinically diagnosed as agammaglobulinemia, had normal levels of BTK protein by immuno-SRM. Molecularly, no variants in BTK were identified in these patients (34). Interestingly, patient 12 with agammaglobulinemia had low levels of BTK protein, but no variants were found in the coding regions of BTK. In addition, one case of X-linked hypomorphic SCID, patient 41, was identified as normal by immuno-SRM. For each signature peptide utilized, area under the curve (AUC) analysis of the ROC plots reveal areas from 0.925 to 0.999 with p-values ranging from 0.015–0.0001 (Figure 6). Overall, 97.6% of cases had concordance between the clinical diagnosis and immuno-SRM assay results. Interesting outlier and discordant cases are described further in the discussion.
Signature peptide concentrations for randomly selected NBS lab samples are shown in Table 7. Each DBS sample had measured peptide concentrations above the previously set diagnostic cutoffs for PIDDs, indicating unaffected status.
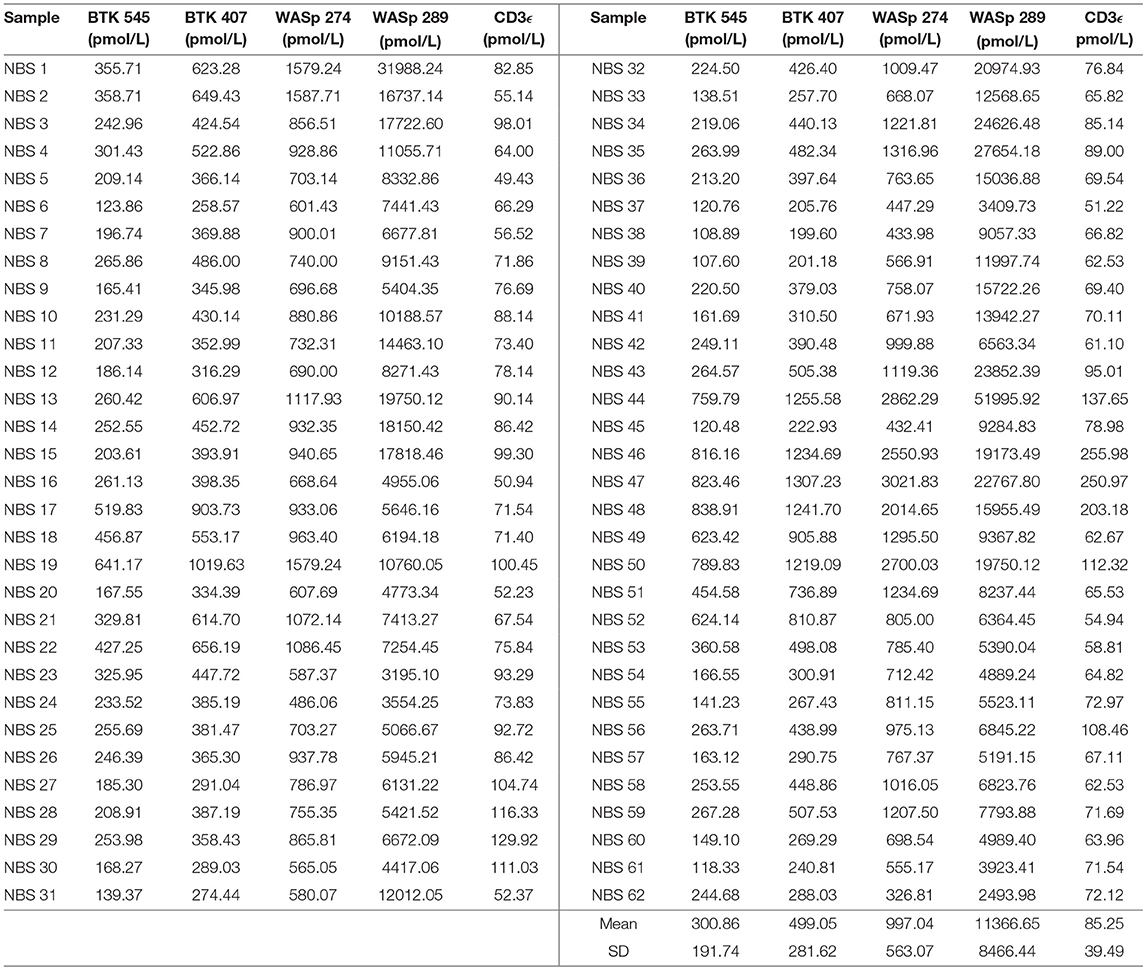
Table 7. Signature peptides levels in DBS obtained from Washington State Newborn Screening Laboratory (Samples collected prior to March 2015).
Discussion
We have demonstrated immuno-SRM as a sensitive and specific proteomic screening method for the multiplex detection of patients with three life-threatening PIDD (i.e., SCID, WAS, and XLA) from DBS. Our results clearly differentiate patients with PIDD from normal controls, with low levels of endogenous peptides of transmembrane protein CD3ϵ and intracellular proteins WASp and BTK correlating with the target diseases (SCID, WAS, and XLA, respectively). These diagnoses can be made in a single run with a total runtime of 20 min or ~6.67 min per disease target. Our results also demonstrate peptide stability in DBS, with minimal variability in concentrations after 72 h of storage at room temperature (Table 3).
The immuno-SRM platform reliably detected endogenous peptide from normal control DBS in this highly multiplexed fashion. Normal control DBS (N = 40) were unblinded and utilized to define the normal ranges and potential screen-positive cutoffs (Table 6). In clinical laboratories, reference ranges for diagnostic tests are determined by the normal distribution in the general population. Given that these samples were obtained under strict standard operating procedures, variability amongst this group is likely due to inherent inter-patient variability. These samples were not controlled for age, gender, ethnicity, or differences in blood characteristics and likely represent a broad snapshot of the population. These possible differences in patient subgroups need to be further explored in larger pilot studies. Initial cutoffs for screening tests are typically conservative, aiming to detect all true positives without creating an excessively high screen positive rate relative to the incidence of disease. However, these cutoffs are continually validated and adjusted in accordance with population-based studies. Given these parameters, the definition of screen-positive results ranged from 1.25 to 2.25 SD below the mean for the peptides in this study. The chosen cutoffs generated 2 false positive normal controls, one WAS (NC4) and one SCID (NC20) (Table 6). In the case of NC4, rescreening showed WASp levels in the normal range. These preliminary cutoffs are not static and will become better defined as higher numbers of normal controls and patient samples are screened.
Using these cutoffs, we were able to positively identify every molecularly-confirmed BTK and WAS patient covering a broad range of variants (Table 4). As hypothesized, peptide concentrations are reduced in the majority of BTK and WAS cases independent of genotype (18, 19, 40). These peptide levels are therefore promising biomarkers for diagnosis and screening. Of the 3 SCID patients available for testing, 2 were positively identified by CD3ϵ analysis. The third patient, while having low CD3ϵ levels relative to the majority of the normal controls, was within the defined cutoffs and was found to have a “hypomorphic” variant in IL2RG known to generate a partially functional protein. This is reflected by the patients total CD3+ T-cell count that was mildly low (800 cells/μL) but not absent as in the classical form of SCID. Since CD3ϵ is exclusively expressed by CD3+ T cells in peripheral blood, the amount of CD3ϵ protein present is reflective of total CD3+ T cell counts. Therefore, patients with hypomorphic forms of SCID, “leaky” forms of SCID who have expanded oligoclonal T cell populations, or expanded maternally-derived T cells may be missed by the Immuno-SRM approach (1). Given the genetic heterogeneity of SCID, it may not be possible to universally screen all subtypes with a single universal marker. Second generation immuno-SRM screens will benefit from the inclusion of more specific protein biomarkers for the more common subtypes, such as those featuring ADA, recombination activating gene 1 (RAG1), or interleukin 2 receptor subunity gamma (ILR2G) deficiency.
ROC curves were constructed to assess the diagnostic ability of immuno-SRM analysis. These plots relate the true positive rate to the false positive rate with increasingly stringent cutoff values. As diagnostic cutoffs are lowered, the test will have greater ability to note true positives, but this process is also more likely to lead to false positives. A screening test maintaining a high true positive rate and a low false positive rate will therefore lead to graphs lying close to the y axis and a large AUC (Figure 6). These values for immuno-SRM indicate high diagnostic potential for immuno-SRM analysis of signature peptides of PIDDs.
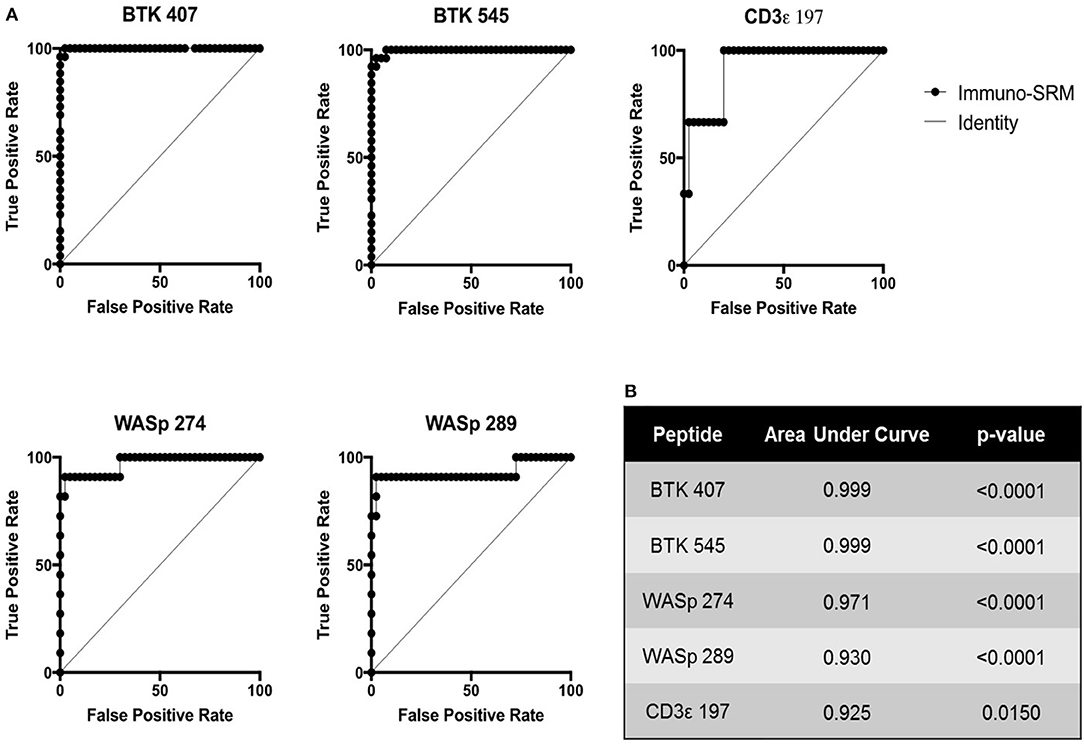
Figure 6. ROC plots showing the diagnostic performance of Immuno-SRM for PIDDs. (A) ROC plots for each signature peptide. True positive and false positive rates are plotted for increasingly stringent cutoff values. Line of identity indicates a test that cannot distinguish patients from controls. (B) Area under the curve (AUC) values and p-values for each peptide of interest.
QC monitoring of digestion and process performance is included in the current immuno-SRM multiplex in the form of ATP7B signature peptide measurements. As not all detected metabolites are helpful NBS targets, the calculation of metabolite ratios and secondary metabolite analysis are employed to improve the sensitivity and specificity of NBS for certain diseases, such as C3:C2 ratio and 2-methylcitric acid analysis in methylmalonic aciduria (41). In addition, target ratioing can account for variability between samples brought on by a number of factors including sample collection quality, storage, extraction and digestion efficiency, and blood characteristics (30). Here, ATP7B concentrations were found to be largely consistent across the screened samples (Table 5). In the future, absent ATP7B could serve to flag improperly processed or handled specimens. As a pilot, we compared each PIDD peptide by ratio to the endogenous concentration of ATP7B in the same sample. The resulting predictions based on peptide concentrations showed complete agreement with the clinical diagnosis, demonstrating immuno-SRM, and ATP7B ratioing can be an effective and complementary tool for PIDD diagnosis (Tables 8, 9). These types of ratios have potential utility in clinical immuno-SRM screening, provided the chosen peptide is proven to be a ubiquitous and invariant signal across a large cohort of samples.
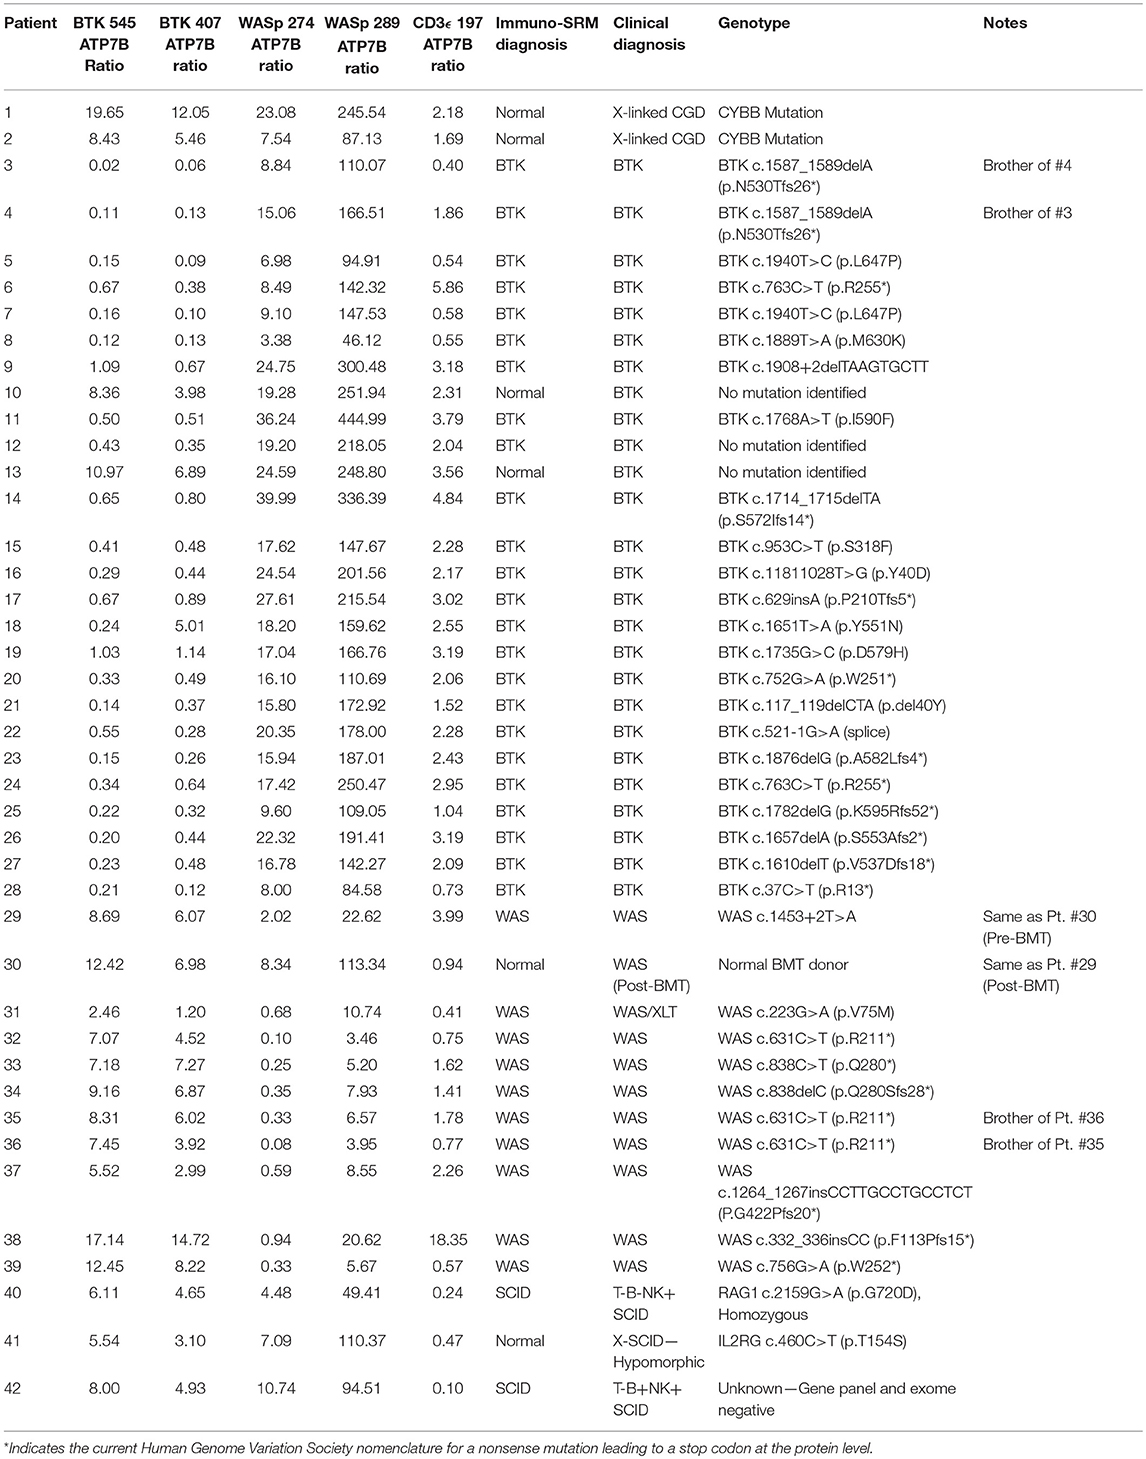
Table 8. Ratios of signature peptides against ATP7B peptide and patient diagnosis in a blinded cohort study.
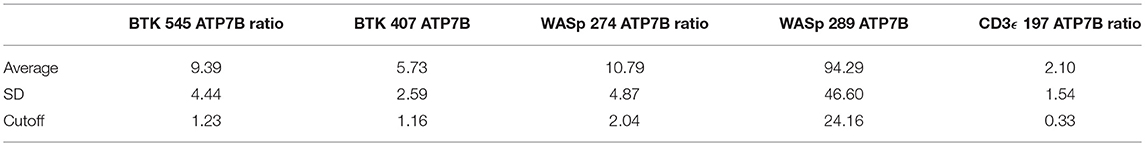
Table 9. Cutoffs for signature peptides by the ratios against ATP7B peptide.
One case demonstrated the benefit of having both primary and secondary signature peptides for each protein of interest. Patient 18 was predicted to have XLA using analysis of BTK 545 instead of primary marker BTK 407. Levels of BTK 407 were significantly reduced relative to the average, 167.86 vs. 642.16 pmol/L, but not quite low enough to trigger a positive screen. In contrast, BTK 545 levels were nearly absent (Table 4) because the patient harbors the p.Y551N variant, which is located within the amino acid sequence 545–558 encompassed by the signature peptide itself. In this case, our multiplexed peptides allowed for confirmation of a positive diagnosis that was initially borderline.
It was notable that we found normal levels of BTK in two clinically defined agammaglobulinemic individuals (patients 10 and 13) who lacked variants in BTK by Sanger sequencing (Table 4). These patients therefore likely do not have XLA but may have autosomal forms of agammaglobulinemia, although broader genetic testing was not performed. Patient 12 had diminished levels of BTK protein but no identifiable variant in BTK. This suggests the variant may have been missed during sequencing of the coding region and intron-exon junctions because the patient's BTK variant may affect either the regulatory elements, Poly-adenylation signal, or intronic regions. These cases highlight the clinical utility of immuno-SRM.
Additionally, two samples obtained from the same WAS patient pre- and post-bone marrow transplant (BMT) were analyzed (samples #29 and 30 in Table 4, respectively). Pre-BMT, immuno-SRM analysis identified the patient as having WAS. Post-BMT, the patient was identified as normal. This case highlights the ability of immuno-SRM to follow the therapeutic course of BMT and confirm successful reconstitution of the immune system. It is possible that a similar principle would apply to patients with monogenetic disorders undergoing gene therapy.
Overall, the analysis showed the immuno-SRM assay to have a broad linear range and acceptable precision in determining the concentrations of target peptides in DBS (Table 3). Correlation plots show significant concordance of sample analysis by different MS instruments in two separate laboratory facilities (Figures 3, 4). Four of the five primary peptides, BTK 407, WASp 274, ATP7B 1056, and CD3ϵ 197 were nearly identical upon analysis with R2 values > 0.97. WASp 289 showed slightly more variable performance with an overlap of R2 = 0.85 and would therefore likely be a secondary marker to WASp 274 when conducting clinical analysis. Additionally, BTK 545 showed a variability greater than 20% CV, which would make it suitable as a secondary marker to BTK 407. These results show that immuno-SRM analysis has high potential for clinical application and transferability. Further work is underway to validate the inter-laboratory transferability of the assay.
Randomly selected samples provided by the NBS laboratory of Washington State were used to test the feasibility of utilizing immuno-SRM analysis in the context of NBS. Due to limited sample availability and to test the ability of immuno-SRM to analyze signature peptides from a smaller sample, the amount of DBS used was reduced from 1 whole spot to Five or Six 3-mm punches. Peptides of interest were enriched and analyzed with minimal change to sample processing. The concentrations of signature peptides were all still greater than the pre-defined cutoffs obtained from analysis of known normal controls (Table 7). These newborns would therefore be designated as normal. Upon analysis it was evident that, while average concentrations of WASp related peptides were in agreement with previously generated normal control values, BTK and CD3ϵ concentrations were significantly reduced. As these samples were obtained in 2014, it is unclear whether this reduction is evidence of a biological difference between newborns and adults or secondary to preferential degradation of these proteins relative to WASp. The ability to robustly perform this analysis with a greatly reduced sample input makes immuno-SRM analysis more amenable to translation into NBS. With optimization, we are confident the assay can be improved with further reduction in sample consumption, higher efficiency in multiplexing, decreased analytical runtimes, automation, and higher affinity monoclonal antibodies. The high specificity of mass spectrometry makes increasing the number of multiplexed targets straightforward, including the addition of peptides as secondary markers or expansion to include other conditions. This high-throughput multiplexed method may effectively decrease run time per disease, making it suitable for NBS where current automated methods have a typical run time of less than 3 min (42). The successful prediction of BTK patients using DBS shipped at ambient temperature via traditional post from Vietnam also highlights the potential utility for diagnostic testing in resource poor settings where collection and shipping of DBS has to be economical.
A number of limitations exist in this current generation immuno-SRM screen that can be improved upon to better define the assay for use in a population-based screen. In terms of process, current assays feature longer runtimes and greater sample consumption than would be ideal for translation into the newborn screening laboratory. Work is ongoing to optimize LC-MS/MS gradients, column types, and extraction procedures to be able to maximize peptide signal and reliability in the shortest possible assay. Further sample reduction will be possible with the development of higher signal signature peptide targets such that lower concentrations will give greater or equivalent MS response. In addition, optimization of peptide elution procedures would provide reduced background to allow for both greater signal and faster screening times. A greater reliability and confidence will come with incorporation of additional peptide sequences for proteins of interest. Currently, for instance, there is available only one target sequence for CD3ϵ. Additional secondary markers will provide a more robust assay. Finally, the limited number of samples analyzed here allow for the definition of only tentative normal control and disease ranges. A greatly expanded pilot study will provide better defined ranges and inclusion of a broad range of patient backgrounds will delineate possible inherent differences due to age, gender, or ethnicity.
NBS has been one of the most successful public health initiatives in modern times, but traditionally relies on the detection of accumulated metabolites due to downstream enzyme deficiency. However, many genetic disorders including PIDD are characterized by absent or decreased proteins, limiting the scope of current NBS methods (18, 19). By being able to detect PIDD-related peptides from DBS, immuno-SRM may bridge this gap in current coverage, allowing for the expansion of NBS to treatable diseases currently without metabolite biomarkers. Immuno-SRM would rapidly provide quantified evidence of protein deficiency and could be performed simultaneously with initial screening and molecular analysis from DBS without further invasive procedures. In fact, complementary testing with both targeted proteomic analysis and molecular testing would provide significant value by not only rapidly identifying potential patients but also providing information on the effects of variants of unknown significance where they are found. Quantification of these signature peptides lays the foundation for immuno-SRM as a highly multiplexable screening and diagnostic tool for various congenital diseases.
Author Contributions
SH, CC, JW, and AP conceived the study. CC, SJ, and RD performed experimentation and data analysis. GS, TT, and HO provided patient samples and analyzed the data. IC wrote the first draft of the manuscript, and CC contributed significantly to the methods and discussion. All authors reviewed and revised the manuscript, and approved the final version for submission.
Funding
This work is supported by the National Institute of Allergy and Infectious Diseases R01AI123135-02 and the National Cancer Institute (U01CA214114 and R50CA211499). IC is supported by the National Institutes of Health T32GM007454 and the Shire/ACMG Foundation Next Generation Medical Biochemical Genetics Fellowship Award. GS and HO are supported by the Jeffrey Modell Foundation. HO has support from the DeJoria Wiskott-Aldrich Research Fund. The content is solely the responsibility of the authors and does not necessarily represent the official views of the NIH.
Conflict of Interest Statement
AP is founder of Precision Assays.
The remaining authors declare that the research was conducted in the absence of any commercial or financial relationships that could be construed as a potential conflict of interest.
Acknowledgments
We thank the patients and families for participating in our study.
Abbreviations
ACD, Acid Citrate Dextrose; ADA, Adenosine Deaminase; ATP7B, ATPase copper transporting protein; BTK, Bruton's Tyrosine Kinase; CD3, Cluster of Differentiation 3; DTT, Dithiothreiol; FA, Formic Acid; HLA, Human Leukocyte Antigen; IS, internal standard; ILR2G, Interleukin 2 receptor subunity gamma; LC-MS/MS, Liquid Chromatography Tandem Mass Spectrometry; SRM, Selected Reaction Monitoring; Immuno-SRM, Immunoaffinity enrichment coupled to selected reaction monitoring; SISCAPA, Stable Isotope Standards and Capture by Anti-Peptide Antibodies; PBMC, Peripheral Blood Mononuclear Cells; PIDD, Primary Immunodeficiency Disorders; SCID, Severe Combined Immunodeficiency; SNP, Single Nucleotide Polymorphism; UPLC, Ultra Performance Liquid Chromatography; WAS, Wiskott-Aldrich Syndrome; WASp, Wiskott-Aldrich Syndrome Protein; WBC, White Blood Cell; XLA, X-Linked Agammaglobulinemia; TREC, T Cell Receptor Excision Circle; KREC, Kappa-deleting Element recombination Circle; AUC, Area Under the Curve; RAG1, Recombination activating gene 1; ROC, Reciever Operating Characteristic; CV, Coefficient of Variation; LLOQ, Lower Limit of Quantification.
References
1. Picard C, Bobby Gaspar H, Al-Herz W, Bousfiha A, Casanova J-L, Chatila T, Crow YJ, et al. International union of immunological societies: 2017 primary immunodeficiency diseases committee report on inborn errors of immunity. J Clin Immunol. (2018) 38:96–128. doi: 10.1007/s10875-017-0464-9
2. Buckley RH, Schiff SE, Schiff RI, Markert L, Williams LW, Roberts JL, et al. Hematopoietic stem-cell transplantation for the treatment of severe combined immunodeficiency. N Engl J Med. (1999) 340:508–16. doi: 10.1056/NEJM199902183400703
3. Fischer A, Hacein-Bey-Abina S, Cavazzana-Calvo M. Gene therapy for primary adaptive immune deficiencies. J Allergy Clin Immunol. (2011) 127:1356–9. doi: 10.1016/j.jaci.2011.04.030
4. Chan B, Wara D, Bastian J, Hershfield MS, Bohnsack J, Azen CG, et al. Long-term efficacy of enzyme replacement therapy for adenosine deaminase (ADA)-deficient severe combined immunodeficiency (SCID). Clin Immunol. (2005) 117:133–43. doi: 10.1016/j.clim.2005.07.006
5. Grunebaum E, Mazzolari E, Porta F, Dallera D, Atkinson A, Reid B, et al. Bone marrow transplantation for severe combined immune deficiency. JAMA (2006) 295:508–18. doi: 10.1001/jama.295.5.508
6. Chan K, Puck JM. Development of population-based newborn screening for severe combined immunodeficiency. J Allergy Clin Immunol. (2005) 115:391–8. doi: 10.1016/j.jaci.2004.10.012
7. Baker MW, Grossman WJ, Laessig RH, Hoffman GL, Brokopp CD, Kurtycz DF, et al. Development of a routine newborn screening protocol for severe combined immunodeficiency. J Allergy Clin Immunol. (2009) 124:522–7. doi: 10.1016/j.jaci.2009.04.007
8. Chase NM, Verbsky JW, Routes JM. Newborn screening for T-cell deficiency. Curr Opin Allergy Clin Immunol. (2010) 10:521–5. doi: 10.1097/ACI.0b013e32833fd6fe
9. Kwan A, Abraham RS, Currier R, Brower A, Andruszewski K, Abbott JK, Baker M, et al. Newborn screening for severe combined immunodeficiency in 11 screening programs in the United States. JAMA (2014) 312:729–38. doi: 10.1001/jama.2014.9132
10. Chace DH. Mass spectrometry in newborn and metabolic screening: historical perspective and future directions. J Mass Spectrom. (2009) 44:163–70. doi: 10.1002/jms.1528
11. Millington DS, Kodo N, Norwood DL, Roe CR. Tandem mass spectrometry: a new method for acylcarnitine profiling with potential for neonatal screening for inborn errors of metabolism. J Inherit Metab Dis. (1990) 13:321–4. doi: 10.1007/BF01799385
12. Sweetman L, Millington DS, Therrell BL, Hannon WH, Popovich B, Watson MS, et al. Naming and counting disorders (conditions) included in newborn screening panels. Pediatrics (2006) 117:S308–14. doi: 10.1542/peds.2005-2633J
13. Almannai M, Marom R, Sutton VR. Newborn screening: a review of history, recent advancements, and future perspectives in the era of next generation sequencing. Curr Opin Pediatr. (2016) 28:694–99. doi: 10.1097/MOP.0000000000000414
14. Watson MS, Mann MY, Lloyd-Puryear MA, Rinaldo P, Howell RR, Cordero J. Newborn screening: toward a uniform screening panel and system. Genet Med. (2006) 8(Suppl 1):1S−252S. doi: 10.1097/01.gim.0000223891.82390.ad
15. Chace DH, Millington DS, Terada N, Kahler SG, Roe CR, Hofman LF. Rapid diagnosis of phenylketonuria by quantitative analysis for phenylalanine and tyrosine in neonatal blood spots by tandem mass spectrometry. Clin Chem. (1993) 39:66–71.
16. Chace DH, Kalas TA. A biochemical perspective on the use of tandem mass spectrometry for newborn screening and clinical testing. Clin Biochem. (2005) 38:296–309. doi: 10.1016/j.clinbiochem.2005.01.017
17. Dott M, Chace D, Fierro M, Kalas TA, Hannon WH, Williams J, et al. Metabolic disorders detectable by tandem mass spectrometry and unexpected early childhood mortality: a population-based study. Am J Med Genet A (2006) 140:837–42. doi: 10.1002/ajmg.a.31180
18. Qasim W, Gilmour KC, Heath S, Ashton E, Cranston T, Thomas A, et al. Protein assays for diagnosis of Wiskott-Aldrich syndrome and X-linked thrombocytopenia. Br J Haematol. (2001) 113:861–5. doi: 10.1046/j.1365-2141.2001.02832.x
19. Jin Y, Mazza C, Christie JR, Giliani S, Fiorini M, Mella P, et al. Mutations of the Wiskott-Aldrich Syndrome Protein (WASP): hotspots, effect on transcription, and translation and phenotype/genotype correlation. Blood (2004) 104:4010–9. doi: 10.1182/blood-2003-05-1592
20. Kennedy JJ, Abbatiello SE, Kim K, Yan P, Whiteaker JR, Lin C, et al. Demonstrating the feasibility of large-scale development of standardized assays to quantify human proteins. Nat Methods (2014) 11:149–55. doi: 10.1038/nmeth.2763
21. Jimmerson LC, Bushman LR, Ray ML, Anderson PL, Kiser JJ. A LC-MS/MS method for quantifying adenosine, guanosine and inosine nucleotides in human cells. Pharm Res. (2017) 34:73–83. doi: 10.1007/s11095-016-2040-z
22. de Saint Basile G, Geissmann F, Flori E, Uring-Lambert B, Soudais C, Cavazzana-Calvo M, et al. Severe combined immunodeficiency caused by deficiency in either the delta or the epsilon subunit of CD3. J Clin Invest. (2004) 114:1512–7. doi: 10.1172/JCI200422588
23. Zhao L, Whiteaker JR, Pope ME, Kuhn E, Jackson A, Anderson NL, et al. Quantification of proteins using peptide immunoaffinity enrichment coupled with mass spectrometry. J Vis Exp. (2011) 53:e2812. doi: 10.3791/2812
24. Whiteaker JR, Zhao L, Anderson L, Paulovich AG. An automated and multiplexed method for high throughput peptide immunoaffinity enrichment and multiple reaction monitoring mass spectrometry-based quantification of protein biomarkers. Mol Cell Proteomics (2010) 9:184–96. doi: 10.1074/mcp.M900254-MCP200
25. Whiteaker JR, Zhao L, Lin C, Yan P, Wang P, Paulovich AG. Sequential multiplexed analyte quantification using peptide immunoaffinity enrichment coupled to mass spectrometry. Mol Cell Proteomics (2012) 11:M111.015347. doi: 10.1074/mcp.M111.015347
26. Kuhn E, Addona T, Keshishian H, Burgess M, Mani DR, Lee RT, et al. Developing multiplexed assays for troponin I and interleukin-33 in plasma by peptide immunoaffinity enrichment and targeted mass spectrometry. Clin Chem. (2009) 55:1108–17. doi: 10.1373/clinchem.2009.123935
27. Anderson NL, Anderson NG, Haines LR, Hardie DB, Olafson RW, Pearson TW. Mass spectrometric quantitation of peptides and proteins using Stable Isotope Standards and Capture by Anti-Peptide Antibodies (SISCAPA). J Proteome Res. (2004) 3:235–44. doi: 10.1021/pr034086h
28. Hoofnagle AN, Becker JO, Wener MH, Heinecke JW. Quantification of thyroglobulin, a low-abundance serum protein, by immunoaffinity peptide enrichment and tandem mass spectrometry. Clin Chem. (2008) 54:1796–804. doi: 10.1373/clinchem.2008.109652
29. Netzel BC, Grant RP, Hoofnagle AN, Rockwood AL, Shuford CM, Grebe SKG. First steps toward harmonization of LC-MS/MS thyroglobulin Assays. Clin Chem. (2016) 62:297–9. doi: 10.1373/clinchem.2015.245266
30. Razavi M, Anderson NL, Yip R, Pope ME, Pearson TW. Multiplexed longitudinal measurement of protein biomarkers in DBS using an automated SISCAPA workflow. Bioanalysis (2016) 8:1597–609. doi: 10.4155/bio-2016-0059
31. Kerfoot SA, Jung S, Golob K, Torgerson TR, Hahn SH. Tryptic peptide screening for primary immunodeficiency disease by LC/MS-MS. Proteomics Clin Appl. (2012) 6:394–402. doi: 10.1002/prca.201100096
32. Jung S, Tran N-TB, Gospe SM, Hahn SH. Preliminary investigation of the use of newborn dried blood spots for screening pyridoxine-dependent epilepsy by LC-MS/MS. Mol Genet Metab. (2013) 110:237–40. doi: 10.1016/j.ymgme.2013.07.017
33. Jung S, Whiteaker JR, Zhao L, Yoo H-W, Paulovich AG, Hahn SH. Quantification of ATP7B protein in dried blood spots by peptide immuno-SRM as a potential screen for Wilson's disease. J Proteome Res. (2017) 16:862–71. doi: 10.1021/acs.jproteome.6b00828
34. Segundo GRS, Nguyen ATV, Thuc HT, Nguyen LNQ, Kobayashi RH, Le HT, et al. Dried blood spots, an affordable tool to collect, ship, and sequence gDNA from patients with an X-Linked Agammaglobulinemia phenotype residing in a developing country. Front Immunol. (2018) 9:289. doi: 10.3389/fimmu.2018.00289
35. MacLean B, Tomazela DM, Shulman N, Chambers M, Finney GL, Frewen B, et al. Skyline: an open source document editor for creating and analyzing targeted proteomics experiments. Bioinformatics (2010) 26:966–8. doi: 10.1093/bioinformatics/btq054
36. Abbatiello SE, Schilling B, Mani DR, Zimmerman LJ, Hall SC, MacLean B, et al. Large-scale interlaboratory study to develop, analytically validate and apply highly multiplexed, quantitative peptide assays to measure cancer-relevant proteins in plasma. Mol Cell Proteomics (2015) 14:2357–74. doi: 10.1074/mcp.M114.047050
37. Hoofnagle AN, Whiteaker JR, Carr SA, Kuhn E, Liu T, Massoni SA, et al. Recommendations for the generation, quantification, storage, and handling of peptides used for mass spectrometry-based assays. Clin Chem. (2016) 62:48–69. doi: 10.1373/clinchem.2015.250563
38. Schoenherr RM, Zhao L, Whiteaker JR, Feng L-C, Li L, Liu L, et al. Automated screening of monoclonal antibodies for SISCAPA assays using a magnetic bead processor and liquid chromatography-selected reaction monitoring-mass spectrometry. J Immunol Methods (2010) 353:49–61. doi: 10.1016/j.jim.2009.11.017
39. Whiteaker JR, Zhao L, Abbatiello SE, Burgess M, Kuhn E, Lin C, et al. Evaluation of large scale quantitative proteomic assay development using peptide affinity-based mass spectrometry. Mol Cell Proteomics (2011) 10:M110.005645. doi: 10.1074/mcp.M110.005645
40. Futatani T1, Watanabe C, Baba Y, Tsukada S, Ochs HD. Bruton's tyrosine kinase is present in normal platelets and its absence identifies patients with X-linked agammaglobulinaemia and carrier females. Br J Haematol. (2001) 114:141–9. doi: 10.1046/j.1365-2141.2001.02905.x
41. Lindner M, Ho S, Kölker S, Abdoh G, Hoffmann GF, Burgard P. Newborn screening for methylmalonic acidurias–optimization by statistical parameter combination. J Inherit Metab Dis. (2008) 31:379–85. doi: 10.1007/s10545-008-0892-z
42. Rashed MS, Bucknall MP, Little D, Awad A, Jacob M, Alamoudi M, et al. Screening blood spots for inborn errors of metabolism by electrospray tandem mass spectrometry with a microplate batch process and a computer algorithm for automated flagging of abnormal profiles. Clin Chem. (1997) 43:1129–41.
Keywords: peptide immunoaffinity enrichment coupled to SRM (immuno-SRM), Stable Isotope Standards and Capture by Anti-Peptide Antibodies (SISCAPA), Primary Immunodeficiency Disorders (PIDD), Wiskott-Aldrich Syndrome (WAS), X-linked Agammaglobulinemia (XLA), Severe Combined Immunodeficiency (SCID), newborn screening (NBS), Dried Blood Spot (DBS)
Citation: Collins CJ, Chang IJ, Jung S, Dayuha R, Whiteaker JR, Segundo GRS, Torgerson TR, Ochs HD, Paulovich AG and Hahn SH (2018) Rapid Multiplexed Proteomic Screening for Primary Immunodeficiency Disorders From Dried Blood Spots. Front. Immunol. 9:2756. doi: 10.3389/fimmu.2018.02756
Received: 30 August 2018; Accepted: 08 November 2018;
Published: 04 December 2018.
Edited by:
Mirjam van der Burg, Leiden University Medical Center, NetherlandsReviewed by:
Tomohiro Morio, Tokyo Medical and Dental University, JapanJolan Eszter Walter, University of South Florida, United States
Copyright © 2018 Collins, Chang, Jung, Dayuha, Whiteaker, Segundo, Torgerson, Ochs, Paulovich and Hahn. This is an open-access article distributed under the terms of the Creative Commons Attribution License (CC BY). The use, distribution or reproduction in other forums is permitted, provided the original author(s) and the copyright owner(s) are credited and that the original publication in this journal is cited, in accordance with accepted academic practice. No use, distribution or reproduction is permitted which does not comply with these terms.
*Correspondence: Si Houn Hahn, sihoun.hahn@seattlechildrens.org