 Deepmala Sehgal1
 Suchismita Mondal1
 Leonardo Crespo-Herrera1
 Govindan Velu1
 Philomin Juliana1
 Julio Huerta-Espino2
 Sandesh Shrestha3
 Jesse Poland3
 Ravi Singh1
 Susanne Dreisigacker1*
- 1International Maize and Wheat Improvement Center (CIMMYT), Texcoco, Mexico
- 2Campo Experimental Valle de México, INIFAP, México, Mexico
- 3Kansas State University, Manhattan, KS, United States
We untangled key regions of the genetic architecture of grain yield (GY) in CIMMYT spring bread wheat by conducting a haplotype-based, genome-wide association study (GWAS), together with an investigation of epistatic interactions using seven large sets of elite yield trials (EYTs) consisting of a total of 6,461 advanced breeding lines. These lines were phenotyped under irrigated and stress environments in seven growing seasons (2011–2018) and genotyped with genotyping-by-sequencing markers. Genome-wide 519 haplotype blocks were constructed, using a linkage disequilibrium-based approach covering 14,036 Mb in the wheat genome. Haplotype-based GWAS identified 7, 4, 10, and 15 stable (significant in three or more EYTs) associations in irrigated (I), mild drought (MD), severe drought (SD), and heat stress (HS) testing environments, respectively. Considering all EYTs and the four testing environments together, 30 stable associations were deciphered with seven hotspots identified on chromosomes 1A, 1B, 2B, 4A, 5B, 6B, and 7B, where multiple haplotype blocks were associated with GY. Epistatic interactions contributed significantly to the genetic architecture of GY, explaining variation of 3.5–21.1%, 3.7–14.7%, 3.5–20.6%, and 4.4– 23.1% in I, MD, SD, and HS environments, respectively. Our results revealed the intricate genetic architecture of GY, controlled by both main and epistatic effects. The importance of these results for practical applications in the CIMMYT breeding program is discussed.
Introduction
Bread wheat (Triticum aestivum L., 2n = 6x = 42, AABBDD), with global production of 761.5 million tons, is a staple food source for over 2.5 billion people worldwide and an important crop for food security (FAO, 2020). Climate change and population growth will make attainment of food security a challenging task over the coming decades. Development of high-yielding, climate-resilient wheat varieties has therefore become imperative for wheat breeders. Improvement of grain yield (GY) is an arduous task for the global plant-breeding community due to low heritability and intractable “genotype × environment” interactions associated with it, particularly under stress environments (Quarrie et al., 2006; Sehgal et al., 2017, 2020). Nevertheless, wheat breeders have revealed genetic gains up to 1% for GY annually, but further efforts are required to cope with an estimated 2% yearly increase in world population (Tadesse et al., 2019).
Advances in next-generation sequencing technologies have revolutionized the field of plant genomics. Low-cost genotyping platforms that generate thousands to millions of data points are now available for all agronomically important crops, providing effective means for crop genetic research studies (Ganal et al., 2012). For wheat, where marker number and density were major lacunae in conducting in-depth genetic analyses, the availability of dense sets of single-nucleotide polymorphisms (SNPs) from different genotyping platforms has made a powerful step change in the marker tool kit (Poland et al., 2012; Cavanagh et al., 2013; Wang et al., 2014). The resulting high-density genomic data have opened up new possibilities for untangling the genetic architecture of complex traits by genome-wide association study (GWAS) and to perform other genomic studies, for instance, the analysis of selective sweeps within or across species (Afzal et al., 2019; Liu et al., 2019). Additionally, the recent availability of the high-quality reference genome of bread wheat (IWGSC, 2018) has enhanced our understanding of the regulation of genome organization, gene expression, and evolutionary mechanisms shaping its genome (Alaux et al., 2018; Ramírez-González et al., 2018; Wicker et al., 2018). With genome resolution reaching megabase-scale level in wheat, it is envisioned that genomics-assisted breeding can be escalated to a scale that was not possible previously (Keeble-Gagnère et al., 2018).
Although high-density markers, such as genotyping-by-sequencing (GBS) or SNP arrays, have been used extensively in wheat to explore the genetic architecture of GY and yield components using GWAS (Neumann et al., 2011; Zhang et al., 2013; Edae et al., 2014; Ain et al., 2015; Azadi et al., 2015; Lopes et al., 2015; Sukumaran et al., 2015; Sehgal et al., 2016; Qaseem et al., 2018; Garcia et al., 2019; Li et al., 2019, 2020; Ward et al., 2019; Shokat et al., 2020), panel sizes have been relatively small to dissect such a complex trait, and results therefore were quite variable, identifying hundreds of small-effect QTL. GWAS reports in larger germplasm panels are still rare (Sehgal et al., 2017, 2020; Juliana et al., 2019). Small panel sizes have also hindered scientists from exploring epistatic interactions due to lack of reasonable statistical power (Mackay, 2014).
To boost the power of single-marker GWAS, meta-GWAS has emerged as a leading approach to dissect traits (Evangelou and Ioannidis, 2013). In this approach, summary statistics of multiple trials are analyzed in a single frame to determine the most effective stable loci over space and time while simultaneously reducing false positives. In wheat, this approach has been used successfully to identify important loci associated with quality traits in unbalanced datasets (Battenfield et al., 2018). However, this GWAS approach fails to address the issue of “missing heritability,” which is common in single marker–based GWAS. The alternative approach to boost the power of GWAS is by constructing haplotypes between neighboring SNPs on a chromosome. As specific sets of alleles observed on a single chromosome, haplotypes are inherited together with little chance of contemporary recombination. Recent studies on wheat and other crops have shown that GWAS analysis with haplotypes can be superior to single marker–based analysis in terms of statistical significance (better p-values) and in estimating allelic effects (Hao et al., 2012; Lu et al., 2012; N’Diaye et al., 2017; Ledesma-Ramírez et al., 2019; Li et al., 2019; Sehgal et al., 2020; Shokat et al., 2020).
In the present study, we targeted exploration of stable regions in the genome that define the backbone of the genetic architecture of GY in CIMMYT spring bread wheat germplasm using a haplotype-based GWAS and investigating the interactions among haplotypes. We used seven large cohorts of advanced breeding lines from different breeding cycles phenotyped under well-managed multiple testing environments (irrigated and stress conditions) and genotyped with GBS markers. The specific objectives were to (i) construct haplotypes using GBS data across 6,461 lines distributed in seven elite yield trials (EYTs); (ii) conduct haplotype-based GWAS in each EYT using phenotyping data derived from the four testing environments; (iii) identify stable haplotypes associated with GY under individual testing environments and across multiple testing environments; and (iv) investigate the contribution of epistatic interactions to the genetic architecture of GY.
Materials and Methods
Plant Materials, Phenotyping, and Statistical Analysis
A total of 6,461 spring bread wheat lines, which formed the entries of seven EYTs during 7 consecutive years, were used in this study (Supplementary Table 1). EYT2011-12, EYT2012-13, EYT2013-14, EYT2014-15, EYT2015-16, EYT2016-17, and EYT2017-18 consisted of 643, 998, 983, 942, 829, 1,086, and 980 non-overlapping lines, respectively. Each trial year the breeding program selects 1,092 advanced lines for second-year yield testing, which is the source for the lines above. The 1,092 lines in each year were divided into 39 experiments, each with 28 entries and 2 checks in an alpha lattice design with 3 replications. All EYT were phenotyped at the Norman E. Borlaug Experimental Research Station (CENEB) in Ciudad Obregon, Mexico, under multiple contrasting environments by modulating planting dates and irrigation. All trials were sown in bed planting. The plot size was 2.8 m × 1.6 m (2 beds of 0.8 m with 3 rows each).
The multiple environments included optimum irrigated (I) and three stress environments [mild drought stress (MD), severe drought (SD) stress, and heat stress (HS)]. In environment I, five irrigations were applied (at germination and 40, 70, 95, and 115 days after the first irrigation) with a total water supply of maximum 500 mm distributed through five irrigation events across the crop cycle, while in MD environment two irrigations were applied, one at germination and the other after 50 days (using furrow irrigation; the total water supply was 280 mm). In SD environment, drip irrigation was applied at germination and after 50 days with a total water supply of 180 mm available for the plant. In HS environment, planting was delayed by 3 months (end of February) and around 500 mm of water was applied across the crop cycle through five to six irrigation events. Ciudad Obregon station has little to no rainfall during the crop growing season (November to April). It has a desert-type climate with rains concentrated during the months of August to October (Mondal et al., 2020). However, if there is rain, the irrigation in stressed environments is adjusted to maintain the amounts. Trials were phenotyped for GY, days to heading (DH), and plant height (PH) in each year, as detailed in Sehgal et al. (2020).
The phenotypic data of GY collected for each genotype were adjusted for block effects within each of three replications per trial (incomplete blocks considered as random effects) using the PROC MIXED function in SAS 9. For DH and PH, the adjusted means were calculated by the formula Y = (Yij - Yi) + Yall trials, where Yij is the value of the entry for a trial, Yi is the mean of checks of that trial, and Yall trials is the mean of checks of all trials. The summary statistics function in GenStat 14th ed. was used to obtain the minimum and maximum values of each trait in each trial. ANOVA was performed using a customized script in R version 3.4 (Supplementary Datasheet 1).
Genomic DNA Extraction and Genotyping
Genomic DNA was extracted from dried leaves collected from five plants per line using a modified CTAB method described in CIMMYT laboratory protocols (Dreisigacker et al., 2016). All lines were genotyped using GBS Kansas State University using 192-plexing on Illumina HiSeq2000. SNP calling was done using TASSEL 5 pipeline as described in Rutkoski et al. (2016). To obtain physical positions of SNPs, sequence reads of the SNPs were blasted to the wheat reference genome RefSeq V.1.1 (IWGSC, 2018).
Population Structure, Linkage Disequilibrium (LD), and Haplotype Blocks
The population structure was assessed through principal component analysis (PCA) using the rgl package in R (Adler and Murdoch, 2013). GAPIT version 2.0 was used to obtain correlation estimates of the frequency of the squared allele of LD (r2) for all pairwise comparisons. LD decay was visualized by plotting pairwise r2 values against the physical distance (Mb) for the whole genome, separately for each EYT, and using combined data from the 6,333 lines. A smooth line was fit to the data using second-degree, locally weighted scatterplot smoothing (Breseghello and Sorrells, 2006). For the LOESS estimation of LD decay, genetic distance was estimated as the point where the LOESS curve first crosses the baseline r2 of 0.1.
To avoid obtaining different haplotype blocks in each of the seven EYTs due to different minor allele frequencies (MAF) of the markers, the GBS data of all seven EYTs were considered together to generate the haplotype blocks. The MAF threshold was set to 0.15 instead of the usual 0.05 so that a 0.05 MAF could be achieved in each EYT. The haplotype blocks were constructed in R, based on the confidence interval algorithm developed by Gabriel et al. (2002) and detailed in Sehgal et al. (2019, 2020). Briefly, D’ 95% confidence intervals between SNPs was calculated, and comparisons were divided into categories of “strong LD,” “inconclusive,” or “strong recombination.” If 95% of the comparisons in one block were in “strong LD,” a haplotype block was created. The minimum lower and upper confidence interval values were set to 0.6 and 0.95, respectively. The constructed blocks transformed into multiallelic markers, considering the allelic combinations within each block to be independent alleles.
Haplotype-Based GWAS
GWAS was performed in each individual EYT using a mixed linear model (MLM) using Plink version 1.07 (Purcell et al., 2007) with PCA as fixed variate and kinship as random. PCA was conducted using the rgl package in R, and the appropriate number of principal components to be used in MLM was assessed based on Bayesian information criteria (Schwarz, 1978). The kinship matrix was calculated by the VanRaden algorithm (VanRaden, 2008).
A haplotype was considered stable for a testing environment when it showed P value < 10–4 in one EYT and at least P < 10–3 across three or more EYTs (Sehgal et al., 2020). Similarly, a haplotype was categorized as stable for multiple testing environments when it showed significance of at least P < 10–3 in two or more testing environments across two or more EYTs. The allelic effect of the associated haplotypes was estimated as the difference between the mean value of lines with and without favorable allele and was presented as box plots.
Epistatic Interactions
A linear regression model was used to calculate P values and percentage variation as R2 for two- and three-locus haplotype interactions using an in-house designed script in R (Supplementary Datasheet 1). A significant threshold of P < 0.0001 was used to declare significant interactions.
Results
Phenotypic Trait Variation in EYT Under Contrasting Environments
Phenotypic traits revealed a wide distribution in all EYTs in all environments (Supplementary Figures 1a,b). GY showed significant (P < 0.001) and positive correlations with PH in 26 EYTs × environment combinations, while the correlations with DH were positive in irrigated environments and negative in stress environments (MD, SD, and HS) across years.
Mean GY across all trials and environments ranged from 1622 kg/ha (EYT2015-16 in SD) to 8622 kg/ha (EYT2011-12 in B-5IR) (Supplementary Table 2). In general, SD and HS were the least yielding environments, except in EYT2011-12 and EYT2015-16 (Figure 1). ANOVA showed highly significant effects (P < 0.001) of genotypes, environments, and genotype × environment interactions for GY in the seven EYTs (Supplementary Table 2). Broad sense heritability estimates ranged from 0.31 (EYT2015-16) to 0.63 (EYT2011-12) (Supplementary Table 2).
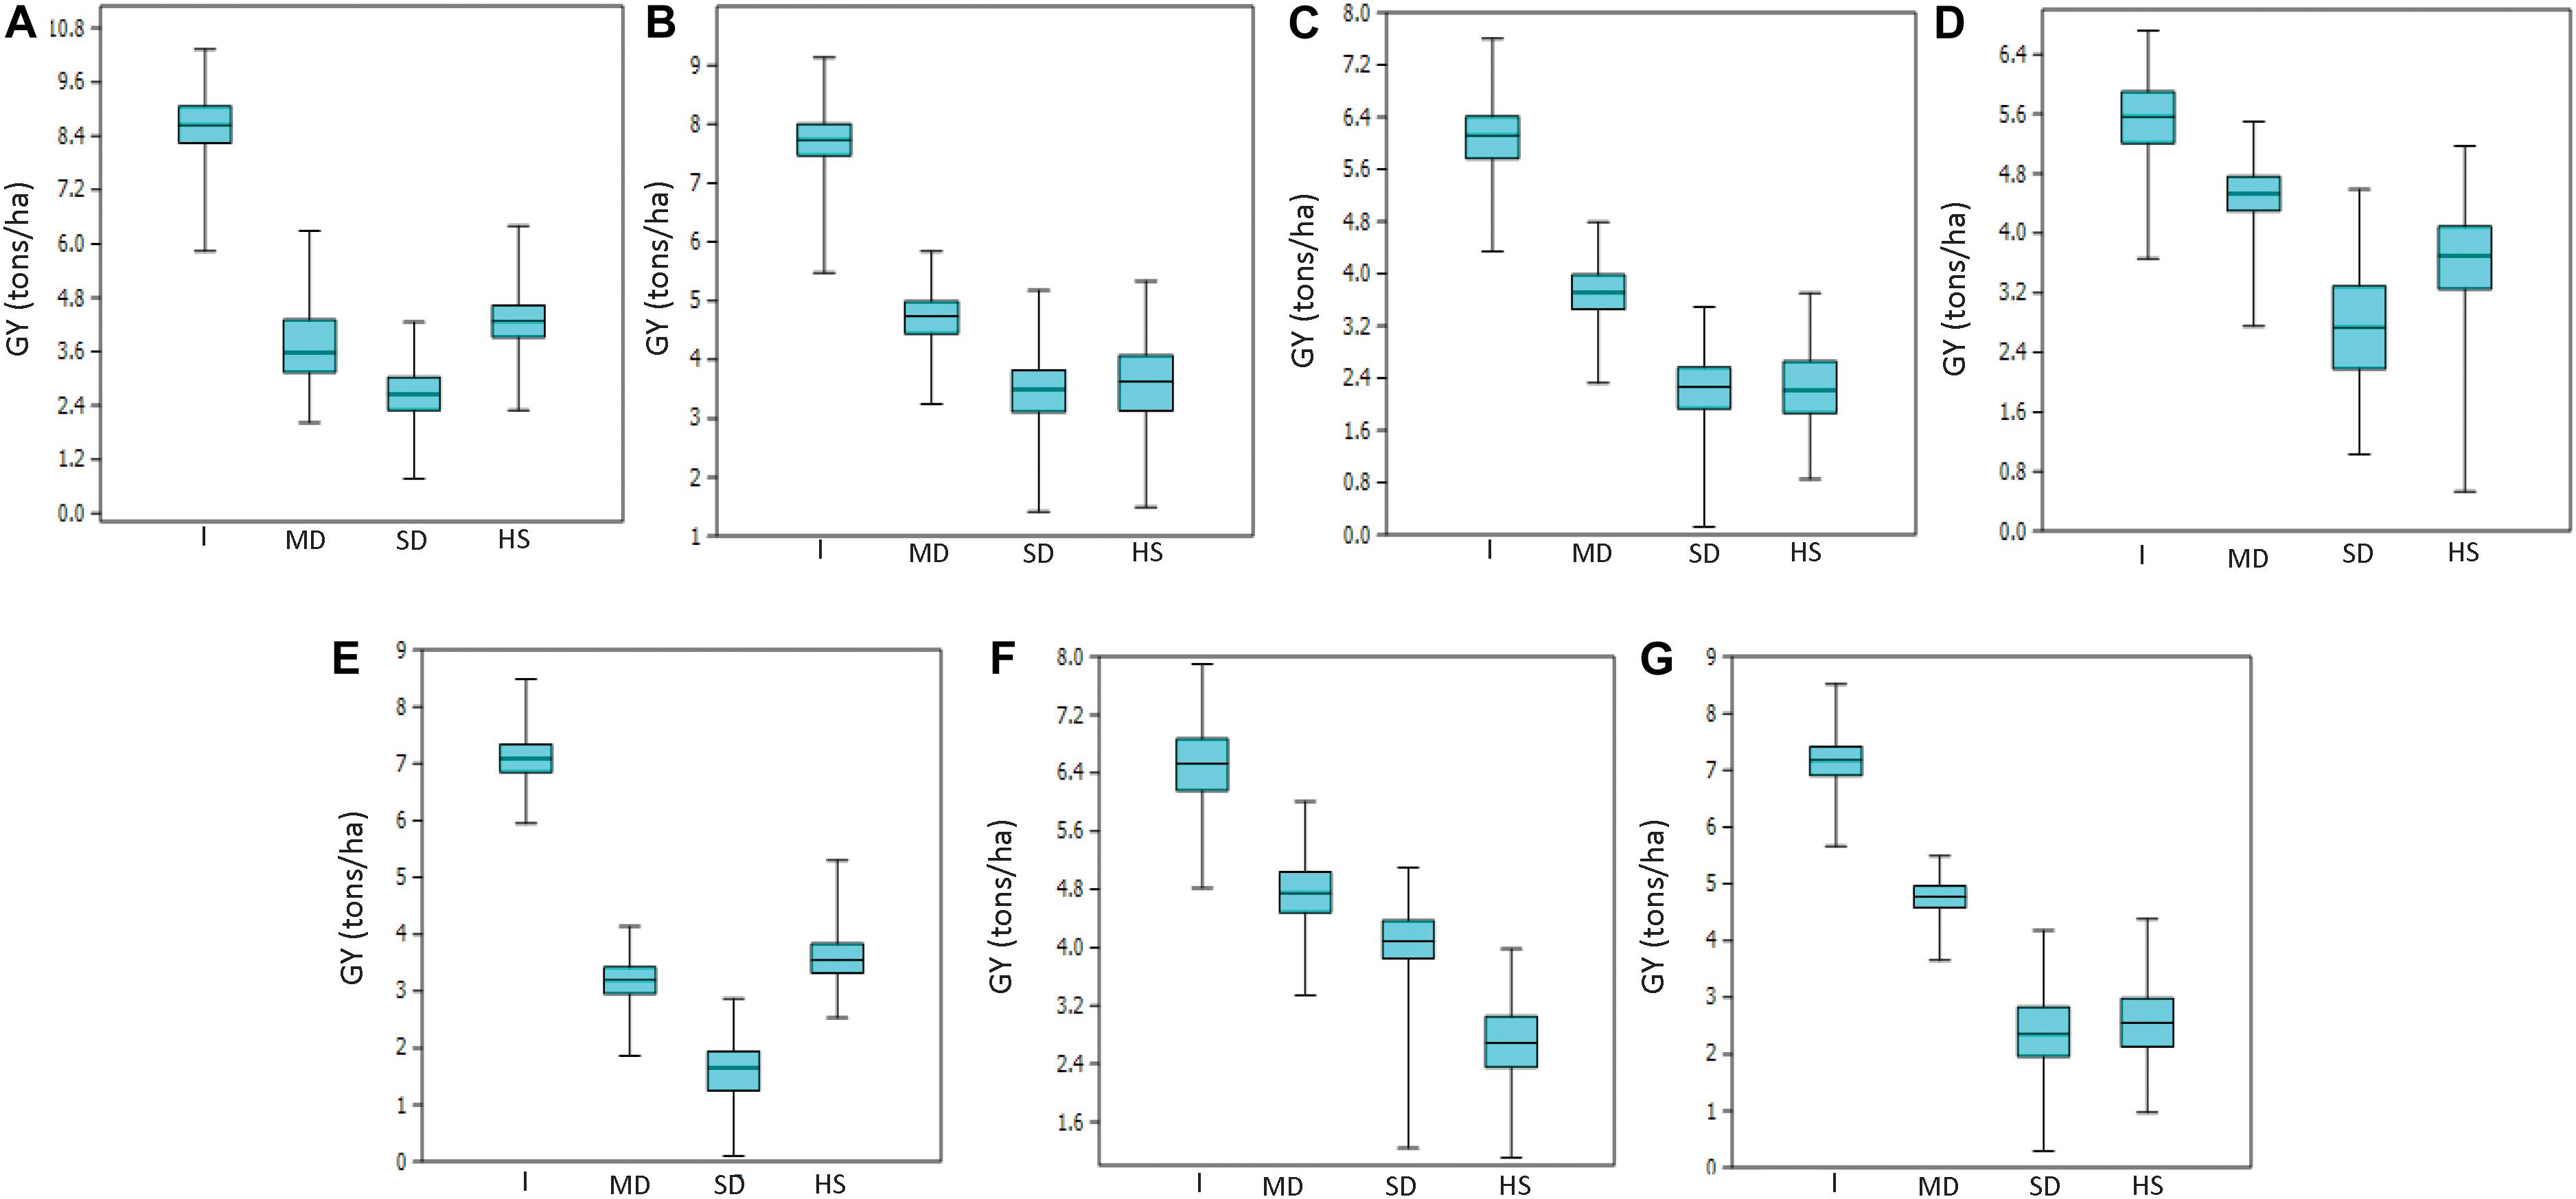
Figure 1. Grain yield variation under different environments in EYT2011-12 (A), EYT2012-13 (B), EYT2013-14 (C), EYT2014-15 (D), EYT2015-16 (E), EYT2016-17 (F), and EYT2017-18 (G).
Haplotype Blocks; Genome-Wide Coverage and Distribution
An initial set of 50,058 SNP markers was obtained on 6,461 lines. Of these, a filtered set of 14,027 SNP with maximum 30% missing data and a minor allele frequency (MAF) ≥ 0.15 was extracted without imputation. Lines showing more than 60% missing data were also culled with 6,333 genotypes remaining for further analysis.
A total of 519 haplotype blocks were established across the genomes. The haplotype blocks covered a total genome length of 14,036 Mb with 4,925, 5,170, and 3,941 Mb covered in the A, B, and D genomes, respectively (Table 1). The blocks were distributed according to the length of each chromosome, and the density of the markers with the highest numbers were obtained in A and B genomes (231 and 239, respectively) and the lowest in the D genome (49). The highest number was obtained on chromosomes 7A (51), followed by chromosomes 2B and 7B (46 each), whereas the lowest number of haplotype blocks was obtained on chromosome 4D (1).
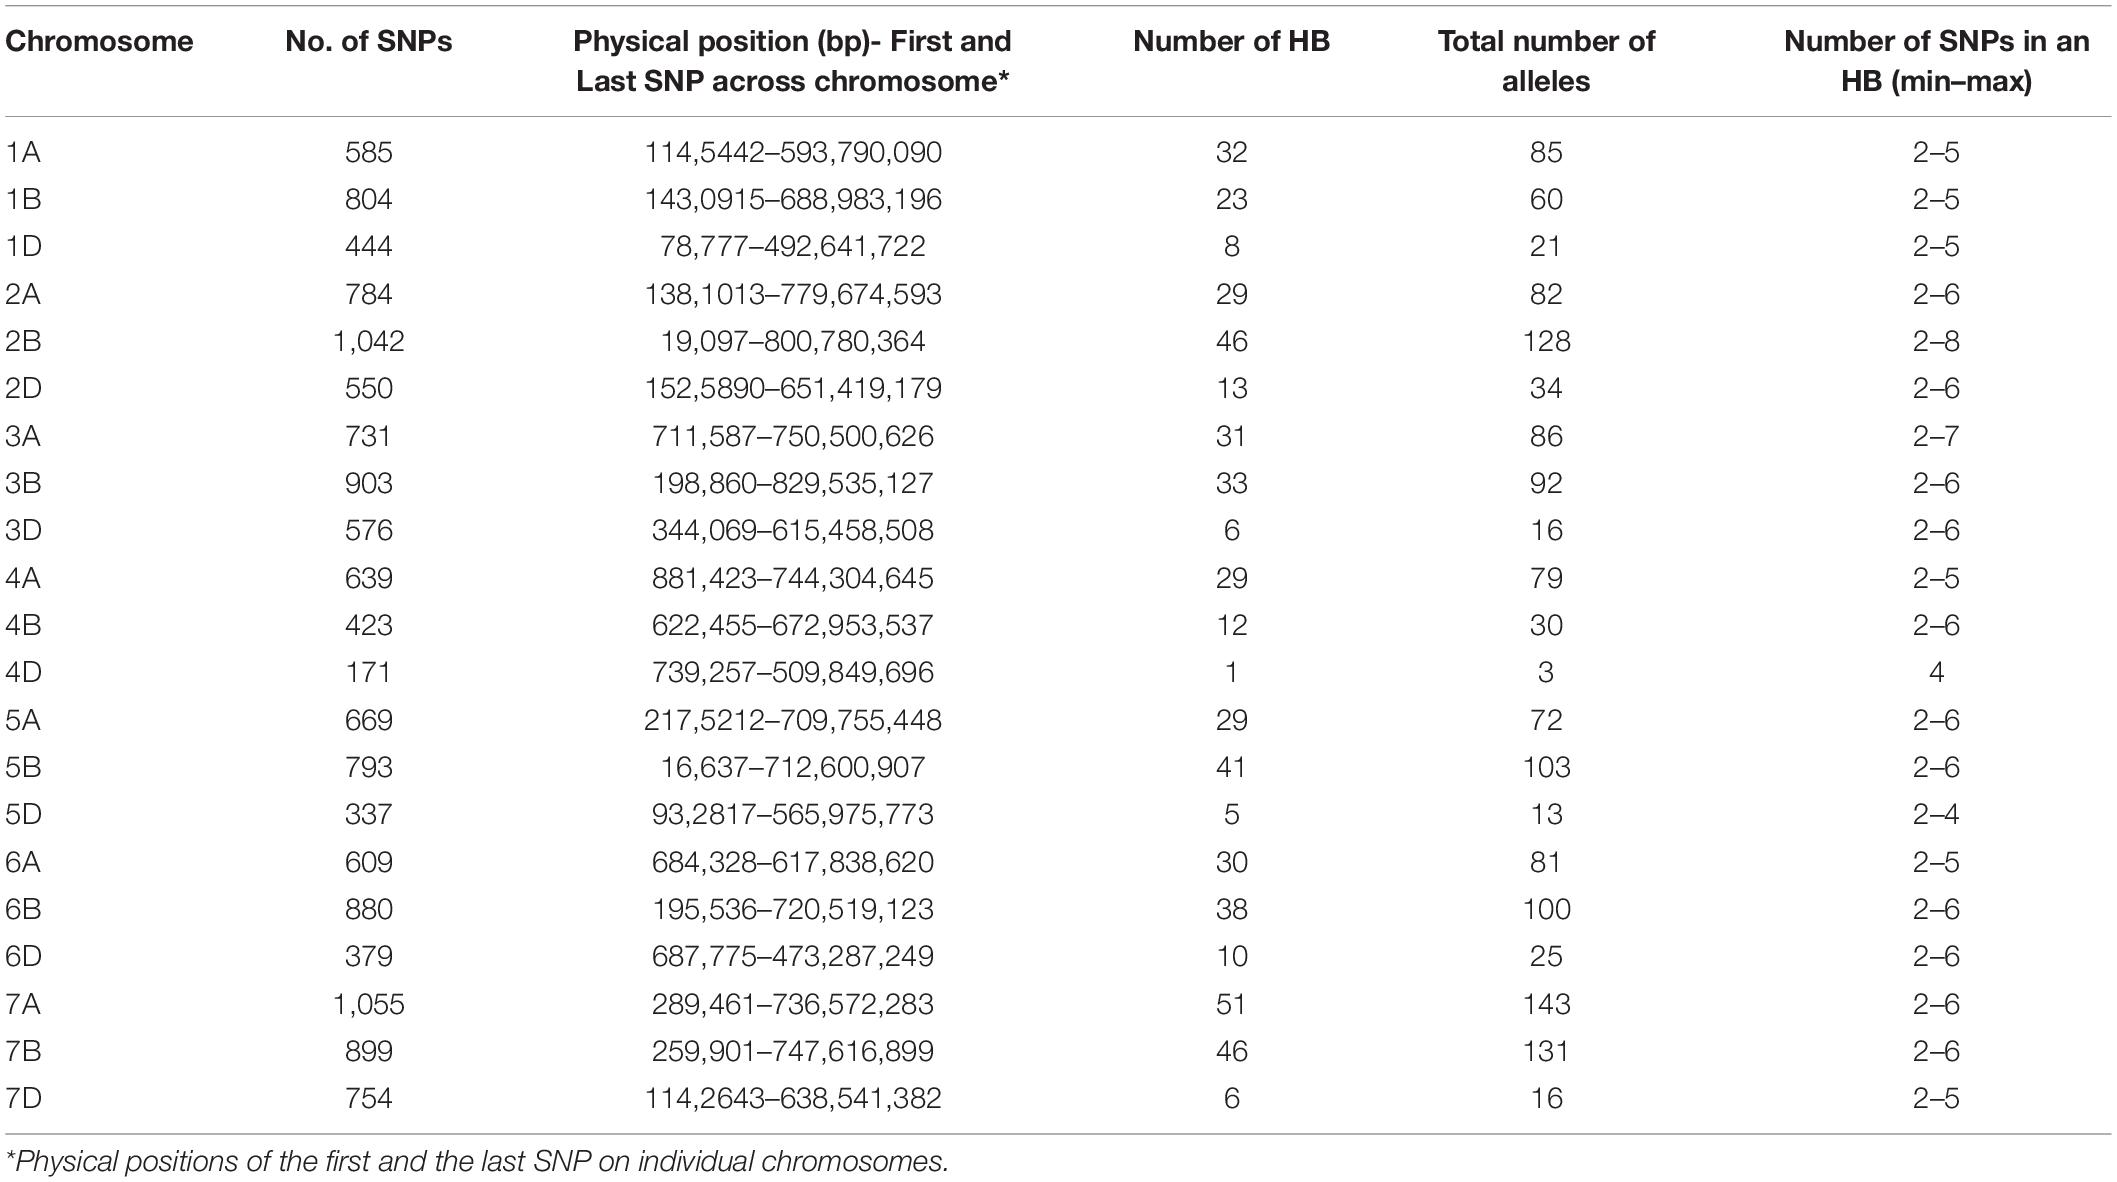
Table 1. Summary of haplotype blocks (HB) in 6,333 lines of seven elite yield trials.
Population Structure, Linkage Disequilibrium Decay, and Significant Associations
All seven EYTs showed a moderate structure with two to three subgroups deciphered by PCA (Supplementary Figure 2). Whole genome linkage disequilibrium (LD) decay in the individual EYT and combined EYTs is shown in Supplementary Figure 3, which revealed that LD decay varied from 1.8 Mb in EYT2014-15 to 2.3 Mb in EYT2016-17, with an average LD decay of approximately 2 Mb.
For environment I, seven stable associations were identified across EYTs (Supplementary Table 3) on chromosomes 2A (1), 3A (1), 4A (1), 4B (1), 5B (1), and 6B (2). Of these, favorable alleles of two associated blocks on chromosomes 3A and 4B showed GY advantage of >100 kg/ha across EYTs. For haplotype block HB3A.1, the favorable haplotype ACGA resulted in GY increase of 215 to 525 kg/ha in three EYTs (Figure 2). Similarly, the favorable haplotype TC in haplotype block HB4B.12 resulted in an increase of 168 to 429 kg/ha in GY across EYTs. The HB5B.29 linked to flowering time gene Vrn-B1 had two favorable alleles (AC and GT) and showed allelic effects of 47 to 568 kg/ha across EYTs (Supplementary Table 3).
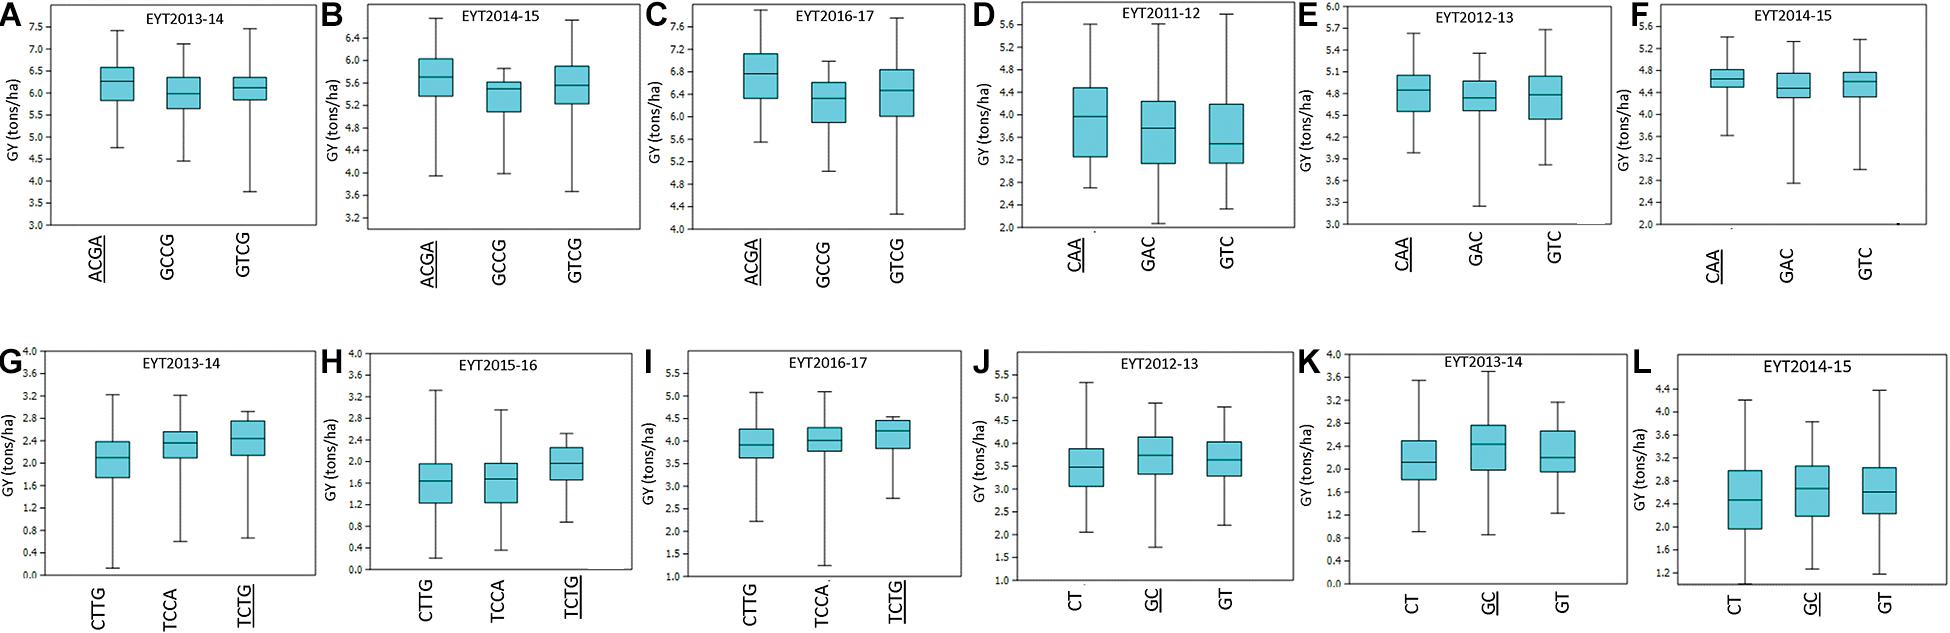
Figure 2. Allelic effects of haplotype blocks associated with GY under I (A–C), MD (D–F), SD (G–I), and HS (J–L) environments. The favorable haplotype in each part of the figure is shown as underscored. The parts (A–L) show allelic effects of HB3A.1, HB2A.29, HB 4D.1, and HB7A.2, respectively.
In environment MD, four haplotype blocks on chromosomes 1A (1), 1B (1), 2A (1), and 3B (1) showed association with GY. Of these, HB1A.13 showed GY advantage of >100 kg/ha across, while HB1B.19 showed effects up to 553 kg/ha in EYT2011-12 (Supplementary Table 3). In the SD environment, 10 blocks showed association with GY. These were identified on chromosomes 1A (1), 1B (1), 4A (2), 4D (1), 5B (2), 6A (1), and 7B (2). Of these, three associations on chromosomes 1B, 4D, and 6A showed the largest allele effects. For HB1B.3, two favorable alleles (GG and AG) resulted in a 126–359 kg/ha increase in GY across EYTs, while favorable alleles at HB4D.1 (TCTG) and HB6A.6 (GA) resulted in an increase of 151–362 kg/ha and 203–248 kg/ha, respectively (Figure 2). The block HB5B.29 linked to the major vernalization gene Vrn-B1 showed association with GY across five EYTs, with the favorable allele resulting in an increase of 263–430 kg/ha (Supplementary Table 3). Since both I and SD environments showed significant association with this block, both phenological traits (DH and PH) were used as covariates in GWAS to test the significance of this locus. However, when DH and PH were used as covariates, HB5B.29 locus either disappeared or became less significant.
For HS, 15 haplotype blocks were associated on chromosomes 2B (1), 3A (1), 3B (2), 4A (1), 5B (1), 6A (1), 6B (2), 7A (5), and 7B (1). The associations on chromosomes 2B (HB2B.12) and 4A (HB4A.24) and all associations on chromosome 7A (HB7A.2, HB7A.3, HB7A.20, HB7A.28, and HB7A.32) showed large allelic effects compared to other blocks (Supplementary Table 3).
Thirty stable haplotypes that are favorable in multiple environments and across EYTs were identified (Table 2 and Supplementary Table 4), including seven hotspots on chromosomes 1A, 1B, 2B, 4A, 5B, 6B, and 7B, where multiple haplotype blocks on same chromosome were associated with GY. The associations on chromosomes 2B (HB2B.10), 3B (HB3B.2), 4B (HB4B.12), 5D (HB5D.5), and 7B (HB7B.18) resulted in a GY increase of 177 to 357, 148 to 449, 168 to 429, 116 to 496, and 122 to 470 kg/ha in different environments and EYT, respectively (Supplementary Table 4). Figure 3 shows all stable haplotypes on chromosome maps, and Figure 4 shows the frequencies of the favorable haplotypes of each of the 30 associated blocks in all seven EYTs. The frequencies of 23 haplotypes varied from 11 to up to 78% across EYTs, while the frequency of seven haplotypes (HB1B.20, HB2B.10, HB3B.2, HB4A.20, HB4A.27, HB5A.15, and HB6B.38) remained low across EYTs (Supplementary Table 5). Potential candidate genes underlying 28 out of 30 haplotype blocks were identified and are listed in Supplementary Table 6.
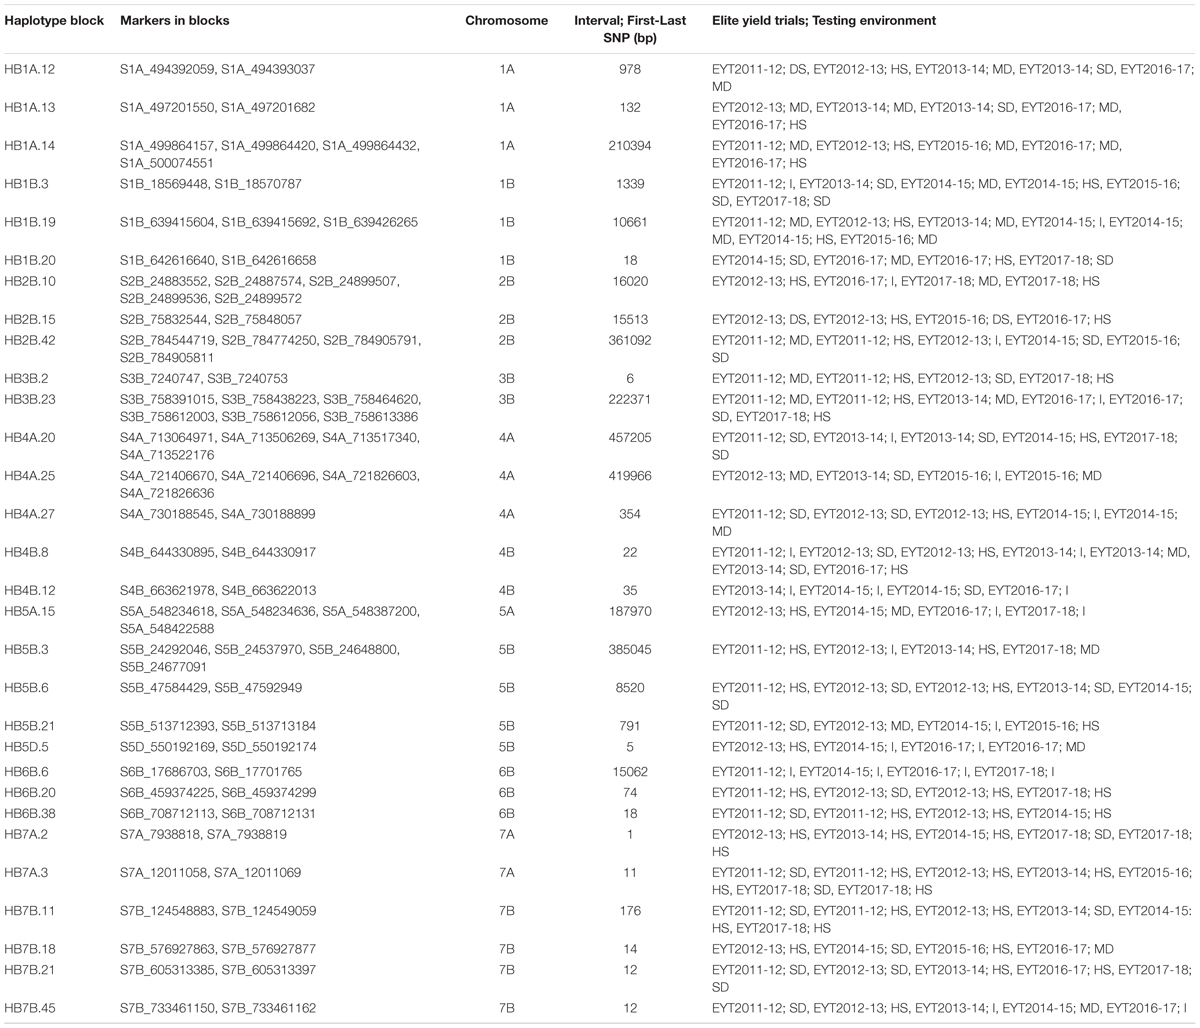
Table 2. Thirty stable associations identified for grain yield considering all elite yield trials and testing environments (I: Irrigated; MD: Moderate drought; SD: Severe Drought; HS: Heat Stress) together.
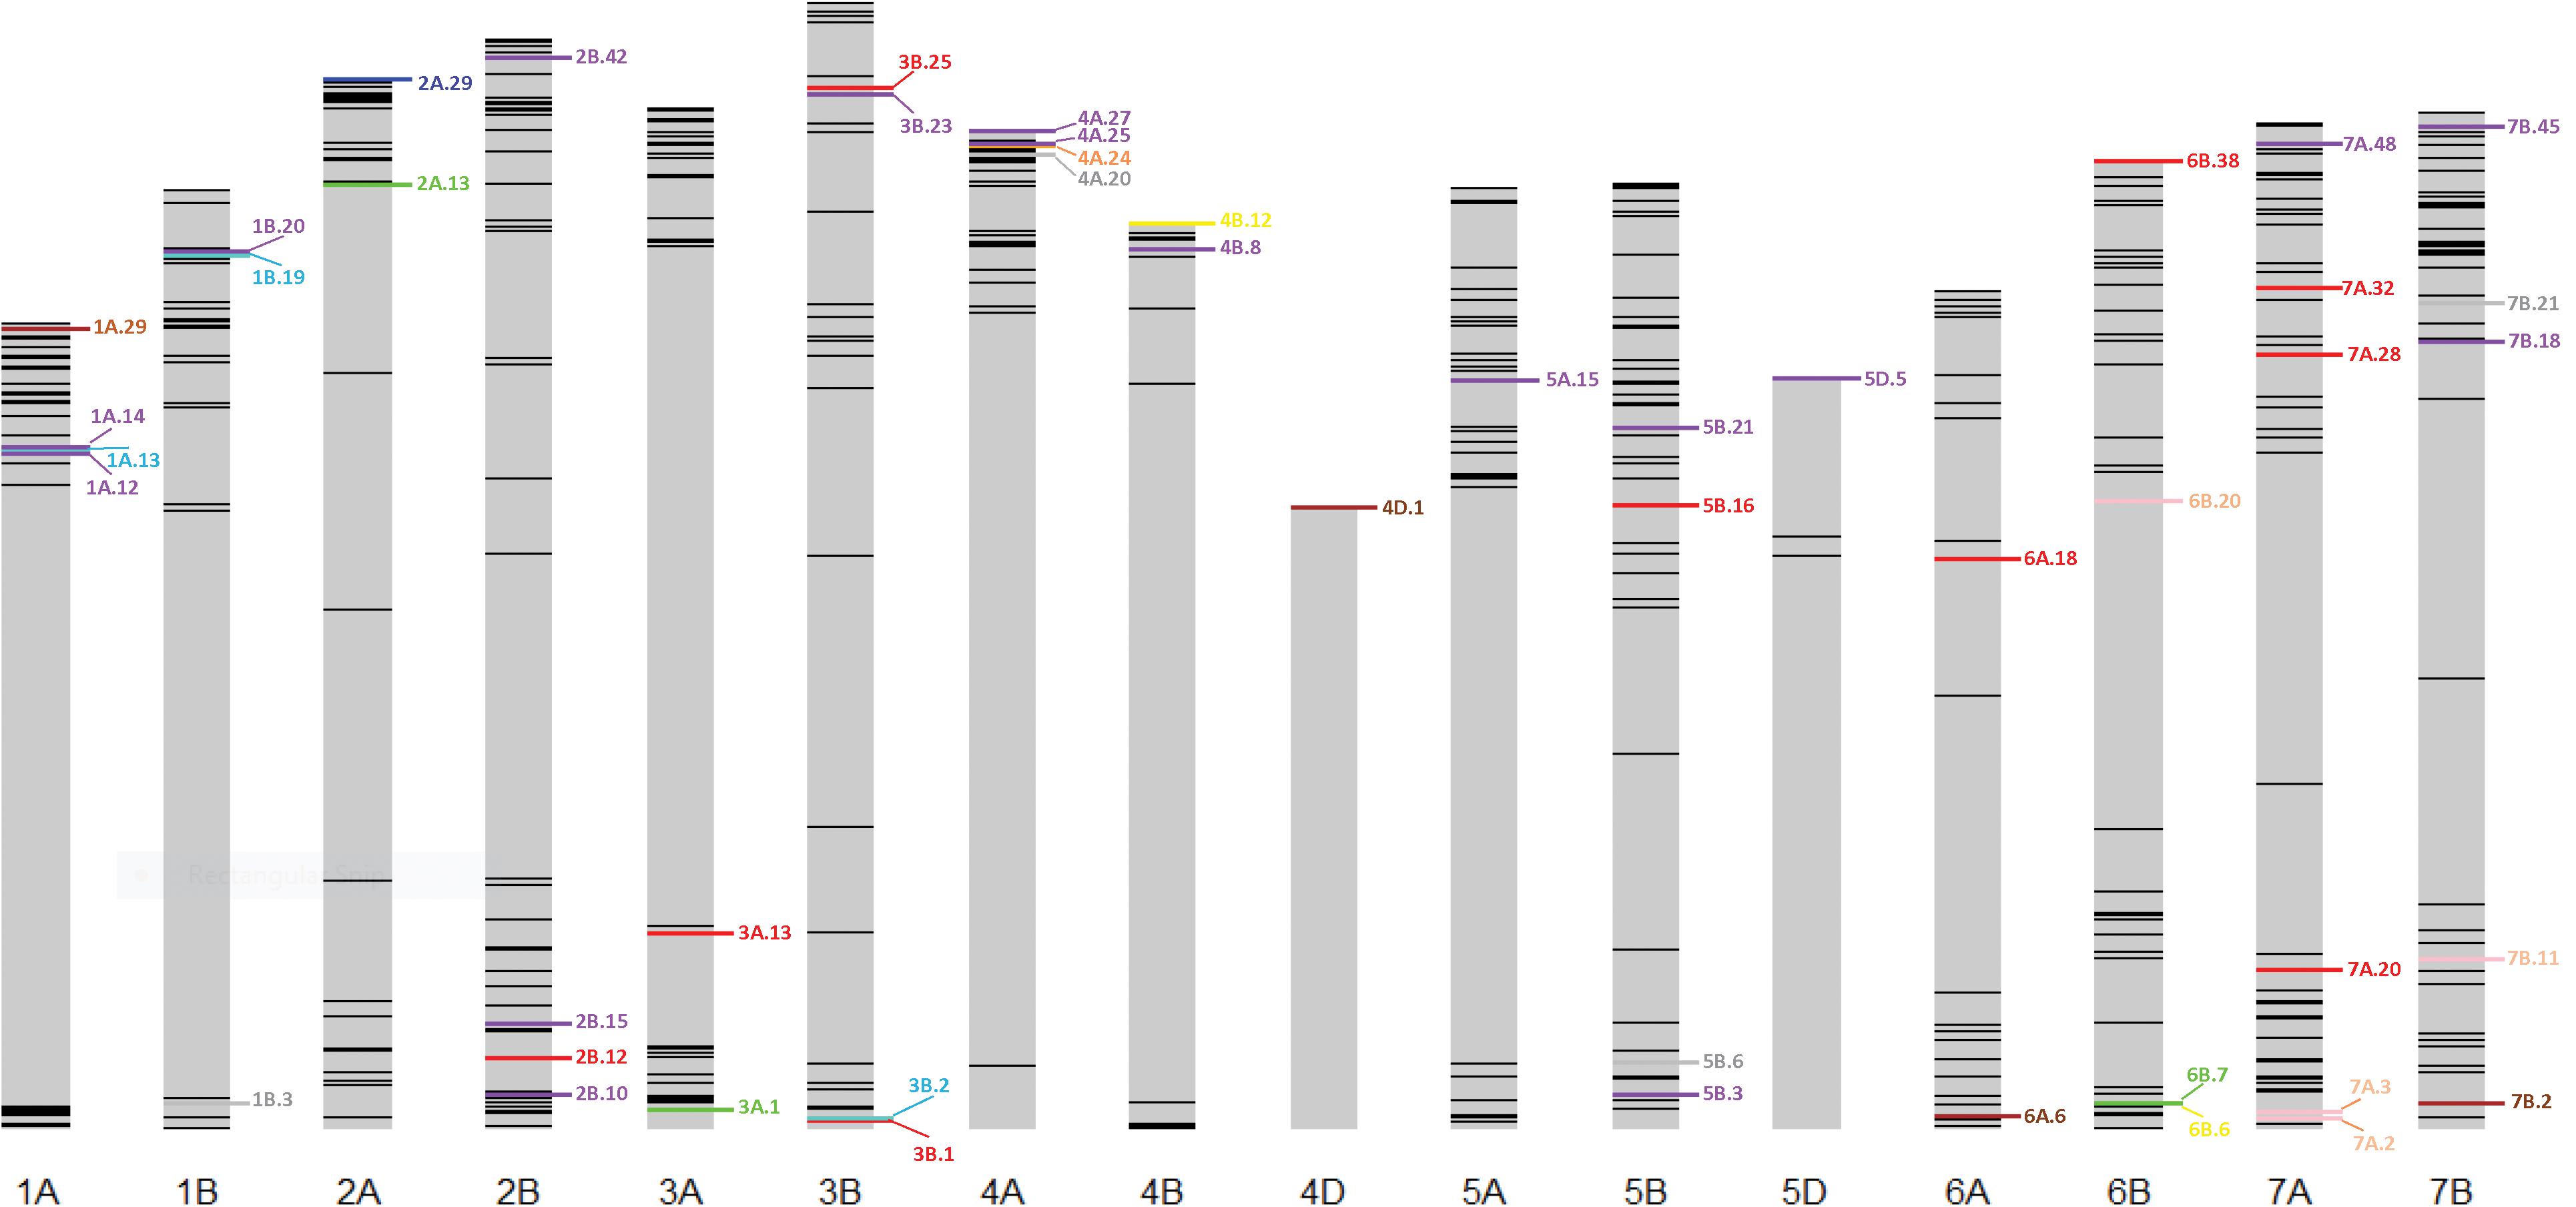
Figure 3. Environment-specific stable haplotypes and haplotypes identified to be significant across multiple environments and EYTs. Green, blue, brown, and red colors show environment-specific associations with GY under I, MD, SD, and HS environments, respectively. Purple color shows stable (S) associations significant across multiple environments and EYTS, while turquoise, pink, yellow, orange, and gray show associations that were identified under two categories; turquoise (MD, S), pink (HS, S), yellow (I, S), orange (SD, HS), and gray (SD, S).
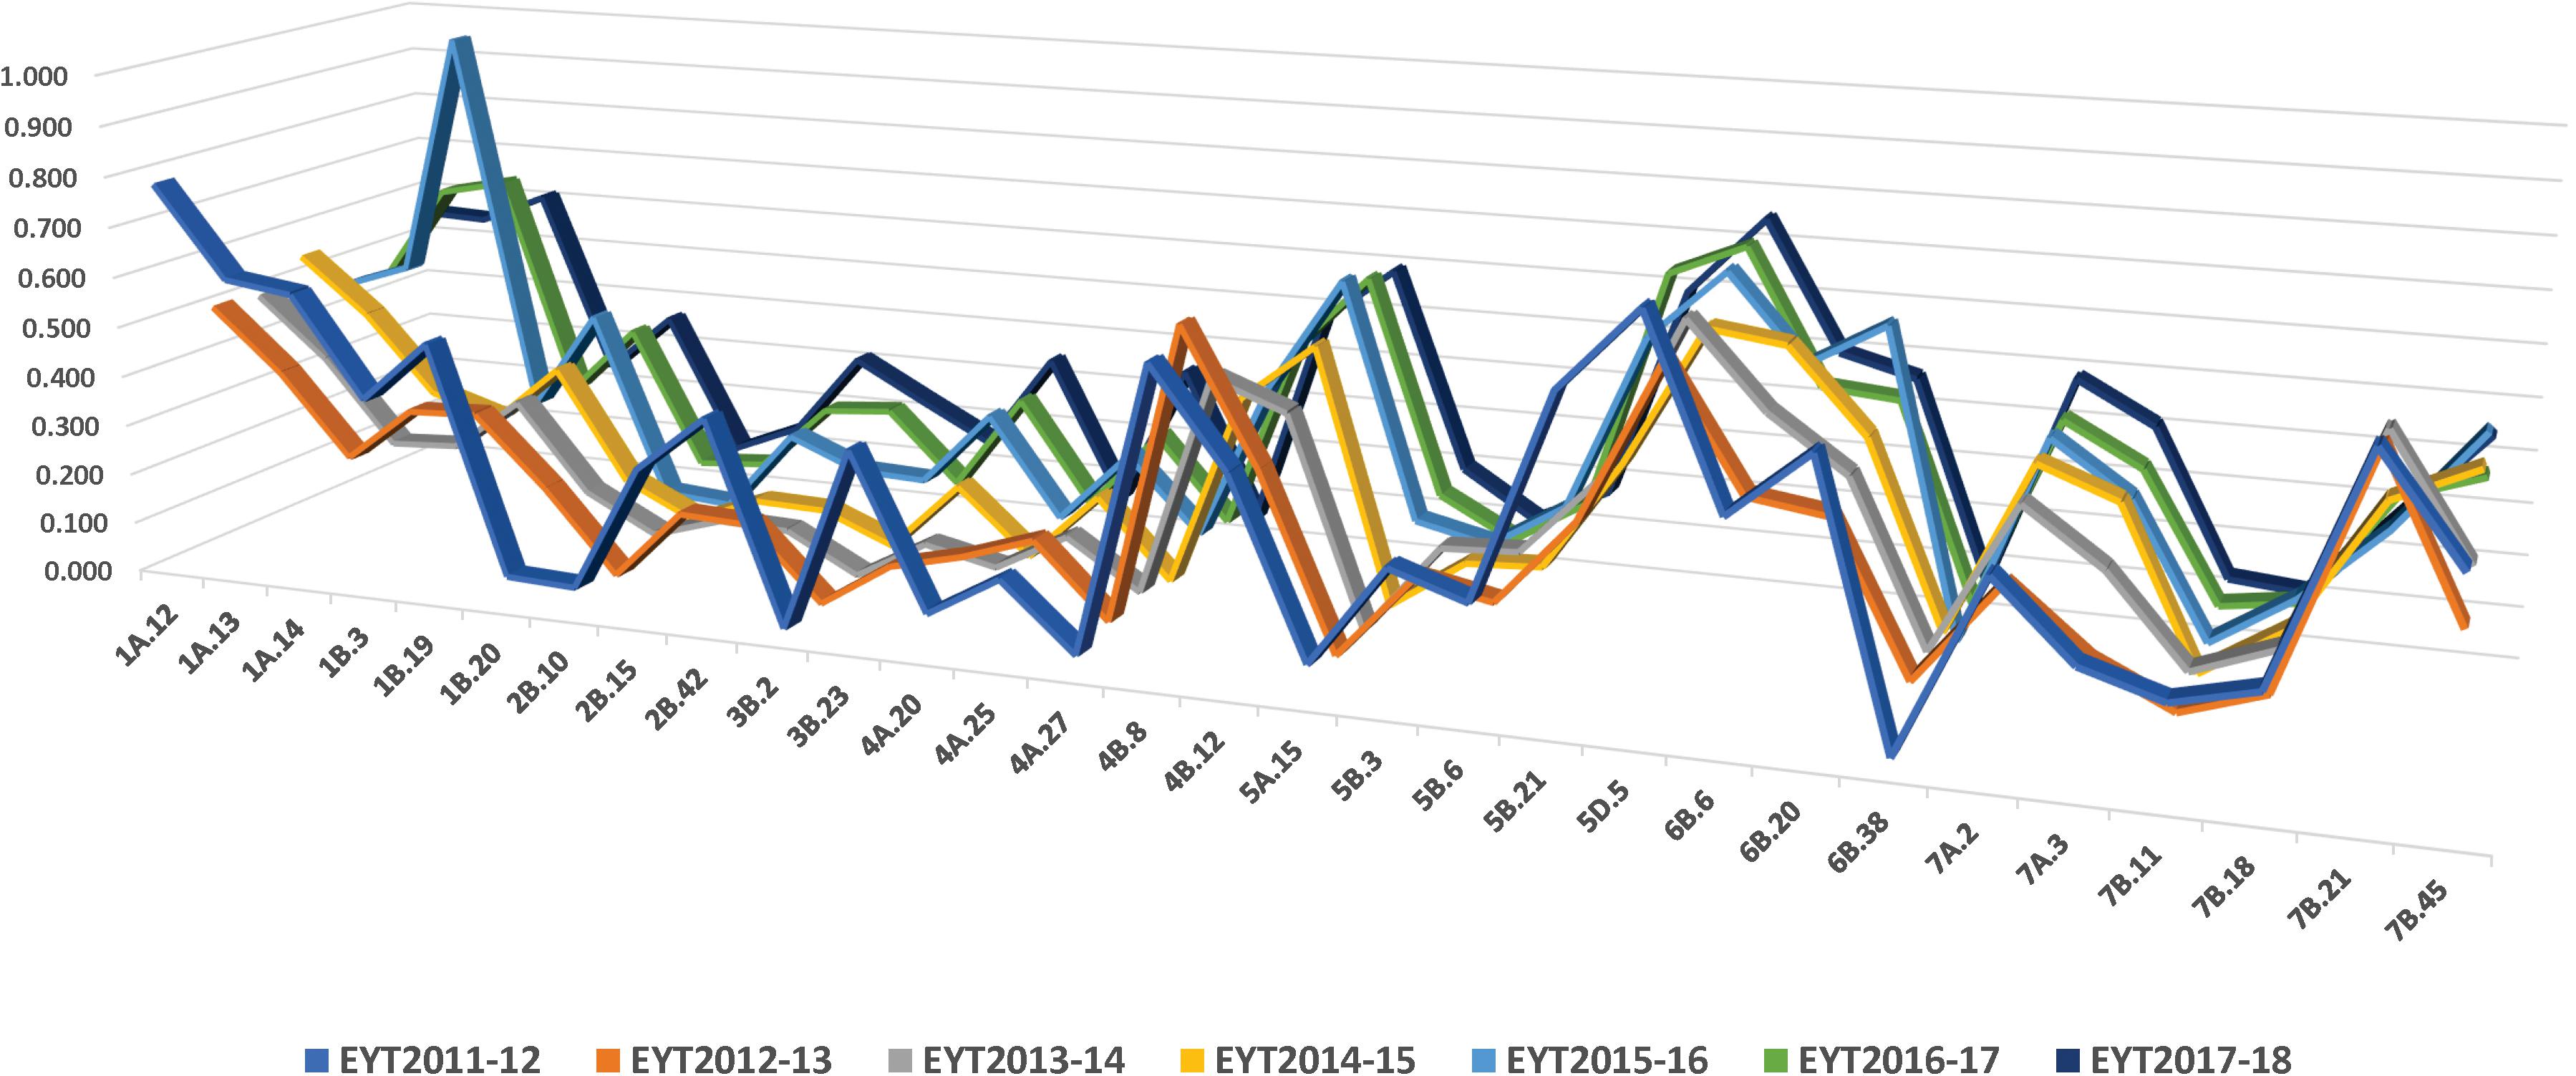
Figure 4. Frequency of stable haplotypes over 7 years (EYT2011-12 to EYT2017-18).
We constructed heat maps for all seven EYTs to visualize the series of favorable haplotypes accumulated in individual genotypes. Figures 5, 6 show heat maps of selected lines in EYT2015-16 displaying having none to maximum number of favorable haplotypes under HS environment and across all environments and EYTs, respectively (15 and 30 haplotype blocks). Heat maps shown here revealed that the maximum number of favorable haplotypes accumulated in lines from EYT2015-16 were 11 and 23 from the total 15 and 30 haplotypes identified under HS environment, and across environments and EYTs, respectively. We further estimated the additive effects of the favorable haplotypes on GY for (a) the environment-specific haplotypes and (b) all 30 stable multi-environmental haplotypes. The trend showed that with an increasing number of haplotypes, GY increases in all EYTs in all environments. Figure 7 shows the additive effects with an increasing number of haplotypes on GY in the two stress environments, SD and HS (Figures 7A,B) and across all environments (Figure 7C). The increase in GY ranged from 2.5 to 14.1% and 4.3 to 17.7% across EYTs in SD and HS environments, respectively (Figures 7A,B). When stable associations from all environments were tested, GY increase was on average 8% (Figure 7C).
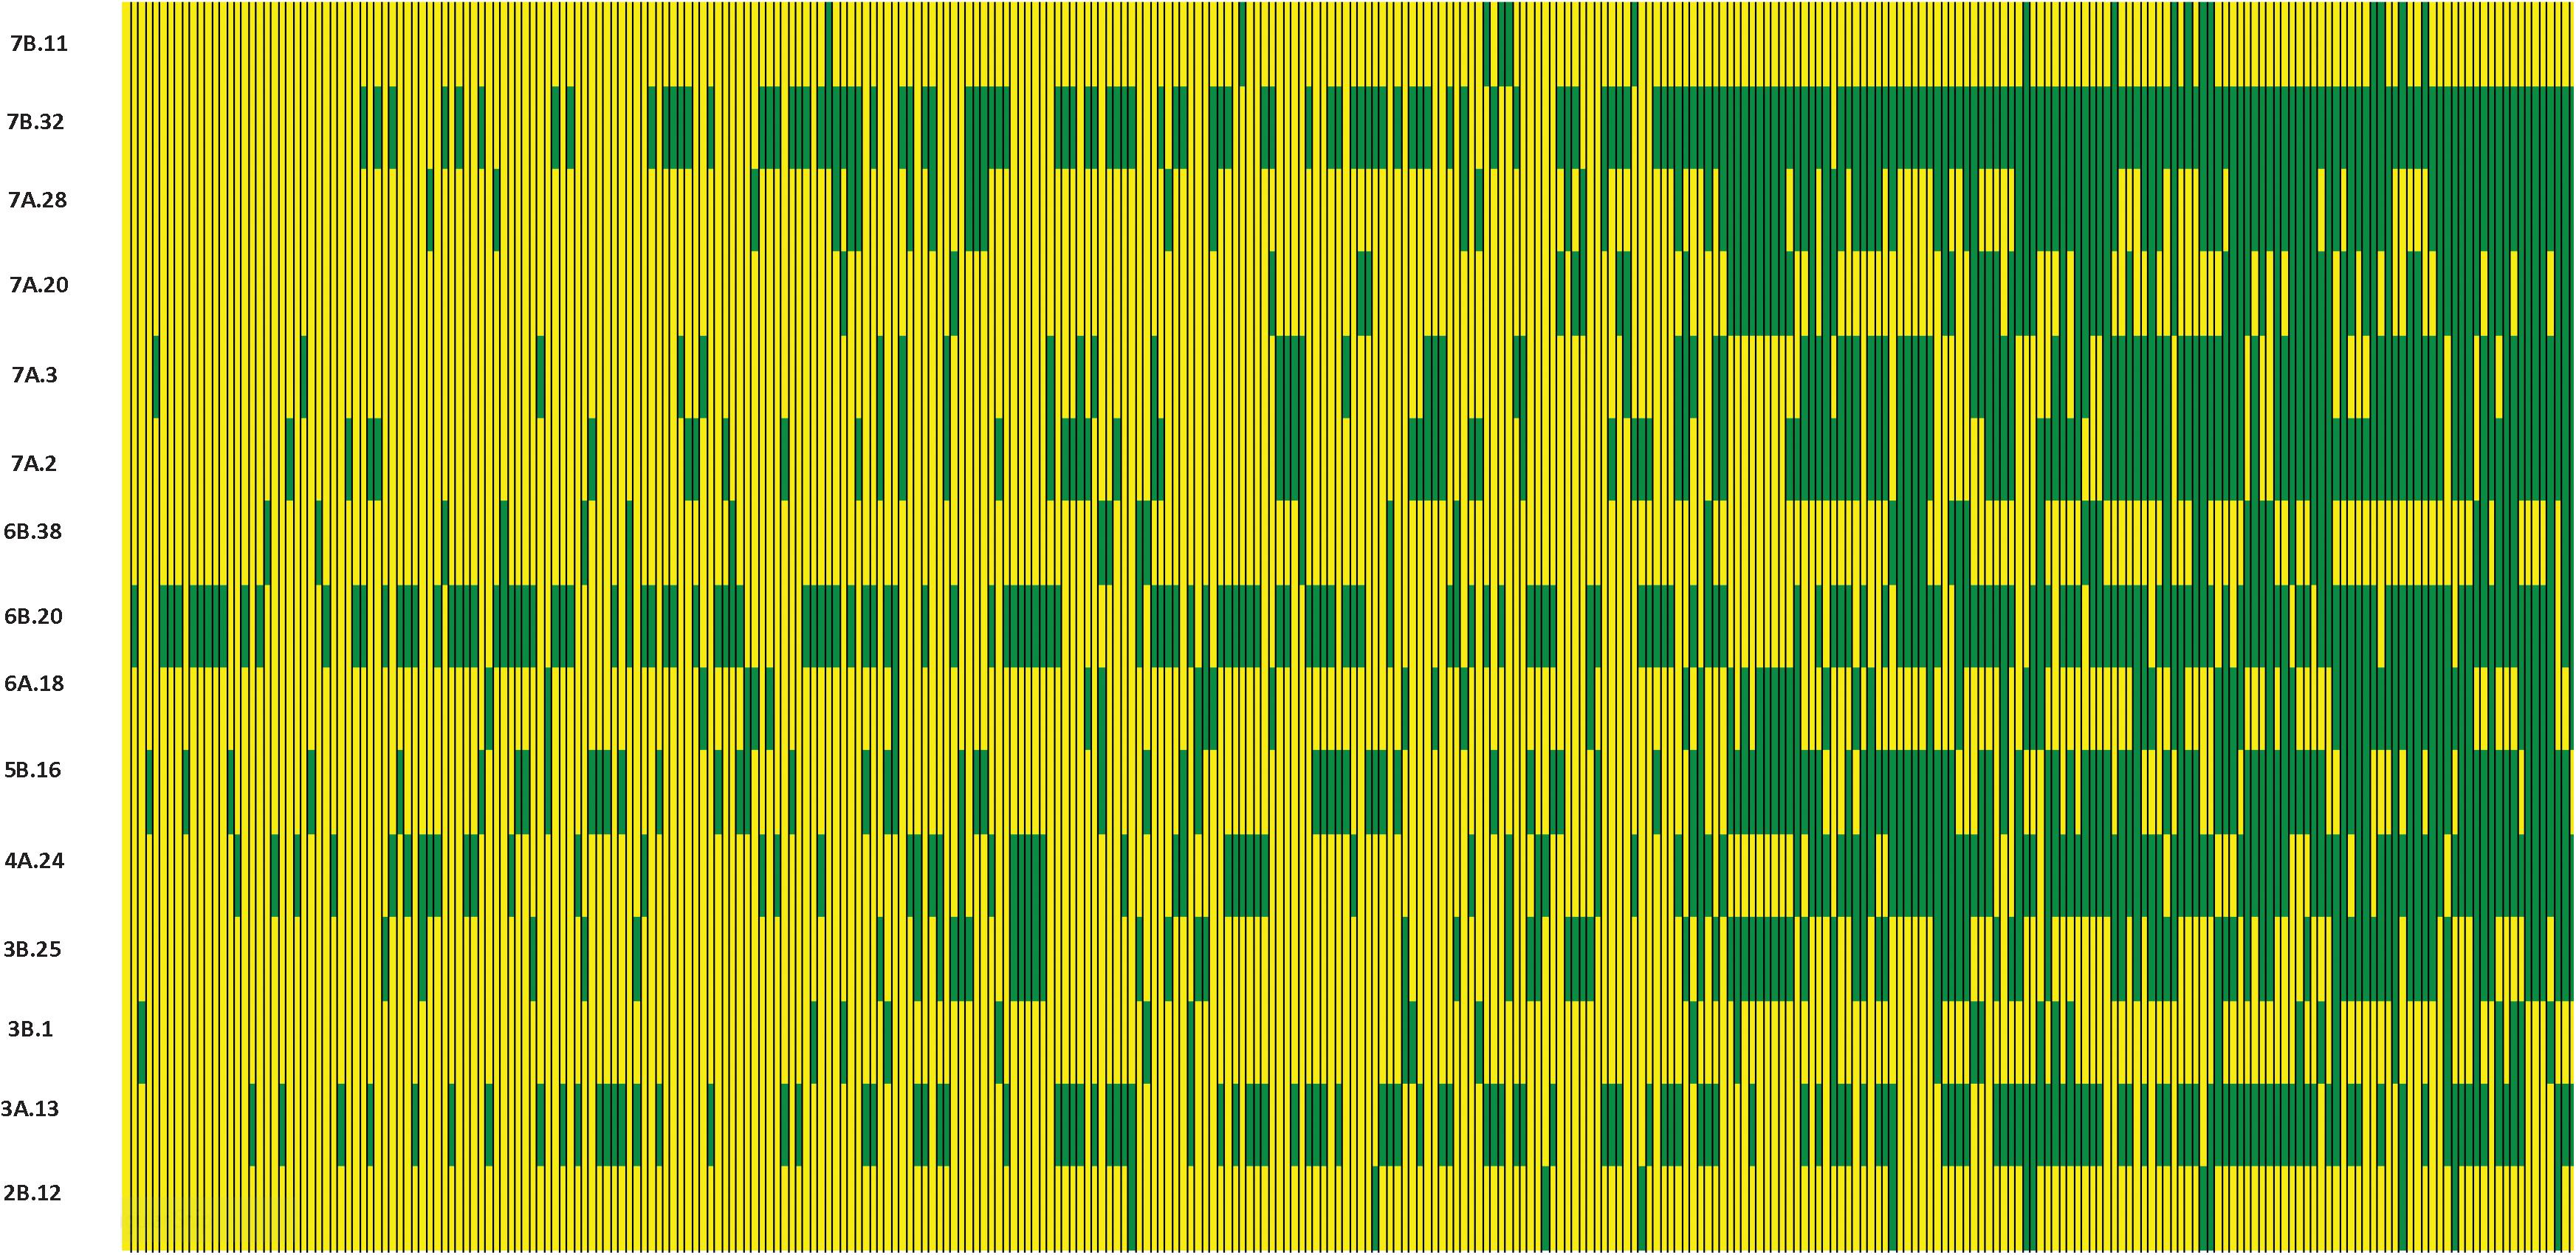
Figure 5. Heat map showing contrasting lines from EYT2015-16 showing all 15 haplotype blocks identified in HS environment. Each yellow vertical line represents a genotype, and each green vertical green rectangle represents a favorable haplotype of an associated block from a chromosome. The name of the haplotype block is shown on the left.
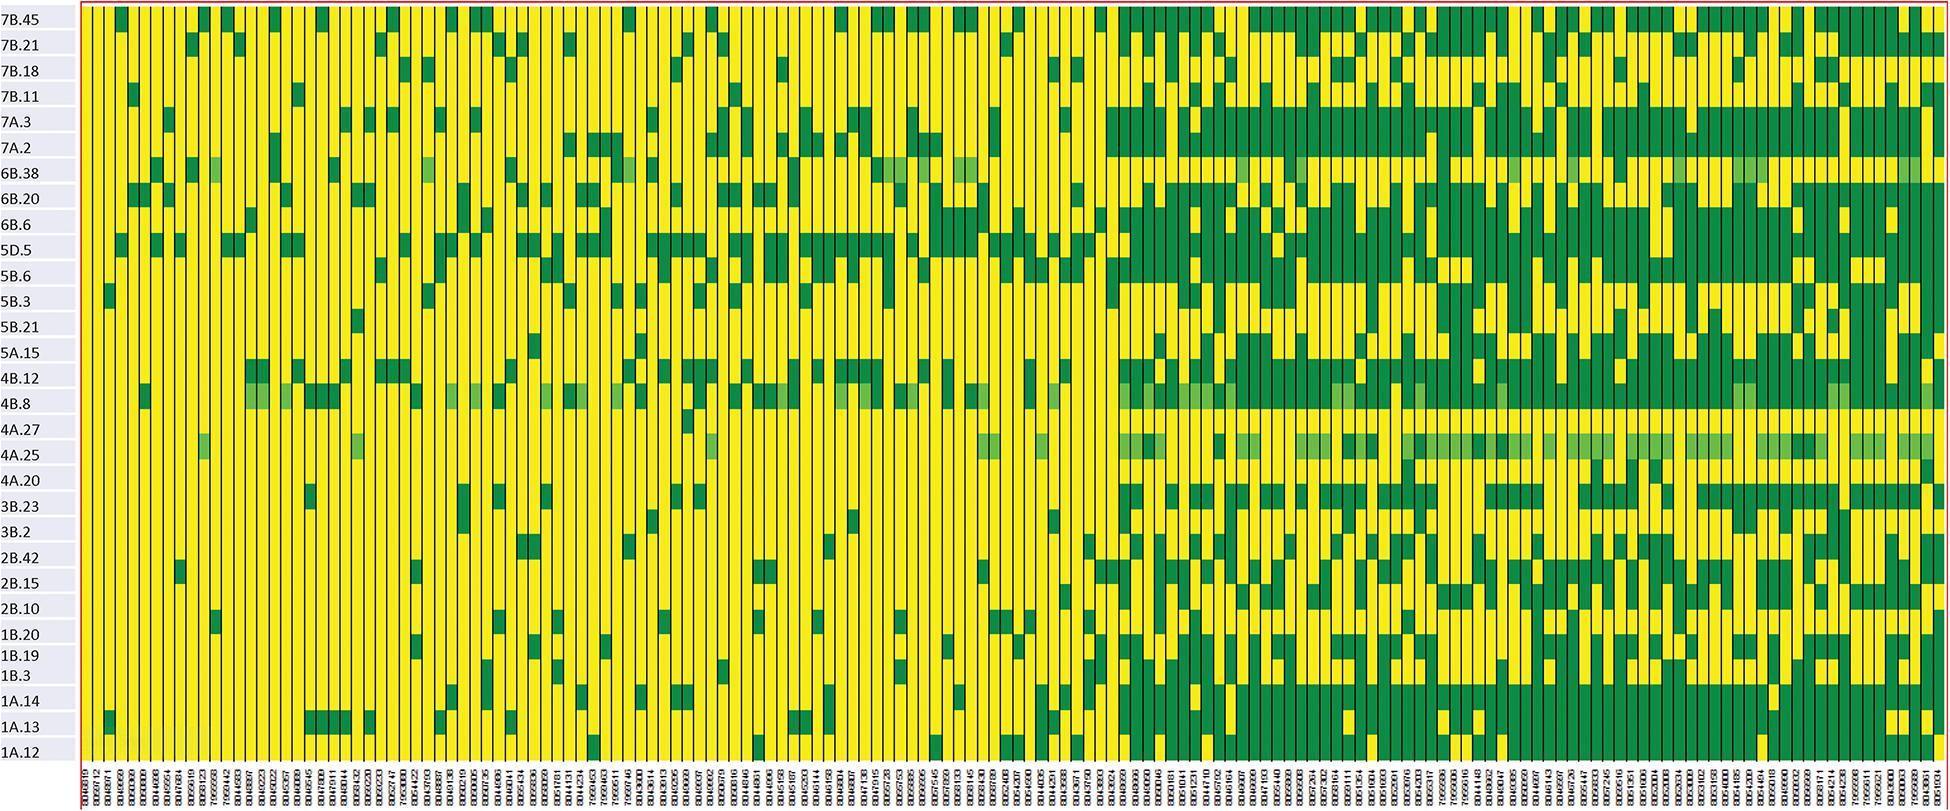
Figure 6. Heat map showing contrasting lines from EYT2015-16 showing favorable alleles of all 30 haplotype blocks identified to be stable across environments and EYTs. Each yellow vertical line represents a genotype. Each dark green rectangle represents the first favorable haplotype of an associated block from a chromosome while light green color represents the second favorable haplotypes identified in a few haplotype blocks. The name of the haplotype block is shown on the left.
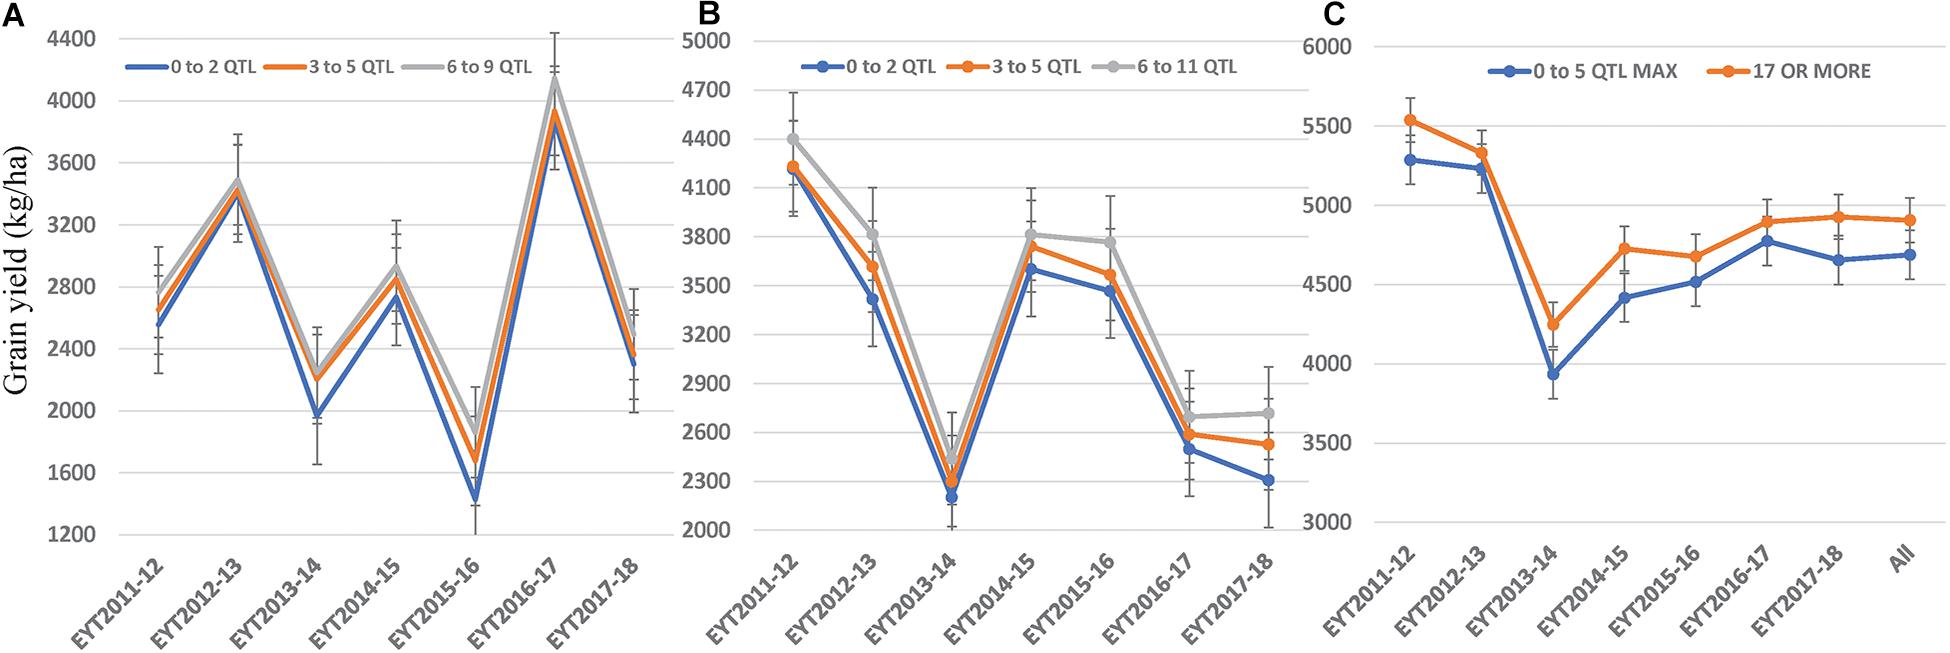
Figure 7. Average grain yield per trial observed by simulating numbers of favorable haplotypes identified in SD (A) and HS (B) environments and all environments (C).
Epistatic Interactions
Except in MD environment, epistatic interactions were observed in all environments among associated loci (Supplementary Figures 4–6). Most importantly, in both I and SD environments, Vrn-B1-linked locus HB5B.29 contributed significantly to epistatic interactions. In environment I, HB5B.29 interacted with HB4B.12 and HB6B.6 more frequently than others, while in environment SD, interactions between HB5B.29 and HB6A.6 were frequent. In environment HS, four associated haplotype blocks from chromosome 7A (HB7A.2, HB7A.3, HB7A.28, and HB7A.32) were mainly involved in interactions among themselves and with other loci. The percent variation explained ranged from 1.5 to 7.5%, 3.6 to 12.9%, and 3.4 to 10.9% in I, SD, and HS environments, respectively.
Genome-wide epistatic interactions were observed in all four environments (Supplementary Figures 7–10). In environments SD and HS, interactions were observed in all EYTs. The percent variation explained ranged from 3.5 to 21.1%, 3.7 to 14.7%, 3.5 to 20.6%, and 4.4 to 23.1% in I, MD, SD, and HS environments, respectively.
Discussion
Although much research exploring the genetic architecture of yield and yield-associated traits has been reported in wheat using GWAS, the identification of more stable key determinants of GY remain relatively unexplored, largely due to the complexity of the trait and small panel sizes used in previous studies leading to the so-called “large p small n” or “short-fat data” problem (Diao and Vidyashankar, 2013). Additionally, use of bi-allelic SNPs accentuated “missing heritability” issues and therefore reported markers had limited impact in breeding. In the present study, we performed haplotype-based GWAS using 519 haplotype blocks on seven large cohorts of advanced CIMMYT spring bread wheat lines consisting of 6,333 genotypes overall. In addition, epistatic interactions among the genome-wide haplotypes were investigated, an important aspect that has not yet been fully explored in wheat GWAS in order to address the missing heritability (Zuk et al., 2014; Sehgal and Dreisigacker, 2019).
Three approaches are generally used to construct haplotype blocks: (1) user-defined length, (2) sliding-window, and (3) LD. The user-defined fixed length of haplotype blocks (2–15 bp) is the easiest approach; however, generated haplotypes do not reflect genetic principles such as recombination or LD (Gabriel et al., 2002) or a shared evolutionary history (Templeton et al., 2005). The sliding-window approach is the most widely used for building haplotypes in GWAS (Braz et al., 2019). This approach is easy to use and handle; however, when adjacent SNPs are in strong LD, it provides redundant information, making it no more informative than SNPs. Similarly, when LD patterns vary over large genomic regions, it is difficult to determine the appropriate window size for a genome-wide scan. The LD-based approach is the most advantageous because it focuses directly on the detection of historical recombination in the test population (Qian et al., 2017).
We constructed haplotypes using an LD-based approach and conducted a haplotype-based GWAS and epistatic scan to dissect the genetic architecture of GY under contrasting sets of environments and across seven EYTs. The total number of genome-wide haplotype blocks obtained was in a similar range as reported in the recent studies using same marker platform (Singh et al., 2018; Ledesma-Ramírez et al., 2019; Shokat et al., 2020). Li et al. (2019) used a much higher density of markers from two platforms (wheat 90K and 660K Illumina SNP arrays) and thus were able to obtain much higher numbers of haplotype blocks per chromosome and across the genome. However, panel size remained small (166 lines) in their study. The average LD decay in the seven EYTs in the present study was observed at ∼2 Mb. Comparison of LD decay with previous studies in wheat in which physical distance was used for estimating LD decay (Liu et al., 2017; Ladejobi et al., 2019; Li et al., 2019) revealed a faster decay in the CIMMYT germplasm (2 Mb in CIMMYT germplasm vs. 4–8 Mb in the above-mentioned studies). This suggests high levels of genetic diversity in the current CIMMYT breeding germplasm, which consists of lines selected from a wide range of genetic backgrounds. The higher diversity of CIMMYT germplasm vis-à-vis other wheat germplasm sets has also been observed in previous studies (Warburton et al., 2006; Dreisigacker et al., 2008; Sehgal et al., 2015).
We compared the stable haplotypes identified in the our study with GWAS peaks for GY and yield-related traits identified in various other panels using the GrainGenes genome browser1. Additionally, we investigated overlaps of the stable haplotypes against the meta-QTL (MQTL) reported by Acuña-Galindo et al. (2015) associated with adaptation to drought and heat stress (Supplementary Table 3). Furthermore, we compared our results with those reported by Li et al. (2019), who located 12 stable QTL for GY on the wheat reference genome using haplotype-based GWAS (Supplementary Table 4). Of the 7, 4, 10, and 15 environment-specific associations identified in the I, MD, SD, and HS environments, respectively, the four associations identified in the MD environment corresponded to MQTL 2, 6, 13, and 27. One (HB5.6) and three (HB5B.16, HB7A.20, HB7A.32) haplotype blocks identified in the SD and HS environments, respectively, corresponded to MQTL 44, 58, and 59 of Acuña-Galindo et al. (2015). Further, two (HB3A.1 and HB6B.7), three (HB4A.20, HB5B.6, and HB6A.6), and two (HB3B.25 and HB7A.3) haplotype blocks identified in the I, SD, and HS environments, respectively, overlapped with known GY QTL in GrainGenes (Supplementary Table 3). Juliana et al. (2019) used single marker–based GWAS on a smaller subset (3,485 lines) of the same EYT investigated here. The authors reported QTL within 0.2–2.2 Mb of the stable haplotype blocks reported on chromosome 3B (HB3B.25) in the HS environment and on chromosome 4A (HB4A.23 and HB4A.24) in the I, SD, and HS environments. Other QTL reported by Juliana et al. (2019) were on the same chromosomes as the present study; however, these were 58–510 Mb apart. For instance, haplotype blocks identified on chromosomes 5B (HB 5B.21) and 6B (HB 6B.20) were 58 and 146 Mb apart, whereas the four haplotype blocks identified on chromosome 7B (HB7B.11, HB7B.18, HB7B.21, and HB7B.45) were 98, 353, 382, and 510 Mb apart, respectively. Most significantly in our study, a haplotype block hotspot region was identified on chromosome 7A for heat tolerance, which was not detected in previous studies.
Of the 30 stable haplotype blocks identified in multiple environments and across EYTs, six corresponded with GWAS peaks identified in GrainGenes, while eight blocks corresponded to five MQTL (MQTL2 covered by HB1A.12, HB1A.13, and HB1A.14; MQTL6 covered by HB1B.19 and 1B.20; MQTL27 covered by HB3B.2; MQTL44 covered by HB5B.21; and MQTL51 covered by HB6B.6) of Acuña-Galindo et al. (2015). When comparisons were made with the 12 stable QTL reported by Li et al. (2019) for GY and yield components, only two were found in close vicinity from 5 to 20 Mb (Supplementary Table 4).
The frequencies of the favorable haplotypes of the 30 stable multi-environmental haplotypes blocks revealed that eight favorable haplotypes in blocks HB1A.12, HB1B.3, HB1B.19, HB2B.42, HB4B.8, HB5B.3, HB6B.20, and HB7B.18 decreased slightly by 10–18% over the 7 years, and only one favorable haplotype in the block HB7B.21 showed a sharp decrease of 36% in the seventh year (EYT2017-18). Eleven favorable haplotypes were maintained in moderate (30–50%) frequencies. Intriguingly, favorable haplotype in the block HB5D.5, with an allelic effect of +116–496 kg/ha across environments, was maintained at the highest frequency (up to 77%) in all seven EYTs, whereas the frequencies of the seven favorable haplotypes in blocks HB1B.20, HB2B.10, HB3B.2, HB4A.20, HB4A.27, HB5A.15, and HB6B.38 remained consistently low (2–15%) across EYTs. These low-frequency haplotypes were significantly associated with GY in three or all four environments and showed moderate to high allelic effects varying from +85–233 kg/ha to +148–449 kg/ha across EYTs and hence are important targets for future validation.
Despite the awareness that epistasis contributes significantly to the genetic architecture of most quantitative traits, epistatic interactions are usually not explored in GWAS studies (Sehgal et al., 2017, 2020; Assefa et al., 2019). The most important reason is that it is time consuming and computationally exhaustive to estimate genome-wide interactions in large datasets. Further, unlike in bi-parental populations, ready-to-use models are not available to estimate marker interaction effects along with main additive effects in GWAS panels (Rio et al., 2020). Additionally, the lack of sufficiently large experimental datasets has been a limiting factor to obtain reasonable statistical power when screening the genome for multi-locus epistasis. The size of our GWAS panel (6,333 lines) in the present study, along with the comprehensive phenotypic datasets generated in multiple environments (irrigated and stress environments), in combination with the fact that a large single SNP dataset was reduced to a set with fewer haplotype blocks, made the study of multi-locus epistatic interactions feasible with reasonable statistical power. We observed significant interactions among stable haplotypes. Most importantly, the haplotype block HB5B.29 linked to the vernalization locus Vrn-B1 seemed to contribute significantly to interactions in both irrigated and drought-stressed environments, explaining up to 12.9% additional variation (Supplementary Figures 4, 5). This reinforces that major flowering genes can contribute to yield advantage in both irrigated and drought-stressed environments by both additive and epistatic effects (Cockram et al., 2007; Sehgal et al., 2017; He et al., 2019).
Likewise, significant epistatic interactions were obtained among genome-wide haplotypes for GY, explaining a higher percentage of variation in severely stressed environments (SD and HS) compared to the I environment in all EYTs (Supplementary Figures 9, 10). Our results are in contrast to Reif et al. (2011), who reported that main effects dominated the genetic architecture of GY and epistatic interactions contributed only little. We attribute these discrepancies to a narrower panel of elite breeding lines (455 lines, derivatives from a few parents) used in Reif et al. (2011) that probably did not retain enough power to reveal epistasis among loci. Further, Reif et al. (2011) studied GY only in irrigated environments whereas in the current study multiple environments were analyzed.
To be able to utilize stable QTL in a breeding program, we constructed heat maps for all environments in all EYTs. This approach led us to recognize different sets of lines with contrasting haplotype composition. CIMMYT and other breeding programs start to routinely genotype all lines that enter yield trials. Therefore, lines with higher numbers of favorable haplotypes and complementary haplotypes can be identified and re-incorporated as parents in breeding programs to maintain and further accumulate the favorable haplotypes in subsequent breeding cycles. The results can also be exploited in multiple-trait integration or line-conversion pipelines by using the lines carrying high numbers of favorable haplotypes as elite parents in crosses with donor parents selected for additional target traits (e.g., disease resistance) to be able to reveal a comprehensive performance package. The latest studies have shown that integrating haplotypes and epistatic interactions as fixed effects in genome-wide prediction models can improve prediction abilities for GY by about 10% (Spindel et al., 2016; Sehgal et al., 2020). This approach that attempts to boost prediction abilities with the contribution of GWAS peaks has yet to be further tested. Further, Mérida-García et al. (2020) reported candidate genes underpinning metaQTL reported by Acuña-Galindo et al. (2015) on chromosomes 3B and 4A. The candidate genes reported here (Supplementary Table 6) with proven roles in abiotic stress tolerance in model crops or having expression evidences in wheat under various stress conditions expand opportunities for future validation studies (Mérida-García et al., 2020).
Data Availability Statement
The data related to manuscript has been provided in Supplementary Material. The genotypic and phenotypic data are available at link: https://data.cimmyt.org/dataset.xhtml?persistentId=hdl:11529/10548504.
Author Contributions
DS and SD conceptualized the manuscript. SD designed the research. DS analyzed the data and wrote the manuscript. SM, LC-H, GV, JH-E, and RS generated phenotypic data. PJ, SS, and JP provided allele called GBS data. All authors reviewed the manuscript.
Funding
The work was supported by funding from CRP WHEAT, the Durable Rust Resistance in Wheat project (OPPGD1389) led by Cornell University and funded by the Bill & Melinda Gates Foundation (BMGF), the UK Department for International Development (DFID), and the US Agency for International Development (USAID) Feed the Future Innovation Lab for Applied Wheat Genomics (Cooperative Agreement No. AID-OAA-A-13-00051).
Conflict of Interest
The authors declare that the research was conducted in the absence of any commercial or financial relationships that could be construed as a potential conflict of interest.
Supplementary Material
The Supplementary Material for this article can be found online at: https://www.frontiersin.org/articles/10.3389/fgene.2020.589490/full#supplementary-material
Footnotes
References
Acuña-Galindo, M. A., Mason, R. E., Subramanian, N. K., and Hays, D. B. (2015). Meta-analysis of wheat Qtl regions associated with adaptation to drought and heat stress. Crop Sci. 55, 477–492. doi: 10.2135/cropsci2013.11.0793
Adler, D., and Murdoch, D. (2013). rgl: 3D Visualization Device System (opengl). Available online at: http://CRAN.R-project.org/package=rgl (accessed April 14, 2020).
Afzal, F., Li, H., Gul Kazi, A., Subhani, A., Ahmad, A., Mujeeb-Kazi, A., et al. (2019). Genome-wide analyses reveal footprints of divergent selection and drought adaptive traits in synthetic-derived wheats. G3 Genes Gen. Genet. 9, 1957–1973. doi: 10.1534/g3.119.400010
Ain, Q. U., Rasheed, A., Anwar, A., Mahmood, T., Imtiaz, M., Mahmood, T., et al. (2015). Genome-wide association for grain yield under rainfed conditions in historical wheat cultivars from Pakistan. Front. Plant Sci. 6:743. doi: 10.3389/fpls.2015.00743
Alaux, M., Rogers, J., Letellier, T., Flores, R., Alfama, F., Pommier, C., et al. (2018). Linking the International Wheat Genome Sequencing Consortium bread wheat reference genome sequence to wheat genetic and phenomic data. Genome Biol. 19:111. doi: 10.1186/s13059-018-1491-4
Assefa, T., Otyama, P. I., Brown, A. V., Kalberer, S. R., Kulkarni, R. S., and Cannon, S. B. (2019). Genome-wide associations and epistatic interactions for internode number, plant height, seed weight and seed yield in soybean. BMC Genom. 20:527. doi: 10.1186/s12864-019-5907-7
Azadi, A., Mardi, M., Hervan, E. M., Mohammadi, S. A., Moradi, F., Tabatabaee, M. T., et al. (2015). QTL mapping of yield and yield components under normal and salt-stress conditions in bread wheat (Triticum aestivum L.). Plant Mol. Biol. Rep. 33, 102–120. doi: 10.1007/s11105-014-0726-0
Battenfield, S. D., Sheridan, J. L., Silva, L. D. C. E., Miclaus, K. J., Dreisigacker, S., Wilfinger, R. D., et al. (2018). Breeding-assisted genomics: applying meta-GWAS for milling and baking quality in CIMMYT wheat breeding program. PLoS One 3:e0204757. doi: 10.1371/journal.pone.0204757
Braz, C. U., Taylor, J. F., Bresolin, T., Espigolan, R., Feitosa, F. L. B., Carvalheiro, R., et al. (2019). Sliding window haplotype approaches overcome single SNP analysis limitations in identifying genes for meat tenderness in Nelore cattle. BMC Genet. 20:8. doi: 10.1186/s12863-019-0713-4
Breseghello, F., and Sorrells, M. (2006). Association mapping of kernel size and milling quality in wheat (Triticum aestivum L.) cultivars. Genetics 172, 1165–1177. doi: 10.1534/genetics.105.044586
Cavanagh, C. R., Chao, S., Wang, S., Huang, B. E., Stephen, S., Kiani, S., et al. (2013). Genome-wide comparative diversity uncovers multiple targets of selection for improvement in hexaploid wheat landraces and cultivars. Proc. Natl. Acad. Sci. U.S.A. 110, 8057–8062. doi: 10.1073/pnas.1217133110
Cockram, J., Chiapparino, E., Taylor, S. A., Stamati, K., Donini, P., Laurie, D. A., et al. (2007). Haplotype analysis of vernalization loci in European barley germplasm reveals novel VRN-H1 alleles and a predominant winter VRN-H1/VRN-H2 multi-locus haplotype. Theor. Appl. Genet. 115, 993–1001. doi: 10.1007/s00122-007-0626-x
Diao, G., and Vidyashankar, A. N. (2013). Assessing genome-wide statistical significance for large p small n problems. Genetics 194, 781–783. doi: 10.1534/genetics.113.150896
Dreisigacker, S., Kishii, M., Lage, J., and Warburton, M. (2008). Use of synthetic hexaploid wheat to increase diversity for CIMMYT bread wheat improvement. Aust. J. Agric. Res. 59, 413–420. doi: 10.1071/AR07225
Dreisigacker, S., Sehgal, D., Reyes Jaimez, A. E., Luna Garrido, B., Muñoz Zavala, S., Núñez Ríos, C., et al. (2016). Laboratory Protocols and Applications to Wheat Breeding, Version 1. México City: CIMMYT.
Edae, E. A., Byrne, P. F., Haley, S. D., Lopes, M. S., and Reynolds, M. P. (2014). Genome-wide association mapping of yield and yield components of spring wheat under contrasting moisture regimes. Theor. Appl. Genet. 127, 791–807. doi: 10.1007/s00122-013-2257-8
Evangelou, E., and Ioannidis, J. P. A. (2013). Meta-analysis methods for genome-wide association studies and beyond. Nat. Rev. Genet. 14, 379–389. doi: 10.1038/nrg3472
FAO (2020). Crop Prospects and Food Situation–Quarterly Global Report No. 2, Rome, July 2020. Rome: FAO.
Gabriel, S. B., Schaffner, S. F., Nguyen, H., Moore, J. M., Roy, J., Blumenstiel, B., et al. (2002). The structure of haplotype blocks in the human genome. Science 296, 2225–2229. doi: 10.1126/science.1069424
Ganal, M. W., Polley, A., Graner, E. M., Plieske, J., Wieseke, R., Luerssen, H., et al. (2012). Large SNP arrays for genotyping in crop plants. J. Biosci. 37, 821–828. doi: 10.1007/s12038-012-9225-3
Garcia, M., Eckermann, P., Haefele, S., Satija, S., Sznazdar, B., Timmins, A., et al. (2019). Genome-wide association mapping of grain yield in a diverse collection of spring wheat (Triticum aestivum L.) evaluated in southern Australia. PLoS One 14:e0211730. doi: 10.1371/journal.pone.0211730
Hao, D., Cheng, H., Yin, Z., Cui, S., Zhang, D., Wang, H., et al. (2012). Identification of single nucleotide polymorphisms and haplotypes associated with yield and yield components in soybean (Glycine max) landraces across multiple environments. Theor. Appl. Genet. 124, 447–458. doi: 10.1007/s00122-011-1719-0
He, T., Hill, C. B., Angessa, T. T., Zhang, X. Q., Chen, K., Moody, D., et al. (2019). Gene-set association and epistatic analyses reveal complex gene interaction networks affecting flowering time in a worldwide barley collection. J. Exp. Bot. 70, 5603–5616. doi: 10.1093/jxb/erz332
IWGSC (2018). Shifting the limits in wheat research and breeding using a fully annotated reference genome. Science 361:eaar7191.
Juliana, P., Poland, J., Huerta-Espino, J., Shrestha, S., Crossa, J., Crespo-Herrera, L., et al. (2019). Improving grain yield, stress resilience and quality of bread wheat using large-scale genomics. Nat. Genet. 51, 1530–1539. doi: 10.1038/s41588-019-0496-6
Keeble-Gagnère, G., Rigault, P., Tibbits, J., Pasam, R., Hayden, M., Forrest, K., et al. (2018). Optical and physical mapping with local finishing enables megabase-scale resolution of agronomically important regions in the wheat genome. Genome Biol. 19:112. doi: 10.1186/s13059-018-1475-4
Ladejobi, O., Mackay, I. J., Poland, J., Praud, S., Hibberd, J. M., and Bentley, A. R. (2019). Reference genome anchoring of high-density markers for association mapping and genomic prediction in European winter wheat. Front. Plant Sci. 10:1278. doi: 10.3389/fpls.2019.01278
Ledesma-Ramírez, L., Solís-Moya, E., Iturriaga, G., Sehgal, D., Reyes-Valdes, M. H., Montero-Tavera, V., et al. (2019). GWAS to identify genetic loci for resistance to yellow rust in wheat pre-breeding lines derived from diverse exotic crosses. Front. Plant Sci. 10:1390. doi: 10.3389/fpls.2019.01390
Li, F., Wen, W., Liu, J., Zhang, Y., Cao, S., He, Z., et al. (2019). Genetic architecture of grain yield in bread wheat based on genome-wide association studies. BMC Plant Biol. 19:168. doi: 10.1186/s12870-019-1781-3
Li, X., Xu, X., Liu, W., Li, X., Yang, X., and Ru, Z. (2020). Dissection of superior alleles for yield-related traits and their distribution in important cultivars of wheat by association mapping. Front. Plant Sci. 11:175. doi: 10.3389/fpls.2020.00175
Liu, J., He, Z., Rasheed, A., Wen, W., Yan, J., Zhang, P., et al. (2017). Genome-wide association mapping of black point reaction in common wheat (Triticum aestivum L.). BMC Plant Biol. 17:220. doi: 10.1186/s12870-017-1167-3
Liu, J., Rasheed, A., He, Z., Imtiaz, M., Arif, A., Mahmood, T., et al. (2019). Genome-wide variation patterns between landraces and cultivars uncover divergent selection during modern wheat breeding. Theor. Appl. Genet. 132, 2509–2523. doi: 10.1007/s00122-019-03367-4
Lopes, M. S., Dreisigacker, S., Peña, R. J., Sukumaran, S., and Reynolds, M. P. (2015). Genetic characterization of the wheat association mapping initiative (WAMI) panel for dissection of complex traits in spring wheat. Theor. Appl. Genet. 128, 453–464. doi: 10.1007/s00122-014-2444-2
Lu, Y., Xu, J., Yuan, Z., Hao, Z., Xie, C., Li, X., et al. (2012). Comparative LD mapping using single SNPs and haplotypes identifies QTL for plant height and biomass as secondary traits of drought tolerance in maize. Mol. Breed. 30, 407–418. doi: 10.1007/s11032-011-9631-5
Mackay, T. F. (2014). Epistasis and quantitative traits: using model organisms to study gene-gene interactions. Nat. Rev. Genet. 15, 22–33. doi: 10.1038/nrg3627
Mérida-García, R., Gálvez, S., Paux, E., Dorado, G., Pascual, L., and Giraldo, P. (2020). High resolution melting and insertion site-based polymorphism markers for wheat variability analysis and candidate genes selection at drought and heat MQTL loci. Agronomy 10:1294. doi: 10.3390/agronomy10091294
Mondal, S., Dutta, S., Crespo-Herrera, L., Huerta-Espino, J., Braun, H., and Singh, R. P. (2020). Fifty years of semi-dwarf spring wheat breeding at CIMMYT: grain yield progress in optimum, drought and heat stress environments. Field Crops Res. 250, 107757. doi: 10.1016/j.fcr.2020.107757
N’Diaye, A., Haile, J. K., Cory, A. T., Clarke, F. R., Clarke, J. M., Knox, R. E., et al. (2017). Single marker and haplotype-based association analysis of semolina and pasta colour in elite durum wheat breeding lines using a high-density consensus map. PLoS One 12:e0187178. doi: 10.1371/journal.pone.0187178
Neumann, K., Kobiljski, B., Denčić, S., Varshney, R. K., and Börner, A. (2011). Genome-wide association mapping: a case study in bread wheat (Triticum aestivum L.). Mol. Breed. 27, 37–58. doi: 10.1007/s11032-010-9411-7
Poland, J. A., Brown, P. J., Sorrells, M. E., and Jannink, J. L. (2012). Development of high-density genetic maps for barley and wheat using a novel two-enzyme genotyping-by-sequencing approach. PLoS One 7:e32253. doi: 10.1371/journal.pone.0032253
Purcell, S., Neale, B., Todd-Brown, K., Thomas, L., Ferreira, M. A., Bender, D., et al. (2007). PLINK: a toolset for whole-genome association and population-based linkage analysis. Am. J. Hum. Genet. 81, 559–575. doi: 10.1086/519795
Qaseem, M. F., Qureshi, R., Muqaddasi, Q. H., Shaheen, H., Kousar, R., and Röder, M. S. (2018). Genome-wide association mapping in bread wheat subjected to independent and combined high temperature and drought stress. PLoS One 13:e0199121. doi: 10.1371/journal.pone.0199121
Qian, L., Hickey, L. T., Stahl, A., Werner, C. R., Hayes, B., Snowdon, R. J., et al. (2017). Exploring and harnessing haplotype diversity to improve yield stability in crops. Front. Plant Sci. 8:1534. doi: 10.3389/fpls.2017.01534
Quarrie, S., Quarrie, S. P., Radosevic, R., Rancic, D., Kaminska, A., Barnes, J. D., et al. (2006). Dissecting a wheat QTL for yield present in a range of environments: from the QTL to candidate genes. J. Exp. Bot. 57, 2627–2637. doi: 10.1093/jxb/erl026
Ramírez-González, R. H., Borrill, P., Lang, D., Harrington, S. A., Brinton, J., Venturini, L., et al. (2018). The transcriptional landscape of polyploid wheat. Science 361:eaar6089. doi: 10.1126/science.aar6089
Reif, J. C., Maurer, H. P., Korzun, V., Ebmeyer, E., Miedaner, T., Wurschum, T., et al. (2011). Mapping QTLs with main and epistatic effects underlying grain yield and heading time in soft winter wheat. Theor. Appl. Genet. 123, 283–292. doi: 10.1007/s00122-011-1583-y
Rio, S., Mary-Huard, T., Moreau, L., Bauland, C., Palaffre, C., and Madur, D. (2020). Disentangling group specific QTL allele effects from genetic background epistasis using admixed individuals in GWAS: an application to maize flowering. PLoS Genet. 16:e1008241. doi: 10.1371/journal.pgen.1008241
Rutkoski, J., Poland, J., Mondal, S., Autrique, E., Perez, L. G., Crossa, J., et al. (2016). Canopy temperature and vegetation indices from high-throughput phenotyping improve accuracy of pedigree and genomic selection for grain yield in wheat. G3 6, 2799–2808. doi: 10.1534/g3.116.032888
Schwarz, E. G. (1978). Estimating the dimension of a model. Ann. Stat. 6, 461–464. doi: 10.1214/aos/1176344136
Sehgal, D., Autrique, E., Singh, R. P., Ellis, M., Singh, S., Dreisigacker, S., et al. (2017). Identification of genomic regions for grain yield and yield stability and their epistatic interactions. Sci. Rep. 7:41578. doi: 10.1038/srep41578
Sehgal, D., and Dreisigacker, S. (2019). Haplotypes-based genetic analysis: benefits and challenges. Vav. J. Genet. Breed. 23, 803–808. doi: 10.18699/VJ19.37-o
Sehgal, D., Dreisigacker, S., Belen, S., Küçüközdemir, Ü, Mert, Z., Özer, E., et al. (2016). Mining centuries old in situ conserved Turkish wheat landraces for grain yield and stripe rust resistance genes. Front. Genet. 7:201. doi: 10.3389/fgene.2016.00201
Sehgal, D., Mondal, S., Guzman, C., Barrios, G. G., Franco, C., Singh, R., et al. (2019). Validation of candidate gene-based markers and identification of novel loci for thousand -grain weight in spring bread wheat. Front. Plant Sci. 10:1189. doi: 10.3389/fpls.2019.01189
Sehgal, D., Rosyara, U., Mondal, S., Singh, R., Poland, J., and Dreisigacker, S. (2020). Incorporating genome-wide association mapping results into genomic prediction models for grain yield and yield stability in CIMMYT spring bread wheat. Front. Plant Sci. 11:197. doi: 10.3389/fpls.2020.00197
Sehgal, D., Vikram, P., Sansaloni, C. P., Ortiz, C., Saint Pierre, C., Payne, T., et al. (2015). Exploring and mobilizing the gene bank biodiversity for wheat improvement. PLoS One 10:e0132112. doi: 10.1371/journal.pone.0132112
Shokat, S., Sehgal, D., Fulai, L., and Sukhwinder, S. (2020). GWAS analysis of wheat pre-breeding germplasm for terminal drought stress using next generation sequencing technology. Int. J. Mol. Sci. 21:3156. doi: 10.20944/preprints202002.0272.v1
Singh, S., Vikram, P., Sehgal, D., Burguano, J., Sharma, A., Singh, S. K., et al. (2018). Harnessing genetic potential of wheat germplasm banks through impact-oriented-prebreeding for future food and nutritional security. Nat. Sci. Rep. 8:12527. doi: 10.1038/s41598-018-30667-4
Spindel, J. E., Begum, H., Akdemir, D., Collard, B., Redona, E., Jannink, J.-L., et al. (2016). Genome-wide prediction models that incorporate de novo GWAS are a powerful new tool for tropical rice improvement. Heredity 116, 395–408. doi: 10.1038/hdy.2015.113
Sukumaran, S., Dreisigacker, S., Lopes, M., Chavez, P., and Reynolds, M. P. (2015). Genome-wide association study for grain yield and related traits in an elite spring wheat population grown in temperate irrigated environments Theor. Appl. Genet. 128, 353–363. doi: 10.1007/s00122-014-2435-3
Tadesse, W., Sanchez-Garcia, M. A., Solomon, A., Ahmed, B., Zewdie, O., and Francis Baum, M. (2019). Genetic gains in wheat breeding and its role in feeding the world. Crop Breed. Genet. Genom. 1:e190005.
Templeton, A. R., Maxwell, T., Posada, D., Stengard, J. H., Boerwinkle, E., and Sing, C. F. (2005). Tree scanning: a method for using haplotype trees in phenotype/genotype association studies. Genetics 169, 441–453. doi: 10.1534/genetics.104.030080
VanRaden, P. M. (2008). Efficient methods to compute genomic predictions. J. Dairy Sci. 91, 4414–4423. doi: 10.3168/jds.2007-0980
Wang, S. C., Wong, D., Forrest, K., Allen, A., Chao, S., Huang, B. E., et al. (2014). Characterization of polyploid wheat genomic diversity using a high-density 90000 single nucleotide polymorphism array. Plant Biotechnol. J. 12, 787–796. doi: 10.1111/pbi.12183
Warburton, M. L., Crossa, J., Franco, J., Kazi, M., Trethowan, R., Rajaram, S., et al. (2006). Bringing wild relatives back into the family: recovering genetic diversity in CIMMYT improved wheat germplasm. Euphytica 149, 289–301. doi: 10.1007/s10681-005-9077-0
Ward, B. P., Brown-Guedira, G., Kolb, F. L., Van Sanford, D. A., Tyagi, P., Sneller, C. H., et al. (2019). Genome-wide association studies for yield-related traits in soft red winter wheat grown in Virginia. PLoS One 4:e0208217. doi: 10.1371/journal.pone.0208217
Wicker, T., Gundlach, H., Spannagl, M., Cristobal, U., Borrill, P., Ramirez-Gonzalez, R. H., et al. (2018). Impact of transposable elements on genome structure and evolution in bread wheat. Genome Biol. 19:103. doi: 10.1186/s13059-018-1479-0
Zhang, K., Wang, J., Zhang, L., Rong, C., Zhao, F., Peng, T., et al. (2013). Association analysis of genomic loci important for grain weight control in elite common wheat varieties cultivated with variable water and fertilizer supply. PLoS One 8:e57853. doi: 10.1371/journal.pone.0057853
Keywords: haplotype blocks, haplotype-based GWAS, GBS, EYT, heat map
Citation: Sehgal D, Mondal S, Crespo-Herrera L, Velu G, Juliana P, Huerta-Espino J, Shrestha S, Poland J, Singh R and Dreisigacker S (2020) Haplotype-Based, Genome-Wide Association Study Reveals Stable Genomic Regions for Grain Yield in CIMMYT Spring Bread Wheat. Front. Genet. 11:589490. doi: 10.3389/fgene.2020.589490
Received: 30 July 2020; Accepted: 21 October 2020;
Published: 03 December 2020.
Edited by:
Santosh B. Satbhai, Indian Institute of Science Education and Research Mohali, IndiaReviewed by:
Madhav Bhatta, Bayer Crop Science, United StatesLiu Jin Dong, Agricultural Genomics Institute at Shenzhen (CAAS), China
Vandana Jaiswal, Institute of Himalayan Bioresource Technology (CSIR), India
Copyright © 2020 Sehgal, Mondal, Crespo-Herrera, Velu, Juliana, Huerta-Espino, Shrestha, Poland, Singh and Dreisigacker. This is an open-access article distributed under the terms of the Creative Commons Attribution License (CC BY). The use, distribution or reproduction in other forums is permitted, provided the original author(s) and the copyright owner(s) are credited and that the original publication in this journal is cited, in accordance with accepted academic practice. No use, distribution or reproduction is permitted which does not comply with these terms.
*Correspondence: Susanne Dreisigacker, s.dreisigacker@cgiar.org