Development and deployment of an improved Anopheles gambiae s.l. field surveillance by adaptive spatial sampling design
 Gabriel M. Monteiro
 Luc S. Djogbénou
 Martin J. Donnelly3
  Luigi Sedda
- 1Tropical Infectious Diseases Research Center, University of Abomey-Calavi, Cotonou, Benin
- 2Lancaster Ecology and Epidemiology Group, Lancaster University, Lancaster, United Kingdom
- 3Department of Vector Biology, Liverpool School of Tropical Medicine, Liverpool, United Kingdom
- 4Institut Reégional de Santé Publique, University of Abomey-Calavi, Ouidah, Benin
Introduction: Accurate assessments of vector occurrence and abundance, particularly in widespread vector-borne diseases such as malaria, are crucial for the efficient deployment of disease surveillance and control interventions. Although previous studies have explored the benefits of adaptive sampling for identifying disease hotspots (mostly through simulations), limited research has been conducted on field surveillance of malaria vectors.
Methods: We developed and implemented an adaptive spatial sampling design in southwestern Benin, specifically targeting potential and uncertain Anopheles gambiae hotspots, a major malaria vector in sub-Saharan Africa. The first phase of our proposed design involved delineating ecological zones and employing a proportional lattice with close pairs sampling design to maximize spatial coverage, representativeness of ecological zones, and account for spatial dependence in mosquito counts. In the second phase, we employed a spatial adaptive sampling design focusing on high-risk areas with the greatest uncertainty.
Results: The adaptive spatial sampling design resulted in a reduced sample size from the first phase, leading to improved predictions for both out-of-sample and training data. Collections of Anopheles gambiae in high-risk and low-uncertainty areas were nearly tripled compared to those in high-risk and high-uncertainty areas. However, the overall model uncertainty increased.
Discussion: While the adaptive sampling design allowed for increased collections of Anopheles gambiae mosquitoes with a reduced sample size, it also led to a general increase in uncertainty, highlighting the potential trade-offs in multi-criteria adaptive sampling designs. It is imperative that future research focuses on understanding these trade-offs to expedite effective malaria control and elimination efforts.
Open research statement
The datasets and algorithms presented in this study are publicly available at: https://doi.org/10.5281/zenodo.8007905.
Introduction
The Global Vector Control Response (GVCR) was unanimously adopted by the World Health Assembly in May 2017 to tackle the stall in malaria elimination progresses (World Health Organization and UNICEF, 2017). Since then, the WHO has engaged in a program to roll out the GVCR in all regions. GVCR is based on four pillars of vector-borne disease control: intersectoral collaboration, community engagement, monitoring, surveillance and evaluation, and integration of tools and approaches, supported by novel and innovative research.
The four pillars for malaria control and elimination are reliant on disease risk estimated in time and space, which must be routinely reviewed to inform tailored malaria control strategies (Thawer et al., 2022) and to evaluate the impacts of these interventions (Shrestha et al., 2022). A key component for the accurate definition of disease risk distribution is the deployment of optimal entomological surveillance frameworks, where optimal can be defined as the strategy providing the maximum accuracy in the investigated mosquito process (presence/absence, abundance, associations with environment etc...) given the constraints of limited resources (Sedda et al., 2019). An Entomological Adaptive Sampling Framework (EASF) adjusts the entomological sampling strategy across time and space based on a pre-defined criteria or combinations of criteria (e.g., maximizing mosquito catches, minimizing model or predictive distribution errors, etc.), enables the capture of spatially heterogeneous changes in entomological and disease transmission dynamics, and guide programmatic and strategic decisions (Obsomer et al., 2013). Within this framework, cost-effectiveness cannot only be dependent on the accessibility of the survey locations but also on the robustness, quality (or uncertainty), and quantity of information in the collected (Koenraadt et al., 2021), which is the priority for any EASF.
To provide unbiased information on species occurrence and abundance while detecting the spatiotemporal relationships between the targeted species and their environment during an entomological survey. It is necessary for the sampling locations to encompass areas with varying strength of these relationships.
Malaria and other vector-borne disease systems are complex owing to spatial and temporal heterogeneity (Kabaghe et al., 2017b); therefore, flexible spatial sampling designs are required to represent the full dynamicity of the disease system components. In the absence of prior knowledge (expert opinion, historical data) of the process under investigation, a spatially balanced design that spreads the survey locations as evenly as possible in the study area according to a specific sampling method or criteria, provides more uniform coverage over the study area than random sampling, and decreases uncertainty in spatial interpolation (Gelfand et al., 2012). Spatially balanced designs can be obtained by employing quasi-random methods (Sobol and Halton sequences) or distance-based designs, commonly known as space-filling designs (Liu and Vanhatalo, 2020). The major drawback of these designs, in the presence of prior information, is that the locations are selected with identical or roughly equal probabilities. However, when previous data are available, the sampling can be based on a target function (often model-based). Unequal probability survey designs or adaptive designs allow the selection of locations based on specific criteria, with sample locations chosen according to varying probabilities of inclusion in the sample (Brown et al., 2013).
With spatially correlated data, adaptive and sequential sampling, often associated with stratified sampling, can increase the information content, and provide a more efficient estimation of the vector or disease processes (Lazaro et al., 2021). The methods often target locations with high spatial uncertainty or disease hotspots (Case et al., 2022). However, field quantification of the gains obtained using these approaches has not been provided for mosquito surveillance.
In the field study reported here, a spatially balanced design coupled with adaptive sampling was employed for entomological surveillance in the southwestern region of Benin (West Africa). We evaluated the efficacy of spatial adaptive sampling designs for vector surveillance in terms of the reduction of model uncertainty and increased accuracy in mosquito spatial pattern description. Spatial sampling strategy and model performances for the primary malaria vector Anopheles gambiae s.l. (hereafter An. gambiae) are presented.
Methods
Study area
The study site encompassed the provinces of Athiémé, Bopa, Comè, Grand Popo, Houeyogbé, Kpomassè, Ouidah, and Sè in the Atlantique region of Southwest Benin. This region extends from the southwest coast to 30 km inland and from 0 m to 70 m above sea level. The average temperature is 28.9°C, the average relative humidity is 76%, and the average annual rainfall is 190 mm. The wet season is characterized by abundant rain between April and July, with a lower amount of rain from September to October (Boton et al., 2019). Malaria transmission is perennial in this region where malaria is mesoendemic or hyperendemic (malaria prevalence between 40% and 60%) (Damien et al., 2010).
Spatial sampling design
Entomological surveillance was performed in two phases. The first phase (Phase I) was carried out in 2018 and was based on a spatially balanced sampling design (lattice with close pairs), as described in Sedda et al. (2019). This design was selected because of the absence of previous entomological information in the area. In brief, the sample size was obtained from a simulation analysis of a similar study from Kenya. Stratification of the area in ecological zones was performed by spatially adjusted quadratic discriminant analysis. Finally, allocation of the surveillance points in each stratum followed a proportionality approach, with more surveillance locations in strata with larger size and with a 7:3 ratio (70% location in lattice design and 30% locations in close random pair distribution), a ratio obtained from previous studies as described by Sedda et al. (2019). This design was aimed at maximizing spatial coverage (lattice) and improving model inference (close pairs) while accounting for different ecological conditions (sampling locations are allocated to strata proportionally to the strata total area). The entomological surveillance in 2021 (Phase II), in the similar calendar period of Phase I (October–November), was based on a spatial adaptive sampling design (Chipeta et al., 2016), targeting areas with An. gambiae having the highest risk of detection, with the highest uncertainties, based on the prediction results from Phase I (see below).
An adaptive spatial sampling scheme involves selecting older and/or new sampling locations over a sequence of sampling times through probabilistic models. The inherent spatial autocorrelation is explicitly considered to improve the prediction and 'parameters' inference. The implementation of the adaptive sampling design required four preliminary decisions: a) an initial model to fit the data from Phase I; b) a batch size as the number of new locations to add to the first-phase sampling design; c) a utility function to rank unobserved locations to the target; and d) removal of low-information locations from Phase I to satisfy the limited availability of resources.
Phase I An. gambiae counts per week (w) and household (h), Yw,h, were fitted by employing a Poisson generalized linear mixed model with independent and identically distributed spatiotemporal random fields (Equations 1, 3):
where α is a group-level random effect normally distributed with a mean equal to 0 and variance σ2, with the group identified by the location id, v; β is a vector of coefficients for each explanatory variable contained in the matrix X, and ε is the spatiotemporal random Gaussian field with covariance matrix Σε constrained by a Matern covariance function. This model was implemented using the sdmTMB package in the R software (Anderson et al., 2022). The spatiotemporal random field is approximated using a triangulated mesh with a minimum gap of 1 km. In this modeling context, a risk map is equivalent to mapping the detection probabilities of An. gambiae (Aarts et al., 2012).
The adaptive batch comprised 15 new locations (half of those used in Phase I) constrained by available resources. The utility function U is maximized according to the median predicted risk of An. gambiae detection, A, and its uncertainty, E, over the study period and can be mathematically represented by Equations 2:
where R(•) is a ranking function that order A(x) from the largest to the smallest, and q are the locations at the nodes of the predictive spatial grid (see the Model and prediction performance section). This strategy can lead to high sampling bias and fail to prioritize locations with new information because it does not explore areas with low risk at the prediction locations (Case et al., 2022). However, the focus of this study was to delineate An. gambiae hotspots in known and unknown locations. The uncertainty in the linear predictors for each location and week at the predictive grid was obtained by calculating the standard deviation of the model predictions from 999 simulations of the joint precision matrix (Anderson et al., 2022).
Finally, a jackknife approach was implemented to discard locations from Phase I that contained limited information, i.e., limited impact on the uncertainty in predictions when dropped (Wang et al., 2020).
Model and prediction performance
The model parameters' uncertainties were provided by 95% credible intervals (a more robust measure than confidence intervals when comparing models with different sample sizes) and compared between Phase I and Phase II and Phases I and II combined. A comparison was made by estimating the credible interval probability of overlapping (Kruschke, 2013).
Predictions for both Phase I and Phase II and for the overall Phase I and II were obtained on a prediction grid with 5 km spatial resolution covering the study area (longitude from 1.5 E degrees to 2.1 E degrees and latitude from 6 N degrees to 7 N degrees).
Leave-One-Out Cross-Validation (Fuhg et al., 2020) was employed to evaluate out-of-sample prediction errors by by removing one randomly selected record from the training set and predicting the value of An. gambiae in the removed record (a record is one of the house-location-week An. gambiae catch). The procedure was repeated 100 times and the average squared error was measured.
Finally, model-explained variance and training data prediction error were calculated from R-squared (Gelman et al., 2019) and root mean squared error (RMSE) (Rocha et al., 2021) statistics, respectively. A lower RMSE value indicates that the predicted values are closer to the actual values, whereas a higher RMSE value indicates that the predicted values are further away from the actual values.
Environmental variables
An. gambiae counts were inferred and predicted based on co-collected Anopheles. funestus s.l. (An. funestus hereafter), and the eco-strata created by Sedda et al. (2019). The use of An. funestus as a predictor can provide information about the co-occurrence of the two mosquito species, and therefore, a more precise quantification of malaria risk (Djènontin et al., 2010). No other ecological variables were used because the employed eco-strata is a construct of several environmental satellite data obtained from open sources: land cover classification at 30 m resolution obtained from GlobeLand30 for the year 2010 and containing 10 classes (Jun et al., 2014); elevation from the NASA Shuttle Radar Topographic Mission (SRTM) at 90 m and released in 2008 (Jarvis et al., 2008); bioclim precipitation as average annual precipitation from 1970 to 2000 at 30 arcseconds (1 km ca.) (Fick and Hijmans, 2017); soil information at 30 arcseconds from the FAO harmonized world soil database V1.2 (Fischer et al., 2008); and finally, monthly MODerate-resolution Imaging Spectroradiometer (MODIS) satellite products for temperature, enhanced vegetation index (EVI) and the ratio of Actual to Potential Evapotranspiration (ET) were obtained from Oxford University Research Archive at 0.05° (5 km ca.) (Seddon et al., 2016). For each MODIS variable, the mean, amplitude, and variance for the entire 2000–2013 period were calculated. We identified four eco-strata: 1) cultivated land/grassland; 2) forest/shrubland; 3) wetland and water bodies; and 4) urban. The same eco-strata covariate was used for Phase I and Phase II to simplify the modeling integration between the two phases and under the assumption of similarity in the multivariate ecological conditions between the two phases.
Given these environmental variables the glmm model above can be detailed as (Equation 1):
where An. fun are the counts of An. funestus, ER is the eco-strata id, and the β are the intercept (0), and coefficients for An. funestus (1) and each eco-strata (2).
Entomological collection
The design of the first entomological survey of 30 locations based on a spatially balanced design was described by Sedda et al. (2019).
After employing the adaptive sampling design, entomological collections were carried out from October to November 2021 at 17 locations (see Results) for a total of 68 houses (four houses per location). This time period coincides with the time period of Phase I and usually has the highest density of mosquitoes (dry/rainy season) (Djouaka et al., 2016). The houses were randomly selected for mosquito collection. Mosquitoes were collected during four consecutive nights every week for 4 weeks, using CDC light traps (Model 512, John W. Hock Company, Gainesville, FL). At each location, a member of the community was trained using traps and deploying the sampling protocol. The order of house collection was randomized before each collection to remove any systematic biases. Traps were positioned at a height of 1.5 m in sleeping rooms and operated on 12 V battery power from 8 p.m. to 6 a.m. Each morning, mosquitoes were collected, stored in ziplock bags containing silica gel and transported immediately to the laboratory of the Tropical Infectious Diseases Research Center of the University of Abomey-Calavi located at the Institut Regional de Santé Publique of Ouidah for identification and analyses.
Ethical approval
Secondary data analyses were approved by the Faculty of Health and Medicine Research Ethics Committee at Lancaster University (UK), with reference number FHMREC20173.
Results
The An. gambiae counts obtained during Phase I were used to produce an An. gambiae risk map (Figure 1A).
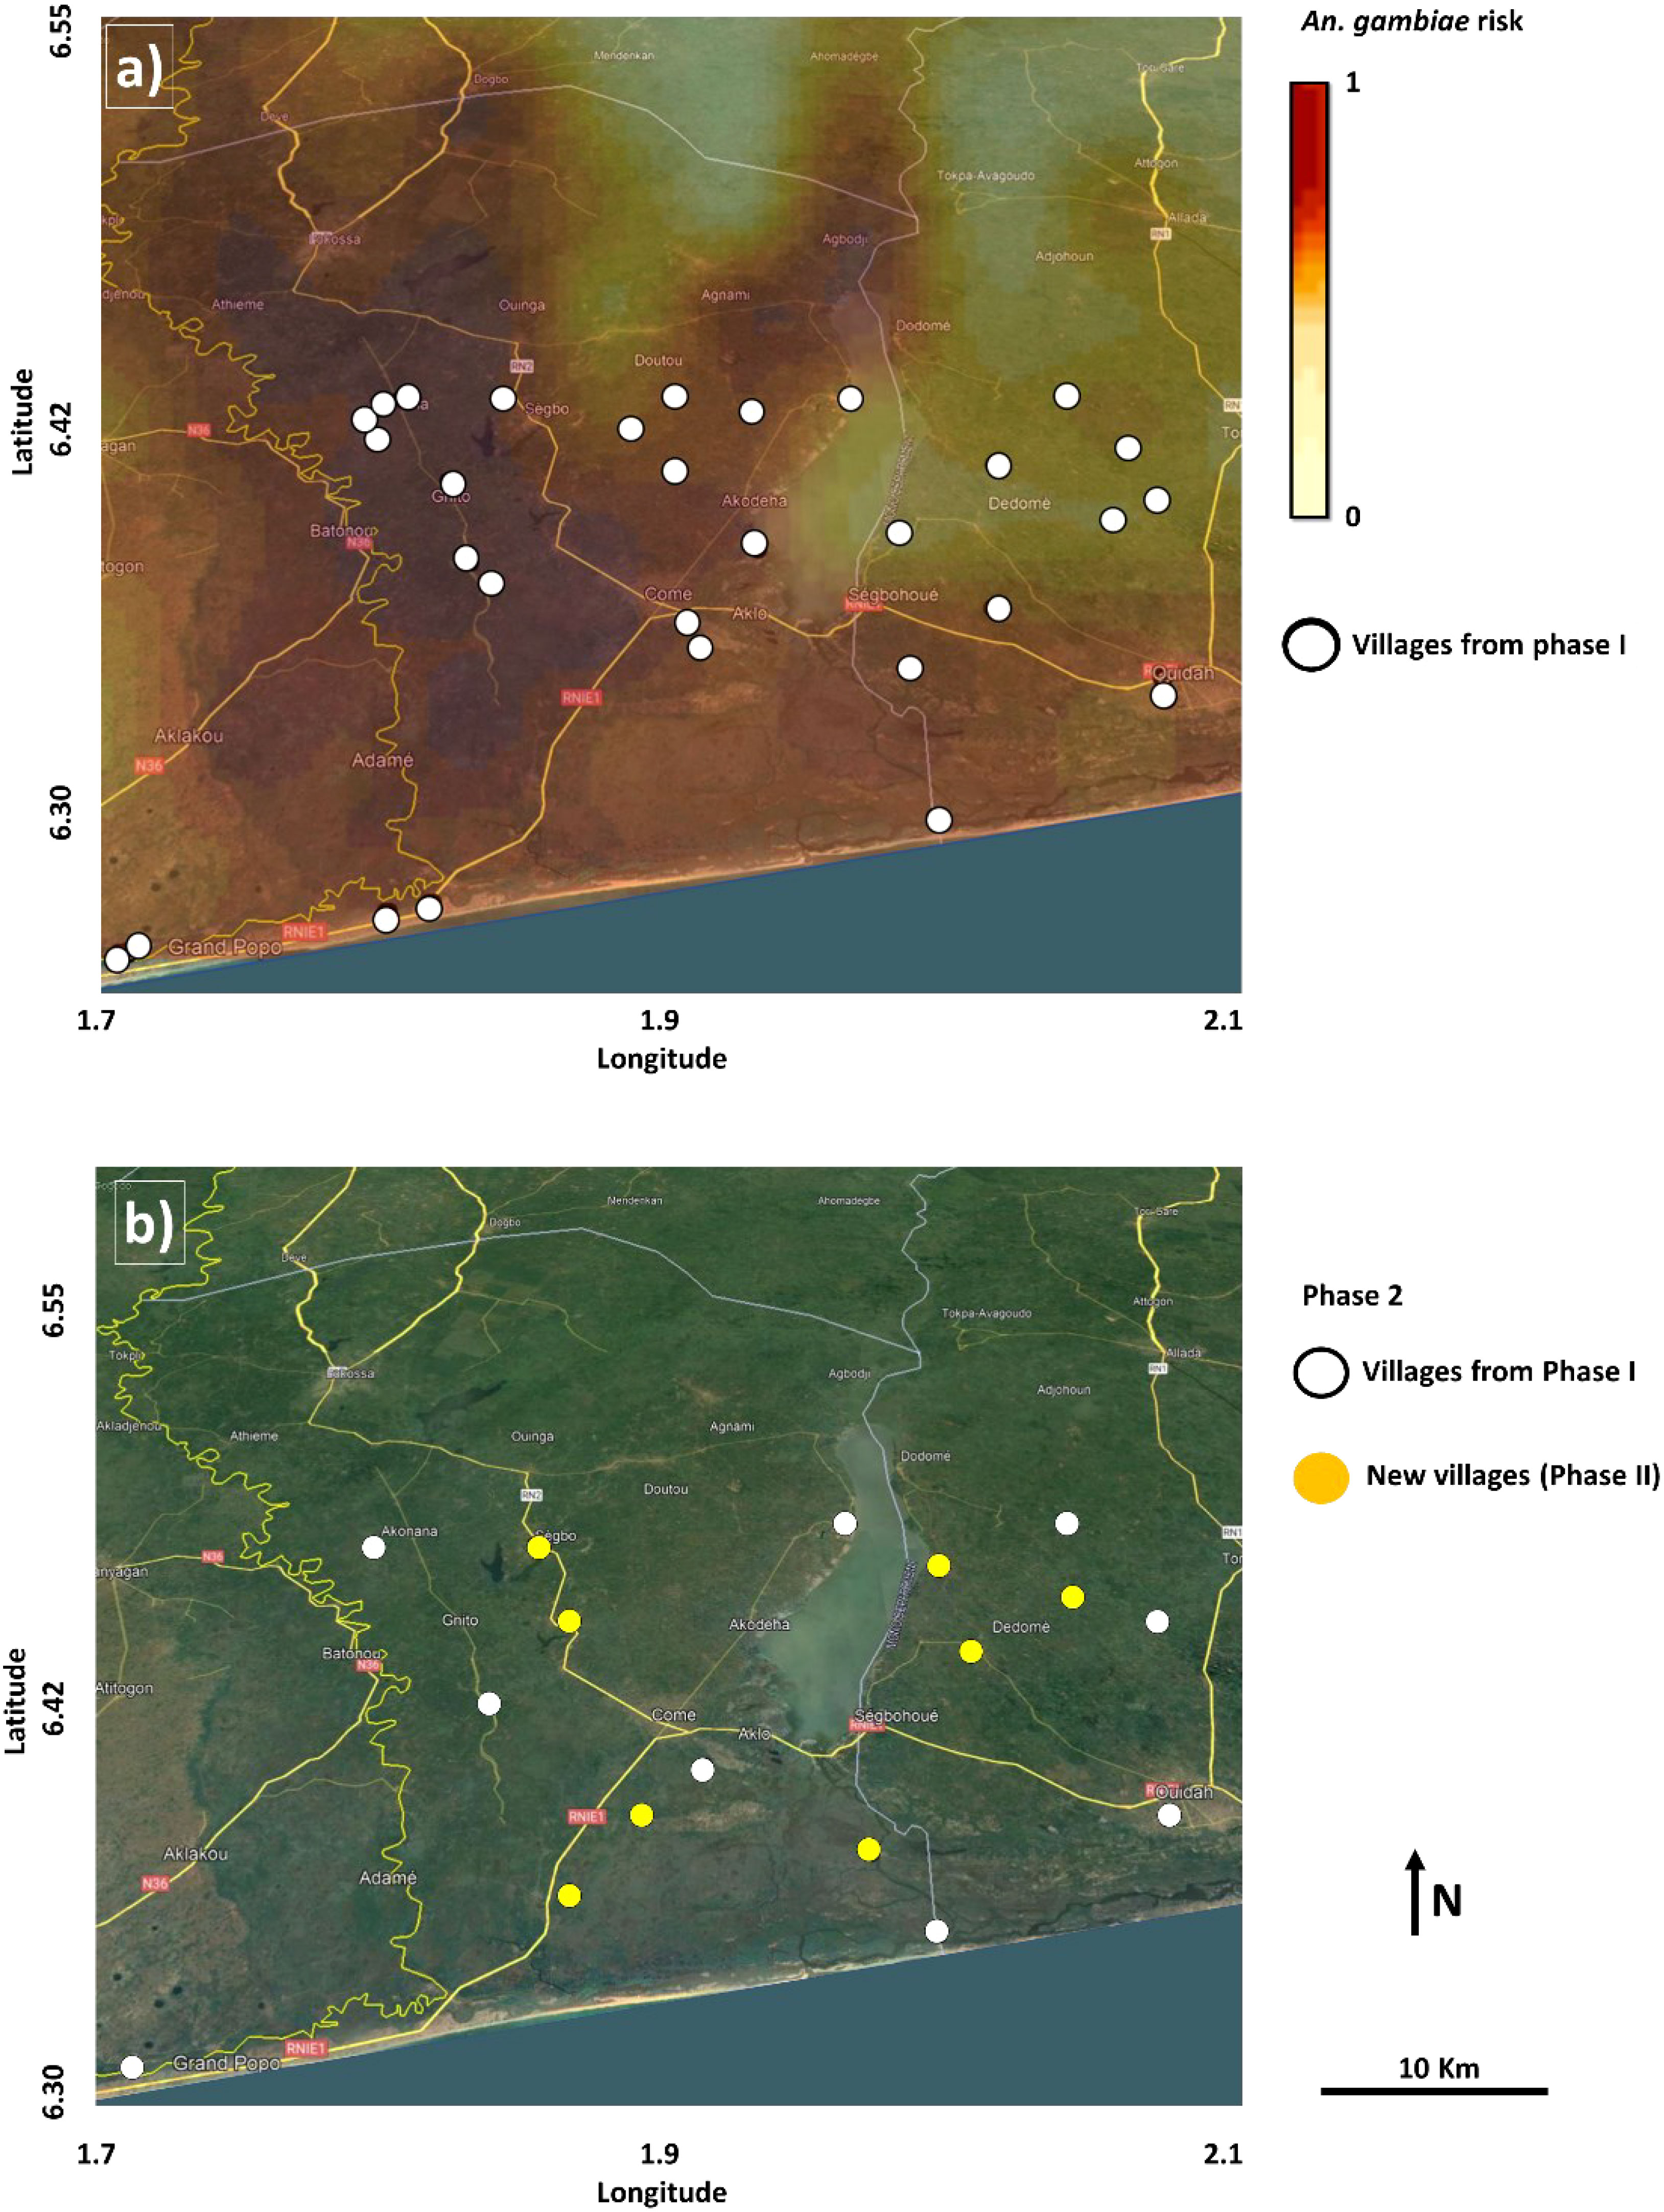
Figure 1 (A) An. gambiae risk map (darker colors higher risk) with white dots in the background showing sampling locations in Phase (I) (B) Based on the An. gambiae risk, Phase II surveillance used a mixture of previous locations (white dots) and new locations (yellow dots). Background: Google Earth Image@2021 (Image Landsat/Copernicus, CNES/Airbus, Maxar Technologies. Data: SIO, NOAA, U.S. Navy, NCA, GEBCO).
Spatial adaptive sampling allocated 15 locations with high An. gambiae risk and high uncertainty, eight in new locations, and seven overlapping with Phase I locations. The jackknife loss of information criteria method removed 21 locations from Phase I. This led to Phase II with 17 locations (eight new and nine from Phase I) (Figure 1B).
Overall, a larger number of An. gambiae were caught in Phase I than in Phase II. In contrast, on average, a larger amount of An. funestus was caught in Phase II than in Phase I (Table 1), although catches of An. gambiae were the majority in both cases. The two species showed a significant positive association (Table 2).
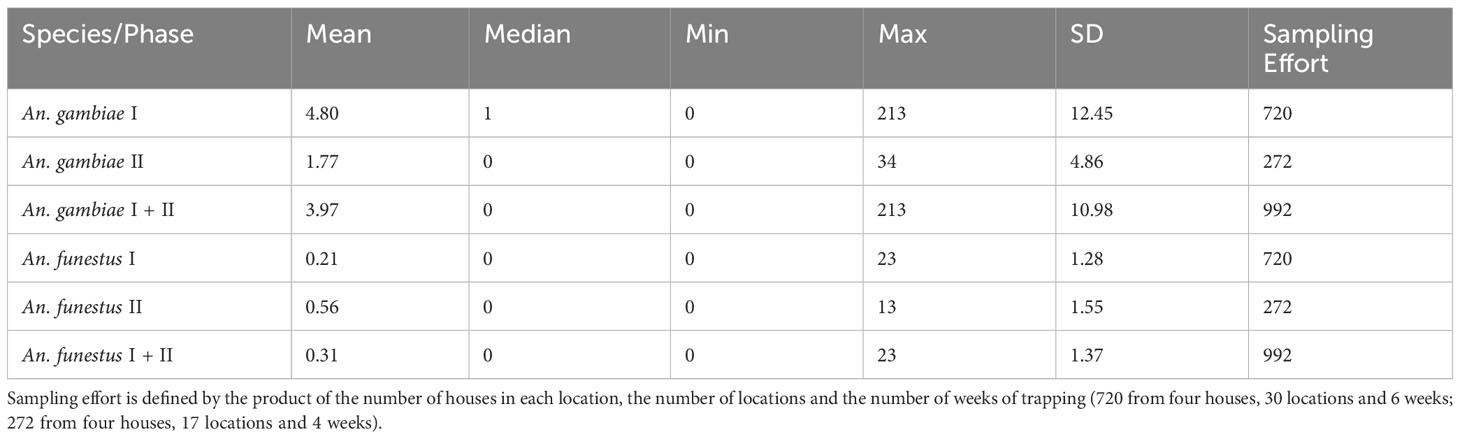
Table 1 Summary statistics for catches of An. gambiae and An. funestus by sampling phase.
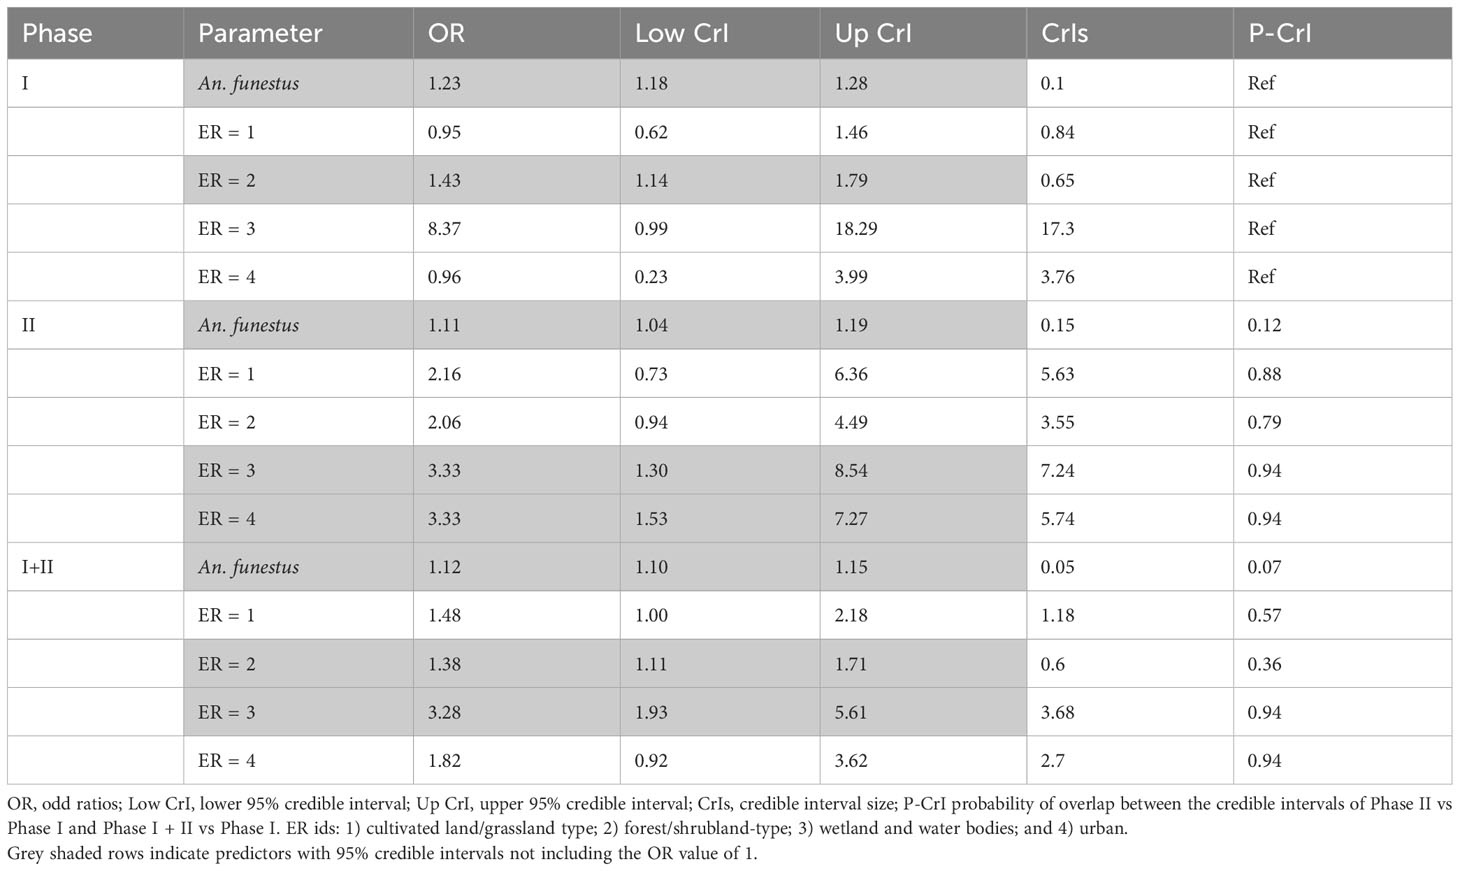
Table 2 Poisson generalised linear model coefficients for fixed effects by modeling An. gambiae counts per week and household.
When comparing Phase I and Phase I + II, all significant predictors for An. gambiae (An. funestus and forest/shrubland-type) had narrower credible intervals in Phase I + II than in Phase I (probability of overlap lower than 0.5) (Table 2). In both Phase I and Phase I + II, increased An. funestus catches and the presence of mixed forest/shrubland eco-strata increased the likelihood of catching An. gambiae, with mixed forest/shrubland ecosystems exerting a stronger effect than An. funestus (Table 2, OR values). However, in Phase II, forest/shrubland was not significantly associated with the catch of An. gambiae; instead, the classes wetland and urban areas were associated with higher catches of An. gambiae, although urban areas became insignificant in Phase I + II. This is not due to the different proportions of eco-strata used between the two phases, since the largest difference was 10% less cultivated land and grassland in Phase II than in Phase I.
The model with Phase I + II data produced a lower variance of the spatiotemporal effect (i.e., a larger amount of variance explained by the predictors than in the model of Phase I) and, in terms of An. gambiae estimation, a lower error during cross-validation, a lower root mean squared error, and a higher explained variance (R-squared), although not large in absolute terms. However, the general uncertainty in the study area increased by approximately 21%. (Table 3)
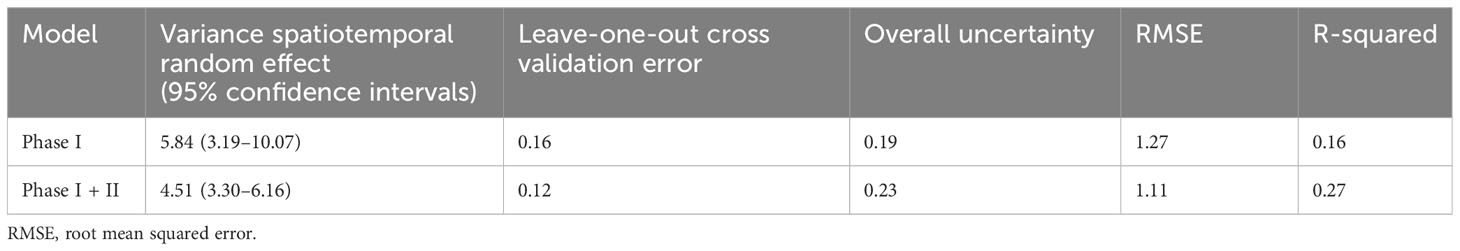
Table 3 Model performance.
Finally, Figure 2 shows the relative risk of An. gambiae in Phase I and Phase I + II, the latter with a general increased risk in most of the region, but not in the northeast.
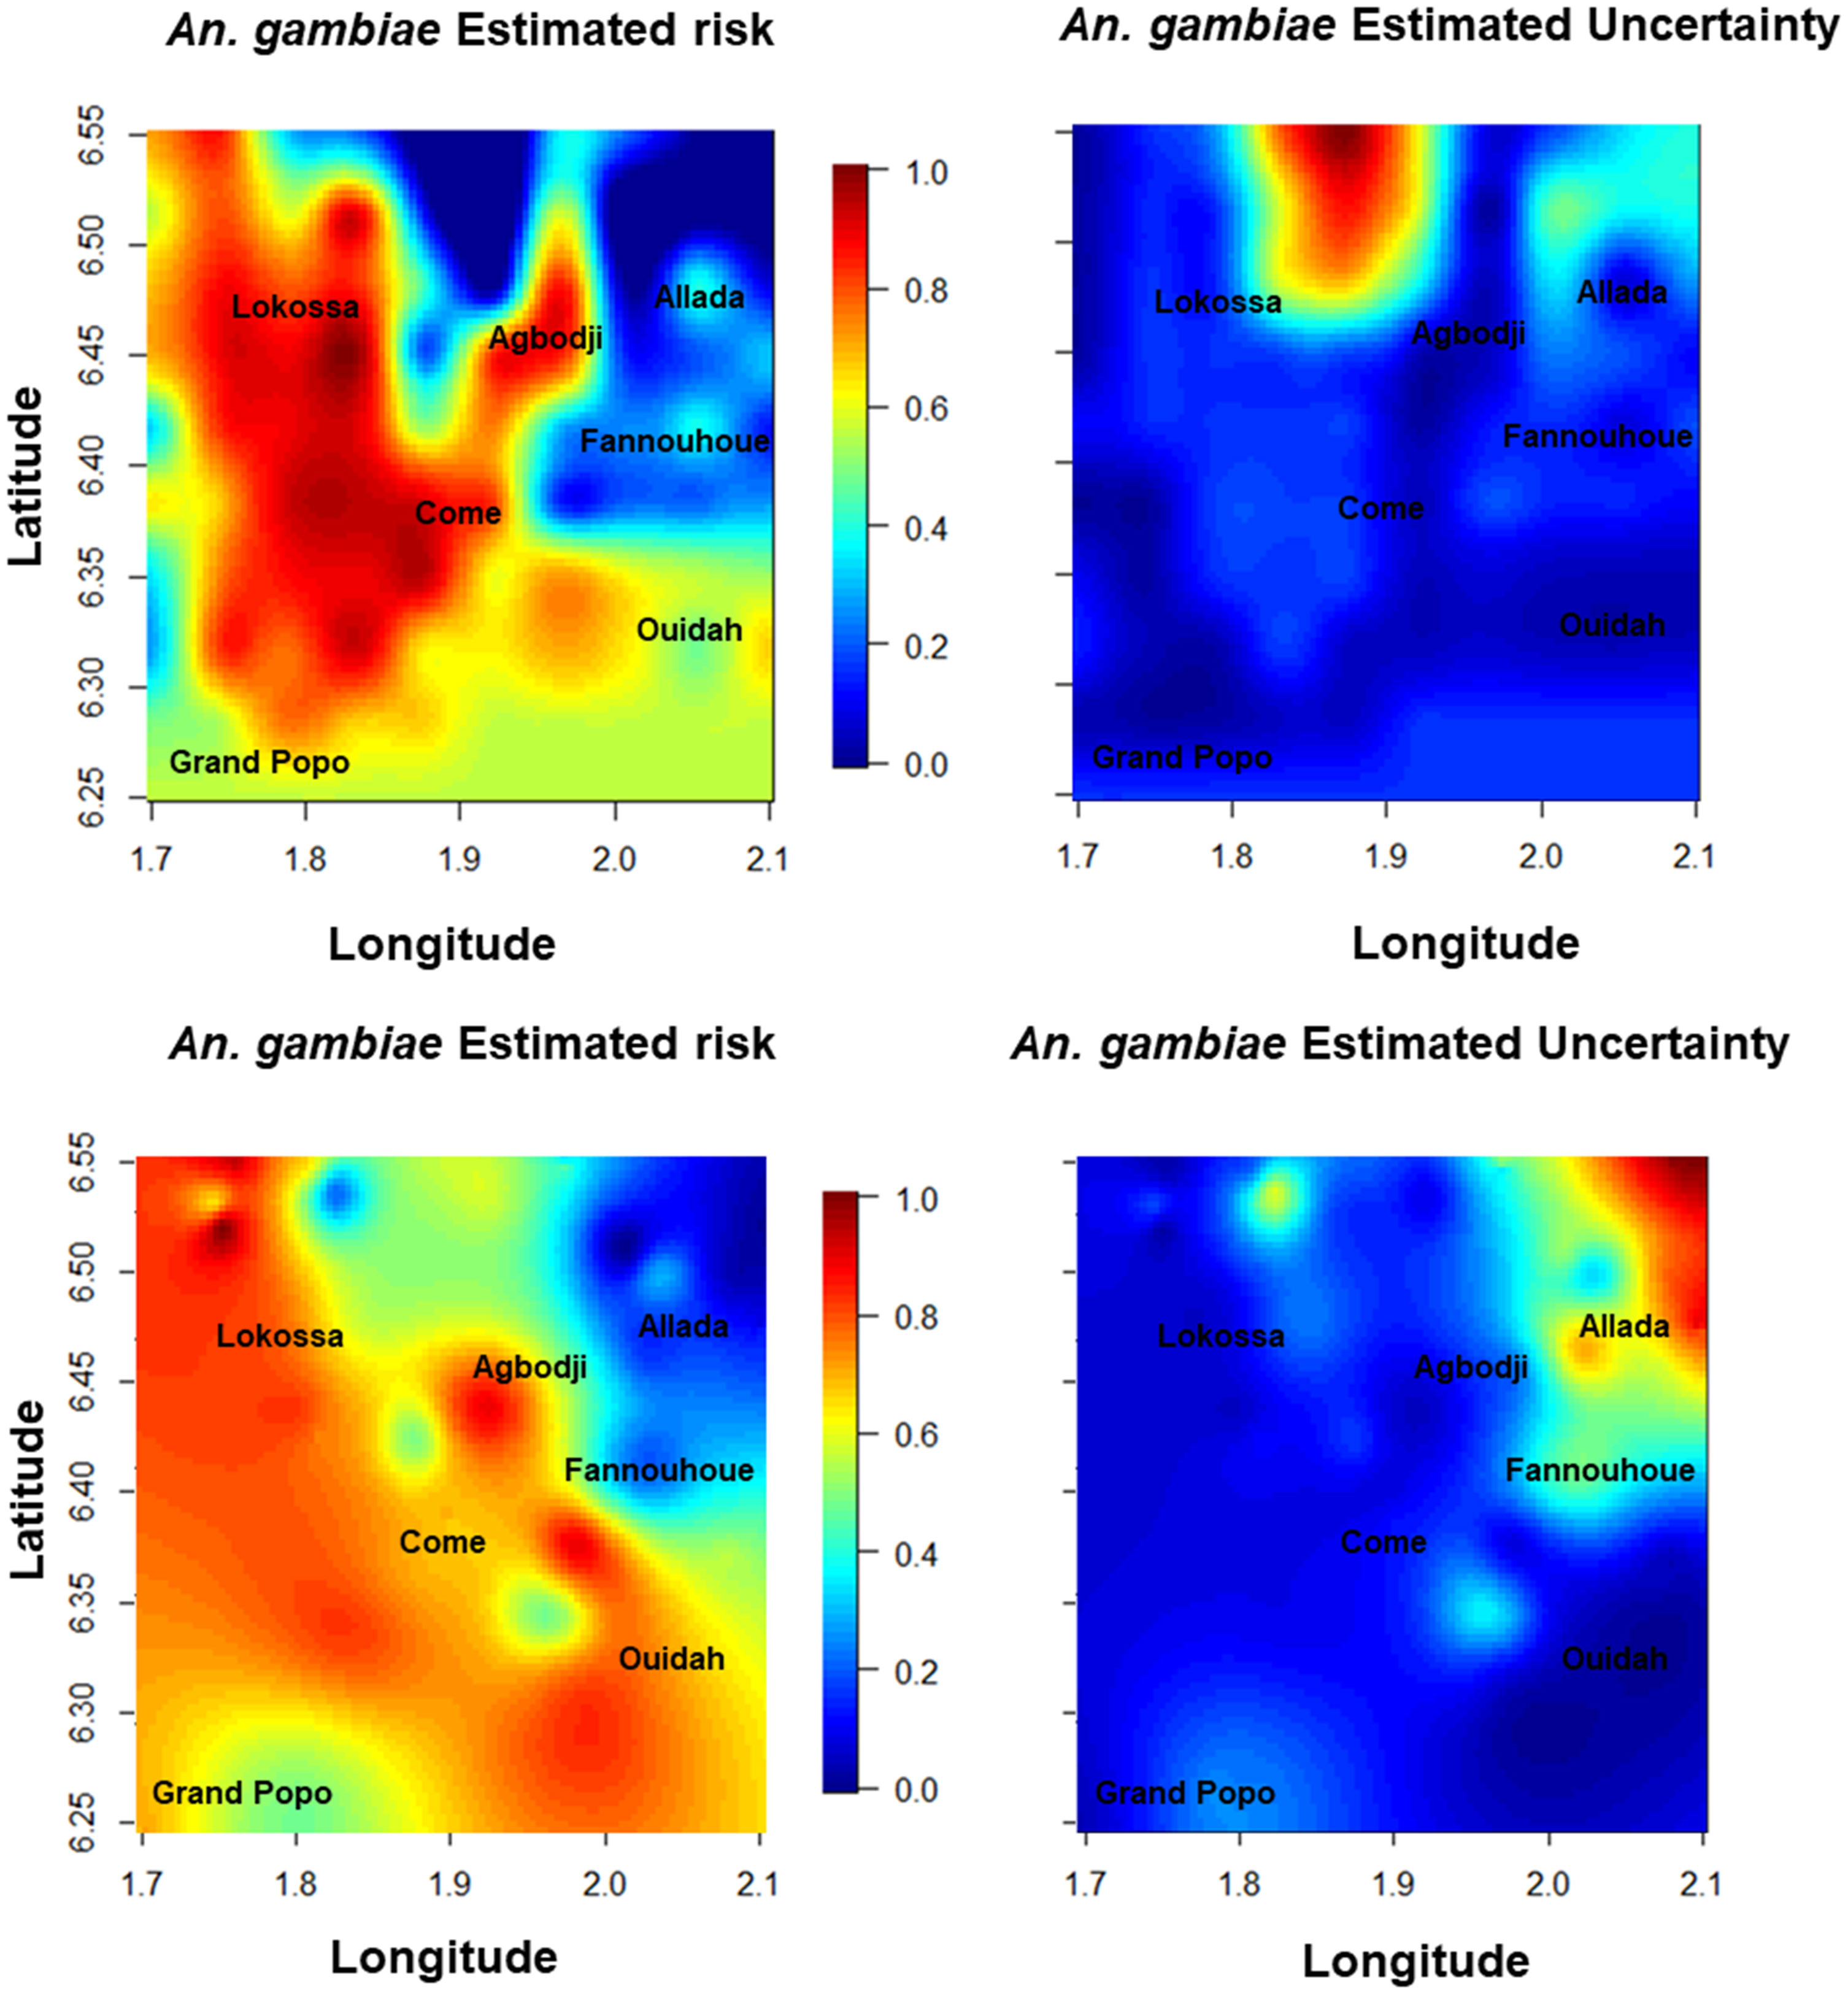
Figure 2 An. gambiae relative risk and relative uncertainty in Phase I (top) and Phase I + II (bottom).
Discussion
To provide scientifically grounded guidance to decision makers for effective targeted malaria control and elimination, an accurate assessment of the spatiotemporal malaria transmission intensity that can consider the spatiotemporal heterogeneities in both vectors and parasites is essential. This will allow for the design of tailored intervention strategies at different locations and time periods. Model-based sampling strategies, such as spatial adaptive sampling designs, are the best-equipped tools for undercovering these heterogeneities.
The present study aimed to improve the definition of the most uncertain An. gambiae hotspots by targeting its largest and most uncertain risk. The research was carried out in two phases: the first phase, where zone delineation (eco-strata) and a proportional lattice with close pairs sampling design were implemented [fully described in Sedda et al. (2019)], and a second phase that combined a spatial adaptive sampling design targeting high risk with the highest uncertainty, with the information loss criteria method to add new locations and remove obsolete ones. The Phase II sample size was 56% of the sample size in Phase I. While out-of-sample and training data predictions improved with additional adaptive locations, the general uncertainty increased by a fifth of the initial one. In other words, the presented framework has an accurate expectation of An. gambiae spatiotemporal heterogeneity (i.e., an accurate description of the average risk in the sampled area), although with larger margins of uncertainty when compared to the initial sampling. The R-squared value is relatively low, however, this element considers the linear predictor only while accounting for the total variance of the model. Since, the majority of the risk is explained by the spatiotemporal random Gaussian field, the R-squared values are low (Sterba and Rights, 2022). Changes that have occurred in the last three years in the area, the different goals of Phase I and Phase II, and the used adaptive target criteria have certainly contributed to a general increase in the uncertainty, including the utility function not based on global uncertainty. It is well known that uncertainty maps can indicate where additional data would reduce the overall prediction error, and although other authors (Shrestha et al., 2022) suggest similar strategies as the one adopted in this work, we have shown that short-term targets (where the short term is defined as a low number of repeated sampling) are likely to improve only some characteristics of the model while potentially worsening others, especially in the context of a limited and/or static number of predictors. Additional work on the effective capacity of multicriteria adaptive sampling design is required with relation to the linear term of the model [a machine learning approach could be a solution for this component of the framework (Yu and Liu, 2003)], length, and frequency of the surveillance.
Previous work has concentrated on the benefits of spatial adaptive sampling strategies on the disease, not the vector, and often by simulation of artificial data (Case et al., 2022). For example, Andrade-Pacheco et al. (2020) showed that a spatially adaptive sampling approach produced consistently superior accuracy for generic disease hotspot classification over a random sampling approach, and could dramatically lower the resource requirements to conduct surveys with the goal of detecting disease hotspots. The only study found on field surveillance of malaria was the work of Kabaghe et al. (2017a), who applied adaptive sampling for malaria prevalence in an area in Malawi and identified areas where increased sampling effort increased the overall predictive accuracy of the hotspot area. However, their survey design 'only targeted predictive high-intensity areas of malaria prevalence.
The use of An. funestus is justified by the significant and direct association with An. gambiae (Table 2), as shown in Benin (Djouaka et al., 2016) and elsewhere in West Africa (Adja et al., 2013). As shown by previous Benin entomological surveys (Djouaka et al., 2016), An. gambiae and An. funestus are the two major malaria vectors, and other Anopheles species are rarely found. The two vectors were the only ones found in this study as well as in Djouaka et al. (2016). Other mosquito genera are commonly collected, including Culex, Aedes, and Mansonia, but they are not relevant for malaria or as sympatric species.
The larger densities of An. funestus found in Phase II than in Phase I do not seem to depend on the unintentional targeting of this species by the model, since locations with high risk and high uncertainty 'for An. gambiae caught a lower average number of An. funestus than the average number caught in high-risk and low-uncertainty areas (0.087 and 0.930, respectively). Similarly, areas associated with low uncertainty 'for An. gambiae and high risk almost tripled the catches of An. gambiae compared to those with high uncertainty (3.055 versus 1.087, respectively), confirming the capacity of the model to effectively and accurately target An. gambiae risk in areas with low uncertainty.
While the model presented herein shows good robustness (RMSE around 1, which fits the common assumption of residual errors with one standard deviation), it is limited by the time passed from Phase I to Phase II (almost 3 years due to the COVID epidemic), which may have contributed to the lower number of An. gambiae catches, increased uncertainty in Phase I + II, and the effects of malaria control interventions. However, the present work is a typical example of designing a new mosquito surveillance campaign using existing available data (Coulibaly et al., 2023) as commonly applied. In addition, this work does not compare with a control, e.g., a surveillance in the same region involving a random sample, although the scientific community agrees on the superiority of adaptive or other model-based designs compared to random sampling. Finally, 21 locations from Phase I were removed because of minimal contribution to the overall information under the condition of limited available resources. However, this should be done carefully, and future studies should evaluate the effect of removal sequentially, instead of in batches, to account for intra-location variation and seasonality effects at location candidates for removal.
Future work will need to address the limitations of the present study and answer other important questions for optimal interventions, such as the operational unit for treatment that will require the integration of the epidemiological component into the entomological component (Rebollo et al., 2018), and the epidemiological and entomological indicators that can consider the heterogeneity of parasites and vectors in different environments (Liu et al., 2023). For any malaria elimination strategy, it will be necessary to balance the targeting of interventions to disease hotspots, with the need to correctly identify the vector and infestation status in the larger neighborhood area to ascertain the risk of potential re-introduction (Huestis et al., 2019; Stolk et al., 2021; Case et al., 2022), as well as logistical constraints (e.g., human resources and cost) (Wang et al., 2020). Therefore, it is essential to integrate local malaria incidence data throughout the study to optimize intervention prioritization. To enhance the system’s performance in identifying disease vector hotspots, a methodological framework should be established for jointly modeling vector densities and malaria incidence. This approach ensures that interventions are strategically deployed based on the dynamic relationship between vector abundance and malaria cases, thereby leading to more effective and targeted control measures.
We have shown that adaptive sampling can reduce the sample size without affecting the statistical expectations of An. gambiae distribution patterns, although it increases uncertainty. However, it also demonstrated the efficacy of the design in detecting larger densities of An. gambiae in areas with high An. gambiae risk and low uncertainty, an essential element for hotspot detection.
In conclusion, for malaria and many other infectious diseases, two conditions need to be met for the disease to be categorized as susceptible to eradication/elimination: first, there must be accurate diagnostic(s); and second, there must be effective intervention tools able to remove the infection from the area. The latter will only succeed if appropriate sampling strategies are available. These results provide new insights into the development of place-based strategies.
Data availability statement
The datasets presented in this study can be found in online repositories. The names of the repository/repositories and accession number(s) can be found below: https://doi.org/10.5281/zenodo.8007905.
Ethics statement
Secondary data analyses have been approved by the Faculty of Health and Medicine Research Ethics Committee at Lancaster University (UK) with reference number FHMREC20173.
Author contributions
MD and LS conceived the study. GM led field work and data curation. LS designed the algorithm and conducted the analyses. LS and LD acquired funding, administrated the project, and led the investigation. MD and LD provided supervision. GM and LS drafted the manuscript. All authors edited the manuscript and approved the final draft.
Funding
The author(s) declare financial support was received for the research, authorship, and/or publication of this article. This work was funded and by the Academy of Medical Sciences GCRF Networking Grant Scheme (GCRFNGR7/1329). Phase I of the sampling strategy was funded by the Medical Research Council (grant no. MR/P02520X/1), a UK funded award part of the EDCTP2 programme supported by the European Union. LS is also supported by the Bill and Melinda Gates Foundation under the UCSF Malaria Elimination Initiative project ‘Equipping countries for evidence-based malaria intervention strategies’; and the Wellcome Trust NIHR–Wellcome Partnership for Global Health Research Collaborative Award, CEASE (220870/Z/20/Z). The funders had no role in study design, data collection and analysis, decision to publish, or preparation of the manuscript.
Acknowledgments
The authors wish to thank the householders, villagers, and local staff (Esdras Odjo Constantin Adoha and Pierre Sovegnon) for their contribution to the research.
Conflict of interest
The authors declare that the research was conducted in the absence of any commercial or financial relationships that could be construed as a potential conflict of interest.
Publisher’s note
All claims expressed in this article are solely those of the authors and do not necessarily represent those of their affiliated organizations, or those of the publisher, the editors and the reviewers. Any product that may be evaluated in this article, or claim that may be made by its manufacturer, is not guaranteed or endorsed by the publisher.
References
Aarts G., Fieberg J., Matthiopoulos J. (2012). Comparative interpretation of count, presence-absence and point methods for species distribution models. Methods Ecol. Evol. 3, 177–187. doi: 10.1111/j.2041-210X.2011.00141.x
Adja A. M., N’goran E. K., Koudou B. G., Dia I., Kengne P., Fontenille D., et al. (2013). Contribution ofAnopheles funestus,An. GambiaeandAn. nili(Diptera: Culicidae) to the perennial malaria transmission in the southern and western forest areas of Côte d’Ivoire. Ann. Trop. Med. Parasitol. 105, 13–24. doi: 10.1179/136485910X12851868780388
Anderson S. C., Ward E. J., English P. A., Barnett L. A. K. (2022). sdmTMB: an R package for fast, flexible, and user-friendly generalized linear mixed effects models with spatial and spatiotemporal random fields. bioRxiv, 485545. doi: 10.1101/2022.03.24.485545
Andrade-Pacheco R., Rerolle F., Lemoine J., Hernandez L., Meite A., Juziwelo L., et al. (2020). Finding hotspots: development of an adaptive spatial sampling approach. Sci. Rep. 10. doi: 10.1038/s41598-020-67666-3
Boton D. M., Fangninou F. F., Xu B., Houedegnon P. (2019). Climate change and potential health effect in Benin, west africa. Int. J. Sci. Res. Publications (IJSRP) 9, 625–633. doi: 10.29322/IJSRP.9.09.2019.p9381
Brown J. A., Salehi M. M., Moradi M., Panahbehagh B., Smith D. R. (2013). Adaptive survey designs for sampling rare and clustered populations. Mathematics Comput. Simulation 93, 108–116. doi: 10.1016/j.matcom.2012.09.008
Case B. K. M., Young J. G., Penados D., Monroy C., Hebert-Dufresne L., Stevens L. (2022). Spatial epidemiology and adaptive targeted sampling to manage the Chagas disease vector Triatoma dimidiata. PloS Negl. Trop. Dis. 16, 18. doi: 10.1371/journal.pntd.0010436
Chipeta M. G., Terlouw D. J., Phiri K. S., Diggle P. J. (2016). Adaptive geostatistical design and analysis for prevalence surveys. Spatial Stat 15, 70–84. doi: 10.1016/j.spasta.2015.12.004
Coulibaly Z. I., Gowelo S., Traore I., Mbewe R. B., Ngulube W., Olanga E. A., et al. (2023). Strengthening adult mosquito surveillance in Africa for disease control: learning from the present. Curr. Opin. Insect Sci. 60, 101110. doi: 10.1016/j.cois.2023.101110
Damien G. B., Djènontin A., Rogier C., Corbel V., Bangana S. B., Chandre F., et al. (2010). Malaria infection and disease in an area with pyrethroid-resistant vectors in southern Benin. Malaria J. 9, 380. doi: 10.1186/1475-2875-9-380
Djènontin A., Bio-Bangana S., Moiroux N., Henry M.-C., Bousari O., Chabi J., et al. (2010). Culicidae diversity, malaria transmission and insecticide resistance alleles in malaria vectors in Ouidah-Kpomasse-Tori district from Benin (West Africa): A pre-intervention study. Parasites Vectors 3, 83. doi: 10.1186/1756-3305-3-83
Djouaka R., Akoton R., Tchigossou G. M., Atoyebi S. M., Irving H., Kusimo M. O., et al. (2016). Mapping the distribution of Anopheles funestus across Benin highlights a sharp contrast of susceptibility to insecticides and infection rate to Plasmodium between southern and northern populations. Wellcome Open Res. 1, 28. doi: 10.12688/wellcomeopenres.10213.1
Fick S. E., Hijmans R. J. (2017). WorldClim 2: new 1-km spatial resolution climate surfaces for global land areas. Int. J. Climatology 37, 4302–4315. doi: 10.1002/joc.5086
Fischer G., Nachtergaele F., Prieler S., Van Velthuizen H., Verelst L., Wiberg D. (2008). Global agro-ecological zones assessment for agriculture (GAEZ 2008). IIASA Laxenburg Austria FAO Rome Italy, 10.
Fuhg J. N., Fau A., Nackenhorst U. (2020). State-of-the-art and comparative review of adaptive sampling methods for kriging. Arch. Comput. Methods Eng. 28, 2689–2747. doi: 10.1007/s11831-020-09474-6
Gelfand A. E., Sahu S. K., Holland D. M. (2012). On the effect of preferential sampling in spatial prediction. Environmetrics 23, 565–578. doi: 10.1002/env.2169
Gelman A., Goodrich B., Gabry J., Vehtari A. (2019). R-squared for bayesian regression models. Am. Statistician 73, 307–309. doi: 10.1080/00031305.2018.1549100
Huestis D. L., Dao A., Diallo M., Sanogo Z. L., Samake D., Yaro A. S., et al. (2019). Windborne long-distance migration of malaria mosquitoes in the Sahel. Nature 574, 404–408. doi: 10.1038/s41586-019-1622-4
Jarvis A., Reuter H. I., Nelson A., Guevara E. (2008). Hole-filled SRTM for the globe Version 4. available from the CGIAR-CSI SRTM 90m Database 15 (25-54), 5. http://srtm.csi.cgiar.org
Jun C., Ban Y., Li S. (2014). Open access to Earth land-cover map. Nature 514, 434–434. doi: 10.1038/514434c
Kabaghe A. N., Chipeta M. G., Mccann R. S., Phiri K. S., Van Vugt M., Takken W., et al. (2017a). Adaptive geostatistical sampling enables efficient identification of malaria hotspots in repeated cross-sectional surveys in rural Malawi. PloS One 12. doi: 10.1371/journal.pone.0172266
Kabaghe A. N., Chipeta M. G., Terlouw D. J., Mccann R. S., Van Vugt M., Grobusch M. P., et al. (2017b). Short-Term Changes in Anemia and Malaria Parasite Prevalence in Children under 5 Years during One Year of Repeated Cross-Sectional Surveys in Rural Malawi. Am. J. Trop. Med. Hygiene 97, 1568–1575. doi: 10.4269/ajtmh.17-0335
Koenraadt C. J. M., Spitzen. J., Takken W. (2021). Innovative strategies for vector control (Vol. 6). Wageningen, The Netherlands: Wageningen Academic Publishers.
Kruschke J. K. (2013). Bayesian estimation supersedes the t test. J. Exp. Psychol. Gen. 142, 573–603. doi: 10.1037/a0029146
Lazaro E., Sese M., Lopez-Quilez A., Conesa D., Dalmau V., Ferrer A., et al. (2021). Tracking the outbreak: an optimized sequential adaptive strategy for Xylella fastidiosa delimiting surveys. Biol. Invasions 23, 3243–3261. doi: 10.1007/s10530-021-02572-x
Liu M. T., Liu Y., Po L., Xia S., Huy R., Zhou X. N., et al. (2023). Assessing the spatiotemporal malaria transmission intensity with heterogeneous risk factors: A modeling study in Cambodia. Infect. Dis. Model. 8, 253–269. doi: 10.1016/j.idm.2023.01.006
Liu J., Vanhatalo J. (2020). Bayesian model based spatiotemporal survey designs and partially observed log Gaussian Cox process. Spatial Stat 35. doi: 10.1016/j.spasta.2019.100392
Obsomer V., Titeux N., Vancustem C., Duveiller G., Pekel J.-F., Connor S., et al. (2013). From anopheles to spatial surveillance: A roadmap through a multidisciplinary challenge. Anopheles mosquitoes - New Insights into Malaria Vectors, 457–486. doi: 10.5772/55622
Rebollo M. P., Zoure H., Ogoussan K., Sodahlon Y., Ottesen E. A., Cantey P. T. (2018). Onchocerciasis: shifting the target from control to elimination requires a new first-step-elimination mapping. Int. Health 10, i14–i19. doi: 10.1093/inthealth/ihx052
Rocha A. D., Groen T. A., Skidmore A. K., Willemen L. (2021). Role of sampling design when predicting spatially dependent ecological data with remote sensing. IEEE Trans. Geosci. Remote Sens. 59, 663–674. doi: 10.1109/TGRS.2020.2989216
Sedda L., Lucas E. R., Djogbenou L. S., Edi A. V. C., Egyir-Yawson A., Kabula B. I., et al. (2019). Improved spatial ecological sampling using open data and standardization: an example from malaria mosquito surveillance. J. R. Soc. Interface 16. doi: 10.1098/rsif.2018.0941
Seddon A. W. R., Macias-Fauria M., Long P. R., Benz D., Willis K. J. (2016). Sensitivity of global terrestrial ecosystems to climate variability. Nature 531, 229–232. doi: 10.1038/nature16986
Shrestha H., Mcculloch K., Hedtke S. M., Grant W. N. (2022). Geospatial modeling of pre-intervention nodule prevalence of Onchocerca volvulus in Ethiopia as an aid to onchocerciasis elimination. PloS Negl. Trop. Dis. 16, 25. doi: 10.1038/nature16986
Sterba S. K., Rights J. D. (2022). R-squared measures for multilevel mixture models with random effects. Struct. Equation Modeling: A Multidiscip. J. 29, 489–506. doi: 10.1080/10705511.2021.1962325
Stolk W. A., Blok D. J., Hamley J. I. D., Cantey P. T., De Vlas S. J., Walker M., et al. (2021). Scaling-down mass ivermectin treatment for onchocerciasis elimination: modeling the impact of the geographical unit for decision making. Clin. Infect. Dis. 72, S165–S171. doi: 10.1093/cid/ciab238
Thawer S. G., Golumbeanu M., Munisi K., Aaron S., Chacky F., Lazaro S., et al. (2022). The use of routine health facility data for micro-stratification of malaria risk in mainland Tanzania. Malaria J. 21, 14. doi: 10.1186/s12936-022-04364-7
Wang Y. K., Moe C. L., Dutta S., Wadhwa A., Kanungo S., Mairinger W., et al. (2020). Designing a typhoid environmental surveillance study: A simulation model for optimum sampling site allocation. Epidemics 31. doi: 10.1016/j.epidem.2020.100391
World Health Organization and UNICEF (2017). Global vector control response 2017-2030 Geneva: World Health Organization.
Keywords: Anopheles gambiae, Anopheles funestus, malaria, model-based geostatistics, mosquitoes, spatial sampling design
Citation: Monteiro GM, Djogbénou LS, Donnelly MJ and Sedda L (2024) Development and deployment of an improved Anopheles gambiae s.l. field surveillance by adaptive spatial sampling design. Front. Ecol. Evol. 11:1241617. doi: 10.3389/fevo.2023.1241617
Received: 16 June 2023; Accepted: 15 December 2023;
Published: 11 January 2024.
Edited by:
Ali Khenchaf, UMR6285 Laboratoire des Sciences et Techniques de l’Information, de la Communication et de la Connaissance (LAB-STICC), FranceReviewed by:
Veronica Andreo, National Scientific and Technical Research Council (CONICET), ArgentinaWenn-Chyau Lee, University of Malaya, Malaysia
Copyright © 2024 Monteiro, Djogbénou, Donnelly and Sedda. This is an open-access article distributed under the terms of the Creative Commons Attribution License (CC BY). The use, distribution or reproduction in other forums is permitted, provided the original author(s) and the copyright owner(s) are credited and that the original publication in this journal is cited, in accordance with accepted academic practice. No use, distribution or reproduction is permitted which does not comply with these terms.
*Correspondence: Luigi Sedda, l.sedda@lancaster.ac.uk