Evolutionary rescue and geographic range shifts under climate change for global amphibians
 Kelly Silva Souza1*
  Danilo Siqueira Fortunato1
  Lucas Jardim1
  Levi Carina Terribile2
  Matheus Souza Lima-Ribeiro2
  Camilla Ávila Mariano1
  Jesús Nazareno Pinto-Ledezma3
  Rafael Loyola4
  Ricardo Dobrovolski5
  Thiago Fernando Rangel4
  Iberê Farina Machado6
  Tainá Rocha7
  Mariana Gomes Batista1
  Maria Lucia Lorini8 Mariana Moncassim Vale9
  Carlos Arturo Navas10
  Natan Medeiros Maciel4
  Fabricio Villalobos11 Miguel Ângelo Olalla-Tarraga12 João Fabrício Mota Rodrigues2
  Sidney Feitosa Gouveia13
  José Alexandre Felizola Diniz-Filho4
- 1Laboratory of Theoretical Ecology and Synthesis, Institute of Biological Sciences V, Federal University of Goiás, Goiânia, Brazil
- 2Macroecology Laboratory, Academic Unit of Biological Sciences, Federal University of Jataí, Jataí, GO, Brazil
- 3Department of Ecology, Evolution and Behavior, University of Minnesota, Minneapolis, MN, United States
- 4Department of Ecology, Institute of Biological Sciences V, Federal University of Goiás, Goiânia, Brazil
- 5Institute of Biology, Federal University of Bahia, Salvador, Brazil
- 6Boitatá Institute and PDJ/CNPq, Rio de Janeiro, Brazil
- 7Biodiversity Research Program, Museu Paraense Emílio Goeldi, Belém, Pará, Brazil
- 8Institute of Biosciences, UNIRIO, Rio de Janeiro, Brazil
- 9Department of Ecology, Federal University of Rio de Janeiro, Rio de Janeiro, Brazil
- 10Institute of Biosciences, Universityof São Paulo, São Paulo, Brazil
- 11Red de Biología Evolutiva, Instituto de Ecología, A.C., Xalapa, Veracruz, Mexico
- 12Biodiversity and Macroecology Lab, Department of Biology and Geology, Physics and Inorganic Chemistry, Rey Juan Carlos University, Madrid, Spain
- 13Department of Ecology, CCBS, Federal University of Sergipe, Aracaju, Sergipe, Brazil
By the end of this century, human-induced climate change and habitat loss may drastically reduce biodiversity, with expected effects on many amphibian lineages. One of these effects is the shift in the geographic distributions of species when tracking suitable climates. Here, we employ a macroecological approach to dynamically model geographic range shifts by coupling ecological niche models and eco-evolutionary mechanisms, aiming to assess the probability of evolutionary rescue (i.e., rapid adaptation) and dispersal under climate change. Evolutionary models estimated the probability of population persistence by adapting to changes in the temperature influenced by precipitation in the following decades, while compensating the fitness reduction and maintaining viable populations in the new climates. In addition, we evaluated emerging patterns of species richness and turnover at the assemblage level. Our approach was able to identify which amphibian populations among 7,193 species at the global scale could adapt to temperature changes or disperse into suitable regions in the future. Without evolutionary adaptation and dispersal, 47.7% of the species could go extinct until the year 2,100, whereas adding both processes will slightly decrease this extinction rate to 36.5%. Although adaptation to climate is possible for populations in about 25.7% of species, evolutionary rescue is the only possibility to avoid extinction in 4.2% of them. Dispersal will allow geographic range shifts for 49.7% of species, but only 6.5% may avoid extinction by reaching climatically suitable environments. This reconfiguration of species distributions and their persistence creates new assemblage-level patterns at the local scale. Temporal beta-diversity across the globe showed relatively low levels of species turnover, mainly due to the loss of species. Despite limitations with obtaining data, our approach provides more realistic assessments of species responses to ongoing climate changes. It shows that, although dispersal and evolutionary rescue may attenuate species losses, they are not enough to avoid a significant reduction of species’ geographic ranges in the future. Actions that guarantee a higher potential of adaptation (e.g., genetic diversity through larger population sizes) and increased connectivity for species dispersion to track suitable climates become essential, increasing the resilience of biodiversity to climate change.
1. Introduction
Rapid changes in global biodiversity are underway and are expected to intensify due to anthropogenic climate change and habitat loss (Nicholson et al., 2021; Trew and Maclean, 2021). When considering species at broad spatial scales and looking from a macroecological perspective, these changes induce shifts, expansions or contractions in their geographic ranges as they track suitable environments. As an emergent result, biodiversity patterns are changing (Gaston and Blackburn, 2000; Chen et al., 2011; Vilela et al., 2018).
In this context, amphibians are expected to be the first vertebrate clade to experience mass extinction (Hof et al., 2011; Ceballos et al., 2020). Approximately 50% of all amphibian populations are presumed to be declining or threatened with extinction at some level (Alroy, 2015; Duan et al., 2016), and climate change alone will likely cause the extinction of about 40% of amphibian species still within this century (Hof et al., 2011; but see Manes and Vale, 2022). In general, tropical species with a small distribution are considered the most susceptible to extinction (Gibbons et al., 2000; Thomas et al., 2004; Foden et al., 2013; Manes et al., 2021). This global extinction crisis has challenged scientists worldwide (Stuart et al., 2004; Beebee and Griffiths, 2005; Collins and Crump, 2009). More than ever, it is important to detect and anticipate changes and prevent accelerated population decline and eventual extinction (Ceballos et al., 2020).
A widely used tool in biodiversity studies under climate change is species distribution models (SDMs) (e.g., Franklin, 2010; Peterson et al., 2011; Guisan et al., 2017; Araújo et al., 2019; Manes et al., 2021). Species distribution models and related models rely on associations between species occurrences and environmental variables (usually climatic). These models estimate the distributional area with the environmental conditions that maintain viable populations (Soberón et al., 2007; Colwell and Rangel, 2009; Araújo and Peterson, 2012; Pinto-Ledezma and Cavender-Bares, 2020). Although SDMs have been widely used in macroecological analyses, some of their assumptions – unlimited dispersal to suitable areas and niche conservatism (Araújo and Pearson, 2005) – are hardly met. Thus, long-term predictions of species’ responses to climate change may be compromised (Araújo and Peterson, 2012). So, a more refined evaluation of species’ responses to climate change based on the integration of environmental variables, eco-physiological processes (Araújo et al., 2019; Tourinho et al., 2021), and other population-level processes (e.g., climatic adaptation and dispersal) are essential for a better assessment of the species ability to cope with future threats (Kearney and Porter, 2009; Lavergne et al., 2010; Norberg et al., 2012; Tourinho and Vale, 2022).
Dispersal limitation and physiological (or behavioral) vulnerability to climate change can impact species’ ability to access suitable areas that are even geographically close (Rossetto et al., 2008; Engler et al., 2009; Pinto and MacDougall, 2010; Caplat et al., 2016). On the other hand, populations with sufficient genetic diversity may have the evolutionary potential to adapt to environmental changes and allow species persistence if climatic tolerance evolves faster than climate changes (Urban et al., 2012, 2013; Quintero and Wiens, 2013). Expanding the core idea of SDMs (i.e., using climatic variables and species occurrences to estimate suitability), by incorporating eco-evolutionary processes at population-level, may be a valuable improvement in understanding the potential impact of climate change on genetic diversity and adaptive potential (Lavergne et al., 2010). This understanding will help us to predict how populations will face the rapid global changes relatively to evolutionary history of lineages (Corn, 2005; Duan et al., 2016), and develop more effective conservation actions to protect biodiversity at different organization levels—from genes to populations to species (Mendelson et al., 2006; Schwartz et al., 2007).
Here, we aim to predict the impacts of climate change on the geographic distributions (hereafter ranges) of 7,193 amphibian species worldwide. We used a macroecological approach to investigate the potential for evolutionary rescue by applying models for rapid adaptive response to environmental change in a spatially- explicit context, based on a set of parameters of life-history and quantitative genetics (Diniz-Filho et al., 2019). We assess the probabilities of adaptation in some locations and dispersal of species’ populations under future climate changes in their ranges’ trailing edge – i.e., regions no longer suitable for the species assuming niche conservatism — and their leading edge – i.e., new suitable regions reached via dispersal—while also allowing for spatially-explicit dispersal constraints. Our objective is to show how these processes would change the species’ ranges and rearrange the patterns of species richness and temporal turnover across the world. We expect that, when we include the adaptive potential of species and their ability to disperse to verify the future distribution of species, range loss damage may be less than expected with future climate changes, given the rapid evolution of some species in response to these changes.
2. Methods
Our analyses considered the extent of occurrence (i.e., range maps) of 7,193 species of amphibians of the world as obtained from IUCN in 2021,1 which matched the most complete species-level phylogeny (Jetz and Alexander, 2018). We overlaid species ranges in a global grid of 1 degree of latitude and longitude and generated a presence-absence matrix of the species (PAM) using the letsR package (Vilela and Villalobos, 2015). For the analyses, we used the current (1950–2000) and future (2080–2100, RCP6.0) conditions of the Mean Temperature of Wettest Quarter (Bio8) in the community climate system model (CCSM) recorded in the same grid (Lima-Ribeiro et al., 2015).
The framework proposed here (Figure 1) defines a simple initial bioclimatic envelope using Bio8 obtained from geographic ranges but adding dispersal limitation (explained below) and adaptive potential. For the adaptation, we used a macroecological approach with eco-evolutionary modeling based on quantitative genetics to predict the adaptive response of phenotypic traits for thermal tolerance to environmental change (see Diniz-Filho et al., 2019 for a recent discussion). Our macroecological evaluation focuses primarily on using Bio8 because it represents a critical dimension of the species’ niche, i.e., the thermal condition during the breeding season. As such, it can be treated as a ‘target’ response variable for quantitative genetic analyses of niche evolution (Skelly et al., 2007; Bush et al., 2016). Additional environmental variables (e.g., humidity-related variables) can also impact the biology of amphibian species and their responses to environmental change. So, although we deal with univariate analysis, we included the influence of change precipitation of the wettest quarter (Bio16) in the calculation of haldanes (explained below).
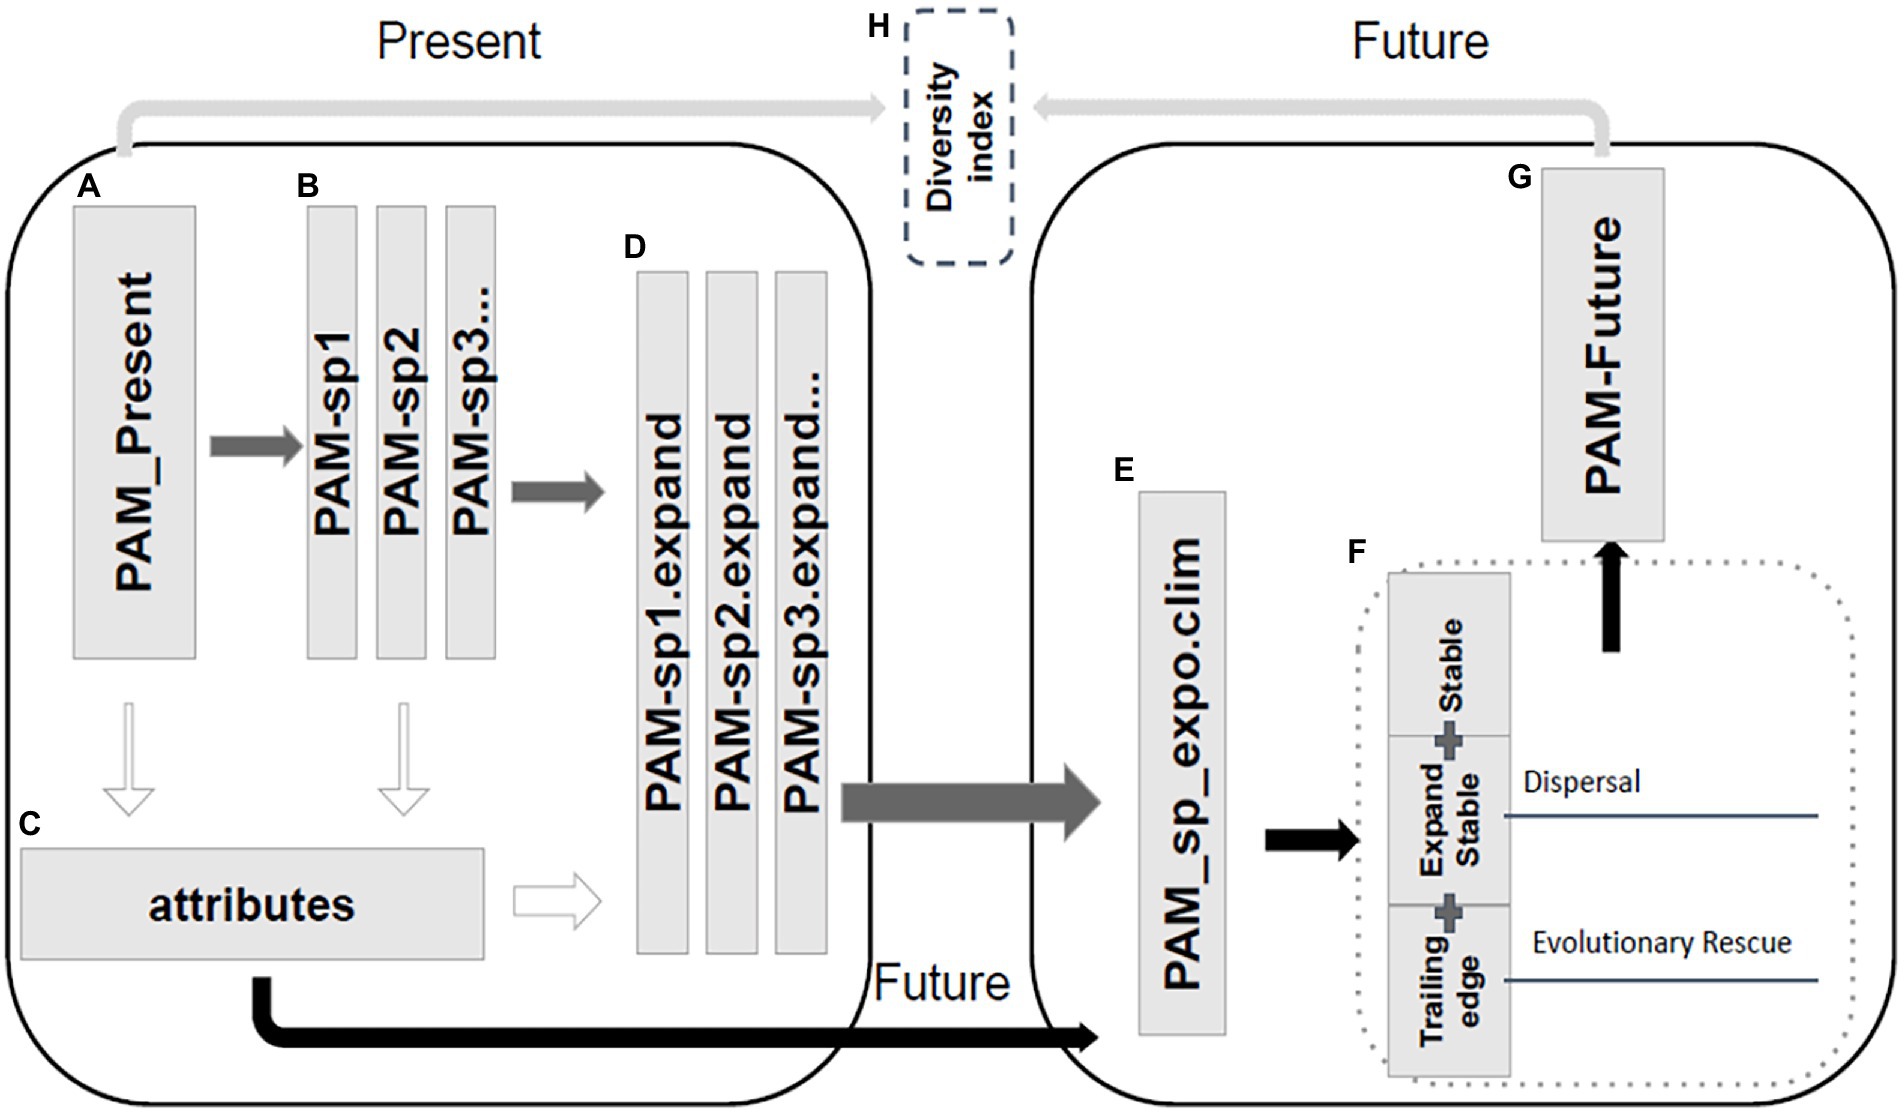
Figure 1. (A) Creation of the presence and absence matrix in the present from the range polygons of each amphibian species using the lets.presab function from the letsR package. (B) We performed the analysis at the population level. For that, each species’ range was split into populations of 4 or fewer cells. For example, a species with a range of 20 cells is divided into five populations of four cells (PAM_sp1). Species with <4 cells were supposed to have a single population. (C) Calculation of the attributes of species and their populations (Biome, Altitude, Bio8). (D) Dispersion in the Present to the immediate neighborhood, with probabilistic occupation, considering the limits of the Biome, altitude, and climate. (E) Exposure of populations to future climate, considering the maintenance of populations that remain within the 95% tolerance range of the climatic limits of the species. (F) Definition of climate futures, with the separation of climatic regions (stable region, leading-edge, and trailing edge). Leading Edge is the dispersal region for accessible areas in the future. Trailing-edge is the range area in the present that is not suitable for the species in the future. In this region, the adaptive potential of the species is tested. (G) Unification of populations into a PAM of species in the future. (H) Verification of changes in species diversity (richness and temporal beta).
In addition, previous studies showed evidence of the effect of increasing the intensity of climate change on the potential of adaptation (see Diniz-Filho et al., 2019; Souza et al., 2019). Thus, all analyses for the future species’ ranges for 2080–2100 were performed under the alternative emission scenario RCP6.0 as it represents a more conservative climatic scenario. The increase of global mean surface temperature projected under the RCP6.0 scenario is in mean 2.2°C (1.4°C to 3.1°C) by the end of this century relative to 1986–2005 (IPCC, 2014), which is considered the most likely future (Capellán-Pérez et al., 2016; Ritchie and Dowlatabadi, 2017). Moreover, given the linear association between climatic scenarios and the relative short time-frame considered here, we expect a minimum impact of different climatic scenarios on the adaptive potential of amphibian species. We examined the match between the scenarios using Spearman rank correlations (ρ). Indeed, Bio8 under the RCP6.0 scenario is highly correlated with the scenarios RCP2.6 (ρ = 0.946) and RCP8.5 (ρ = 0.960), thus we can conclude that our estimations are not compromised by the effect of different climatic scenarios.
2.1. Exposure to climate change: Stable and trailing edge regions
We used the Bio8 current conditions and identified the amplitude (minimum and maximum limits) to which each species is currently exposed within its range, and assuming a normal distribution, defined the tolerance as 95% of this amplitude. First, we identified cells within the species range where the future amplitudes of temperature are expected to be the same, thus defining the climate stability area. Then, we delimited areas within species’ ranges where future climate conditions will probably exceed the climate conditions currently experienced by the species, which was designated as “critically exposed” and define the trailing edge of the species (following Ribeiro et al., 2016).
2.2. Adaptive potential in trailing edge populations
We assessed the species’ adaptive potential at the population level (for a schematic view of evaluating adaptive potential in the trailing edge of a species under climate change, see Figure 5 in Diniz-Filho et al., 2019). Here, we consider a “population” a region with up to four cells. We assumed that these populations are locally adapted to the environmental conditions (mean climatic condition of four cells in the analyzed region) and will track local environmental changes independently (Cotto et al., 2017). We calculated the evolutionary rate of temperature in haldanes (H) of each population based on the amount of temperature shift between current and future climates:
The haldane (H) measures the rate of evolutionary change expected for the thermal tolerance required to maintain each population in the future. This measure is expressed in units of standard deviations (σ) per generation (Gingerich, 2001; Kopp and Matuszewski, 2014). We defined the numerator of H as Y0 - Yt, i.e., the difference in the mean temperatures of wettest quarter (Bio8) in the present and future for each population. For the denominator (g), we estimated the phenotypic variability for the climatic tolerance of the species by the Bio8 standard deviation over the species range in the present. We included the influence of change precipitation of the wettest quarter (Bio16) in the calculation of haldanes. Only for areas with lower precipitation in the future (p0 > pt) the variance (σ) is reduced by (1 + (pt – p0)/pt), thus expressing a linear decrease in phenotypic variability due to the interaction between temperature and precipitation.
For species (N = 2,680, 37.3%) that occur in only one cell, we estimated the standard deviations (sd) using phylogenetic imputation (Swenson and Weiser, 2014) using the R package ‘phytools’. The Ornstein-Uhlenbeck (OU) model has been used to assess the relative importance of genetic drift and selection in phenotypic trait evolution across species (Bartoszek et al., 2017). Thus the OU model was fitted to the logarithm of mean temperature of wettest quarter (Bio8) standard deviations for 2028 species with relatively large geographic ranges (i.e., more than ten cells). We, also, identified evolutionary shifts, for each variable, across the phylogeny using the function ‘estimate_shift_configuration’ of the ‘l1ou’ package (Khabbazian et al., 2016) with a univariate OU model. We set the maximum number of shifts as 30. We imputed missing values according to the estimated optimum for the species’ evolutionary regime and transformed back to the sd scale. All comparative analyses were based on the phylogenetic relationship of amphibians as the consensus phylogeny published by Jetz and Alexander (2018).
We also defined an adjustment of the sd in the populations of the large-ranged species based on the proportion of variation among populations and total genetic variation given by Wright’s F statistics, reducing the species’ variance in Bio8 by multiplying by 1 – FST and recalculating sd within each population. There is no broad-scale synthesis of F statistics on amphibian populations, so we based our values of F statistics on a literature search and found 372 studies (provided in the Supplemental Information) that defined FST values for different amphibian species and populations. Based on these studies, we modeled the FST as a function of geographic range size and body size using a phylogenetic generalized least squares (PGLS), also based on Jetz and Alexander (2018) consensus phylogeny, with caper package (Orme et al., 2013), using the λ parameter to increase model fit. We then obtained estimates of FST for all species in our dataset and corrected sd values accordingly. Data for body size were obtained from the AmphiBIO database (Oliveira et al., 2017).
We defined the generation time as the minimum age of sexual maturity for amphibians, ranging from 0.25 to 12 years (mean = 2.96), according to the AmphiBio database (Oliveira et al., 2017). Therefore, for the period between 1999 and 2100, we considered 100 years or 33 generations. To account for the uncertainty in the number of generations, we simulated a distribution of the number of generations for each species by sampling 1,000 values from a uniform random distribution ranging from 30 to 50 generations.
We compared H with the Maximum Sustainable Evolutionary Rate of the species incorporating phenotypic plasticity (MSERp) for each population (i.e., Chevin et al., 2010; Kopp and Matuszewski, 2014; Diniz-Filho et al., 2019; Souza et al., 2019). The MSERp gives the rate at which adaptation to moving optimum has to occur to compensate for the reduction in fitness because of environmental shifts and thus maintain a positive population growth rate (and consequently permit species or populations to avoid extinction) considering the phenotypic plasticity. The MSERp is given by:
where λ is the maximum rate of population increase in the adaptive optimum, σ2 is the phenotypic variance, ω2 is the fitness landscape and h2, theheritability of the trait. B is the rate of environmental change, b is a parameter controlling phenotypic plasticity (i.e., how much of the total response is due to plasticity relative to the overall change), and T is the generation length. Thus, we used values of λ ranging from 1.1 to 1.25, corresponding to maximum intrinsic growth rates, σ2 is defined by sd2. We defined ω2 = 50 σ2 for each species, so modeling the process as due to weak selection and more or less corresponding to a fitness reduction of 20% if the temperature is at 2.5 standard deviations of the peak. This value of ω2 generates a function in which there is a reduction in fitness of about 50% at three standard deviations from the optimum, which is roughly coherent with the thermal curves from Anderson and Andrade (2017). Although more studies are certainly required, it is indeed expected that values of heritability h2 are usually low for temperature tolerance, and here we used values randomly sampled from 0.2 and 0.4 (see Cotto et al., 2017; Diamond, 2017). We set B ranging from 1.1 to 1.25, and b is thus the proportion of variance related to the expected rate of environmental change of the species (i.e., the variance of tolerance).
We set a limit for b to range from 0 to 0.25. However, results for MSERp should be interpreted with caution, as the increasing b would allow a much more optimistic scenario in terms of evolutionary rescue. As we lack accurate estimates of genetic and demographic parameters for all amphibians, we used intervals of these parameters to approximate the distribution of MSERp (by randomly sampling 1,000 times, see Table 1 to see the ranges for each parameter). Thus, we evaluated the potential of the evolutionary rescue of the populations, assuming that if H < MSERp in more than 95% of the simulations, that population would be rescued. In contrast, local extinctions would happen if H < MSERp in <5% of the simulations.
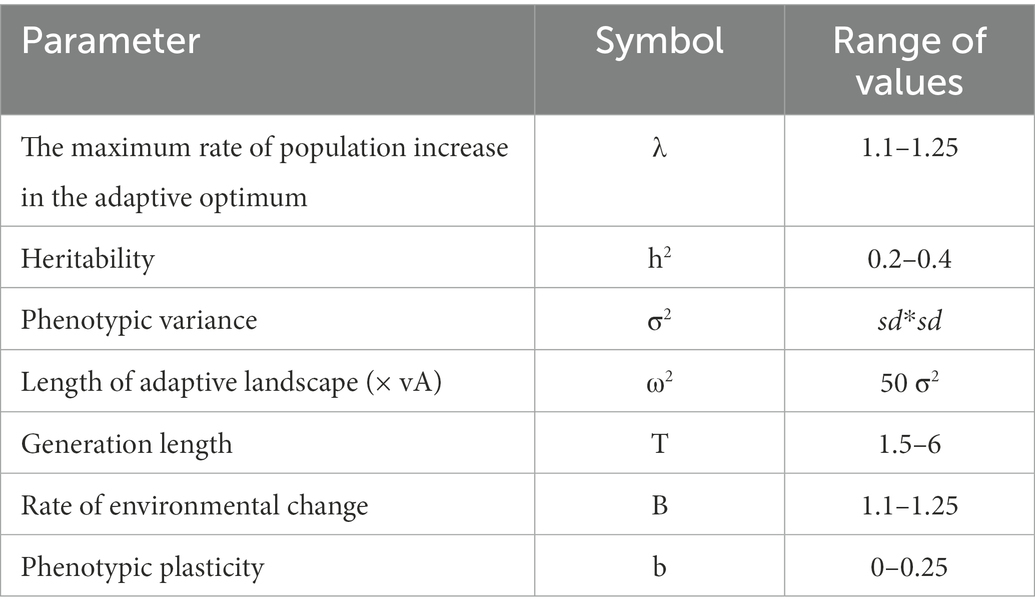
Table 1. Population and genetics parameters used in the eco-evolutionary model for evolutionary rescue and adaptation in amphibians of the world.
2.3. Leading edge - expansion by dispersion
We defined the leading edge of each species by allowing dispersal to neighboring cells with adequate temperature conditions (Bio8), similar elevation, and within the same biomes (i.e., see Olson et al., 2001 for definition) as currently occupied by the species. As a constraint in this process, the species can expand their total geographic range up to a number of cells equal to the original range size. In other words, dispersal is more likely to happen in cells that are more similar to the population’s environmental conditions. This analysis assumed dispersal toward regions where the species is already adapted (i.e., within the current species’ tolerance) and that are physically accessible.
2.4. Range size, richness and turnover
We estimated the proportion of change in the species’ geographic range size (gain or loss). Then, we verified whether this change differs between two groups of the species; Threatened (Critically Endangered - CR, Endangered - EN and Vulnerable - VU) and Not Threatened (Near Threatened - NT, Least Concern - LC) (IUCN, 2021) using the t-test. We compared the observed t value between the two groups with the distribution of sampled t values, dividing the range changes randomly between two groups of the same size as the original groups. For the species DD and NE, we calculate their change in range size and assess whether in the future they will be extinct, threatened, or not threatened. We also tested the phylogenetic signal of geographic range loss using Blomberg’sK statistics (Blomberg et al., 2003) with phylosig function of the phytools package (Revell, 2011).
We generated a map of amphibian richness in the future, detecting areas of loss and gain in species richness under the alternative scenarios defined for each species’ trailing and leading edges. To this end, we assume that (1) the species remain in their suitable environments within the temperature range in which they already exist, keeping thus the stable region for temperature only; (2) species can disperse, with some restrictions, to new favorable regions, gaining new areas and forming the leading edge; (3) populations can adapt to new conditions through the evolutionary process of rescue on the trailing edge (Valladares et al., 2014; King et al., 2018); (4) populations on the trailing edge may not adapt, and the species loses range area; or yet (5) no population adapts, and the species may become extinct (Urban, 2015).
To evaluate the temporal change in community composition (beta diversity) from the current to the future, we calculated the Sørensen dissimilarity index for each cell in the grid (Koleff et al., 2003). Then, we partitioned beta-diversity into the two additive components (Baselga, 2010), incorporating the true temporal turnover (i.e., without the influence of richness gradients; βsim) and richness difference (βnes) (see Almeida-Neto et al., 2012). In the context of the temporal variation of communities, these two components reflect (i) the replacement of some species by others over time (βsim) and (ii) the loss or gain of species over time (βnes). These analyses were performed using the betapart package (Baselga and David, 2012; Baselga et al., 2018) for R (R Core Team, 2018).
All analyses and simulations were performed in the R version 4.2.1 software (R Core Team, 2018).
3. Results
From the present to the future, the range of 996 species (13.8%) remained the same (whether by stability, expansion, or adaptation; see Figure 2 and Table 2). When allowing for dispersal, 3,579 species (49.7%) showed range expansion. On the trailing edge, 1,846 species (25.7%) had a high probability of evolutionary rescue, with 4.2% of species persisting (i.e., avoiding extinction) exclusively due to adaptation. By incorporating dispersal toward the leading edge and evolutionary rescue in the trailing edge, our results showed a geographic range loss for 5,154 species (71.5%), the extinction of 2,625 species (36.5%), and a range increase for 783 species (10.8%). The species range patterns of gain or loss were not phylogenetically structured (Blomberg’s K = 0.0039; p = 0.961), indicating no evolutionary predisposition to range change. Of the 2,327 species considered threatened, 52% are expected to go extinct, while only 13.5% are expected to go extinct among the 3,456 species considered non-threatened, showing trends significantly distinct (t = 18.418, p < 0.001). However, of the 1,410 species with unassessed extinction risk, 60.5% are expected to go extinct, and 27.9% should be threatened in the future (by IUCN criterion B1: geographic area equal to or <20000 km2, two cells in our case).
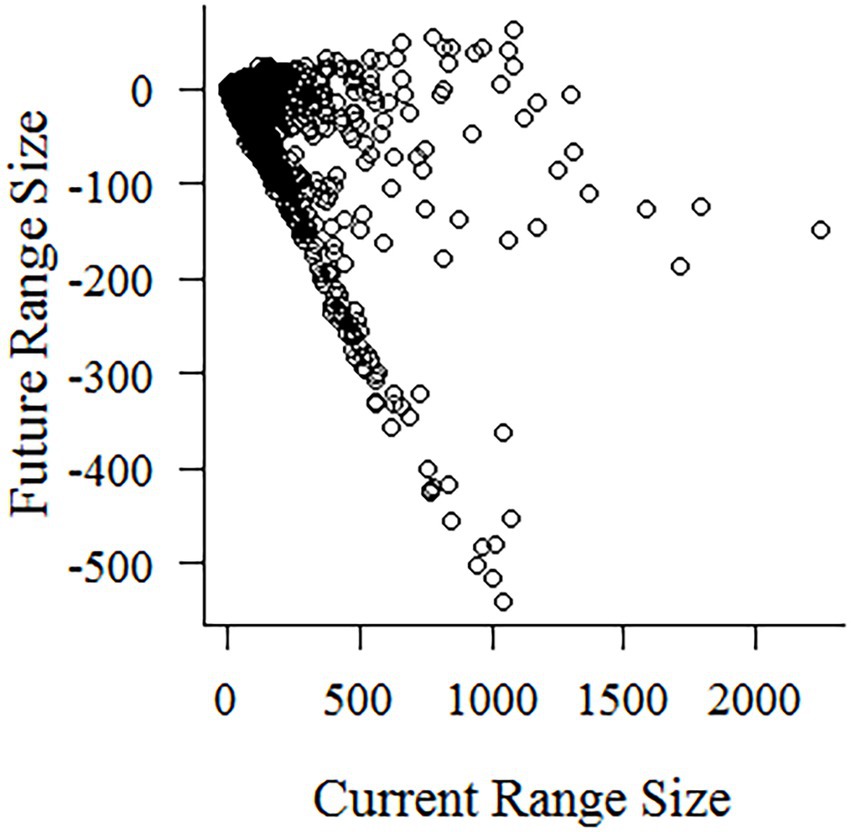
Figure 2. Changes in species’ range size in cell numbers, ranging from 540 losses to 63 gains.
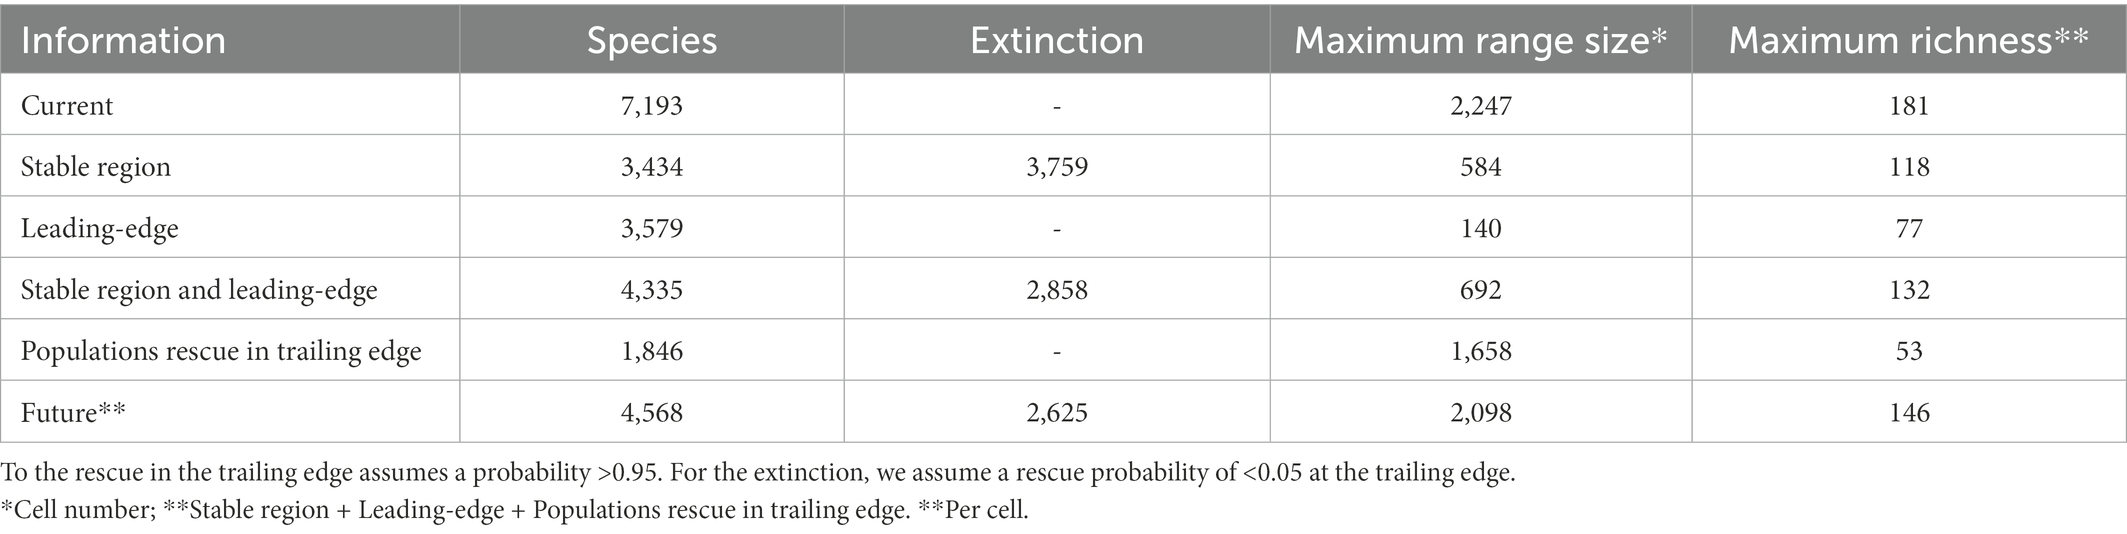
Table 2. For amphibian species, range size and richness, in the present, future, and its climatic parts (stable region, leading-edge, and trailing edge).
Although range expansion increased the species richness in an area of 19.3% of the global amphibian range, species richness generally decreased (Figure 3). The richness of the lower diversity areas tended to increase slightly due to range expansion. Conversely, richer areas can lose up to 60% of the species (Figure 4A). There is a wide variation in the proportion of gains and losses between places with similar species richness. Areas with currently fewer species tend to gain more richness than areas with currently high richness. The loss in a hotspot with 165 species can reach up to 95 species (57.6%). Proportionately, the richest areas were the ones that lost the most species. In the future, in climatically stable regions (Figure 4B), the global change effect in amphibian richness will cause the extinction of 3,759 species (52.3%; see Table 1 and Figure 5A). When we include dispersal alone (Figure 4C) or in association with the adaptation process (Figure 4D), the richness pattern is partially maintained, or the losses are partially lessened. In the scenario with both adaptation and dispersal (Figure 4D), the extinction is reduced to 2,625 species (36.5%). Although more species disperse than adapt, in relation to the spatial distribution of these mechanisms, the expansion was restricted to 44% of the amphibian domain (Figure 5B). In comparison, a potential for adaptation occurred in 85% of this area (Figure 5C). The estimated temporal beta diversity, in general, showed wide variation across the world (mean = 0.17, sd = 0.24). For the whole amphibian domain, 39% of the area remained unchanged, with no dissimilarity between times (βsor = 0), mostly concentrated in the northern, temperate region (Figure 6). Only 3% of cells had their composition altered purely by turnover (βnes = 0), whereas richness difference is responsible for the composition change of 36% of the amphibian global domain (βsim = 0). The remaining 33% of the world’s amphibian domain will have their compositional change influenced simultaneously by turnover (βsim) and the richness difference (βnes). The patterns of beta diversity were almost entirely driven by differences of richness between current and future conditions (Figure 6C). Amphibian composition was more temporally stable (lower β diversity) in the northern hemisphere (mostly temperate) than in the southern hemisphere (mostly tropical).
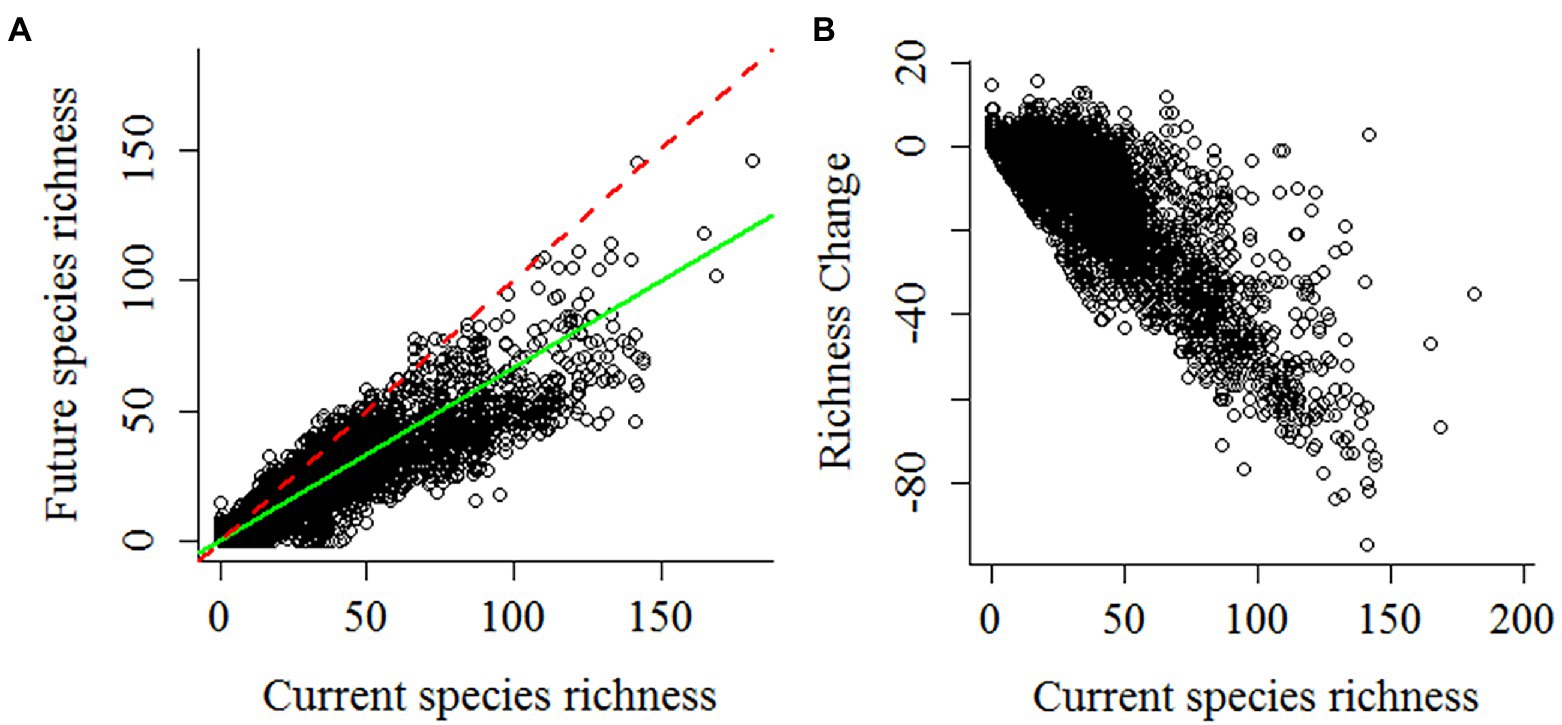
Figure 3. (A) Relationship between current and future richness. Red dashed line (intercept = 0 and slope = 1). Green solid line (intercept = 0; richness = 0.615). (B) change in richness with losses and gains in number of species.
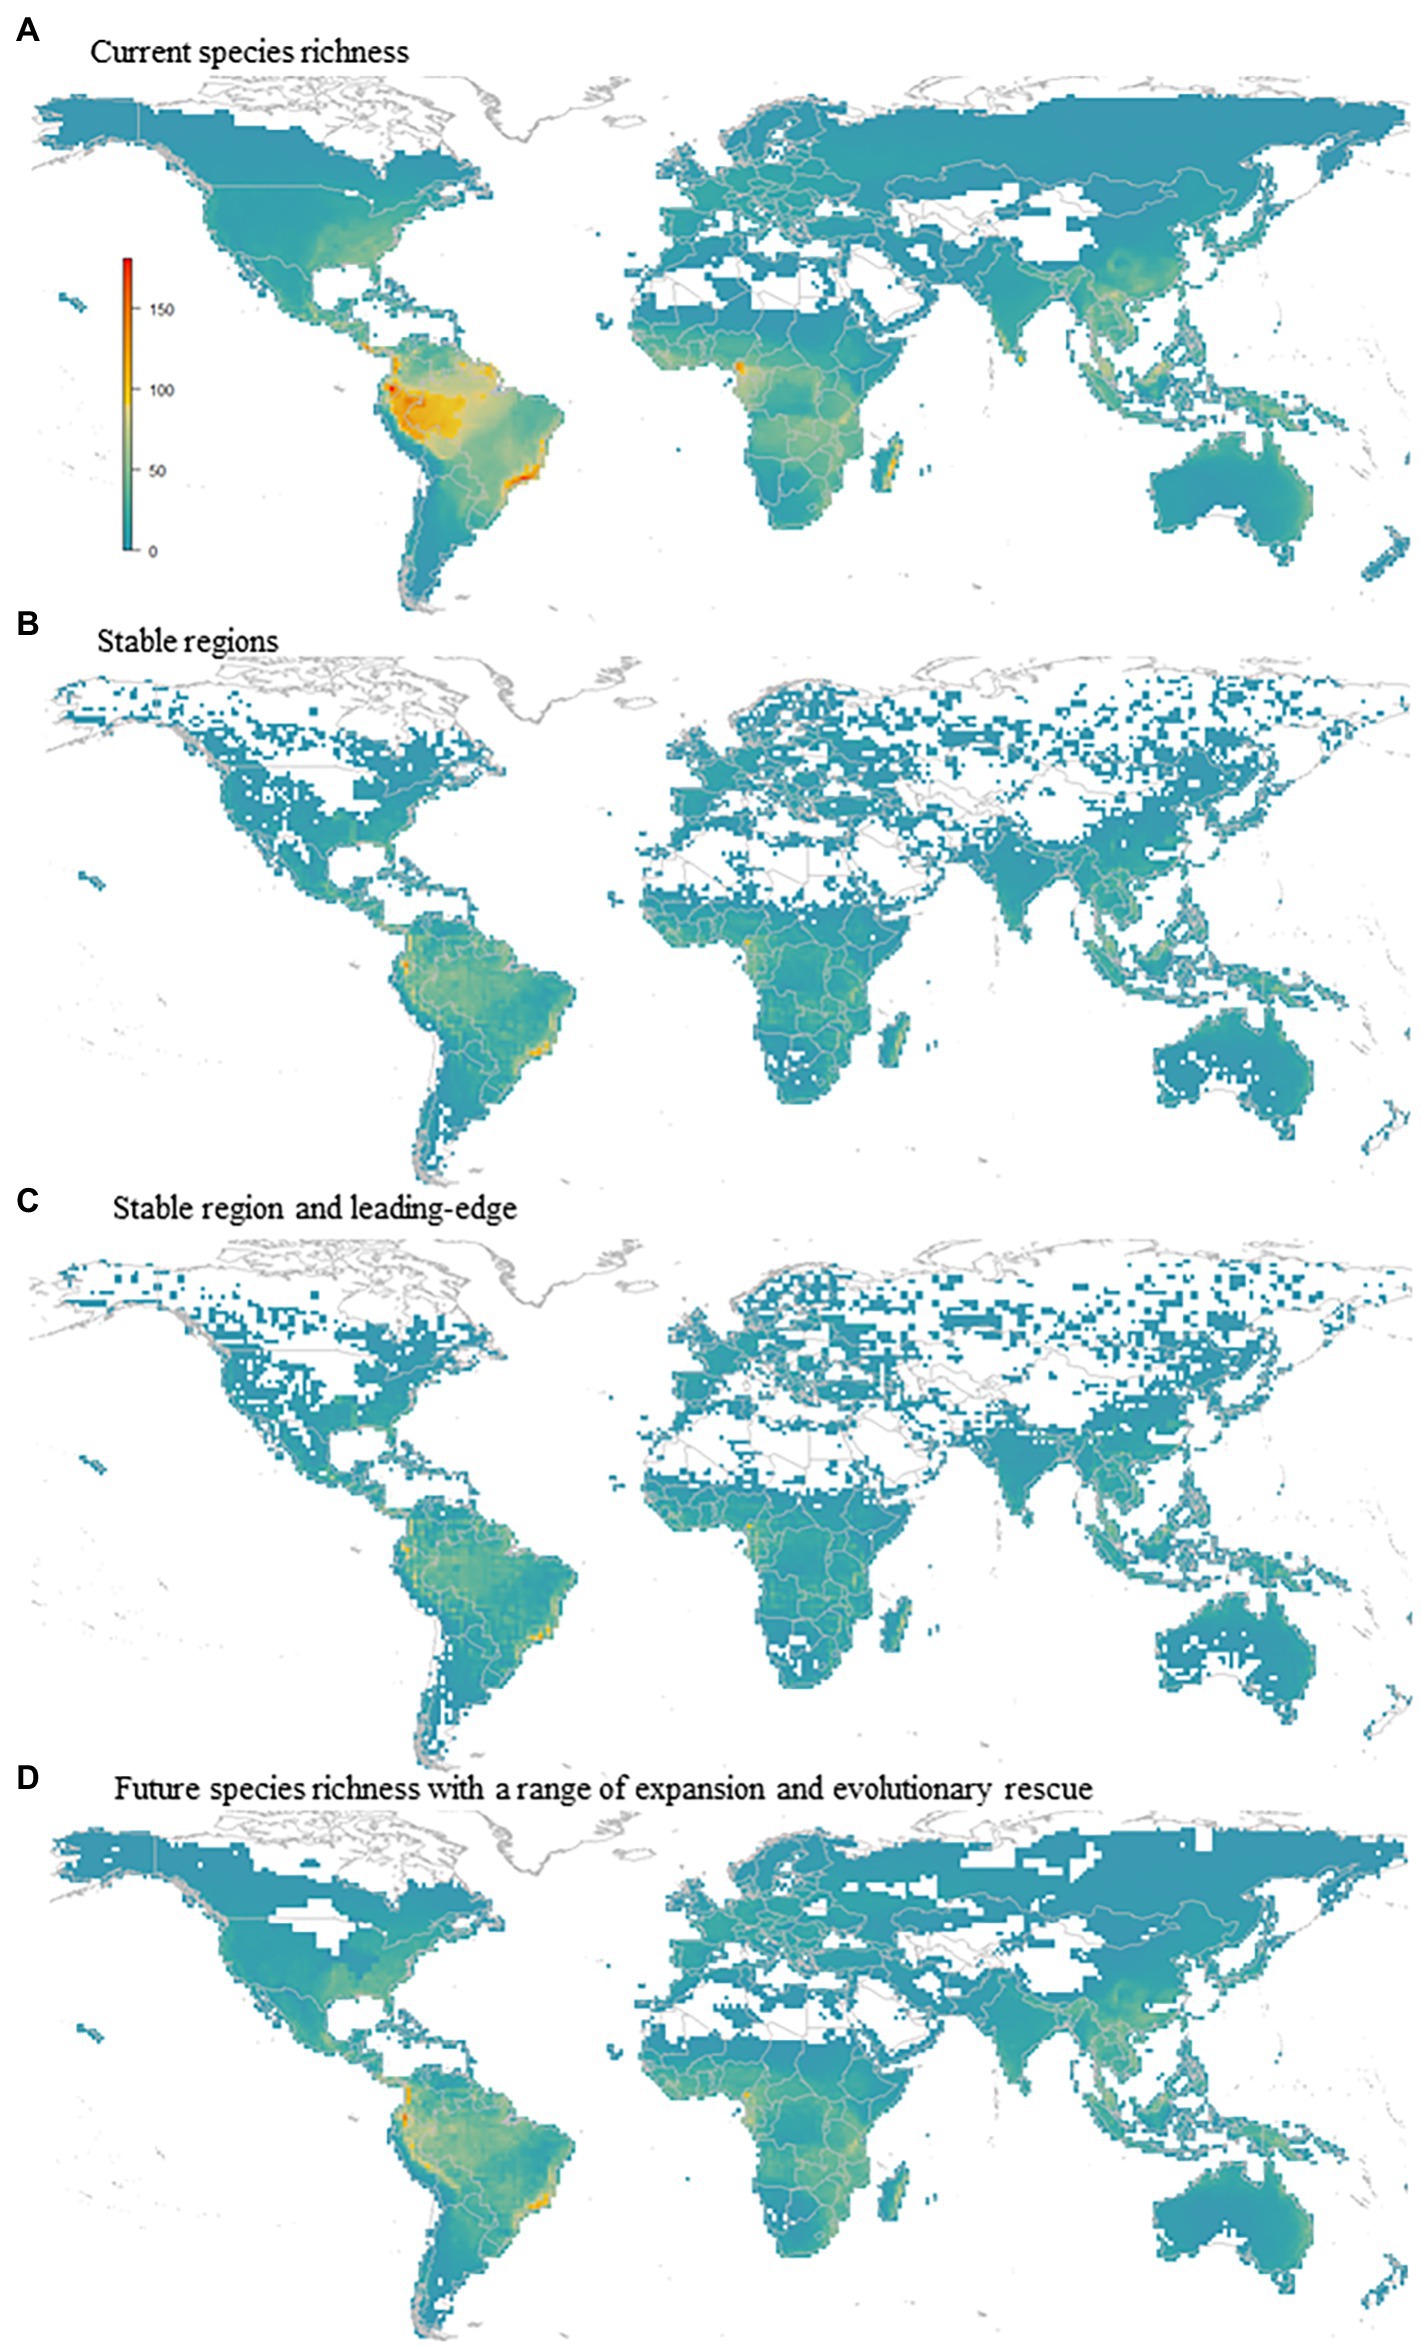
Figure 4. Global amphibian diversity pattern (A) Current species richness (max. 181 spp. per pixel); (B) Stable region (max. 118 ssp.); (C) Stable region and leading-edge, max 132; and (D) Future species richness with a range of expansion and evolutionary rescue, max 146.
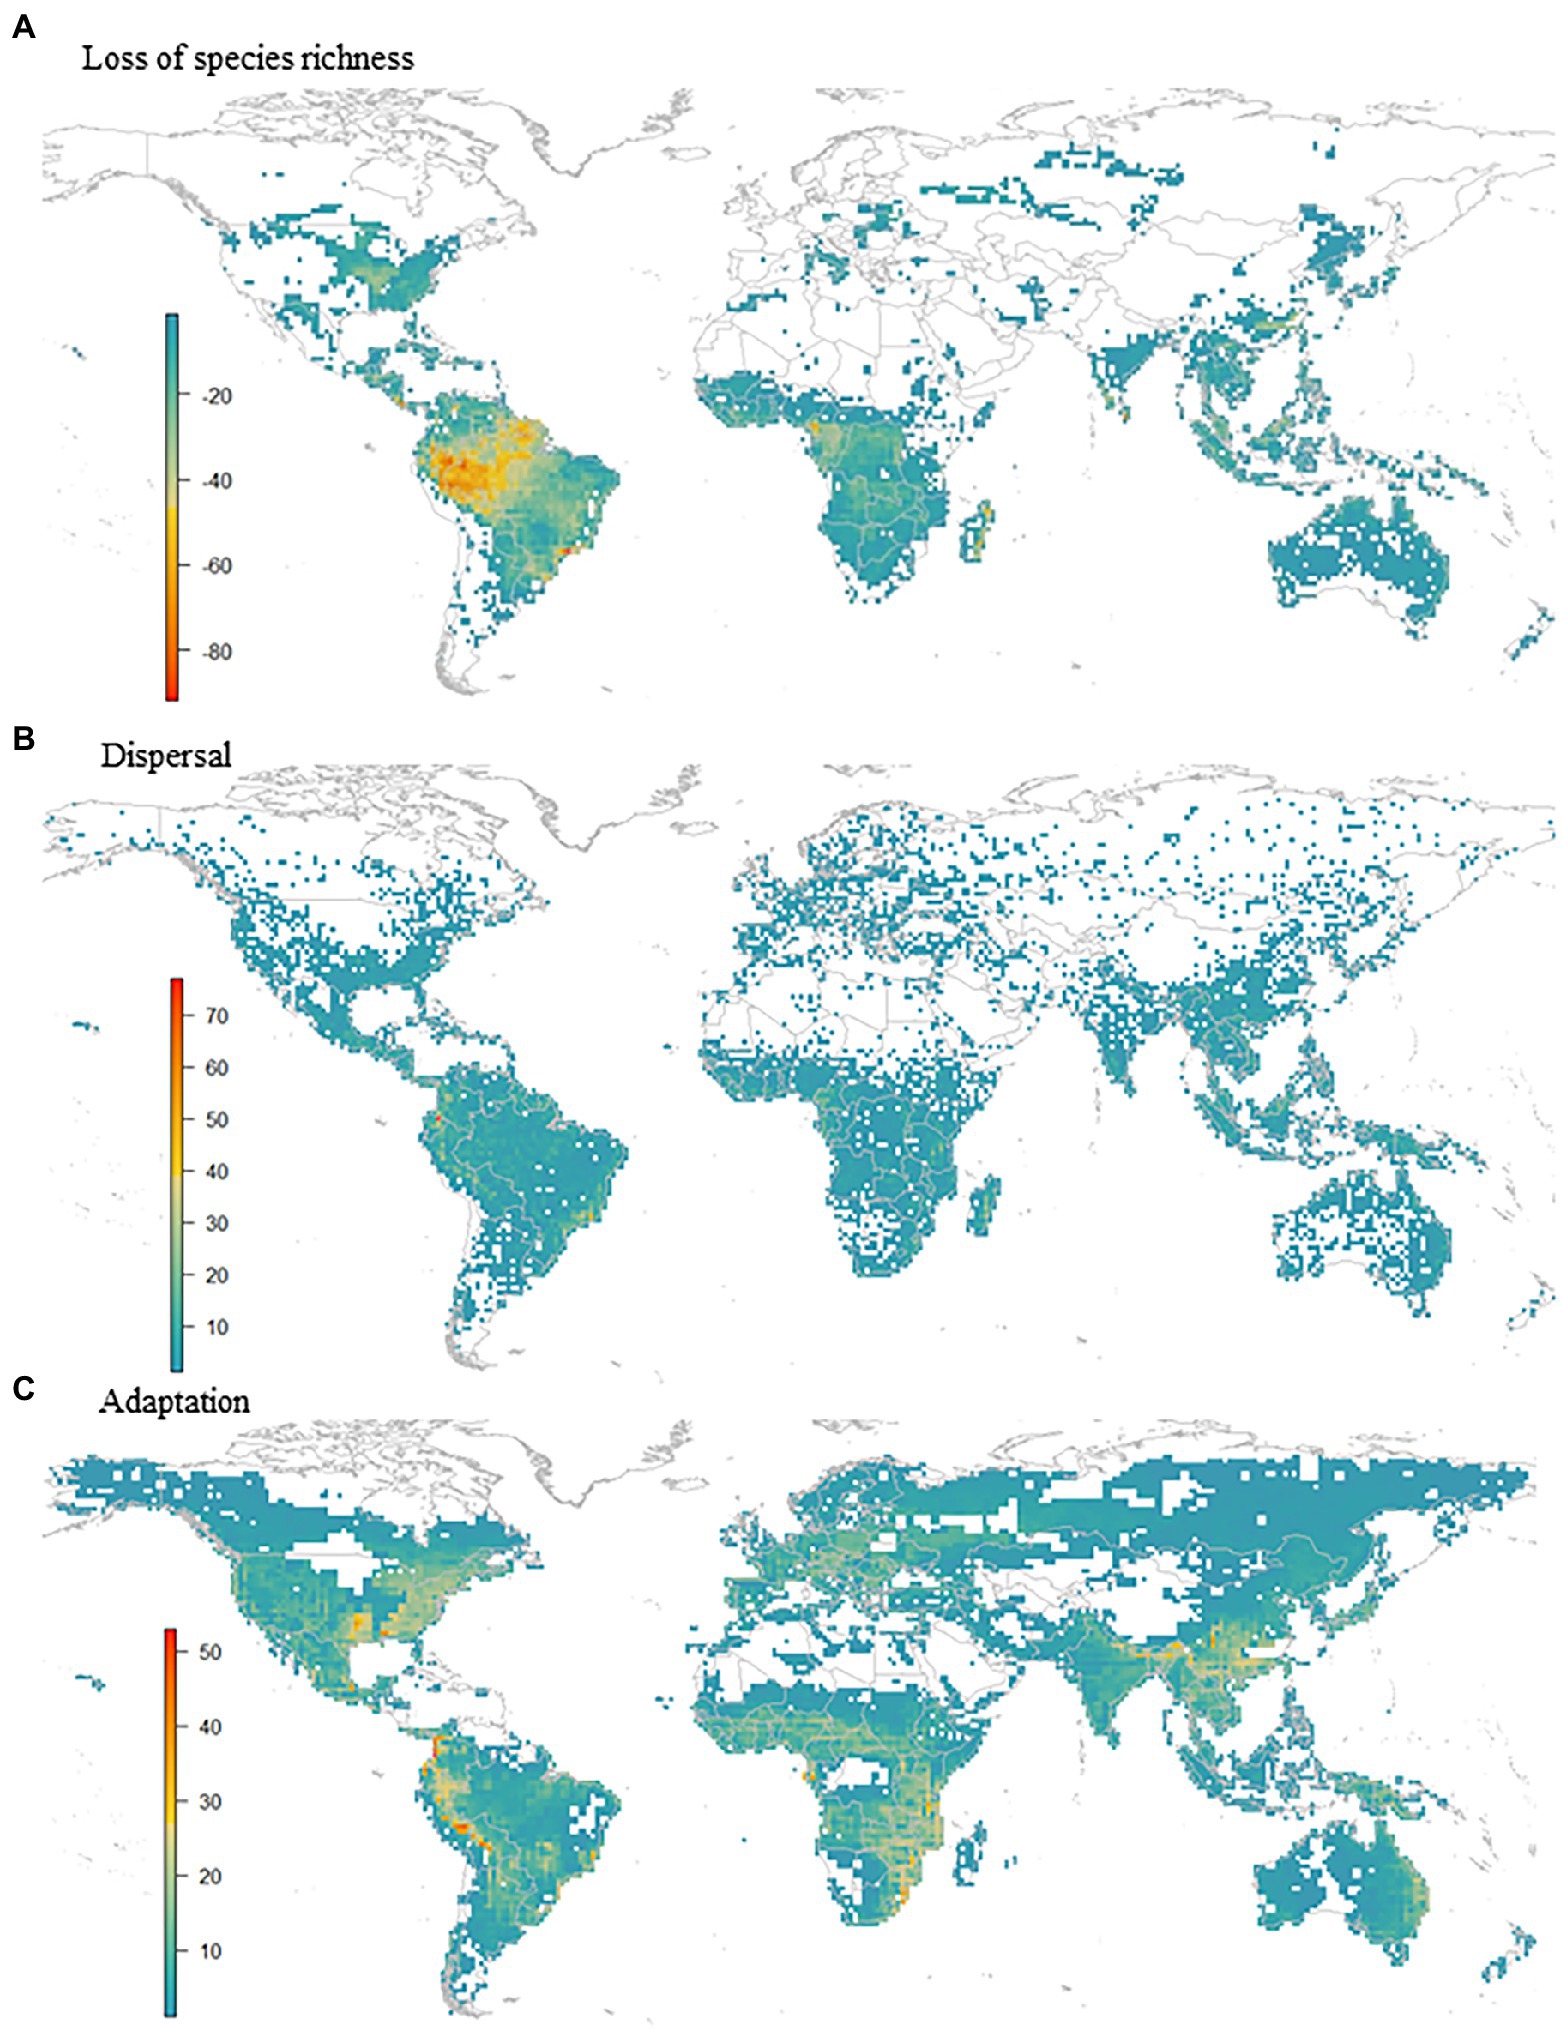
Figure 5. Global pattern of (A) loss of species richness, (B) dispersal and (C) adaptation.
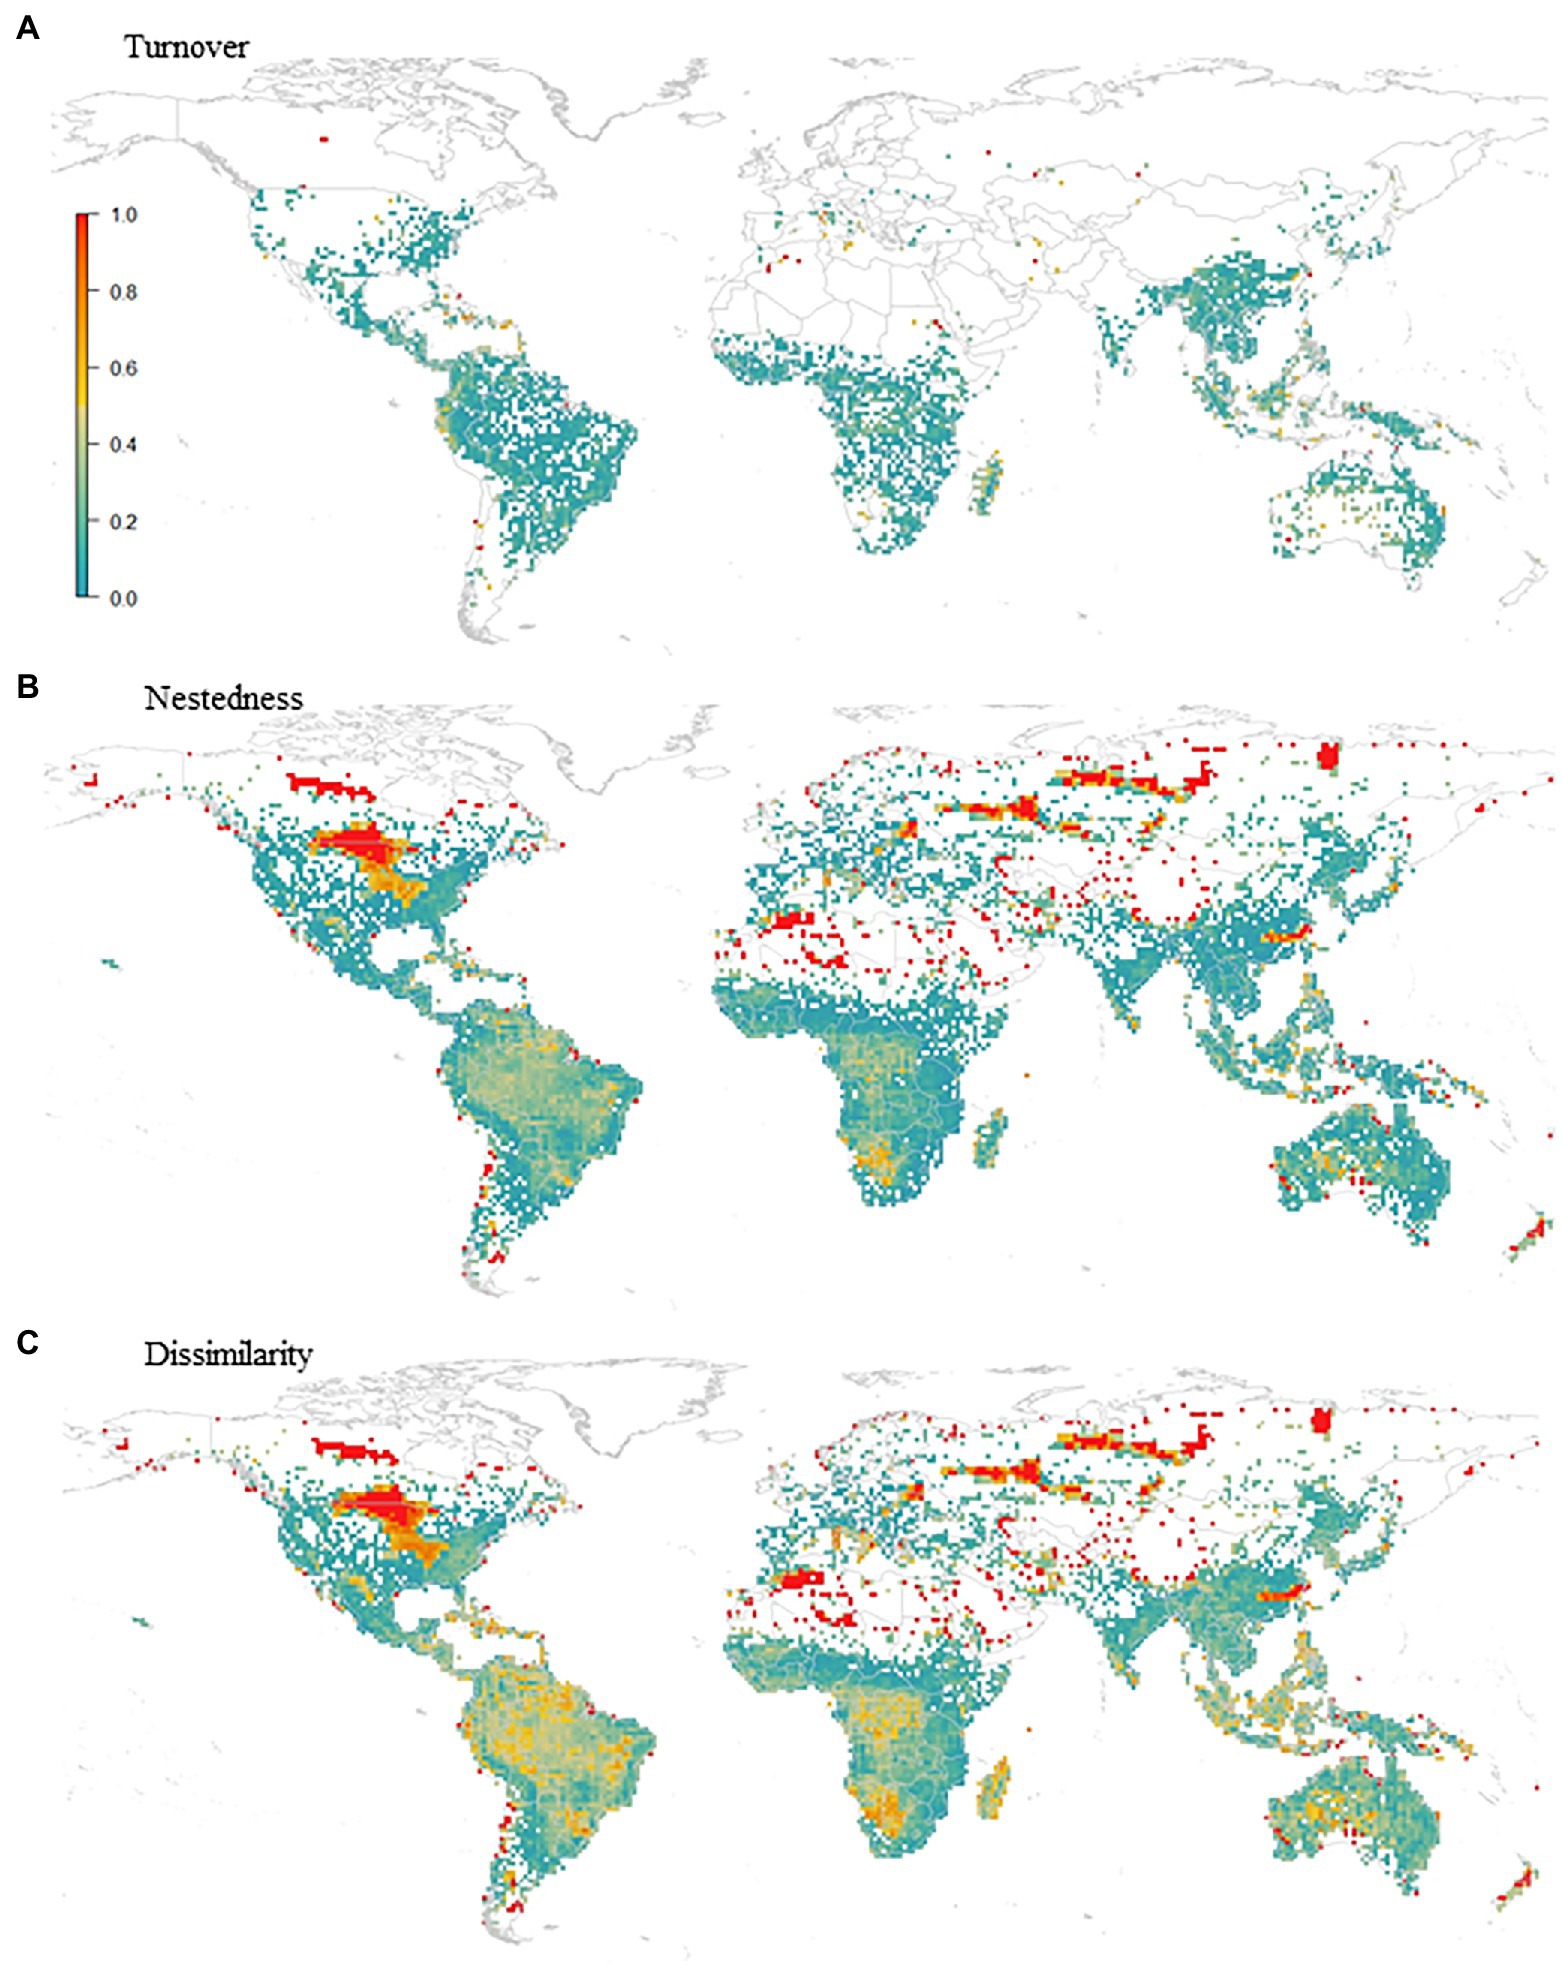
Figure 6. Temporal beta. Performance of (A) turnover - βsim, (B) nestedness - βsne and (C) dissimilarity - βsor, with βsim and βsne varying between βsor and 0. All variables are mutually dependent as βsor = βsim + βsne.
4. Discussion
Our analyses evaluated the impact of climate change on the geographic distribution and resulting diversity patterns of amphibians worldwide, based on species’ traits (body size and range size) and their phylogenetic relationships as indicators of adaptive potential, while also considering climate stability, species’ dispersal capacity, and the possibility of genetic adaptation (including the effects of phenotypic plasticity) for their maintenance at the population level. In doing so, we demonstrated how climate change may affect amphibian global distribution and diversity.
According to our findings, for nearly half of the species, persistence would only be possible through adapting to the new environmental conditions or dispersing to new areas. On the trailing-edge scenario – under environmental stress – adaptive processes can trigger the evolutionary rescue of populations and thus minimize species’ extinction risk (Visser, 2008; Bell and Gonzalez, 2009; Bell, 2013, 2017; Gonzalez et al., 2013; Lindsey et al., 2013; Carlson et al., 2014; Diniz-Filho et al., 2019; Souza et al., 2019). Only one-fourth of species showed adaptive potential and some possibility of evolutionary rescue. So, the changes in temperature within the current species ranges under the CCSM RCP6.0 emission scenario was too high to allow for short-term adaptation for most species. It could be expected that, under scenarios of lower global temperature rise (e.g., below 1.5°C in the case of RCP2.6) the potential for evolutionary rescue would be higher (and more species could avoid extinction). However, previous studies showed that the probability of rescue was similar between the climatic scenarios (Souza et al., 2019), so the intermediate scenario RCP6.0 (i.e., global warming likely exceeding 2°C) is representative of the potential impacts of climate change on amphibian distribution, in addiction of being considered the most plausible scenario for global warming throughout this century (Capellán-Pérez et al., 2016; Ritchie and Dowlatabadi, 2017; Hausfather and Peters, 2020). Despite this, even for a few species, these adaptive responses to the new environmental conditions represent niche evolution, thus reinforcing the importance of not assuming niche conservatism in short periods of time. These findings are consistent with other studies on evolutionary rescue, which also points to the evolution of the niche (Carlson et al., 2014; Bush et al., 2016; Diniz-Filho et al., 2019). Moreover, it is essential to pay attention to the regions where evolutionary rescue is unlikely – i.e., areas where extinction risk is high (Figure 5A) – and where rescue is the only possibility for population persistence (Figure 5B) and species survival.
Our macroecological approach represents one of the first evaluations of global patterns of species’ geographic range shifts considering the potential evolutionary rescue and dispersal front of the threats posed by climate change. We hope that more specifics future work with species distribution modeling and delimitation of priority areas for conservation include eco-evolutionary models in their evaluations, and focus on sites where species possibly contain enough genetic variability to sustain and progress, even under anthropogenic pressure. This is of course not an easy task, as it requires obtaining more data for a more representative sample of species, providing a better estimate of several parameters to feed integrative models in population and quantitative genetics and ecophysiology (Diniz-Filho et al., 2019; Souza et al., 2019). It is important to point out that the ecological significance of these results depends on several assumptions about the way haldanes and MSER are calculated. Here, we opt for the univariate analysis for the adaptation of amphibians to climate change based on Diniz-Filho et al. (2019), which found similar results in univariate and multivariate analysis for the adaptation of amphibians to climate change. In addition, we consider the univariate model to simplify the first application of this method, as described in the methods section. But we emphasize that there is potential for using multivariate analyses (Chevin et al., 2010). However, using multivariate approaches might increase the uncertainty in the estimations, mostly because it requires the input of many more parameters, making it difficult to interpret the events (Blows, 2007). Therefore, we must view these multivariate applications with caution. Moreover, future studies must consider sensitivity analyses to tease apart the specific and combinatory effects of different environmental variables on population growth and maintenance of species in space and time. In this study, we focused on testing the effect of the mean temperature of the wettest quarter (Bio8) under the scenario RCP6.0, as it is the most likely to happen in the future (Capellán-Pérez et al., 2016; Ritchie and Dowlatabadi, 2017). We must warn that in case of the scenario get worse due to the energy crisis, the impacts on amphibians will be even more catastrophic (see Diniz-Filho et al., 2019; Souza et al., 2019). Thus, the effects of microhabitats (and microclimates) are essential as a buffer against the environmental effects of global warming (Enriquez-Urzelai et al., 2020). However, these effects will occur throughout the species’ ranges, and analyzing them would require an entirely different perspective in other scales of geographic range. Even without using a multivariate model, we do not rule out the interaction of variables. In fact, the inclusion of the precipitation of the wettest quarter (Bio16) in the calculation of haldanes improved our model prediction. Nonetheless, with future changes in the precipitation regimes, the likelihood of extinction may be overestimated, especially in areas where the future will be wetter than the present. Conversely, in areas with future decreases in precipitation (worst-case scenario), extinction rates should be estimated more accurately. Thus, we may be alarmist in areas with increased rainfall in the future.The ability to disperse and track changing climatic conditions can be directly related to a species’ degree of climatic equilibrium (Araújo and Pearson, 2005). Amphibians are usually not in equilibrium with the current climate (occupying an average of 30 to 57% of their potential distributions, see Munguía et al., 2012). Here, we found that dispersal is likely for 46% of the amphibian species, with some species not having new adjacent areas with favorable conditions to move (Araújo and Pearson, 2005). For the other species with climatic conditions that allow dispersal, one should still be cautious as our results are based on data at a coarse resolution and a broad spatial scale. For example, dispersal may be overestimated for species with small range sizes, which in our study, tend to gain proportionally more area by dispersal. In addition, displacement and accessibility could be even more restricted if we consider anthropogenic changes in the landscape on a smaller scale with geographic barriers to dispersal, further limiting species’ range expansion (García-Rodríguez et al., 2021). The expansion of human populations, transportation routes (e.g., highways, canals, railroads) and agricultural areas will inevitably continue to reduce and fragment natural areas. This degradation, destruction, and fragmentation limit the availability of favorable habitats to natural species, reducing the populations size and making it difficult to disperse to new habitats, severely increasing extinction risk (Haddad et al., 2015). Environmental constraints can trigger adaptations for more efficient dispersal or related to other non-selective climate factors, such as those due to new biotic interactions, as already assessed for invasive species (e.g., Broennimann et al., 2007; Villemant et al., 2011). At the same time, our analyses are likely underestimating the dispersal distance (100 km in 100 years), for some species that can disperse much faster than we suggested. A classic example from biological invasion literature is precisely an amphibian, Rhinella marina. This South American species is invasive in Australia, where it has evolved its ability to disperse from 10 km per year in the 1940s to 50 km per year in the 2000s (Phillips et al., 2006). Although range expansion may seem a positive answer, gambling on species conservation through dispersal may be misplaced. When occupying new areas, species can take part in new interspecific biotic interactions, including positive (mutualist, resources) and negative ones (competitive, predation, vectors for parasites or pathogens). The negative interactions can accelerate the range reduction and extinction of some species (Jones and Gomulkiewicz, 2012).
Our results corroborate the species extinction risk alert for amphibians (IUCN, 2021), that predicts that at least 52% of the species to be at a high risk of extinction by the end of this century. In addition, under the IUCN’s restricted distribution criterion, of the amphibian species unassessed in IUCN red list (DD and NE) over 60.6% will likely go be extinct and 27.9% should will be threatened in the future. Temporal variation in diversity patterns may result from abrupt changes such as the current global climate change (Legendre, 2019). In this study, the difference in species composition was driven by both species turnover (βsim) and the change in species richness (βnes), with the former accounting for the higher temporal dissimilarity. Spatial turnover implies the replacement of some species by others, here, as a consequence of dispersal. Widespread throughout the overall amphibian domain, the richness difference (βnes) occurred when the future biota are subsets of the present biota, reflecting the process of loss or gain of species due to climate change (Gaston and Blackburn, 2000; Baselga, 2010).
This study advances earlier attempts to incorporate evolutionary rescue in macroecological analyses (Diniz-Filho et al., 2019; Diniz-Filho and Bini, 2019; Souza et al., 2019), applied to Amphibia, a speciose, genetically and ecologically diverse group (Zurell et al., 2020; Taheri et al., 2021). Although we found adaptive potential in some amphibian populations, for most species this ability is not enough to deal with climate change in such a short time. However, detecting this potential and the geographical distribution of these populations gives us valuable tool to deal with the process of species extinction Although various sources of uncertainty are explicitly incorporated into our estimates of future species distribution, we need more studies at finer scales with high-quality data toproduce results that are relevant for policy makers and practitioners at the local and regional scale where conservation management takes place. In addition, the generality of our results need to be evaluated across other taxa and dimensions of diversity (e.g., ectothermic animals, functional and phylogenetic diversity). The phenotypic characterization of species using quantitative genetics using variables that captures distinct physiological processes driving species’ responses to climate change, as well as accurate information of dispersal capacity, is essential to achieve reliable ecological results for the systematic planning of biodiversity conservation.
Data availability statement
The datasets presented in this study can be found in online repositories. The names of the repository/repositories and accession number(s) can be found at: https://github.com/Kelly-Souza/Evolutionary-rescue.
Author contributions
KS: conceptualization, data curation, formal analysis, software—improvement of simulation routines, investigation, methodology, visualization, elaboration of figures and table, writing—original draft. DF: conceptualization, formal data analyses, software—improvement of simulation routines, investigation, methodology, writing—first draft. LJ: formal data analyses. LT: conceptualization, writing—review and editing. ML-R conceptualization, writing—review and editing. JP-L validation, visualization, methodology, writing—review and editing. CM: data search and organization, formal data analyses. MB: conceptualization, writing—review and editing. RL conceptualization, writing—review and editing. RD: conceptualization, data search, and organization, writing—review and editing. TRa conceptualization, writing—review and editing. IM: conceptualization, data search, and organization, writing—review and editing. TRo conceptualization, data search, and organization, writing—review and editing. MB: data search and organization, writing—review and editing. ML: conceptualization, writing—review and editing. MV: conceptualization, writing—review and editing. CN: conceptualization, writing—review and editing. NM: conceptualization, writing—review and editing. FV conceptualization, writing—review and editing. MO-T conceptualization, writing—review and editing. JR: conceptualization, writing—review and editing. SG: conceptualization, investigation, methodology, validation, writing—review and editing. JD-F conceptualization, funding acquisition, investigation, methodology, project administration, resources, software, supervision, validation, writing—review and editing. All authors contributed to the article and approved the submitted version.
Funding
This paper results from a working group on “Evolutionary Rescue” promoted by National Institute for Science and Technology (INCT) in Ecology, Evolution and Biodiversity Conservation, supported by MCTIC/CNPq (proc. 465610/2014-5) and FAPEG (proc. 201810267000023aq). JPL was supported by the US National Science Foundation (DEB 2017843 to JPL) and the University of Minnesota President’s Postdoctoral Fellowship Program. JAFDF, RL, RDL, RD, MMV, TFR, CAN, SFG, NMM, LCT receive Productivity in ResearchFellowshipsfrom Conselho Nacional de Desenvolvimento Científico e Tecnológico do Brasil (CNPq). KSS, DF, LJ, JFMR, TR received INCT fellowships, CAM received CNPq fellowship, and KSS, MCGB received CAPES Doctoral or Master fellowships during the realization of this work.
Acknowledgments
We thank Luis Maurício Bini for suggestions and discussion that helped us improve the framework presented here, especially during the Workshop “Evolutionary Rescue” of INCT-EECBio in early 2018, Goiânia, Brasil.
Conflict of interest
The authors declare that the research was conducted in the absence of any commercial or financial relationships that could be construed as a potential conflict of interest.
Publisher’s note
All claims expressed in this article are solely those of the authors and do not necessarily represent those of their affiliated organizations, or those of the publisher, the editors and the reviewers. Any product that may be evaluated in this article, or claim that may be made by its manufacturer, is not guaranteed or endorsed by the publisher.
Supplementary material
The Supplementary material for this article can be found online at: https://www.frontiersin.org/articles/10.3389/fevo.2023.1038018/full#supplementary-material
Footnotes
References
Almeida-Neto, M., Frensel, D. M. B., and Ulrich, W. (2012). Rethinking the relationship between nestedness and beta diversity: a comment on Baselga (2010). Glob. Ecol. Biogeogr. 21, 772–777. doi: 10.1111/j.1466-8238.2011.00709.x
Alroy, J. (2015). Current extinction rates of reptiles and amphibians. Proc. Natl. Acad. Sci. U. S. A. 112, 13003–13008. doi: 10.1073/pnas.1508681112
Anderson, R. C. O., and Andrade, D. V. (2017). Trading heat and hops for water: dehydration effects on locomotor performance, thermal limits and thermoregulatory behavior of a terrestrial toad. Ecol. Evol. 7, 9066–9075. doi: 10.1002/ece3.3219
Araújo, M. B., Anderson, R. P., Barbosa, M. A., Beale, C. M., Dormann, C. F., Regan, E., et al. (2019). Standards for distribution models in biodiversity assessments. Science. Advances 5:eaat4858. doi: 10.1126/sciadv.aat4858
Araújo, M. B., and Pearson, R. G. (2005). Equilibrium of species’ distributions with climate. Ecography 28, 693–695. doi: 10.1111/j.2005.09067590.04253.x
Araújo, M. B., and Peterson, A. T. (2012). Uses and misuses of bioclimatic envelope modeling. Ecology 93, 1527–1539. doi: 10.1890/111930.1
Bartoszek, K., Glémin, S., Kaj, I., and Lascoux, M. (2017). Using the Ornstein–Uhlenbeck process to model the evolution of interacting populations. J. Theor. Biol. 429, 35–45. doi: 10.1016/j.jtbi.2017.06.011
Baselga, A. (2010). Partitioning the turnover and nestedness components of beta diversity. Glob. Ecol. Biogeogr. 19, 134–143. doi: 10.1111/j.1466-8238.2009.00490.x
Baselga, A., and David, C. (2012). Betapart: an R package for the study of beta diversity. Methods Ecol. Evol. 3, 808–812. doi: 10.1111/j.2041210X.2012.00224.x
Baselga, A., Orme, D., Villéger, S., De Bortoli, J., Leprieur, F., Logez, M., et al. (2018). Partitioning beta diversity into turnover and nestedness components. Package `betapart’. Version, 1.
Beebee, T., and Griffiths, R. (2005). Beebee TJC, Griffiths RA. The amphibian decline crisis: a watershed for conservation biology? Biol. Conserv. 125, 271–285. doi: 10.1016/j.biocon.2005.04.009
Bell, G. (2013). Evolutionary rescue and the limits of adaptation. Philos. Trans. R. Soc. Lond. B. Biol. Sci. 368:20120080. doi: 10.1098/rstb.2012.0080
Bell, G. (2017). Evolutionary rescue. Annu. Rev. Ecol. Evol. Syst. 48, 605–627. doi: 10.1146/annurevecolsys110316023011
Bell, G., and Gonzalez, A. (2009). Evolutionary rescue can prevent extinction following environmental change. Ecol. Lett. 12, 942–948. doi: 10.1111/j.14610248.2009.01350.x
Blomberg, S. P., Garland, T., and Ives, A. R. (2003). Testing for phylogenetic signal in comparative data: behavioral traits are more labile. Evolution 57, 717–745. doi: 10.1111/j.00143820.2003.tb00285.x
Blows, M. W. (2007). Complexity for complexity's sake? J. Evol. Biol. 20, 39–44. doi: 10.1111/j.1420-9101.2006.01241.x
Broennimann, O., Treier, U. A., MüllerSchärer, H., Thuiller, W., Peterson, A. T., and Guisan, A. (2007). Evidence of climatic niche shift during biological invasion. Ecol. Lett. 10, 701–709. doi: 10.1111/j.14610248.2007.01060.x
Bush, A., Mokany, K., Catullo, R., Hoffmann, A., Kellermann, V., Sgrò, C., et al. (2016). Incorporating evolutionary adaptation in species distribution modelling reduces projected vulnerability to climate change. Ecol. Lett. 19, 1468–1478. doi: 10.1111/ele.12696
Capellán-Pérez, I., Arto, I., Polanco-Martínez, J. M., González-Eguino, M., and Neumann, M. B. (2016). Likelihood of climate change pathways under uncertainty on fossil fuel resource availability. Energy Environ. Sci. 9, 2482–2496. doi: 10.1039/C6EE01008C
Caplat, P., Edelaar, P., Dudaniec, R. Y., Green, A. J., Okamura, B., Cote, J., et al. (2016). Looking beyond the mountain: dispersal barriers in a changing world. Front. Ecol. Environ. 14, 261–268. doi: 10.1002/fee.1280
Carlson, S. M., Cunningham, C. J., and Westley, P. A. H. (2014). Evolutionary rescue in a changing world. Trends Ecol. Evol. 29, 521–530. doi: 10.1016/j.tree.2014.06.005
Ceballos, G., Ehrlich, P. R., and Raven, P. H. (2020). Vertebrates on the brink as indicators of biological annihilation and the sixth mass extinction. Proc. Natl. Acad. Sci. U. S. A. 117, 13596–13602. doi: 10.1073/pnas.1922686117
Chen, I., Hill, J. K., Ohlemüller, R., Roy, D. B., and Thomas, C. D. (2011). Rapid range shifts of species associated with high levels of climate warming. Science 333, 1024–1026. doi: 10.1126/science.1206432
Chevin, L., Lande, R., and Mace, G. M. (2010). Adaptation, plasticity, and extinction in a changing environment: towards a predictive theory. PLoS Biol. 8:e1000357. doi: 10.1371/journal.pbio.1000357
Collins, J.P., and Crump, M.L. (2009). Extinction in Our Times: Global Amphibian Decline. Oxford; New York: Oxford University Press.
Colwell, R. K., and Rangel, T. F. (2009). Hutchinson’s duality: the once and future niche. Proc. Natl. Acad. Sci. U. S. A. 106, 19651–19658. doi: 10.1073/pnas.0901650106
Cotto, O., Wessely, J., Georges, D., Klonner, G., Schmid, M., Dullinger, S., et al. (2017). A dynamic ecoevolutionary model predicts slow response of alpine plants to climate warming. Nat. Commun. 8:15399. doi: 10.1038/ncomms15399
Diamond, S. E. (2017). Evolutionary potential of upper thermal tolerance: biogeographic patterns and expectations under climate change. – Ann. N. Y. Acad. Sci. 1389, 5–19. doi: 10.1111/nyas.13223
Diniz-Filho, J. A. F., and Bini, L. M. (2019). Will life find a way out? Evolutionary rescue and darwinian adaptation to climate change. Perspect. Ecol. Conserv. 17, 117–121. doi: 10.1016/j.pecon.2019.06.001
Diniz-Filho, J. A. F., Souza, K. S., Bini, L. M., Loyola, R., Dobrovolski, R., Rodrigues, J. F. M., et al. (2019). A macroecological approach to evolutionary rescue and adaptation to climate change. Ecography 42, 1124–1141. doi: 10.1111/ecog.04264
Duan, R.-Y., Kong, X.-Q., Huang, M.-Y., Varela, S., and Ji, X. (2016). The potential effects of climate change on amphibian distribution, range fragmentation and turnover in China. PeerJ 4:e2185. doi: 10.7717/peerj.2185
Engler, R., Randin, C., Vittoz, P., Czaka, T., Beniston, M., Zimmermann, N., et al. (2009). Predicting future distributions of mountain plants under climate change: does dispersal capacity matter? Ecography 32, 34–45. doi: 10.1111/j.16000587.2009.05789.x
Enriquez-Urzelai, U., Tingley, R., Kearney, M. R., Sacco, M., Palacio, A. S., Tejedo, M., et al. (2020). The roles of acclimation and behaviour in buffering climate change impacts along elevational gradients. J. Anim. Ecol. 89, 1722–1734. doi: 10.1111/1365-2656.13222
Foden, W. B., Butchart, S. H., Stuart, S. N., Vié, J., Resit, A. H., Angulo, A., et al. (2013). Identifying the world’s most climate change vulnerable species: a systematic trait-based assessment of all birds, amphibians and corals. PLoS One 8:e65427. doi: 10.1371/journal.pone.0065427
Franklin, J. (2010). Mapping Species Distributions: Spatial Inference and Prediction. Cambridge: Cambridge University Press.
García-Rodríguez, A., Martínez, P. A., Oliveira, B. F., Velasco, J. A., Alexander, P. R., and Costa, G. C. (2021). Amphibian speciation rates support a general role of mountains as biodiversity pumps. Am. Nat. 198, E68–E79. doi: 10.1086/715500
Gaston, K.J., and Blackburn, T.M. (2000). Pattern and Process in Macroecology. Oxford, OX; Malden, MA, USA: Blackwell Science.
Gibbons, J. W., Scott, D. E., Ryan, T. J., Buhlmann, K. A., Tuberville, T. D., Metts, B. S., et al. (2000). The global decline of reptiles, Déjà vu amphibians: reptile species are declining on a global scale. Six significant threats to reptile populations are habitat loss and degradation, introduced invasive species, environmental pollution, disease, unsustainable use, and global climate change. Bioscience 50, 653–666. doi: 10.1641/0006-3568(2000)050[0653:TGDORD]2.0.CO;2
Gingerich, P. (2001). Rates of evolution on the time scale of the evolutionary process. Genetica 112, 127–144. doi: 10.1023/A:1013311015886
Gonzalez, A., Ronce, O., Ferriere, R., and Hochberg, M. E. (2013). Evolutionary rescue: an emerging focus at the intersection between ecology and evolution. Phil. Trans. R. Soc. B 368:20120404. doi: 10.1098/rstb.2012.0404
Guisan, A., Thuiller, W., and Zimmermann, N. E. (2017). Habitat Suitability and Distribution Models: With Applications in R. Cambridge: Cambridge University Press.
Haddad, N. M., Brudvig, L. A., Clobert, J., Davies, K. F., Gonzalez, A., Holt, R. D., et al. (2015). Habitat fragmentation and its lasting impact on Earth’s ecosystems. Sci. Adv. 1:e1500052. doi: 10.1126/sciadv.1500052
Hausfather, Z., and Peters, G. P. (2020). Emissions – the ‘business as usual’ story is misleading. Nature 577, 618–620. doi: 10.1038/d41586-020-00177-3
Hof, C., Araújo, M. B., Jetz, W., and Rahbek, C. (2011). Additive threats from pathogens, climate and landuse change for global amphibian diversity. Nature 480, 516–519. doi: 10.1038/nature10650
IPCC (2014). “Climate change (2014). Synthesis Report” in Contribution of Working Groups I, II and III to the Fifth Assessment Report of the Intergovernmental Panel on Climate Change. eds. Core Writing Team, R. K. Pachauri and L. A. Meyer (Geneva, Switzerland: IPCC), 151.
IUCN. (2021). The IUCN Red List of Threatened Species. Version 2021-1. Available at: https://www.iucnredlist.org (Accessed January 25, 2022).
Jetz, W., and Alexander, P. R. (2018). The interplay of past diversification and evolutionary isolation with present imperilment across the amphibian tree of life. Nat. Ecol. Evol. 2, 850–858. doi: 10.1038/s4155901805155
Jones, E. I., and Gomulkiewicz, R. (2012). Biotic interactions, rapid evolution, and the establishment of introduced species. Am. Nat. 179, E28–E36. doi: 10.1086/663678
Kearney, M., and Porter, W. (2009). Mechanistic niche modelling: combining physiological and spatial data to predict species’ ranges. Ecol. Lett. 12, 334–350. doi: 10.1111/j.1461-0248.2008.01277.x
Khabbazian, M., Kriebel, R., Rohe, K., and Ané, C. (2016). Fast and accurate detection of evolutionary shifts in Ornstein–Uhlenbeck models. Methods Ecol. Evol. 7, 811–824. doi: 10.1111/2041210X.12534
King, N. G., McKeown, N. J., Smale, D. A., and Moore, P. J. (2018). The importance of phenotypic plasticity and local adaptation in driving intraspecific variability in thermal niches of marine macrophytes. Ecography 41, 1469–1484. doi: 10.1111/ecog.03186
Koleff, P., Gaston, K. J., and Lennon, J. J. (2003). Measuring beta diversity for presence-absence data. J. Anim. Ecol. 72, 367–382. doi: 10.1046/j.1365-2656.2003.00710.x
Kopp, M., and Matuszewski, S. (2014). Rapid evolution of quantitative traits: theoretical perspectives. Evol. Appl. 7, 169–191. doi: 10.1111/eva.12127
Lavergne, S., Mouquet, N., Thuiller, W., and Ronce, O. (2010). Biodiversity and climate change: integrating evolutionary and ecological responses of species and communities. Annu. Rev. Ecol. Evol. Syst. 41, 321–350. doi: 10.1146/annurev-ecolsys-102209-144628
Legendre, P. (2019). A temporal beta-diversity index to identify sites that have changed in exceptional ways in space–time surveys. Ecol. Evol. 9, 3500–3514. doi: 10.1002/ece3.4984
Lima-Ribeiro, M., Varela, S., GonzálezHernández, J., de Oliveira, G., DinizFilho, J. A., and Terribile, L. (2015). EcoClimate: a database of climate data from multiple models for past, present, and future for macroecologists and biogeographers. Biodivers. Inform. 10, 1–21. doi: 10.17161/bi.v10i0.4955
Lindsey, H. A., Gallie, J., Taylor, S., and Kerr, B. (2013). Evolutionary rescue from extinction is contingent on a lower rate of environmental change. Nature 494, 463–467. doi: 10.1038/nature11879
Manes, S., Costello, M. J., Beckett, H., Debnath, A., Devenish-Nelson, E., Grey,, et al. (2021). Endemism increases species' climate change risk in areas of global biodiversity importance. Biol. Conserv. 257:109070. doi: 10.1016/j.biocon.2021.109070
Manes, S., and Vale, M. M. (2022). Achieving the Paris agreement would substantially reduce climate change risks to biodiversity in central and South America. Reg. Environ. Chang. 22:60. doi: 10.1007/s10113-022-01904-4
Mendelson, J. R., Lips, K. R., Gagliardo, R. W., Rabb, G. B., Collins, J. P., Diffendorfer, J. E., et al. (2006). Confronting amphibian declines and extinctions. Science 313:48. doi: 10.1126/science.1128396
Munguía, M., Rahbek, C., Rangel, T. F., Diniz-Filho, J. A. F., and Araújo, M. B. (2012). Equilibrium of global amphibian species distributions with climate. PLoS One 7:e34420. doi: 10.1371/journal.pone.0034420
Nicholson, E., Watermeyer, K. E., Rowland, J. A., Sato, C. F., Stevenson, S. L., Andrade, A., et al. (2021). Scientific foundations for an ecosystem goal, milestones and indicators for the post-2020 global biodiversity framework. Nat. Ecol. Evol. 5, 1338–1349. doi: 10.1038/s41559-021-01538-5
Norberg, J., Urban, M. C., Vellend, M., Klausmeier, C. A., and Loeuille, N. (2012). Eco-evolutionary responses of biodiversity to climate change. Nat. Clim. Chang. 2, 747–751. doi: 10.1038/nclimate1588
Oliveira, B. F., São-Pedro, V. A., Santos-Barrera, G., Penone, C., and Costa, G. C. (2017). AmphiBIO, a global database for amphibian ecological traits. Sci. Data 4:170123. doi: 10.1038/sdata.2017.123
Olson, D. M., Dinerstein, E., Wikramanayake, E. D., Burgess, N. D., Powell, G. V., Underwood, E. C., et al. (2001). Terrestrial Ecoregions of the world: a new map of life on earth: a new global map of terrestrial ecoregions provides an innovative tool for conserving biodiversity. Bioscience 51, 933–938. doi: 10.1641/00063568(2001)051[0933:TEOTWA]2.0.CO;2
Orme, D., Freckleton, R. P., Thomas, G. H., Petzoldt, T., Fritz, S. A., and Isaac, N. (2013). CAPER: comparative analyses of phylogenetics and evolution in R. Methods Ecol. Evol. 3, 145–151.
Peterson, A., Soberón, J., Pearson, R., Anderson, R., Martínez-Meyer, E., Nakamura, M., et al. (2011). Ecological Niches and Geographic Distributions. Princeton: Princeton University Press.
Phillips, B. L., Brown, G. P., Webb, J. K., and Shine, R. (2006). Invasion and the evolution of speed in toads. Nature 439:803. doi: 10.1038/439803a
Pinto, S. M., and MacDougall, A. S. (2010). Dispersal limitation and environmental structure interact to restrict the occupation of optimal habitat. Am. Nat. 175, 675–686. doi: 10.1086/652467
Pinto-Ledezma, J. N., and Cavender-Bares, J. (2020). “Using remote sensing for modeling and monitoring species distributions,” in Remote Sens. Plant Biodivers. Cham: Springer, 199–223.
Quintero, I., and Wiens, J. J. (2013). Rates of projected climate change dramatically exceed past rates of climatic niche evolution among vertebrate species. Ecol. Lett. 16, 1095–1103. doi: 10.1111/ele.12144
R Core Team (2018). R: A language and environment for statistical computing. Vienna, Austria: R Foundation for Statistical Computing. Available at: https://www.R-project.org/.
Revell, L. J. (2011). Phytools: an R package for phylogenetic comparative biology (and other things). Methods Ecol. Evol. 3, 217–223. doi: 10.1111/j.2041-210x.2011.00169.x
Ribeiro, B. R., Sales, L. P., De Marco, P., and Loyola, R. (2016). Assessing mammal exposure to climate change in the Brazilian Amazon. PLoS One 11:e0165073. doi: 10.1371/journal.pone.0165073
Ritchie, J., and Dowlatabadi, H. (2017). Why do climate change scenarios return to coal? Energy 140, 1276–1291. doi: 10.1016/j.energy.2017.08.083
Rossetto, M., Kooyman, R., Sherwin, W., and Jones, R. (2008). Dispersal limitations, rather than bottlenecks or habitat specificity, can restrict the distribution of rare and endemic rainforest trees. Am. J. Bot. 95, 321–329. doi: 10.3732/ajb.95.3.321
Schwartz, M., Luikart, G., and Waples, R. (2007). Genetic monitoring as a promising tool for conservation and management. Trends Ecol. Evol. 22, 25–33. doi: 10.1016/j.tree.2006.08.009
Skelly, D. K., Joseph, L. N., Possingham, H. P., Freidenburg, L., Farrugia, T. J., Kinnison, M. T., et al. (2007). Evolutionary responses to climate change. Conserv. Biol. 21, 1353–1355. doi: 10.1111/j.1523-1739.2007.00764.x
Soberón, J., Jiménez, R., Golubov, J., and Koleff, P. (2007). Assessing completeness of biodiversity databases at different spatial scales. Ecography 30, 152–160. doi: 10.1111/j.0906-7590.2007.04627.x
Souza, K. S., Jardim, L., Rodrigues, F., Batista, M. C. G., Rangel, T. F., Gouveia, S., et al. (2019). How likely are adaptive responses to mitigate the threats of climate change for amphibians globally? Front. Biogeogr. 11:43511. doi: 10.21425/f5fbg43511
Stuart, S. N., Chanson, J. S., Cox, N. A., Young, B. E., Rodrigues, A. S., Fischman, D. L., et al. (2004). Status and trends of amphibian declines and extinctions worldwide. Science 306, 1783–1786. doi: 10.1126/science.11035
Swenson, N. G., and Weiser, M. D. (2014). On the packing and filling of functional space in eastern north American tree assemblages. Ecography 37, 1056–1062. doi: 10.1111/ecog.00763
Taheri, S., Naimi, B., Rahbek, C., and Araújo, M. B. (2021). Improvements in reports of species redistribution under climate change are required. Science. Advances 7:eabe1110. doi: 10.1126/sciadv.abe1110
Thomas, C. D., Cameron, A., Green, R. E., Bakkenes, M., Beaumont, L. J., Collingham, Y. C., et al. (2004). Extinction risk from climate change. Nature 427, 145–148. doi: 10.1038/nature02121
Tourinho, L., Sinervo, B., de Oliveira, C. G. H., and Vale, M. M. (2021). A less data demanding ecophysiological niche modeling approach for mammals with comparison to conventional correlative niche modeling. Ecol. Model. 457:109687. doi: 10.1016/j.ecolmodel.2021.109687
Tourinho, L., and Vale, M. M. (2022). Choosing among correlative, mechanistic, and hybrid models of species’ niche and distribution. Integr. Zool. 1–17. doi: 10.1111/1749-4877.12618
Trew, B. T., and Maclean, I. M. D. (2021). Vulnerability of global biodiversity hotspots to climate change. Glob. Ecol. Biogeogr. 30, 768–783. doi: 10.1111/geb.13272
Urban, M. C. (2015). Accelerating extinction risk from climate change. Science 348, 571–573. doi: 10.1126/science.aaa4984
Urban, M. C., De Meester, L., Vellend, M., Stoks, R., and Vanoverbeke, J. (2012). A crucial step toward realism: responses to climate change from an evolving metacommunity perspective. Evol. Appl. 5, 154–167. doi: 10.1111/j.1752-4571.2011.00208.x
Urban, M. C., Richardson, J. L., and Freidenfelds, N. A. (2013). Plasticity and genetic adaptation mediate amphibian and reptile responses to climate change. Evol. Appl. 7, 88–103. doi: 10.1111/eva.12114
Valladares, F., Matesanz, S., Guilhaumon, F., Araújo, M. B., Balaguer, L., Benito-Garzón, M., et al. (2014). The effects of phenotypic plasticity and local adaptation on forecasts of species range shifts under climate change. Ecol. Lett. 17, 1351–1364. doi: 10.1111/ele.12348
Vilela, B., Nascimento, F. A., and Vital, M. V. C. (2018). Impacts of climate change on small-ranged amphibians of the northern Atlantic forest. Oecol. Aust. 22, 130–143. doi: 10.4257/oeco.2018.2202.03
Vilela, B., and Villalobos, F. (2015). letsR: a new R package for data handling and analysis in macroecology. Methods Ecol. Evol. 6, 1229–1234. doi: 10.1111/2041-210x.12401
Villemant, C., Barbet-Massin, M., Perrard, A., Muller, F., Gargominy, O., Jiguet, F., et al. (2011). Predicting the invasion risk by the alien bee-hawking yellow-legged hornet Vespa velutina nigrithorax across Europe and other continents with niche models. Biol. Conserv. 144, 2142–2150. doi: 10.1016/j.biocon.2011.04.009
Visser, M. E. (2008). Keeping up with a warming world; assessing the rate of adaptation to climate change. Proc. R. Soc. B Biol. Sci. 275, 649–659. doi: 10.1098/rspb.2007.0997
Keywords: eco-evolutionary models, dispersal, thermal tolerance, macroecology, extinction
Citation: Souza KS, Fortunato DS, Jardim L, Terribile LC, Lima-Ribeiro MS, Mariano CÁ, Pinto-Ledezma JN, Loyola R, Dobrovolski R, Rangel TF, Machado IF, Rocha T, Batista MG, Lorini ML, Vale MM, Navas CA, Maciel NM, Villalobos F, Olalla-Tarraga MA, Rodrigues JFM, Gouveia SF and Diniz-Filho JAF (2023) Evolutionary rescue and geographic range shifts under climate change for global amphibians. Front. Ecol. Evol. 11:1038018. doi: 10.3389/fevo.2023.1038018
Edited by:
Dan Cogalniceanu, Ovidius University, RomaniaReviewed by:
Youhua Chen, Chengdu Institute of Biology (CAS), ChinaViorel Dan Popescu, Ohio University, United States
Copyright © 2023 Souza, Fortunato, Jardim, Terribile, Lima-Ribeiro, Mariano, Pinto-Ledezma, Loyola, Dobrovolski, Rangel, Machado, Rocha, Batista, Lorini, Vale, Navas, Maciel, Villalobos, Olalla-Tarraga, Rodrigues, Gouveia and Diniz-Filho. This is an open-access article distributed under the terms of the Creative Commons Attribution License (CC BY). The use, distribution or reproduction in other forums is permitted, provided the original author(s) and the copyright owner(s) are credited and that the original publication in this journal is cited, in accordance with accepted academic practice. No use, distribution or reproduction is permitted which does not comply with these terms.
*Correspondence: Kelly Silva Souza,  kellysouzaecol@gmail.com