Interpreting spatially explicit variation in dietary proxies through species distribution modeling reveals foraging preferences of mammoth (Mammuthus) and American mastodon (Mammut americanum)
 Melissa I. Pardi1,2,3*
  Larisa R. G. DeSantis2,3
- 1Illinois State Museum, Springfield, IL, United States
- 2Department of Biological Sciences, Vanderbilt University, Nashville, TN, United States
- 3Department of Earth and Environmental Sciences, Vanderbilt University, Nashville, TN, United States
Introduction: The end Pleistocene was a time of considerable ecological upheaval. Recent work has explored the megafauna extinction’s role in altering ecosystem processes. Analyses of functional traits withing communities reveal hidden consequences of the megafauna extinction beyond declines in taxonomic diversity. Functional diversity analyses offer new insight into our understanding of past ecosystems and may even inform future rewilding efforts. However, the utility of functional diversity may be hampered by the use of discrete, taxon-level functional traits, such as dietary categories, that mask variation in functional diversity over space and time.
Methods: We present an approach in which species distribution modeling, in Maxent, provides context for interpreting variation in two widely used proxies for diet among fossil taxa: stable isotope analysis and dental microwear texture analysis. We apply this approach to two ecologically distinct taxa, the American mastodon (Mammut americanum) and mammoths (Mammuthus) and investigate their resource use over space and time from the last glacial maximum to the end Pleistocene (25–11.7 thousand years before present).
Results: Mammoth dietary behavior varies by context across their geographic distribution, despite possessing evolutionary adaptations that facilitate grazing. Mammoths exhibit a preference for grazing where species distribution modeling predicts the highest likelihood of occurrence but engage in more mixed-feeding outside of core likelihood areas. In contrast, dietary preferences for mastodon are less resolved and our analyses were unable to identify significant differences in diet across their distribution.
Discussion: The ecological roles of some species are context specific and need to be critically evaluated when planning for management of reintroductions or introducing novel species to restore lost ecological function.
Introduction
The end Pleistocene was a time of considerable environmental upheaval (Rule et al., 2012; Malhi et al., 2016), with the extinction of most megafauna (species weighing > 45 kg) (Lyons et al., 2004) occurring on the backdrop of a rapidly changing climate (Severinghaus et al., 1998; Alley, 2003). While the loss of megafauna reduced taxonomic richness more broadly, recent work has explored the megafauna extinction’s role in altering ecosystem processes through the analysis of functional traits withing communities. These studies have found that not only does functional diversity decline (Davis, 2017), but resilience declines with the loss of megafauna that filled unique ecological roles (Hedberg et al., 2022), highlighting the hidden consequences of species diversity loss. This work is timely, as the idea to rewild landscapes with so-called modern “functional equivalents” of Pleistocene megafauna is increasingly presented as a viable solution for restoring degraded ecosystems (Donlan et al., 2006; Svenning et al., 2016).
The search for modern functional equivalents relies on having a clear understanding of the biological roles of extinct species, and therein lies the rub. Much of our understanding of the ecological function of extinct animals has been inferred through comparisons with living analogs (Janis and Ehrhardt, 1988; Janis, 1995; Mendoza et al., 2002) and community-level paleoecological analyses are often conducted using discrete taxon-level traits and characteristics (Gladstone-Gallagher et al., 2019; Hedberg et al., 2022). Trait resolution can affect interpretation of functional structure (Kohli and Jarzyna, 2021) and the use of coarse categorizations, such as dietary group assignments (e.g., “grazer,” “mixed-feeder,” “browser,” “omnivore,” and “carnivore”) also does not account for variation in behavior within communities or across a taxon’s geographic distribution. By ignoring variation, we risk limiting our understanding of the ecology of extinct species and masking community-level differences in functional diversity (Violle et al., 2012), which poses a hindrance to the possibility of rewilding.
Here, we ask how dietary function varies over the distributions of two iconic ice age taxa: mammoth (Mammuthus) and American mastodon (Mammut americanum). There are many reasons that we expect landscape-scale patterns in intraspecific variation in diet. Within the niche of a species, and reflected by its geographic range, there are conditions that are most optimal for persistence and less optimal conditions near boundaries (Hutchinson, 1957). Variation in niche fitness is reflected in patterns of population densities across geographic ranges, which exhibit a pattern of central tendency across many organisms (Brown, 1984). Additionally, there is an interrelatedness between the niche, environmental conditions, and patterns of biological responses such as predation and competition (Macarthur and Levins, 1967; Maguire, 1973). Because the types and abundance of plants are constrained along gradients of temperature and precipitation (Whittaker, 1967) we predict that variation in the dietary behavior of mammoth and mastodon follow climate, and that diets consumed in the most environmentally suitable parts of the distribution, or “core areas,” differ from diets consumed closer to geographic boundaries, or “edges” (Hutchinson, 1957; Maguire, 1973; Brown, 1984).
Individual-level trait data can provide useful information regarding variation in ecological function between individuals, across populations, and across landscapes. Stable isotope analysis (SIA) of δ13C from enamel (δ13Cenamel) is an individual-level proxy for the relative consumption of C3- and C4-based resources (e.g., Cerling et al., 1997; MacFadden et al., 1999; Secord et al., 2012; DeSantis et al., 2019). In environments where C4 grasses are favored, δ13Cenamel can differentiate between the consumption of C4 grass and C3 browse to quantify degrees of browsing, mixed-feeding, and grazing behavior in herbivores (Teeri and Stowe, 1976; Cerling et al., 1998) and quantify variation across these feeding strategies within a taxon (Pardi and DeSantis, 2021; DeSantis et al., 2022).
Often as a complement to SIA, dental microwear texture analysis (DMTA) is another tool that can provide information on the diets of individual animals (DeSantis, 2016). DMTA using scale-sensitive fractal analysis measures the following attributes: anisotropy (epLsar), complexity (Asfc), textural fill volume (Tfv), and heterogeneity of complexity compared among surfaces in a 3 × 3 grid (HAsfc3) and in a 9 × 9 grid (HAsfc9) (Ungar et al., 2003; Scott et al., 2005, 2006; Scott, 2012; DeSantis, 2016). Through DMTA, microscopic tooth wear is used to characterize diets of differing hardness and toughness (Scott et al., 2006). High anisotropy is characteristic of individuals consuming tough food item such as flesh, in the case of carnivores, or grass, in the case of herbivores. High complexity distinguishes individuals consuming hard and brittle food items, while low complexity is characteristic of consuming soft items. In herbivores, DMTA has been successfully used to differentiate between diets ranging from obligate grazers to browsers to frugivores (Scott, 2012), including diets that are isotopically similar (DeSantis, 2016; DeSantis et al., 2017).
Our aim is to place intraspecific variation from SIA and DMTA into a geographic context to identify landscape-scale patterns in diet of mammoths and mastodons. Species distribution modeling (SDM) has been increasingly used to study the distribution of species over space and time, especially in response to climate change, including among fossil taxa (Martínez-Meyer et al., 2004; Elith and Leathwick, 2009; Maguire and Stigall, 2009; Wang et al., 2021). Such analyses leverage the availability of detailed paleoclimate reconstructions (e.g., Collins et al., 2006; Brown et al., 2018) as well as fossil occurrence data that are now widely accessible through databases (e.g., Williams et al., 2018). Presence-only methods, such as Maxent, are especially useful for analyzing the likely distributions of extinct species for which occurrences can be verified, but absences are uncertain or unknown (Phillips and Dudík, 2008; Elith et al., 2011). By modeling the distribution of species, relationships between climatic variables and likelihood of occurrence can be established, and geographic regions can be assessed as being more or less, suitable to a taxon.
Species distribution modeling and individual-level dietary proxies are useful tools for understanding the ecology of species. Here, we combine these approaches to explore how multiple aspects of the niche contribute to dietary variation. Mammoth and mastodon were selected for this study because they are broadly distributed, are well represented in the late Quaternary fossil record, and have diets that have been well described. Mammoth have morphological adaptations (Maglio, 1972) that permit a broad diet ranging from mixed-feeding to grazing (Smith and DeSantis, 2018, 2020; Pardi and DeSantis, 2021; DeSantis et al., 2022). In contrast, mastodon are browsers with a more narrow breadth in δ13C (Green et al., 2017; Smith and DeSantis, 2018, 2020; Pardi and DeSantis, 2021; DeSantis et al., 2022), but the type of browse that is consumed can come from a variety of sources (Lepper et al., 1991; Newsom and Mihlbachler, 2006) and can vary over time and space (Green et al., 2017). Our approach is to model their distributions using Maxent, and then compare variation in dietary proxies (via SIA or DMTA) over space. We ask if the diets of mammoth and mastodon living in the core areas of their distributions (and niches) differ from those living closer to the edges.
Materials and methods
Training and tuning of species distribution models
Our study treats mammoth (Mammuthus) at the genus level and mastodon (Mammut americanum) at the species level. This choice was deliberate as a means to be congruent with (1) the treatment of dietary proxy data in the literature and (2) what genetic studies indicate is reasonable treatment of these taxa. Much of the dietary proxy data available are presented at the genus level. This is true not just for mammoth and mastodon, but across herbivores more broadly (see Pardi and DeSantis, 2021). Multiple species are currently recognized within Mammuthus, but study of their genetics casts doubt on current species designations; while there is phylogeographic structure in mammoth matrilines, there is also introgression, potentially extensive, between nominal mammoth species and there are non-linear associations between genetics and morphological attributes that have been used to distinguish mammoth taxa (Enk et al., 2016). Mastodon taxonomy suffers in a different manner. While all of the mastodon records in our study are M. americanum and exclude M. pacificus (Dooley et al., 2019), recent genetic analyses of M. americanum identifies six distinct clades across the North American continent (Karpinski et al., 2020). Thus, taxonomic revisions to split Mammut may be in order and the taxonomic resolution of our analyses between mammoth and mastodon are comparable.
Records identified as Mammuthus and Mammut americanum were downloaded from the Neotoma Database1 (Williams et al., 2018) and supplemented with a literature search (Supplementary Table 1). A record was included as an occurrence in the Maxent model if its location could be estimated with at least 20 km precision and if a high-quality date was made directly on the taxon of interest (Barnosky and Lindsey, 2010), or if there was reasonable stratigraphic evidence to accept an associated age. Radiocarbon dates were calibrated using the Intcal20 calibration curve (Reimer et al., 2020) using the “calibrate” function in the rcarbon package (version 1.4.3) in R (version 4.2.0) (Crema and Bevan, 2021; R Core Team, 2022). Median ages were used to place occurrences into one of the following time bins: the Last Glacial Maximum (LGM; 25,000–18,000 yr B.P.), Heinrich Stadial 1 (HS1; 17,000–14,700 yr B.P.), Bølling-Allerød (BA; 14,700–12,900 yr B.P.), and the Younger Dryas Stadial (YD; 12,900–11,700 yr B.P.).
A species distribution model was trained in Maxent2, version 3.4.4 (Phillips et al., 2020) for each taxon using collective occurrences spanning the time periods of our study. Each occurrence was spatially associated with raster coverages of 19 bioclimatic variables modeled for the YD, BA, and HS1 from Paleoclim (Brown et al., 2018), and the LGM (ca. 21,000 yr B.P) from the CHELSA algorithm (Karger et al., 2017). Climate rasters had a resolution of 20 km, and occurrences were spatially thinned such that no grid cell was shared by two or more occurrences within the same time bin to reduce potential issues of autocorrelation (Legendre, 1993).
Background points in the Maxent model represent the areas accessible to a species and the climatic conditions that are present at those locations. The experimentally determined minimum number of background points required to represent the available environment is 10,000 (Phillips and Dudík, 2008). Temporally balanced background points were randomly sampled by location and time period from within a seven-degree buffer surrounding each thinned occurrence, with the proportion of background points selected to match the proportion of occurrences in each time bin (Pendleton et al., 2012; Pardi and Smith, 2016). Background points were not sampled from regions covered by glaciers or large lakes (Dyke et al., 2003).
Model tuning was conducted using the function “ENMevaluate” in the R package ENMeval (version 2.0.3) (Kass et al., 2021) and followed a “n−1” or “leave one out” jackknife procedure (Shcheglovitova and Anderson, 2013) varying two Maxent settings that regulate model complexity: feature class and regularization multiplier. Each omitted occurrence was used as a test case for each model trained with n−1 occurrences. Models were run with combinations of linear, hinge, linear with quadratic, and linear with hinge and quadratic features, and regularization multipliers ranging from 0.5 to 5.0, at 0.25 intervals. We compared a total of 76 model combinations across n iterations, each, for mammoths and mastodon. The average test omission [using the tenth percentile training presence threshold (TPT)] and average area under the receiver operating characteristic curve (AUC) across model runs was calculated for each combination. AUC is the probability that a random training occurrence will be ranked higher than a random background point (Phillips and Dudík, 2008; Elith et al., 2011). The combination that (1) minimized average omission rates and then (2) maximized average AUC values was selected for each taxon to minimize overfitting (Shcheglovitova and Anderson, 2013) while maximize predictability.
To model likely distributions for each time bin and identify geographic areas of differing likelihood of occurrence, the tuned models were projected onto gridded climate variables for each time period (Dyke et al., 2003; Karger et al., 2017; Brown et al., 2018) and categorized at different likelihood thresholds. Grid cells with modeled likelihood values above the TPT were categorized as “Core” areas. Cells below the TPT were categorized as “Edge” areas. For purposes of discussion, we further subdivided Edge areas as “intermediate” and of “lowest/least” likelihood of occurrence using the minimum training threshold (MTT). The aim of this classification was to identify geographic locations of differing likelihoods of occurrence for each time period. Multivariate environmental similarity surfaces (MESS) were used to omit predicted areas from further analyses that fell outside of the range of climate variables used to train the models (Elith et al., 2010).
Spatial analyses of dietary proxies across regions of differing suitability
To assess how mammoth and mastodon diets varied across their niches and distributions, published dietary proxies were collected from the literature, and were then spatially and temporally compared across Core areas and Edge areas as defined by the Maxent models. Our expectation is that mammoth and mastodon vary their diets according to the suitability of the environment, as regions of the highest suitability may have greater availability of preferred resources.
Prior analyses of δ13Cenamel have identified high variation within mammoth and characterized them as grazers that can mixed-feed; in contrast, there is low variation in δ13Cenamel within mastodon, which are browsers (Figure 1). SIA is, therefore, unlikely to capture significant landscape-scale differences in dietary behavior within mastodon. However, DMTA has identified significant differences in the consumption of distinct browse resources by mastodons across sites of differing vegetation types (Green et al., 2017; Smith and DeSantis, 2018). We, therefore, focus our analyses of spatial variation in diets using SIA of mammoth and DMTA of mastodon. Mammoth SIA and mastodon DMTA samples were from published georeferenced specimens that had ages confirming they were from the latest Pleistocene, after the LGM (Supplementary Tables 2, 3).

Figure 1. Isotopic breadth of mammoth (Mammuthus) and mastodon (Mammut americanum) during the Late Pleistocene (25–11.7 ka). Data are from latitudes below 37° North (MacFadden and Cerling, 1996; Connin et al., 1998; Koch et al., 1998, 2004; Hoppe, 2004; Hoppe and Koch, 2006; Vetter, 2007; Metcalfe et al., 2011; Lundelius et al., 2019; Pardi and DeSantis, 2021; DeSantis et al., 2022). Values are calibrated to the Vee Pee Dee Belemnite (V-PDB) standard.
We compared δ13Cenamel values sampled from mammoth between Core and Edge areas. Analyses were geographically restricted to samples collected from occurrences from below 37° latitude (MacFadden and Cerling, 1996; Connin et al., 1998; Koch et al., 1998, 2004; Hoppe, 2004; Hoppe and Koch, 2006; Vetter, 2007; Metcalfe et al., 2011; Lundelius et al., 2019), where δ13Cenamel values more directly reflect the relative consumption of C3 browse and C4 grass resources. Specifically, C3 vegetation is likely trees, forbs, and shrubs (δ13Cenamel values < −9‰) and C4 resources are likely grasses (δ13Cenamel values > −2‰) below 37° latitude (Teeri and Stowe, 1976; Cerling et al., 1997; Kohn, 2010). The temporal resolution of some SIA samples was coarser than our niche models, with the age estimates of some localities spanning time bins. We retained less temporally refined samples where the age estimate spanned time bins if they had the same suitability classification (Core vs. Edge). However, if a site spanned time bins where modeled suitabilities were different, the sample was removed from our analyses. The null hypothesis is that isotopic samples from Core areas and Edge areas are from the same distribution and indistinguishable.
Similarly, we compared DMTA values from mastodon across suitability regions. We did not employ any geographic constraints in these analyses; however, temporal constraints were treated the same as in mammoths. Higher complexity (Asfc) would be indicative of consuming harder foods, high anisotropy (epLsar) indicates softer and tougher foods, and low heterogeneity (HAsfc3, HAsfc9) may indicate specialized browsing (Scott et al., 2005; Scott, 2012). The null hypothesis is that DMTA parameters measured from Core area samples and Edge samples are from the same distribution and indistinguishable.
Results
Occurrences and model tuning
A literature search of occurrences with dates resulted in n = 70 occurrences of Mammuthus (n = 16, 10, 28, and 16 for the LGM, HS1, BA, and YD, respectively) and n = 37 occurrences of Mammut americanum (n = 4, 2, 26, and 5, respectively) (Supplementary Table 1). The model that minimized average omission rates and maximized average validation AUC values for each taxon was selected: for mammoth, linear features with a regularization multiplier of 4.5 resulted in an average omission rate of 0.1142 and average validation AUC of 0.6661; for mastodon, hinge features and a regularization multiplier of 2.75 resulted in an average omission rate of 0.1111 and average validation AUC of 0.7948. Given these parameter settings, the final model training AUCs were 0.6842 for mammoths and 0.8436 for mastodon. An AUC of 0.7 or higher is generally considered good, however, a lower AUC may be reflective of greater difficulty in distinguishing suitable and unsuitable habitat for widespread and more generalist species (Dobrowski et al., 2011). The environmental variable with the greatest percent contribution to the mammoth model was mean temperature of the driest quarter (85.5% contribution; Supplementary Table 4). The environmental variables with the greatest percent contribution to the mastodon model were mean temperature of the driest quarter (46.3%), maximum temperature of the warmest month (15.4%), precipitation of the coldest quarter (14.6%), and precipitation of the driest month (12.1%; Supplementary Table 5).
Modeled suitability of mammoths and interpretation of the dietary niche using stable isotope analysis
Models were projected onto climate raster layers to estimate where suitable regions for mammoth existed for each time bin in our study and classified into Core and Edge areas (Figure 2). Edge areas were further subdivided into areas that were of intermediate and lowest likelihood of occurrence. The tenth percentile training threshold was 0.3424 and the MTT was 0.2218. Projections onto the five time periods of the study indicate changes in the distribution of areas of relative likelihood (Figure 2). With the retreat of glaciers, the leading edge of Core areas for mammoth expand north but the trailing edge is displaced by Intermediate and Least Likely areas in the south, southwest, and along the west coast.
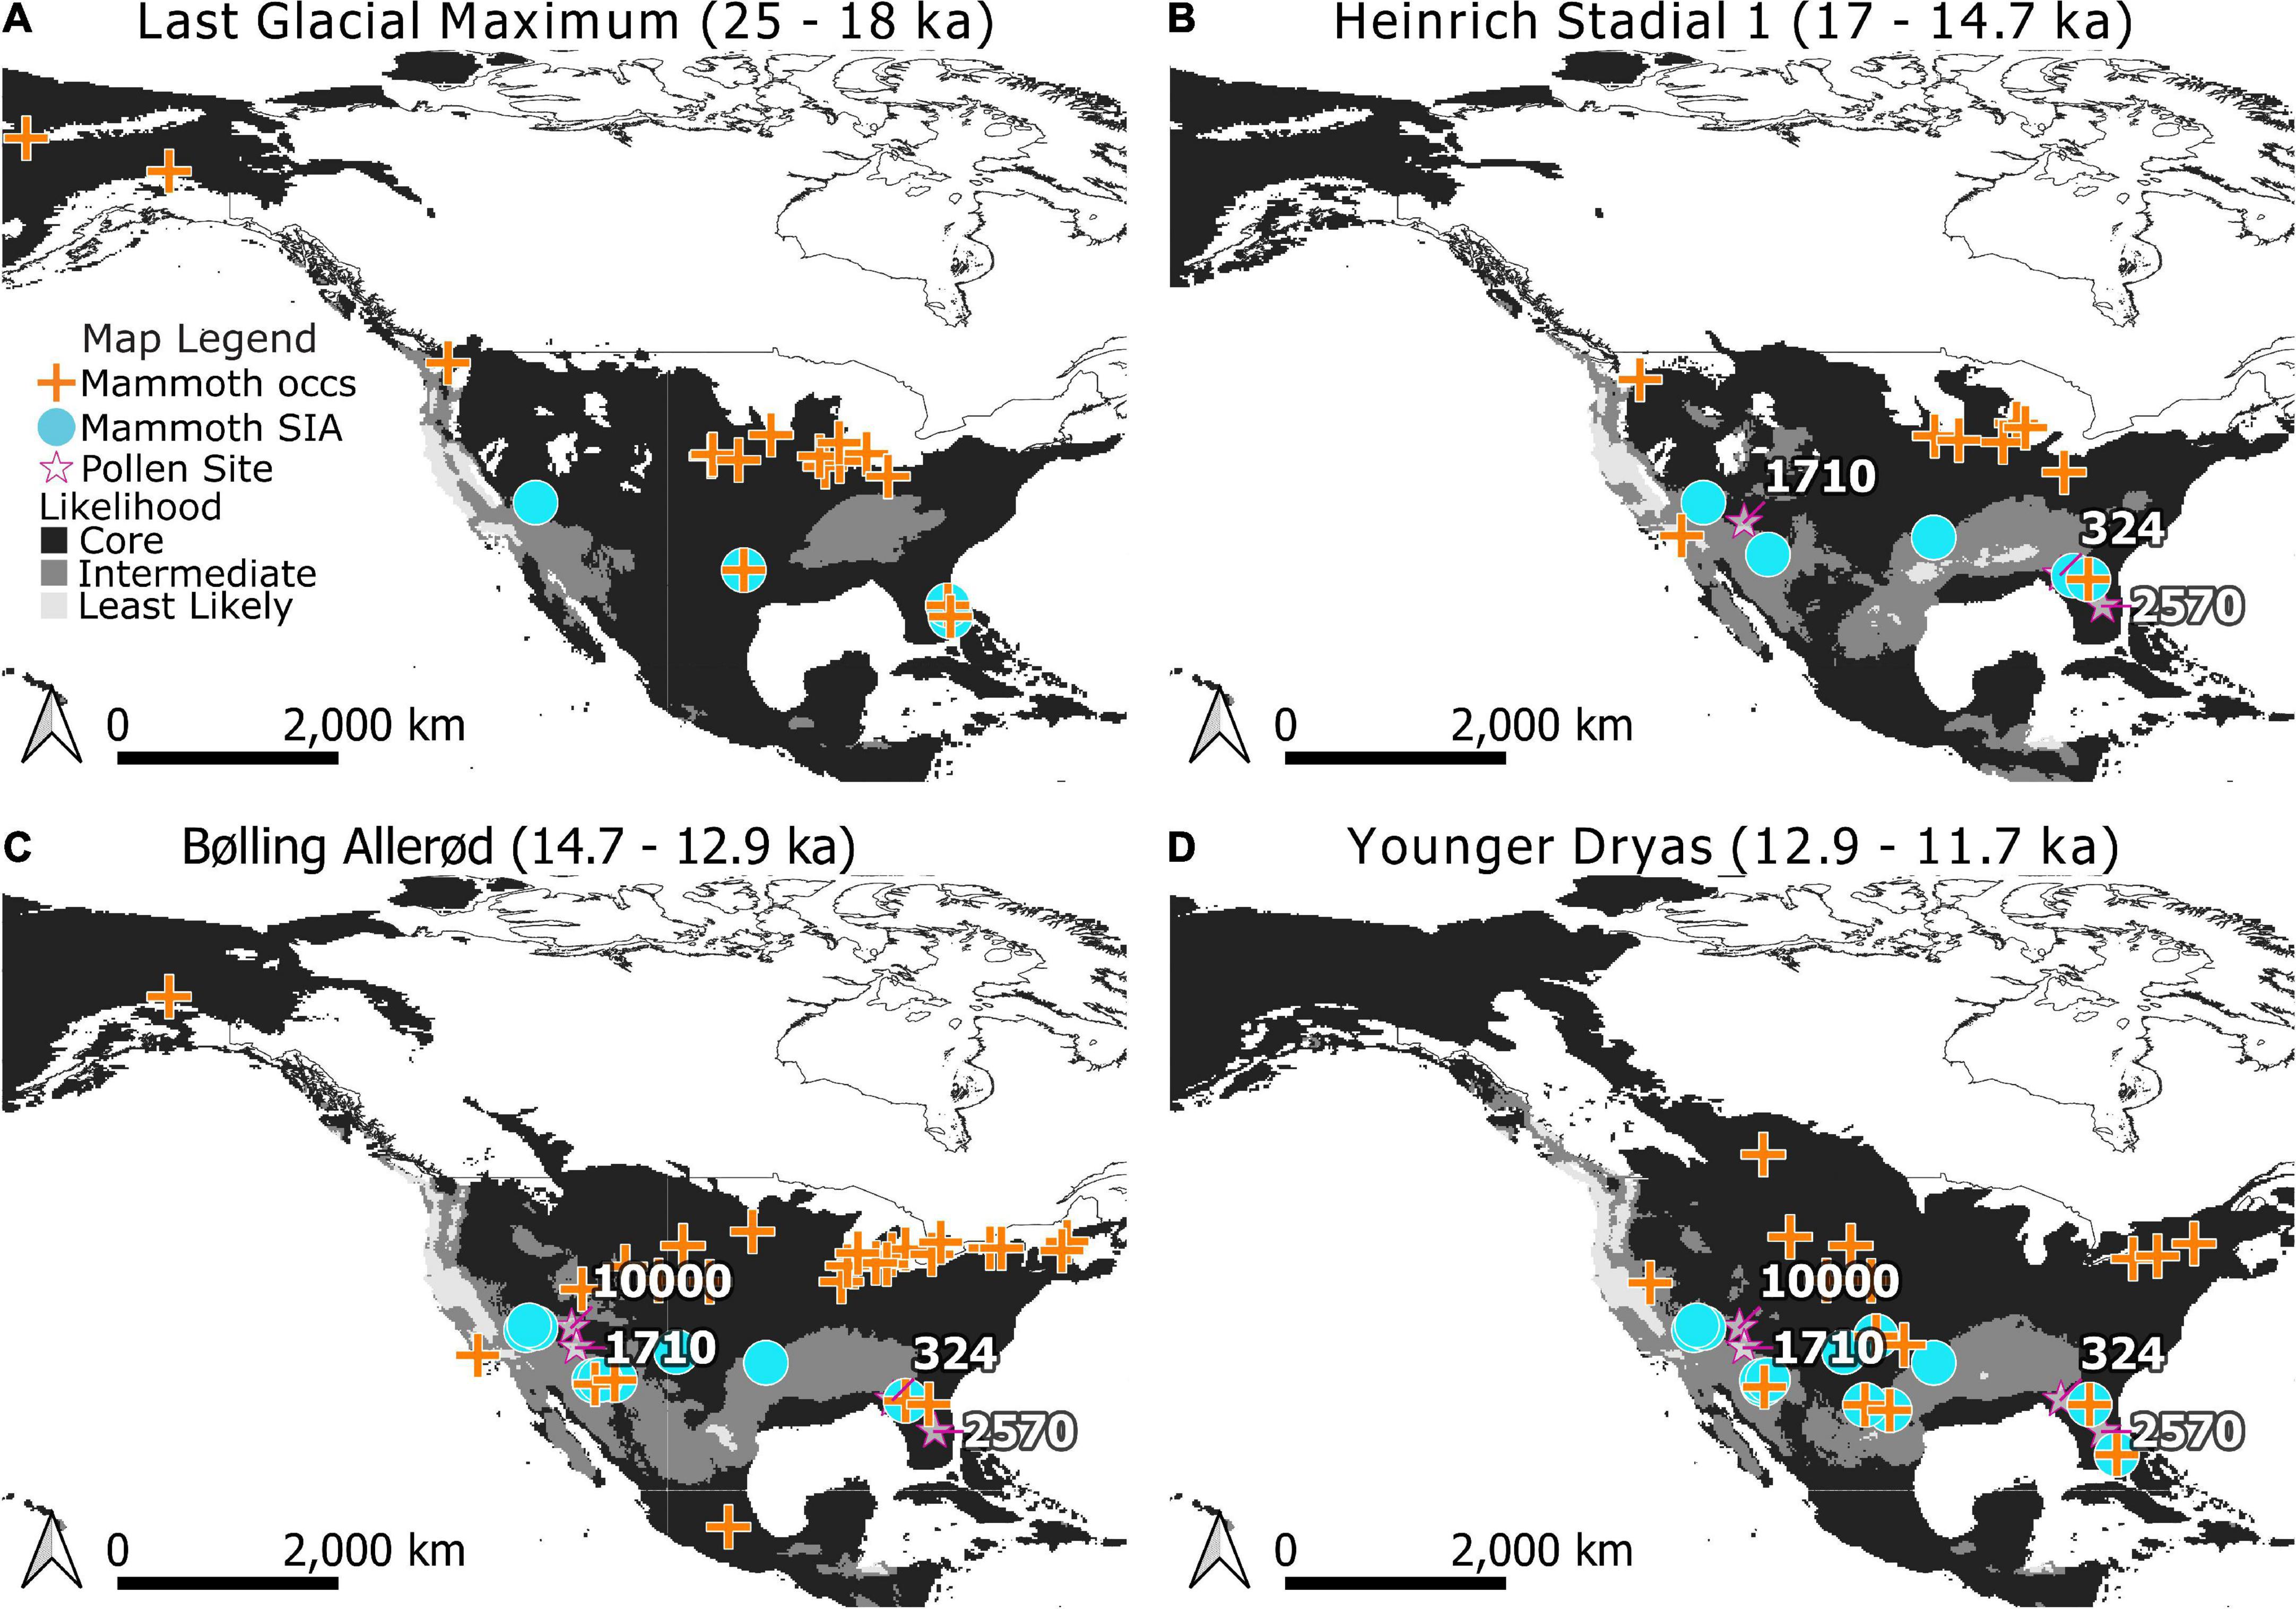
Figure 2. Modeled distributions for mammoth (Mammuthus) during the Last Glacial Maximum (A), Heinrich Stadial 1 (B), Bølling-Allerød (C), and Younger Dryas (D). Core areas are indicated in black, Edge areas are subdivided into Intermediate (medium gray) and Least Likely (light gray) categories. Occurrences used in training the Maxent models are indicated by crosses. Stable isotope analysis (SIA) sample locations are indicated as circles. Note that when a location for dietary proxy samples has age estimates spanning time bins it has been mapped across those bins for visualization purposes. Pollen records referenced in the text (stars) are labeled with their Neotoma site ID.: Lake Tulane (2570), Camel Lake (324), Montezuma Well (1710), and Bear Lake (10000). The extent of North American ice sheets are shown for 18,000, 14,500, 13,000, and 11,500 radiocarbon years B.P. following Dyke et al. (2003).
To test whether mammoth diets varied predictably with likelihood of occurrence, δ13Cenamel values were categorized as being either from Core areas or Edge areas by age and location (Figures 2, 3). The Maxent model correctly predicted SIA sample locations as places of occurrence for mammoth: none of the SIA samples were found to be from areas modeled to be least likely, or below the MTT of the model. Within Core areas δ13Cenamel values ranged from −8.7 to 0.5‰ with a median value of −1.5‰ (n = 32, nsites = 10; Table 1). Samples from Edge areas ranged from −9.0 to −0.9‰ with a median value of −2.8‰ (n = 17, nsites = 11; Table 1). δ13Cenamel sampled from Core areas were significantly less negative and reflective of the consumption of proportionally more C4 resources (Wilcoxon rank sum and signed rank test; W = 149, p = 0.01004; Figure 3). To explore the possible effects of a larger sample size from Core areas, we applied a bootstrap analysis and plotted the distribution of resulting p-values from the Wilcoxon rank sum and signed rank test (Supplementary Figure 1). This analysis produced a median p-value of 0.03 and an interquartile range from 0.01 to 0.05, and we reject the null hypothesis on this basis.

Figure 3. Boxplots of δ13Cenamel from mammoth (Mammuthus) collected below 37° latitude. Samples from Core areas of the distribution (highest likelihood of occurrence) are compared to those in Edge areas (intermediate and lowest likelihood of occurrence). Raw values are plotted in addition to the distributions given by the boxplots. The dashed green line indicates a δ13Cenamel value of –2.0‰ which is the threshold between a mixed-feeding versus grazing diet. Samples from Core areas are significantly less negative (Wilcoxon rank sum and signed rank test; W = 149, p = 0.01004).
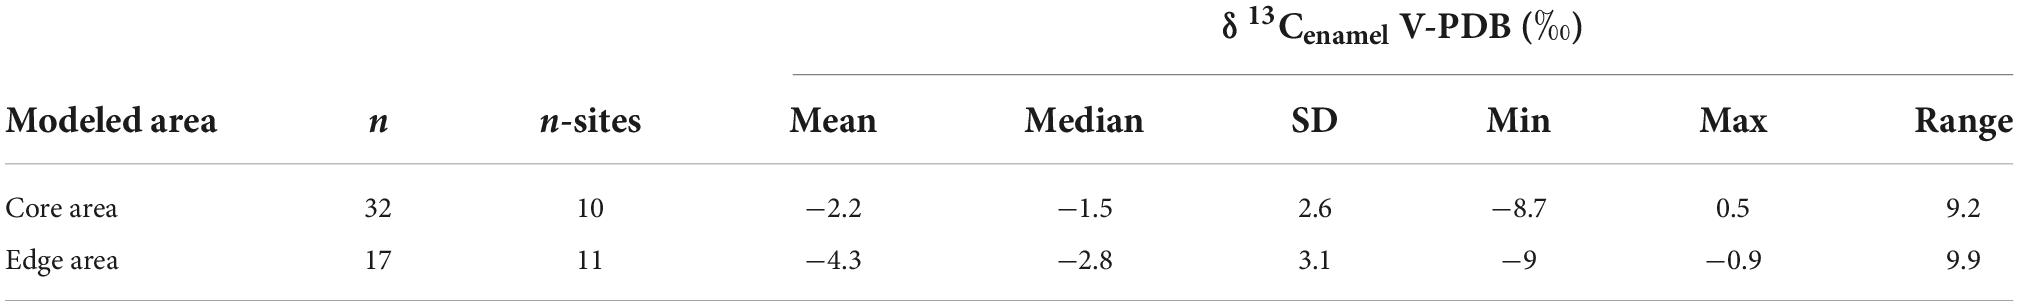
Table 1. Summary statistics of δ13Cenamel for mammoth (Mammuthus) in this study.
Modeled suitability of mastodon and interpretation of the dietary niche using dental microwear texture analysis
Models were projected to estimate where regions for mastodon existed for each time bin in our study and classified into Core and Edge areas (Figure 4) using the tenth percentile training threshold (0.4162). Edge areas were further subdivided into areas that were of Intermediate and Lowest Likelihood of occurrence using the MTT (0.1457). Projections onto the five time periods of the study indicate changes in the distribution of areas of relative likelihood (Figure 4). With the retreat of glaciers, the leading edge of Core areas for mastodon move northwards, while the trailing edge is displaced by Intermediate and Least Likely areas across the south and west.
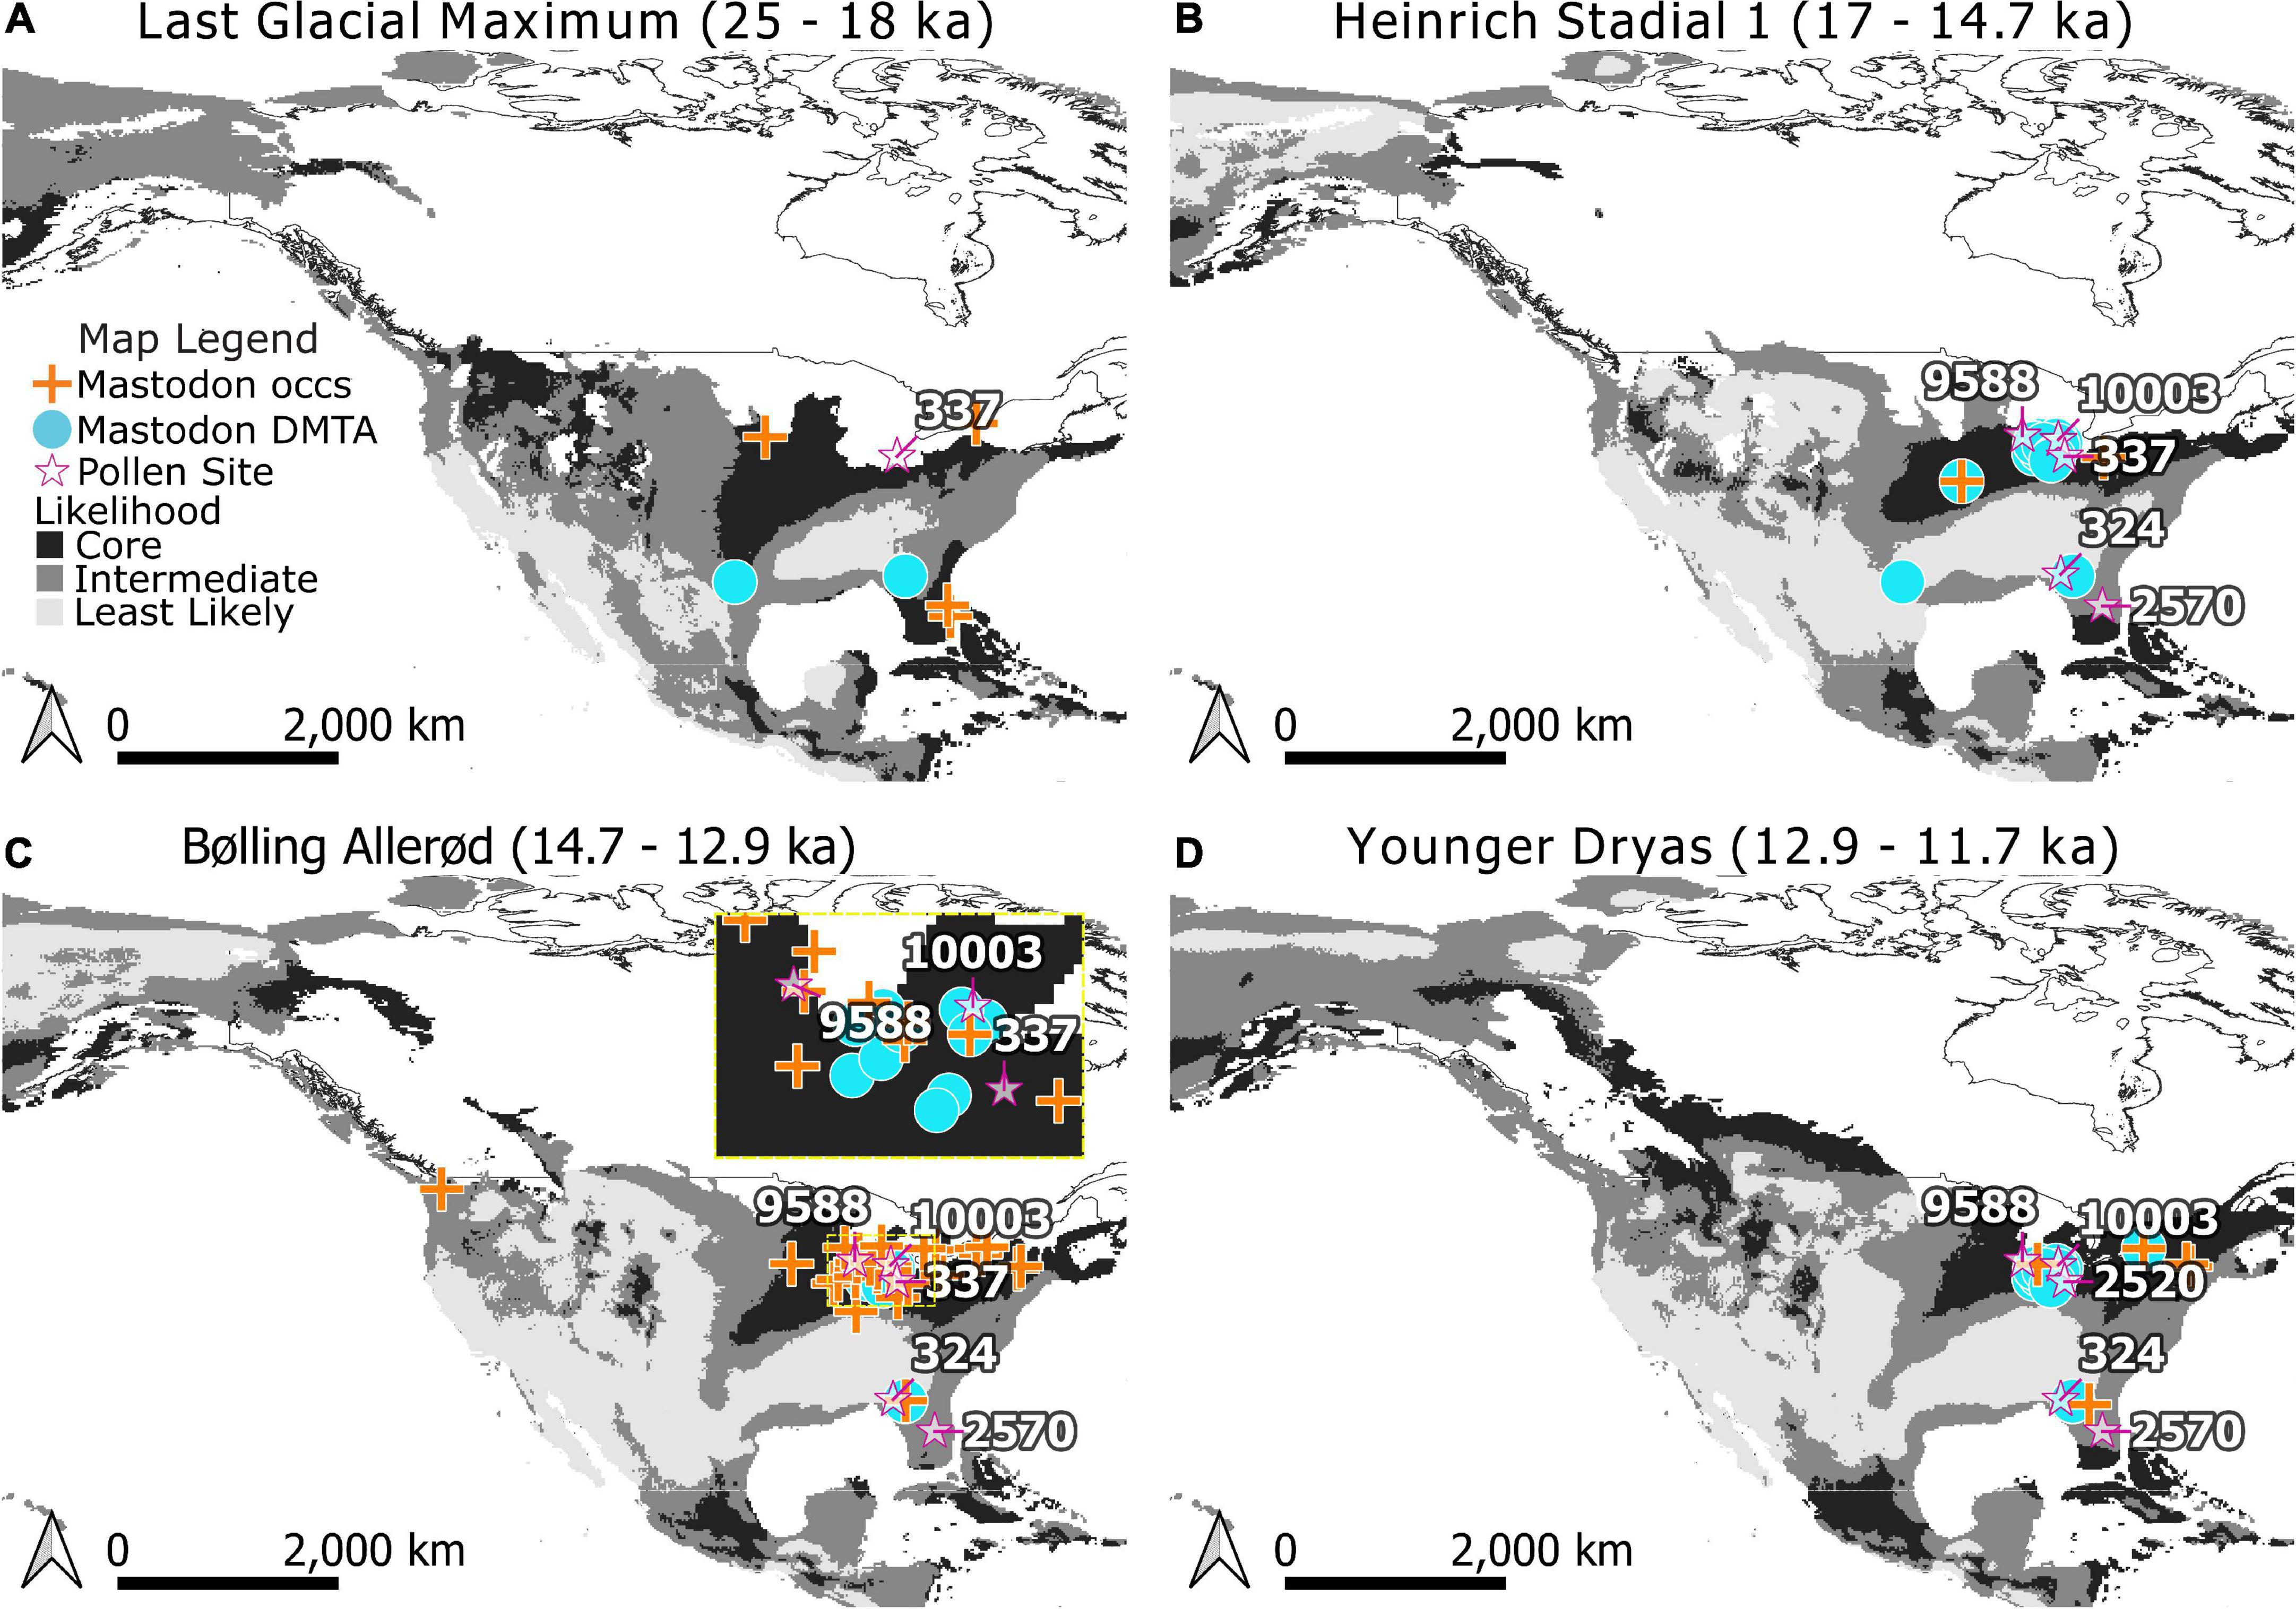
Figure 4. Modeled distributions for mastodon (Mammut americanum) during the Last Glacial Maximum (A), Heinrich Stadial 1 (B), Bølling-Allerød (C), and Younger Dryas (D). Core areas are indicated in black, Edge areas are subdivided into Intermediate (medium gray) and Least Likely (light gray) categories. Occurrences used in training the Maxent models are indicated by crosses. Dental microwear texture analysis (DMTA) sample locations are indicated as circles. Note that when a location for dietary proxy samples has age estimates spanning time bins it has been mapped across those bins for visualization purposes. Pollen records referenced in the text (stars) are labeled with their Neotoma site ID.: Brewster Creek (9588), Appleman Lake (10003), Stotzel-Leis Site (2520), Cater Site (337), Camel Lake (324), and Lake Tulane (2570). The extent of North American ice sheets are shown for 18,000, 14,500, 13,000, and 11,500 radiocarbon years B.P. following Dyke et al. (2003). Panel (C) inset shows Northern mid-continent data in more detail for the Bølling-Allerød.
To test whether diets of mastodon varied predictably with likelihood of occurrence, DMTA samples were categorized as being either from Core areas or from Edge areas based on their age and where they were sampled from Figures 4, 5 and compared. The Maxent model correctly predicted most of the DMTA sample locations as places of occurrence for mastodon: only one out of the 14 DMTA sample localities (Friesenhahn Cave) was from an area modeled to be least likely, meaning most were found to be at least within the MTT of the model. No significant differences were found in complexity (Asfc), anisotropy (epLsar), textural fill volume (Tfv), or heterogeneity (Hasfc3 and Hasfc9) between samples taken from Core areas (n = 32, nsites = 12; Table 2) and Edge areas (n = 10, nsites = 2; Table 2). While a Wilcoxon rank sum and signed rank test of Asfc failed to reject the null hypothesis when evaluated at α = 0.05 (W = 100, p = 0.0788), samples from Core areas had Asfc values that ranged from 0.537 to 5.926 and had a median value that was higher (1.904) than samples from Edge areas ranging 0.429 to 2.759 (median = 1.055; Figure 5). A comparison of the summary statistics across DMTA textures suggests that individuals are most differentiated by complexity (Asfc) over space when compared to any other texture variable (Table 2).

Figure 5. Boxplots of epLsar (A), Asfc (B), Tfv (C), Hasfc3 (D), and Hasfc9 (E) for mastodon (Mammut americanum). Individuals sampled from Core areas of the distribution (highest likelihood of occurrence) are compared to those in Edge areas (intermediate and lowest likelihood of occurrence). Raw values are plotted in addition to the distributions given by the boxplots. A Wilcoxon rank sum and signed rank test found no significant differences between groups for any dental microwear texture analysis (DMTA) texture parameter.
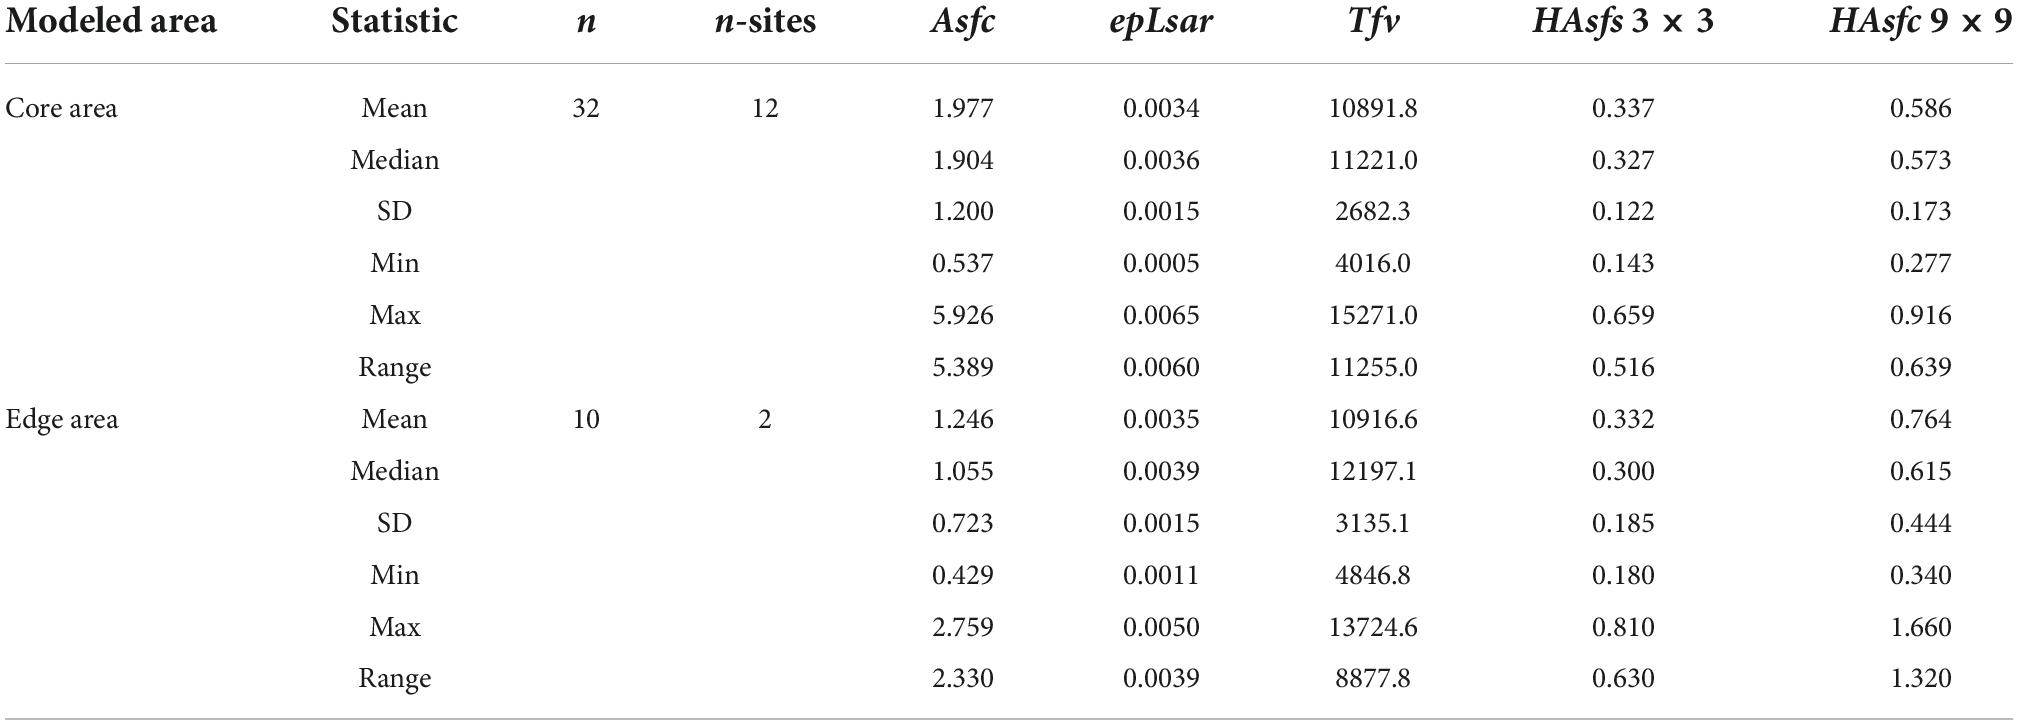
Table 2. Summary statistics of dental microwear texture analysis (DMTA) texture attributes for mastodon (Mammut americanum) in this study.
Discussion
Rather than attempt to strictly define geographic ranges of mammoth (Mammuthus) and mastodon (Mammut americanum), which SDMs often over- or under-predict (Mellert et al., 2011; Marcer et al., 2013; Lee-Yaw et al., 2022), our aim was to compare dietary function within Core areas of greatest likelihood to dietary function in Edge areas of lower likelihood (Peterson et al., 2018; Figures 2, 4). We established correlative relationships between climatic variables and likelihood of occurrence to test the hypothesis that mammoth and mastodon consume variable diets at the landscape scale according to relative suitability of the environment using the maximum-entropy approach of species distribution modeling. We found evidence for significant dietary preferences of mammoth (Figure 3 and Table 1), while preference in mastodon was less resolved (Figure 5 and Table 2).
Despite the cosmopolitan distribution of mammoth and their apparent high variation of dietary breadth (Smith and DeSantis, 2018), greater consumption of grass in Core areas across their modeled distribution suggests a preference for grass (Figure 3) as would be expected from both their morphology (Maglio, 1972) and as a requirement for adequate rates of tooth wear (Fagan et al., 1999). These preferences resemble those of Elephas maximus (Asian elephants) which are variable mixed-feeders with a preference for grazing (Sukumar et al., 1987; Baskaran et al., 2010; Koirala et al., 2016).
As a dietary proxy, δ13Cenamel can discriminate between browse and graze consumption at low latitudes (below 37°) because most low-latitude grasses use the C4 photosynthetic pathway and have tissues that are isotopically distinct from those of C3 trees, forbs, and shrubs (Teeri and Stowe, 1976; Paruelo and Lauenroth, 1996; Cerling et al., 1997, 1998; Macfadden et al., 1999). High δ13Cenamel values from individuals sampled at low latitudes in our study indicate greater consumption of C4 grass by mammoths where they are most likely to occur. Preference is exhibited when a resource is utilized at a higher frequency than it occurs, and these individuals are from landscapes of mixed, but C3-browse dominant, resources. Local pollen records from Camel Lake (Watts et al., 1992; Wang et al., 2019) and Lake Tulane (Grimm et al., 1993; Wang et al., 2019; Figure 2) confirm the presence of mixed-parkland and deciduous forest environments coincident with SIA samples during Heinrich Stadial 1 through the Younger Dryas (Supplementary Table 6). Where, then, are these mammoth grazing?
Elephants typically maintain small home ranges (<250 km) (Bonhof and Pryor, 2022) but exhibit variable nomadic behavior that is influenced by seasonal change of habitat, the availability of food and water, as well as sex (Sukumar et al., 1987; Baskaran et al., 2010; Koirala et al., 2016). Similar movement patterns in mammoths have been inferred from 87Sr/86Sr analyses, although longer treks to other geographic areas are feasible (Bonhof and Pryor, 2022). If grasses are distributed heterogeneously in patches within a browse-dominated environment, mammoth could have selectively made use of these resources by traveling between patches. However, enriched δ13Cenamel values signaling the use of C4 resources indicate that grazing was primarily at lower latitudes, as the relative abundance of C3 to C4 grasses increases with latitude (Teeri and Stowe, 1976; Paruelo and Lauenroth, 1996; Cerling et al., 1997, 1998; Macfadden et al., 1999).
Mammoth sampled from Edge areas of lower likelihood made greater use of mixed C3 and C4 resources (Figure 3). These individuals may be consuming the local vegetation. Pollen from Montezuma Well (Davis and Shafer, 1992) documents predominantly desert vegetation which includes on average ∼5% diversity from grasses during Heinrich Stadial 1 through the Younger Dryas, near SIA samples in the Southwest (Figure 2 and Supplementary Table 6). Another nearby pollen site is Bear Lake (Weng and Jackson, 1999), which documents predominantly spruce parkland with on average <1% grasses and sedges during the Bølling-Allerød and the Younger Dryas. Alternatively, these individuals could be acquiring a mixed signal by consuming C3 grasses from higher latitudes: future studies of individual movement can help clarify where these animals are foraging.
Dietary preferences are less clearly defined for mastodon. Their isotopic breadth is, overall, relatively low and indicates restricted use of C3 resources (Figure 1; Pardi and DeSantis, 2021). However, analyses a coprolites demonstrate that they consumed a broad variety of C3 plants (Lepper et al., 1991; Newsom and Mihlbachler, 2006). We therefore analyzed published DMTA values to explore variance in food texture across their modeled distribution. Mastodon from Core areas of highest likelihood of occurrence have somewhat higher complexity (Asfc) values (median = 1.904, Figure 5 and Table 2) than Edge areas (median = 1.055) which hints at greater consumption of brittle or hard food items (bark, nuts, and seeds) in Core areas, although this difference is non-significant (p = 0.0788). The bulk of what is known about mastodon diets inferred through DMTA comes from a handful of studies comparing regional and temporal variation across sites of differing habitats (Green et al., 2017; Smith and DeSantis, 2018, 2020) and age demographics (Smith and DeSantis, 2018). Sampling for mastodon DMTA does not have nearly the breadth of geographic coverage as SIA for mammoth (Figures 2, 3). Future analyses of DMTA from samples collected outside of the Core areas of highest likelihood will help to clarify dietary preferences.
Although we were unable to identify significant differences in mastodon diets according to their likelihood of occurrence using DMTA, contemporaneous pollen records point to habitat types that may have been more suitable. Core areas of high likelihood of occurrence are consistently present for mastodon in the northern midcontinent during the late Pleistocene (Figure 4). Numerous pollen records from this region (Brewster Lake, Appleman Lake, Stotzel-Leis Site, and Carter Site) indicate the presence of mixed-parkland and prairie throughout the this time (Shane, 1987; Curry et al., 2007; Gill et al., 2009; Figure 4; Supplementary Table 6). This contrasts with pollen records near mastodon in Edge areas in the southeast, such as Camel Lake (Watts et al., 1992; Wang et al., 2019) and Lake Tulane (Grimm et al., 1993; Wang et al., 2019; Figure 4) which confirm the presence of mixed-parkland and deciduous forest.
When considering the scale and temporal grain of different dietary proxies, δ13Cenamel and microwear can reasonably be applied to questions of habitat tracking and behavioral plasticity (Davis and Pineda-Munoz, 2016). δ13Cenamel integrates the isotopic signal of the resources being used over the weeks to months of life during which the enamel mineralizes, which could also mean an integration of resources used across a geographic area for a highly mobile animal. For this reason, SIA is a reasonable proxy for what an animal is eating at the scale of a landscape (Davis and Pineda-Munoz, 2016) as we have applied it here. In contrast, microwear records properties of the food consumed during the days to weeks leading up to death (Grine, 1986). It therefore has high fidelity to the specific location where an individual is found as a fossil. DMTA has been applied to characterize interspecific dietary variation (Scott, 2012; DeSantis, 2016) as well as intraspecific variation over time and space (Rivals et al., 2007).
The mastodons sampled for DMTA from Friesenhahn Cave warrant further comment. These individuals are juveniles and have low complexity values (Supplementary Table 3). It is unclear if these low values represent ontogenetic niche partitioning or dietary differences that are reflective of the environment, and the question of whether there are ontogenetic shifts in mastodon diet, more generally, is still open (Smith and DeSantis, 2018). The megafaunal remains at Friesenhahn Cave span a dynamic time (15–20 ka) (Graham et al., 2013) where the region experienced a shift from high likelihood of mastodon occurrence to low likelihood (Figure 4). The local vegetation around Friesenhahn Cave is described in other studies as C4 open grassland with some riparian forests (Hoppe, 2004; Koch et al., 2004; Graham et al., 2013), consistent with our classification of this locality as outside the Core niche of mastodon.
There are refinements that could be made to our models that should be considered before any application beyond the scope of our study. High likelihood of occurrence is not equivalent to presence (Elith and Leathwick, 2009), and we do not account for physical barriers to dispersal. Doing so, however, would not qualitatively affect our results, as we are only concerned with drawing interpretations from dietary proxies from known occurrences. Our models are explicitly limited to relating climate variables with occurrence, which assumes climate is adequately correlated with resources that are required by Proboscideans (e.g., water and vegetation) (Sukumar et al., 1987; Baskaran et al., 2010; Koirala et al., 2016; Bonhof and Pryor, 2022). Realized niches are impacted by variables beyond climate, including biotic interactions (Hutchinson, 1957; Leibold, 1995; Chase and Leibold, 2009), which our models do not account for.
A potentially strong biotic interaction that warrants future investigation is competition. As some of the very largest animals on the landscape, Proboscideans function as ecosystem engineers (Owen-Smith, 1992). Today, African elephants (Loxodonta africana) compete with mesobrowsers and mesomixed feeders, but facilitate mesograzers (Fritz et al., 2002). The presence of megaherbivores, such as modern elephants, impacts the feeding of smaller sympatric herbivores; however, Pleistocene environments supported a much more diverse megaherbivore community. Were sympatric megaherbivores competing with each other, or partitioning resources? DMTA analyses of three middle/late Miocene Proboscideans (Gomphotherium subtapiroideum, Gomphotherium steinheimense, and Deinotherium giganteum) from the Molasse Basin in Southern Germany supports niche partitioning rather than competition for resources (Calandra et al., 2008). In contrast, competitive exclusion imposed by Mammut and Mammuthus is a plausible cause for the eventual extinction of gomphotheres (Cuvieronius) in North America (Smith and DeSantis, 2020).
Mammoth and mastodon sometimes do co-occur, at least regionally. In the Northern, North American mid-continent, they exhibit partial isotopic niche overlap in their use of C3 resources (Widga et al., 2021), although whether this represents consumption of C3 browse or graze within these mammoth is not resolved. The influence these taxa have on each other more generally when they share a landscape remains to be clarified. Do they partition resources, and if so, how is this impacted by geographic variation in environmental suitability as we have identified in the present study? Our models identify geographic locations where there is overlap of Core niche areas for mammoth and mastodon, as well as areas where one is more likely to occur over the other. For example, the Core area of mammoth overlaps with the Edge areas for mastodon in Florida. In contrast, there appear to be few regions where the Core area of mastodon overlaps where mammoth are at the edge of their niche. Our current dataset is not extensive enough to directly compare diets within and outside of areas of sympatry, but our models could provide context for future comparisons.
Our study is unique in that it aims to explore dietary preference and spatially explicit variation within the context of the ecological niches of extinct taxa. Dietary proxy data alone can be incredibly useful for quantifying how resources are being use by individuals and populations over time and space (MacFadden and Cerling, 1996; Scott et al., 2005, 2006; DeSantis, 2016). Our approach provides a means for contextualizing proxy data by the suitability of the environment across the geographic distribution of a taxon. This context matters because ecological interactions and factors influencing populations at geographic range margins are not the same as in the center of the range–boundaries exist because of limiting conditions preventing persistence that are not so limiting elsewhere (Hutchinson, 1957; Brown, 1984).
The approach presented here provides a means for applying distributional context to interpretation of paleoecological data, where occurrences are known but boundaries of geographic ranges are poorly defined. This may be particularly useful when considering the potential causes and consequences of extinctions across landscapes. For example, one could reasonably point to climate and environmental change as a possible cause for late Pleistocene declines and extirpation of mastodon and mammoth in the Central and Southern Great Plains, as likelihood of occurrence decreases with climate change over time (Figures 2, 4). However, losses in the Core area of their distributions may have other causes, such as hunting and landscape changes caused by humans, which is supported by synchronous patterns of extinction and the timing and trajectory of human dispersal (Surovell et al., 2005, 2016; Hamilton and Buchanan, 2007).
Analyses of functional diversity can reveal hidden consequences of taxonomic diversity loss. However, applying taxon-level traits in functional diversity analyses may mask variation that arises from plastic behavior. Specifically, dietary behavior can vary due to the non-uniform distribution of resources and biotic interactions over space. Here, we illustrate this point by exploring how diet, measured through proxies, varies over the modeled distributions of mammoths and mastodon. Mammoth dietary behavior varies by context across their geographic distribution, despite having evolutionary adaptations for grazing and exhibiting a preference for grass overall as a taxon. In contrast, specific dietary preferences for mastodon are less resolved and our analyses were unable to identify significant differences in the selection of browse across their distribution as it relates to likelihood of occurrence. The ecological roles of some species may be context specific and need to be critically evaluated when planning for the management of reintroductions or introducing novel species to restore lost ecological function.
Data availability statement
The original contributions presented in this study are included in the article/Supplementary material, further inquiries can be directed to the corresponding author.
Author contributions
MP collected data, conducted analyses, and wrote the first draft of the manuscript. LD collected data, aided in the development of the research, and helped with revisions to the manuscript. Both authors contributed to the article and approved the submitted version.
Funding
This work was funded by the National Science Foundation (EAR 1725154) and Vanderbilt University.
Acknowledgments
We are thankful to all who have contributed to the Neotoma database and all of the museum staff who have collected, curated, and managed the specimens used in this manuscript. We also thank C. Widga and A. Jukar for valuable discussions about Proboscideans and the feedback provided by two anonymous reviewers.
Conflict of interest
The authors declare that the research was conducted in the absence of any commercial or financial relationships that could be construed as a potential conflict of interest.
Publisher’s note
All claims expressed in this article are solely those of the authors and do not necessarily represent those of their affiliated organizations, or those of the publisher, the editors and the reviewers. Any product that may be evaluated in this article, or claim that may be made by its manufacturer, is not guaranteed or endorsed by the publisher.
Supplementary material
The Supplementary Material for this article can be found online at: https://www.frontiersin.org/articles/10.3389/fevo.2022.1064299/full#supplementary-material
Footnotes
References
Barnosky, A. D., and Lindsey, E. L. (2010). Timing of quaternary megafaunal extinction in South America in relation to human arrival and climate change. Q. Int. 217, 10–29. doi: 10.1016/j.quaint.2009.11.017
Baskaran, N., Balasubramanian, M., Swaminathan, S., and Desai, A. A. (2010). Feeding ecology of the Asian elephant Elephas maximus Linnaeus in the Nilgiri biosphere reserve, Southern India. J. Bombay Nat. Hist. Soc. 107, 3–13.
Bonhof, W. J., and Pryor, A. J. E. (2022). Proboscideans on parade: A review of the migratory behaviour of elephants, mammoths, and mastodons. Quat. Sci. Rev. 277:107304. doi: 10.1016/j.quascirev.2021.107304
Brown, J. H. (1984). On the relationship between abundance and distribution of species. Am. Nat. 124, 255–279. doi: 10.1086/284267
Brown, J. L., Hill, D., Dolan, A. M., and Carnaval, A. C. (2018). PaleoClim, high spatial resolution paleoclimate surfaces for global land areas. Sci. Data 5:180254. doi: 10.1038/sdata.2018.254
Calandra, I., Göhlich, U. B., and Merceron, G. (2008). How could sympatric megaherbivores coexist? Example of niche partitioning within a proboscidean community from the Miocene of Europe. Naturwissenschaften 95, 831–838. doi: 10.1007/s00114-008-0391-y
Cerling, T. E., Ehleringer, J. R., and Harris, J. M. (1998). Carbon dioxide starvation, the development of C4 ecosystems, and mammalian evolution. Philos. Trans. R. Soc. B Biol. Sci. 353, 159–171. doi: 10.1098/rstb.1998.0198
Cerling, T. E., Harris, J. M., MacFadden, B. J., Leakey, M. G., Quade, J., Eisenmann, V., et al. (1997). Global vegetation change through the Miocene/Pliocene boundary. Nature 389, 153–158. doi: 10.1038/38229
Chase, J. M., and Leibold, M. A. (2009). Ecological niches: Linking classical and contemporary approaches. Chicago, IL: University of Chicago Press.
Collins, W. D., Bitz, C. M., Blackmon, M. L., Bonan, G. B., Bretherton, C. S., Carton, J. A., et al. (2006). The community climate system model version 3 (CCSM3). J. Clim. 19, 2122–2143. doi: 10.1175/JCLI3761.1
Connin, S. L., Betancourt, J., and Quade, J. (1998). Late pleistocene C4Plant dominance and summer rainfall in the Southwestern United States from isotopic study of herbivore teeth. Quat. Res. 50, 179–193. doi: 10.1006/qres.1998.1986
Crema, E. R., and Bevan, A. (2021). Inference from large sets of radiocarbon dates: Software and methods. Radiocarbon 63, 23–39. doi: 10.1017/RDC.2020.95
Curry, B. B., Grimm, E. C., Slate, J., and Hansen, B. C. (2007). The late-glacial and early Holocene geology, paleoecology, and paleohydrology of the Brewster Creek site, a proposed wetland restoration site, Pratt’s Wayne woods forest preserve, and James “Pate” Philip State Park, Bartlett, Illinois. Champaign, IL: Illinois State Geological Survey.
Davis, M. (2017). What North America’s skeleton crew of megafauna tells us about community disassembly. Proc. R. Soc. B Biol. Sci. 284:20162116. doi: 10.1098/rspb.2016.2116
Davis, M., and Pineda-Munoz, S. (2016). The temporal scale of diet and dietary proxies. Ecol. Evol. 6, 1883–1897. doi: 10.1002/ece3.2054
Davis, O. K., and Shafer, D. S. (1992). A Holocene climatic record for the Sonoran Desert from pollen analysis of Montezuma Well, Arizona, USA. Palaeogeogr. Palaeoclimatol. Palaeoecol. 92, 107–119. doi: 10.1016/0031-0182(92)90137-T
DeSantis, L. R. (2016). Dental microwear textures: Reconstructing diets of fossil mammals. Surface Topogr. 4:023002. doi: 10.1088/2051-672X/4/2/023002
DeSantis, L. R. G., Crites, J. M., Feranec, R. S., Fox-Dobbs, K., Farrell, A. B., Harris, J. M., et al. (2019). Causes and consequences of pleistocene megafaunal extinctions as revealed from rancho La Brea mammals. Curr. Biol. 29, 2488–2495.e2. doi: 10.1016/j.cub.2019.06.059
DeSantis, L. R. G., Field, J. H., Wroe, S. W., and Dodson, J. R. (2017). Dietary responses of Sahul (Pleistocene Australia–New Guinea) megafauna to climate and environmental change. Paleobiology 43, 181–195. doi: 10.1017/pab.2016.50
DeSantis, L. R. G., Pardi, M. I., Du, A., Greshko, M. A., Yann, L. T., Hulbert, R. C., et al. (2022). Global long-term stability of individual dietary specialization in herbivorous mammals. Proc. R. Soc. B Biol. Sci. 289:20211839. doi: 10.1098/rspb.2021.1839
Dobrowski, S. Z., Thorne, J. H., Greenberg, J. A., Safford, H. D., Mynsberge, A. R., Crimmins, S. M., et al. (2011). Modeling plant ranges over 75 years of climate change in California, USA: Temporal transferability and species traits. Ecol. Monogr. 81, 241–257. doi: 10.1890/10-1325.1
Donlan, C. J., Berger, J., Bock, C. E., Bock, J. H., Burney, D. A., Estes, J. A., et al. (2006). Pleistocene rewilding: An optimistic agenda for twenty-first century conservation. Am. Nat. 168, 660–681. doi: 10.1086/508027
Dooley, A. C. Jr., Scott, E., Green, J., Springer, K. B., Dooley, B. S., and Smith, G. J. (2019). Mammut pacificus sp. nov., a newly recognized species of mastodon from the Pleistocene of western North America. PeerJ 7:e6614. doi: 10.7717/peerj.6614
Dyke, A. S., Moore, A., and Robertson, L. (2003). Deglaciation of North America, open file 1574’. Ottawa: Natural Resources Canada.
Elith, J., Kearney, M., and Phillips, S. (2010). The art of modelling range-shifting species. Methods Ecol. Evol. 1, 330–342.
Elith, J., and Leathwick, J. R. (2009). Species distribution models: Ecological explanation and prediction across space and time. Annu. Rev. Ecol. Evol. Syst. 40, 677–697. doi: 10.1146/annurev.ecolsys.110308.120159
Elith, J., Phillips, S. J., Hastie, T., Dudík, M., Chee, Y. E., and Yates, C. J. (2011). A statistical explanation of MaxEnt for ecologists. Divers. Distrib. 17, 43–57.
Enk, J., Devault, A., Widga, C., Saunders, J., Szpak, P., Southon, J., et al. (2016). Mammuthus population dynamics in late pleistocene North America: Divergence, phylogeography, and introgression. Front. Ecol. Evol. 4:42. doi: 10.3389/fevo.2016.00042
Fagan, D. A., Oosterhuis, J. E., and Roocroft, A. (1999). Significant dental disease in elephants. Verh. Ber. Erkrg. Zootiere 39, 15–133.
Fritz, H., Duncan, P., Gordon, I. J., and Illius, A. W. (2002). Megaherbivores influence trophic guilds structure in African ungulate communities. Oecologia 131, 620–625. doi: 10.1007/s00442-002-0919-3
Gill, J. L., Williams, J. W., Jackson, S. T., Lininger, K. B., and Robinson, G. S. (2009). Pleistocene megafaunal collapse, novel plant communities, and enhanced fire regimes in North America. Science 326, 1100–1103. doi: 10.1126/science.1179504
Gladstone-Gallagher, R. V., Pilditch, C. A., Stephenson, F., and Thrush, S. F. (2019). Linking traits across ecological scales determines functional resilience. Trends Ecol. Evol. 34, 1080–1091. doi: 10.1016/j.tree.2019.07.010
Graham, R. W., Lundelius, E. L., and Meissner, L. (2013). “Friesenhahn cave: Late pleistocene paleoecology and predator-prey relationships of mammoths with an extinct scimitar cat,” in Late cretaceous to quaternary strata and fossils of Texas: Field excursions celebrating 125 years of GSA and Texas geology, GSA South-central section meeting, Austin, Texas, April 2013, eds B. B. Hunt and E. J. Catlos (Boulder, CO: Geological Society of America), 15–31. doi: 10.1130/2013.0030(02
Green, J. L., DeSantis, L. R. G., and Smith, G. J. (2017). Regional variation in the browsing diet of pleistocene Mammut americanum (Mammalia, Proboscidea) as recorded by dental microwear textures. Palaeogeogr. Palaeoclimatol. Palaeoecol. 487, 59–70. doi: 10.1016/j.palaeo.2017.08.019
Grimm, E. C., Jacobson, G. L. Jr., Watts, W. A., Hansen, B. C., and Maasch, K. A. (1993). A 50,000-year record of climate oscillations from Florida and its temporal correlation with the Heinrich events. Science 261, 198–200. doi: 10.1126/science.261.5118.198
Grine, F. E. (1986). Dental evidence for dietary differences in Australopithecus and Paranthropus: A quantitative analysis of permanent molar microwear. J. Hum. Evol. 15, 783–822. doi: 10.1016/S0047-2484(86)80010-0
Hamilton, M. J., and Buchanan, B. (2007). Spatial gradients in Clovis-age radiocarbon dates across North America suggest rapid colonization from the north. Proc. Natl. Acad. Sci. U.S.A. 104, 15625–15630. doi: 10.1073/pnas.0704215104
Hedberg, C. P., Lyons, S. K., and Smith, F. A. (2022). The hidden legacy of megafaunal extinction: Loss of functional diversity and resilience over the Late Quaternary at Hall’s Cave. Glob. Ecol. Biogeogr. 31, 294–307. doi: 10.1111/geb.13428
Hoppe, K. A. (2004). Late Pleistocene mammoth herd structure, migration patterns, and Clovis hunting strategies inferred from isotopic analyses of multiple death assemblages. Paleobiology 30, 129–145.
Hoppe, K. A., and Koch, P. L. (2006). “The biogeochemistry of the Aucilla river fauna,” in First floridians and last mastodons: The page-ladson site in the Aucilla river, ed. S. D. Webb (Dordrecht: Springer Netherlands), 379–401.
Janis, C. M. (1995). “Correlations between craniodental morphology and feeding behavior in ungulates: Reciprocal illumination between living and fossil taxa,” in Functional morphology in vertebrate paleontology, ed. J. J. Thomasson (Cambridge: Cambridge University Press), 76–98.
Janis, C. M., and Ehrhardt, D. (1988). Correlation of relative muzzle width and relative incisor width with dietary preference in ungulates. Zool. J. Linn. Soc. 92, 267–284. doi: 10.1111/j.1096-3642.1988.tb01513.x
Karger, D. N., Conrad, O., Böhner, J., Kawohl, T., Kreft, H., Soria-Auza, R. W., et al. (2017). Climatologies at high resolution for the earth’s land surface areas. Sci. Data 4:170122. doi: 10.1038/sdata.2017.122
Karpinski, E., Hackenberger, D., Zazula, G., Widga, C., Duggan, A. T., Golding, G. B., et al. (2020). American mastodon mitochondrial genomes suggest multiple dispersal events in response to Pleistocene climate oscillations. Nat. Commun. 11:4048. doi: 10.1038/s41467-020-17893-z
Kass, J. M., Muscarella, R., Galante, P. J., Bohl, C. L., Pinilla-Buitrago, G. E., Boria, R. A., et al. (2021). ENMeval 2.0: Redesigned for customizable and reproducible modeling of species’ niches and distributions. Methods Ecol. Evol. 12, 1602–1608. doi: 10.1111/2041-210X.13628
Koch, P. L., Diffenbaugh, N. S., and Hoppe, K. A. (2004). The effects of late Quaternary climate and pCO2 change on C4 plant abundance in the south-central United States. Palaeogeogr. Palaeoclimatol. Palaeoecol. 207, 331–357. doi: 10.1016/j.palaeo.2003.09.034
Koch, P. L., Hoppe, K. A., and Webb, S. D. (1998). The isotopic ecology of late Pleistocene mammals in North America, Part 1: Florida. Chem. Geol. 152, 119–138. doi: 10.1016/S0009-2541(98)00101-6
Kohli, B. A., and Jarzyna, M. A. (2021). Pitfalls of ignoring trait resolution when drawing conclusions about ecological processes. Glob. Ecol. Biogeogr. 30, 1139–1152. doi: 10.1111/geb.13275
Kohn, M. J. (2010). Carbon isotope compositions of terrestrial C3 plants as indicators of (paleo)ecology and (paleo)climate. Proc. Natl. Acad. Sci. U.S.A. 107, 19691–19695. doi: 10.1073/pnas.1004933107
Koirala, R. K., Raubenheimer, D., Aryal, A., Pathak, M. L., and Ji, W. (2016). Feeding preferences of the Asian elephant (Elephas maximus) in Nepal. BMC Ecol. 16:54. doi: 10.1186/s12898-016-0105-9
Lee-Yaw, J., McCune, J., Pironon, S., and Sheth, S. (2022). Species distribution models rarely predict the biology of real populations. Ecography 2022:e05877. doi: 10.1111/ecog.05877
Legendre, P. (1993). Spatial autocorrelation: Trouble or new paradigm? Ecology 74, 1659–1673. doi: 10.2307/1939924
Leibold, M. A. (1995). The niche concept revisited: Mechanistic models and community context. Ecology 76, 1371–1382.
Lepper, B. T., Frolking, T. A., Fisher, D. C., Goldstein, G., Sanger, J. E., Wymer, D. A., et al. (1991). Intestinal contents of a late Pleistocene mastodont from midcontinental North America. Quat. Res. 36, 120–125. doi: 10.1016/0033-5894(91)90020-6
Lundelius, E. L. Jr., Thies, K. J., Graham, R. W., Bell, C. J., Smith, G. J., and DeSantis, L. R. G. (2019). Proboscidea from the big cypress creek fauna, Deweyville formation, Harris County, Texas. Quat. Int. 530-531, 59–68. doi: 10.1016/j.quaint.2019.11.018
Lyons, S. K., Smith, F. A., and Brown, J. H. (2004). Of mice, mastodons and men: Human-mediated extinctions on four continents. Evol. Ecol. Res. 6, 339–358.
Macarthur, R., and Levins, R. (1967). The limiting similarity, convergence, and divergence of coexisting species. Am. Nat. 101, 377–385. doi: 10.1086/282505
MacFadden, B. J., and Cerling, T. E. (1996). Mammalian herbivore communities, ancient feeding ecology, and carbon isotopes: A 10 million-year sequence from the Neogene of Florida. J. Vertebr. Paleontol. 16, 103–115.
Macfadden, B. J., Cerling, T. E., Harris, J. M., and Prado, J. (1999). Ancient latitudinal gradients of C3/C4 grasses interpreted from stable isotopes of new world pleistocene horse (Equus) teeth. Glob. Ecol. Biogeogr. 8, 137–149.
MacFadden, B. J., Solounias, N., and Cerling, T. E. (1999). Ancient diets, ecology, and extinction of 5-million-year-old horses from Florida. Science 283, 824–827.
Maglio, V. J. (1972). Evolution of mastication in the Elephantidae. Evolution 26, 638–658. doi: 10.1111/j.1558-5646.1972.tb01970.x
Maguire, B. (1973). Niche response structure and the analytical potentials of its relationship to the habitat. Am. Nat. 107, 213–246. doi: 10.1086/282827
Maguire, K. C., and Stigall, A. L. (2009). Using ecological niche modeling for quantitative biogeographic analysis: A case study of Miocene and Pliocene Equinae in the Great Plains. Paleobiology 35, 587–611. doi: 10.1666/0094-8373-35.4.587
Malhi, Y., Doughty, C. E., Galetti, M., and Terborgh, J. W. (2016). Megafauna and ecosystem function from the Pleistocene to the Anthropocene. Proc. Natl. Acad. Sci. U.S.A. 113, 838–846. doi: 10.1073/pnas.1502540113
Marcer, A., Sáez, L., Molowny-Horas, R., Pons, X., and Pino, J. (2013). Using species distribution modelling to disentangle realised versus potential distributions for rare species conservation. Biol. Conserv. 166, 221–230. doi: 10.1016/j.biocon.2013.07.001
Martínez-Meyer, E., Peterson, A. T., and Hargrove, W. W. (2004). Ecological niches as stable distributional constraints on mammal species, with implications for pleistocene extinctions and climate change projections for biodiversity. Glob. Ecol. Biogeogr. 13, 305–314.
Mellert, K. H., Fensterer, V., Küchenhoff, H., Reger, B., Kölling, C., Klemmt, H. J., et al. (2011). Hypothesis-driven species distribution models for tree species in the Bavarian Alps. J. Veg. Sci. 22, 635–646. doi: 10.1111/j.1654-1103.2011.01274.x
Mendoza, M., Janis, C. M., and Palmqvist, P. (2002). Characterizing complex craniodental patterns related to feeding behaviour in ungulates: A multivariate approach. J. Zool. 258, 223–246. doi: 10.1017/S0952836902001346
Metcalfe, J. Z., Longstaffe, F. J., Ballenger, J. A., and Haynes, C. V. Jr. (2011). Isotopic paleoecology of Clovis mammoths from Arizona. Proc. Natl. Acad. Sci. U.S.A. 108, 17916–17920. doi: 10.1073/pnas.1113881108
Newsom, L. A., and Mihlbachler, M. C. (2006). “Mastodons (Mammut americanum) diet foraging patterns based on analysis of dung deposits,” in First floridians and last mastodons: The page-ladson site in the Aucilla river, ed. S. D. Webb (Dordrecht: Springer Netherlands), 263–331. doi: 10.1007/978-1-4020-4694-0_10
Owen-Smith, R. N. (1992). Megaherbivores: The influence of very large body size on ecology. Cambridge: Cambridge University Press.
Pardi, M. I., and DeSantis, L. R. G. (2021). Dietary plasticity of North American herbivores: A synthesis of stable isotope data over the past 7 million years. Proc. R. Soc. B Biol. Sci. 288:20210121. doi: 10.1098/rspb.2021.0121
Pardi, M. I., and Smith, F. A. (2016). Biotic responses of canids to the terminal Pleistocene megafauna extinction. Ecography 39, 141–151. doi: 10.1111/ecog.01596
Paruelo, J. M., and Lauenroth, W. K. (1996). Relative abundance of plant functional types in grasslands and shrublands of North America. Ecol. Appl. 6, 1212–1224. doi: 10.2307/2269602
Pendleton, D. E., Sullivan, P. J., Brown, M. W., Cole, T. V. N., Good, C. P., Mayo, C. A., et al. (2012). Weekly predictions of North Atlantic right whale Eubalaena glacialis habitat reveal influence of prey abundance and seasonality of habitat preferences. Endanger. Species Res. 18, 147–161.
Peterson, A. T., Navarro-Sigüenza, A. G., and Gordillo, A. (2018). Assumption-versus data-based approaches to summarizing species’ ranges. Conserv. Biol. 32, 568–575. doi: 10.1111/cobi.12801
Phillips, S. J., and Dudík, M. (2008). Modeling of species distributions with Maxent: New extensions and a comprehensive evaluation. Ecography 31, 161–175.
Phillips, S. J., Dudík, M., and Schapire, R. E. (2020). Maxent software for modeling species niches and distributions (Version 3.4.3). Available Online at: http://biodiversityinformatics.amnh.org/open_source/maxent/ (accessed October 26, 2022).
R Core Team (2022). R: A language and environment for statistical computing. Vienna: R Foundation for Statistical Computing.
Reimer, P. J., Austin, W. E. N., Bard, E., Bayliss, A., Blackwell, P. G., Bronk Ramsey, C., et al. (2020). The IntCal20 northern hemisphere radiocarbon age calibration curve (0–55 cal kBP). Radiocarbon 62, 725–757. doi: 10.1017/RDC.2020.41
Rivals, F., Solounias, N., and Mihlbachler, M. C. (2007). Evidence for geographic variation in the diets of late Pleistocene and early Holocene Bison in North America, and differences from the diets of recent Bison. Quat. Res. 68, 338–346. doi: 10.1016/j.yqres.2007.07.012
Rule, S., Brook, B. W., Haberle, S. G., Turney, C. S., Kershaw, A. P., and Johnson, C. N. (2012). The aftermath of megafaunal extinction: Ecosystem transformation in pleistocene Australia. Science 335, 1483–1486. doi: 10.1126/science.1214261
Scott, J. R. (2012). Dental microwear texture analysis of extant African Bovidae. Mammalia 76, 157–174. doi: 10.1515/mammalia-2011-0083
Scott, R. S., Ungar, P. S., Bergstrom, T. S., Brown, C. A., Childs, B. E., Teaford, M. F., et al. (2006). Dental microwear texture analysis: Technical considerations. J. Hum. Evol. 51, 339–349. doi: 10.1016/j.jhevol.2006.04.006
Scott, R. S., Ungar, P. S., Ungar, T. S., Brown, C. A., Grine, F. E., Teaford, M. F., et al. (2005). Dental microwear texture analysis shows within-species diet variability in fossil hominins. Nature 436, 693–695. doi: 10.1038/nature03822
Secord, R., Bloch, J. I., Chester, S. G., Boyer, D. M., Wood, A. R., Wing, S. L., et al. (2012). Evolution of the earliest horses driven by climate change in the paleocene-eocene thermal maximum. Science 335, 959–962. doi: 10.1126/science.1213859
Severinghaus, J. P., Sowers, T., Brook, E. J., Alley, R. B., and Bender, M. L. (1998). Timing of abrupt climate change at the end of the Younger Dryas interval from thermally fractionated gases in polar ice. Nature 391, 141–146.
Shane, L. C. K. (1987). Late-glacial vegetational and climatic history of the Allegheny Plateau and the Till Plains of Ohio and Indiana, U.S.A. Boreas 16, 1–20. doi: 10.1111/j.1502-3885.1987.tb00750.x
Shcheglovitova, M., and Anderson, R. P. (2013). Estimating optimal complexity for ecological niche models: A jackknife approach for species with small sample sizes. Ecol. Modell. 269, 9–17. doi: 10.1016/j.ecolmodel.2013.08.011
Smith, G. J., and DeSantis, L. R. G. (2018). Dietary ecology of Pleistocene mammoths and mastodons as inferred from dental microwear textures. Palaeogeogr. Palaeoclimatol. Palaeoecol. 492, 10–25. doi: 10.1016/j.palaeo.2017.11.024
Smith, G. J., and DeSantis, L. R. G. (2020). Extinction of North American Cuvieronius (Mammalia: Proboscidea: Gomphotheriidae) driven by dietary resource competition with sympatric mammoths and mastodons. Paleobiology 46, 41–57. doi: 10.1017/pab.2020.7
Sukumar, R., Bhattacharya, S. K., and Krishnamurthy, R. V. (1987). Carbon isotopic evidence for different feeding patterns in an Asian elephant population. Curr. Sci. 56, 11–14.
Surovell, T., Waguespack, N., and Brantingham, P. J. (2005). Global archaeological evidence for proboscidean overkill. Proc. Natl. Acad. Sci. U.S.A. 102, 6231–6236. doi: 10.1073/pnas.0501947102
Surovell, T. A., Pelton, S. R., Anderson-Sprecher, R., and Myers, A. D. (2016). Test of Martin’s overkill hypothesis using radiocarbon dates on extinct megafauna. Proc. Natl. Acad. Sci. U.S.A. 113, 886–891. doi: 10.1073/pnas.1504020112
Svenning, J.-C., Pedersen, P. B., Donlan, C. J., Ejrnæs, R., Faurby, S., Galetti, M., et al. (2016). Science for a wilder Anthropocene: Synthesis and future directions for trophic rewilding research. Proc. Natl. Acad. Sci. U.S.A. 113, 898–906. doi: 10.1073/pnas.1502556112
Teeri, J. A., and Stowe, L. G. (1976). Climatic patterns and the distribution of C4 grasses in North America. Oecologia 23, 1–12.
Ungar, P. S., Brown, C. A., Bergstrom, T. S., and Walkers, A. (2003). Quantification of dental microwear by tandem scanning confocal microscopy and scale-sensitive fractal analyses. Scanning 25, 185–193. doi: 10.1002/sca.4950250405
Vetter, L. (2007). Paleoecology of Pleistocene megafauna in Southern Nevada, USA: Isotopic evidence for browsing on halophytic plants. Master’s thesis. Reno, NV: University of Nevada.
Violle, C., Enquist, B. J., McGill, B. J., Jiang, L., Albert, C. H., Hulshof, C., et al. (2012). The return of the variance: Intraspecific variability in community ecology. Trends Ecol. Evol. 27, 244–252. doi: 10.1016/j.tree.2011.11.014
Wang, Y., Goring, S. J., and McGuire, J. L. (2019). Bayesian ages for pollen records since the last glaciation in North America. Sci. Data 6:176. doi: 10.1038/s41597-019-0182-7
Wang, Y., Widga, C., Graham, R. W., McGuire, J. L., Porter, W., Wårlind, D., et al. (2021). Caught in a bottleneck: Habitat loss for woolly mammoths in central North America and the ice-free corridor during the last deglaciation. Glob. Ecol. Biogeogr. 30, 527–542. doi: 10.1111/geb.13238
Watts, W. A., Hansen, B. C., and Grimm, E. C. (1992). Camel Lake: A 40 000-yr record of vegetational and forest history from northwest Florida. Ecology 73, 1056–1066.
Weng, C., and Jackson, S. T. (1999). Late glacial and Holocene vegetation history and paleoclimate of the Kaibab Plateau, Arizona. Palaeogeogr. Palaeoclimatol. Palaeoecol. 153, 179–201. doi: 10.1016/S0031-0182(99)00070-X
Whittaker, R. H. (1967). Gradient analysis of vegetation. Biol. Rev. 42, 207–264. doi: 10.1111/j.1469-185X.1967.tb01419.x
Widga, C., Hodgins, G., Kolis, K., Lengyel, S., Saunders, J., Walker, J. D., et al. (2021). Life histories and niche dynamics in late Quaternary proboscideans from Midwestern North America. Quat. Res. 100, 224–239. doi: 10.1017/qua.2020.85
Keywords: carbon, Maxent, Mammuthus, Mammut, stable isotope analysis (SIA), dental microwear texture analysis (DMTA)
Citation: Pardi MI and DeSantis LRG (2022) Interpreting spatially explicit variation in dietary proxies through species distribution modeling reveals foraging preferences of mammoth (Mammuthus) and American mastodon (Mammut americanum). Front. Ecol. Evol. 10:1064299. doi: 10.3389/fevo.2022.1064299
Received: 08 October 2022; Accepted: 09 November 2022;
Published: 25 November 2022.
Edited by:
Anna Maria Mercuri, University of Modena and Reggio Emilia, ItalyReviewed by:
Juan López Cantalapiedra, Museum of Natural History Berlin (MfN), GermanyEllen Schulz-Kornas, University of Leipzig, Germany
Copyright © 2022 Pardi and DeSantis. This is an open-access article distributed under the terms of the Creative Commons Attribution License (CC BY). The use, distribution or reproduction in other forums is permitted, provided the original author(s) and the copyright owner(s) are credited and that the original publication in this journal is cited, in accordance with accepted academic practice. No use, distribution or reproduction is permitted which does not comply with these terms.
*Correspondence: Melissa I. Pardi, melissa.pardi@illinois.gov