SVD Entropy Reveals the High Complexity of Ecological Networks
 Tanya Strydom
 Giulio V. Dalla Riva3†
  Timothée Poisot
- 1Département de Sciences Biologiques, Université de Montréal, Montreal, QC, Canada
- 2Québec Centre for Biodiversity Sciences, Montreal, QC, Canada
- 3School of Mathematics and Statistics, University of Canterbury, Christchurch, New Zealand
Quantifying the complexity of ecological networks has remained elusive. Primarily, complexity has been defined on the basis of the structural (or behavioural) complexity of the system. These definitions ignore the notion of “physical complexity,” which can measure the amount of information contained in an ecological network, and how difficult it would be to compress. We present relative rank deficiency and SVD entropy as measures of “external” and “internal” complexity, respectively. Using bipartite ecological networks, we find that they all show a very high, almost maximal, physical complexity. Pollination networks, in particular, are more complex when compared to other types of interactions. In addition, we find that SVD entropy relates to other structural measures of complexity (nestedness, connectance, and spectral radius), but does not inform about the resilience of a network when using simulated extinction cascades, which has previously been reported for structural measures of complexity. We argue that SVD entropy provides a fundamentally more “correct” measure of network complexity and should be added to the toolkit of descriptors of ecological networks moving forward.
1. Introduction
Ecologists have turned to network theory because it offers a powerful mathematical formalism to embrace the complexity of ecological communities (Bascompte and Jordano, 2007). Indeed, analysing ecological systems as networks highlighted how their structure ties into ecological properties and processes (Proulx et al., 2005; Poulin, 2010), and there has been a subsequent explosion of measures that purport to capture elements of network structure, to be related to the ecology of the system they describe (Delmas et al., 2018). Since the early days of network ecology, ecological networks have been called “complex.” This sustained interest for the notion of complexity stems, in part, from the strong ties it has to stability (Landi et al., 2018). As such, many authors have looked for clues, in the network structure, as to why the networks do not collapse (Brose et al., 2006; Staniczenko et al., 2013; Borrelli, 2015; Gravel et al., 2016). Yet decades of theoretical refinements on the relationship between complexity and stability had a hard time when rigorously tested on empirical datasets (Jacquet et al., 2016); although ecological networks may be complex, our current measures of complexity do not translate into predictions about stability.
Surprisingly, complexity itself has proven an elusive concept to define in a rigorous way. It has over time been defined as connectance (Rozdilsky and Stone, 2001), as measures of the diversity of species or their interactions (Landi et al., 2018), or as a combination of species richness and trophic diversity (Duffy et al., 2007). In short, network ecology as a field readily assumes that because we have more information about a system, or because this system has more components, or simply because this system can be expressed as a network, it follows that the system is complex. But such a diversity of definitions, for a concept that is so central to our quest to understand network stability, decreases the clarity of what complexity means, and what all of these alternative definitions do actually capture. This is a common thread in some measures of ecological network structure, as has been discussed at length for the various definitions of nestedness (Ulrich et al., 2009).
None of the previous definitions of complexity are formally wrong, in that they do capture an aspect of complexity that ultimately ties to the behaviour of the system, i.e., its low predictability over time. Yet Adami (2002) provides a compelling argument for why the complexity of the behaviour does not necessarily reflects the complexity of the system; in fact, one would be very hard pressed to think of a more simple system than the logistic map used by May (1976) to illustrate how easily complexity of behaviour emerges. Rather than yielding to the easy assumption that a system will be complex because it has many parts, or because it exhibits a complex behaviour, Adami (2002) suggests that we focus on measuring “physical complexity,” i.e., the amount of information required to encode the system, and how much signal this information contains. Complex systems, in this perspective, are those who cannot easily be compressed—and this is a notion we can explore for the structure of ecological networks.
Ecological networks are primarily represented by their adjacency matrices, i.e., a matrix in which every entry represents a pair of species, which can take a value of 1 when the two species interact, and a value of 0 when they do not. These matrices (as any matrices) can easily be factorised using Singular Value Decomposition (Forsythe and Moler, 1967; Golub and Reinsch, 1971), which offers two interesting candidate measures of complexity for ecological networks (both of which we describe at length in the methods). The first measure is the rank of the matrix, which works as an estimate of “external complexity,” in that it describes the dimension of the vector space of this matrix, and therefore the number of linearly independent rows (or columns) of it. From an ecological standpoint, this quantifies the number of unique “strategies” represented in the network: a network with two modules that are distinct complete graphs has a rank of 2. The second measure is an application of the entropy measure of Shannon (1948) to the non-zero singular values of the matrix obtained through SVD. This so-called SVD entropy measures the extent to which each rank encodes an equal amount of information, as the singular values capture the importance of each rank to reconstruct the original matrix; this approach therefore serves as a measure of “internal complexity.”
In this manuscript, we present and evaluate the use of both the rank and SVD entropy of ecological networks as alternative and more robust measures of complexity when compared to traditional approaches to defining complexity. This is done by using a collection of 220 bipartite networks from various types of interaction, sizes, connectances, and environments. We show that while the rank of the adjacency matrix holds little information, SVD entropy functions as an appropriate quantification of the complexity of ecological systems. Notably, SVD entropy is an intuitive, robust, non-structural approach to defining the (surprisingly high) complexity of ecological networks, by relating them to their “physical” as opposed to “behavioural” complexity. In this process we showcase a breakdown in the assumption that all measures of complexity of networks are indicative of their robustness to extinctions. Finally, we show that, despite their high complexity, observed networks are less complex when compared to pseudo-random networks, especially for larger networks. We propose that taking a physical approach to quantifying the complexity of ecological networks is a step in the right direction to unifying how we define complexity in the context of ecological networks, as it restores other measures (like connectance and nestedness) to their original role and signification.
2. Data and Methods
We used all bipartite networks contained in the web-of-life.es database. This database extracted species interaction networks from supplementary materials across all inhabited continents and covers a large array of sampling years, environments, organisms, and sampling methodologies. As such, this dataset is particularly suited to describe general trends across all ecological networks. We specifically worked on the version of this dataset distributed with the EcologicalNetworks.jl package (Poisot et al., 2019) for the Julia (Bezanson et al., 2017) programming language, in which all analyses were conducted. Using bipartite networks means that interacting species are split into two sets (or interacting groups) and along different dimensions in the interaction matrix. Thus, columns in the matrix represent one group (or type) of species and rows represent the other group of species involved in the interaction. Because SVD gives similar results on the matrix and its transpose, it captures the complexity of both sides of the system at once. A summary of the dataset is given in Table 1.
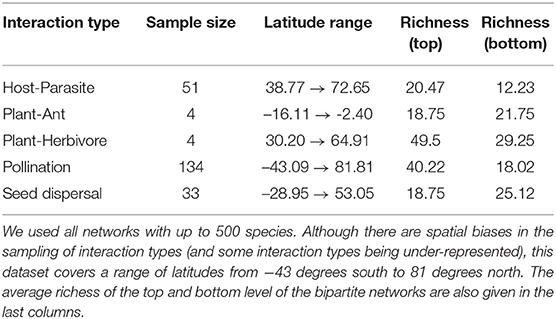
Table 1. Overview of the web-of-life.es dataset.
2.1. Estimating Complexity With Rank Deficiency
The rank of A (noted as r = rk(A)) is the dimension of the vector space spanned by the matrix and corresponds to the number of linearly independent rows or columns; therefore, the maximum rank of a matrix (M = rkmax(A)) will always be equal to the length of the shortest dimension of A, which ecologically speaking is the richness of the least species-rich compartment of the bipartite network (or the richness in the case of unipartite networks). A matrix is “full-ranked” when r = M, i.e., all of its rows/columns are unique. Matrices that are not full-ranked are called rank deficient, and we can measure rank deficiency using d = M−r. So as to control for the difference in species richness of the different networks, we report the relative rank deficiency, i.e., expressed as a ratio between rank deficiency and the maximal rank:
This measure returns values between 0 (the matrix is full ranked) and 1−M−1≈1 (the matrix has rank 1). This serves as a coarse estimate of complexity, as the more unique columns/rows are in the matrix, the larger this value will be. Yet it may also lack sensitivity, because it imposes a stringent test on uniqueness, which calls for more quantitative approaches to complexity.
2.2. Estimating Complexity With SVD Entropy
Singular Value Decomposition (SVD) is the factorisation of a matrix A (where Am, n∈B in our case, but SVD works for matrices of real numbers as well) into the form U·Σ·VT. Where U is an m × m orthogonal matrix and V an n × n orthogonal matrix. The columns in these matrices are, respectively, the left- and right-singular vectors of A, were U = AAT and V = ATA. Σ is a matrix that only contains non-negative σ values along its diagonal and all other entries are zero. Where σi = Σii, which contains the singular values of A. When the values of σ are arranged in descending order, the singular values (Σ) are unique, though the singular vectors (U and V) may not be.
After the Eckart-Young-Mirsky theorem (Eckart and Young, 1936; Golub et al., 1987), the number of non-zero entries (after rounding of small values if required due to numerical precision issues in computing the factorisation) in σ is the rank of matrix A. For the sake of simplicity in notation, we will use k = rk(A)) for the rank of the matrix. Because only the first k elements of σ are non-zero, and that the result of the SVD is a simple matrix multiplication, one can define a truncated SVD containing only the first k singular values.
Intuitively, the singular value i (σi) measures how much of the dataset is (proportionally) explained by each vector—therefore, one can measure the entropy of σ following Shannon (1948). High values of SVD entropy reflects that all vectors are equally important, i.e., that the structure of the ecological network cannot efficiently be compressed, and therefore indicates high complexity (Gu and Shao, 2016). Because networks have different dimensions, we use Pielou's evenness (Pielou, 1975) to ensure that values are lower than unity, and quantify SVD entropy, using si = σi/sum(σ) as:
3. Results and Discussion
3.1. Most Ecological Networks Are Close to Full-Rank
The majority (63% of our dataset) of bipartite ecological networks have a relative rank deficiency of 0 (Figure 1), which indicates that all species have different and unique interaction lists. Interestingly, the networks that had a comparatively larger relative rank deficiency tended to be smaller ones. Yet because most of the networks return the same value, matrix rank does not appear to be a useful or discriminant measure of network complexity. Another striking result (from Figure 1) is that the SVD entropy of ecological networks is really large—although the value can range from 0 to 1, all ecological networks had SVD entropy larger than 0.8, which is indicative of a strong complexity.
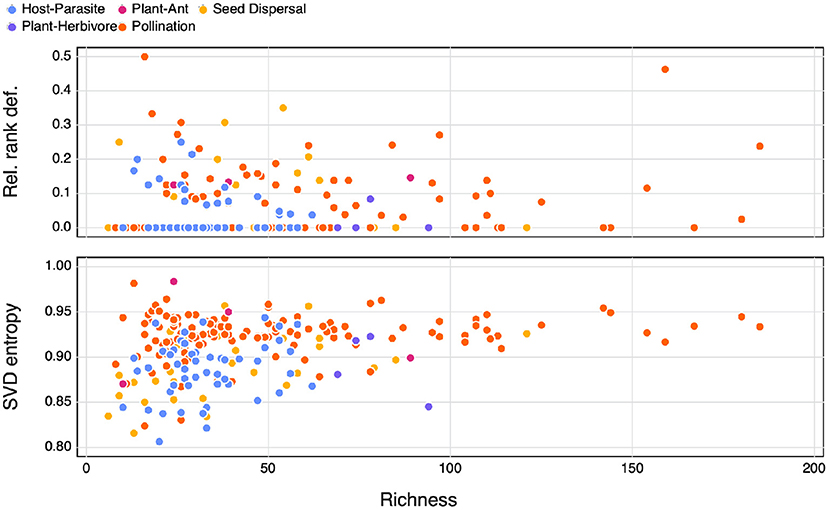
Figure 1. The relationship between network richness and relative rank deficiency, and SVD entropy. The different types of interactions are indicated by the colours.
As expected following the observation that ecological networks are overwhelmingly full ranked, we do not see a relationship between SVD entropy and relative rank deficiency, neither do we observe differences between interaction types (Figure 2). Based on these results, we feel confident that SVD entropy provides a more informative measure of the complexity of ecological networks, and will use it moving forward.
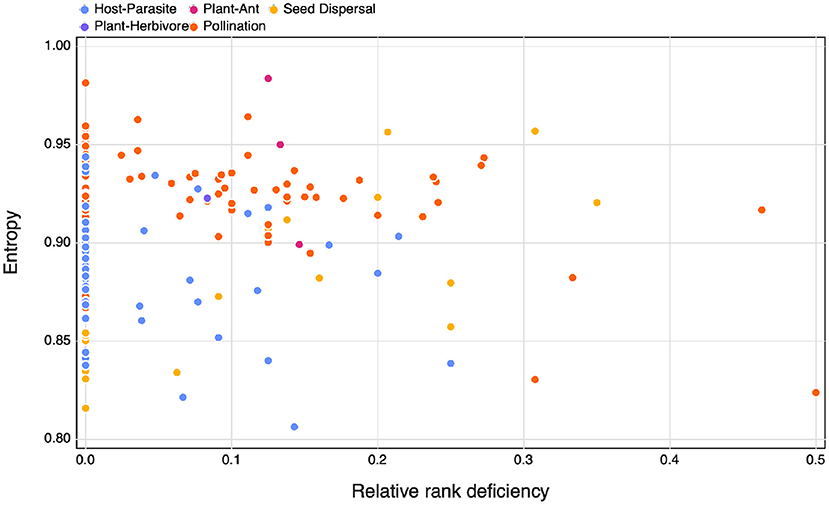
Figure 2. The relationship between SVD entropy and the relative rank deficiency of different species interaction networks colours indicate the different interaction types of the networks.
3.2. Most Elements of Network Structure Capture Network Complexity
We compared SVD entropy to some of the more common measures of complexity, namely nestedness (η, as per Bastolla et al., 2009), connectance (Co), and the spectral radius of the network (ρ, following Staniczenko et al., 2013). All of these measures are positively correlated, especially over the range of connectances covered by empirical bipartite ecological networks.
Nestedness is calculated based on the number of interactions shared between species pairs and is a measure of the degree of overlap between species links (or strategies) in the community, where larger assemblages are made up of a subset of smaller ones that share common interactions. Networks with a higher degree of nestedness could be considered simpler when compared to networks with a lower degree of nestedness. Connectance is the realised number of interactions (links) in an ecological network and is calculated as the fraction of the total number of realised interactions (or links) and the maximum number of possible interactions in a network (Martinez, 1992). This has been shown to be a good estimate of a community's resilience to perturbation (Dunne et al., 2002). The spectral radius of a matrix is the largest absolute value of its eigenvalues, which, in addition to being presented as a measure of network complexity has also been suggested as an indicator of the ability of a system to dampen disturbances (Phillips, 2011).
We find that SVD entropy has a clear negative relationship with nestedness, spectral radius, and connectance (Figure 3). As in Figure 4, mutualistic networks tend to be more complex, and they also are both sparser and less nested than other types of networks. Bastolla et al. (2009) give a convincing demonstration that mutualistic networks are shaped to minimise competition—this can be done by avoiding to duplicate overlap in interactions, thereby resulting in a network that is close to full rank, and with high SVD entropy. Interestingly, Figure 3 suggests that both nestedness and connectance measure the lack of complexity in an ecological network, which contrasts to how they may commonly be viewed (Landi et al., 2018).
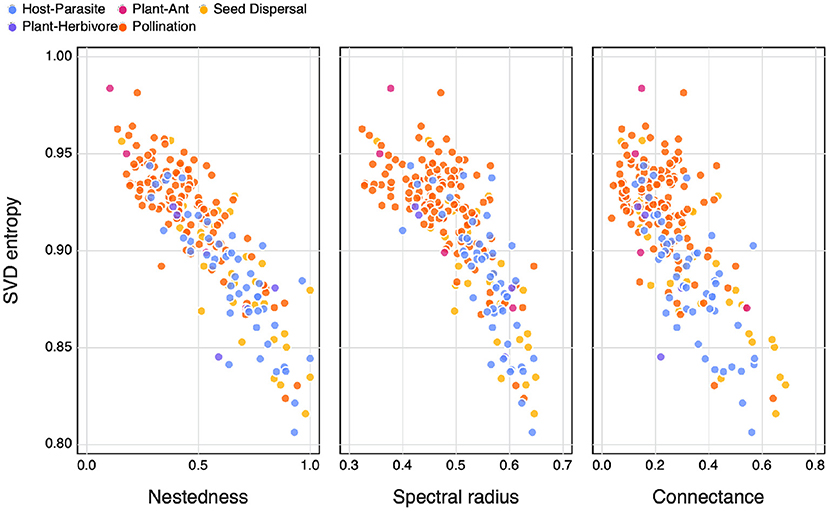
Figure 3. The relationship between SVD entropy and the nestedness (left), spectral radius (central) and connectance (right) of ecological networks. Colours indicate the different interaction types of the networks.
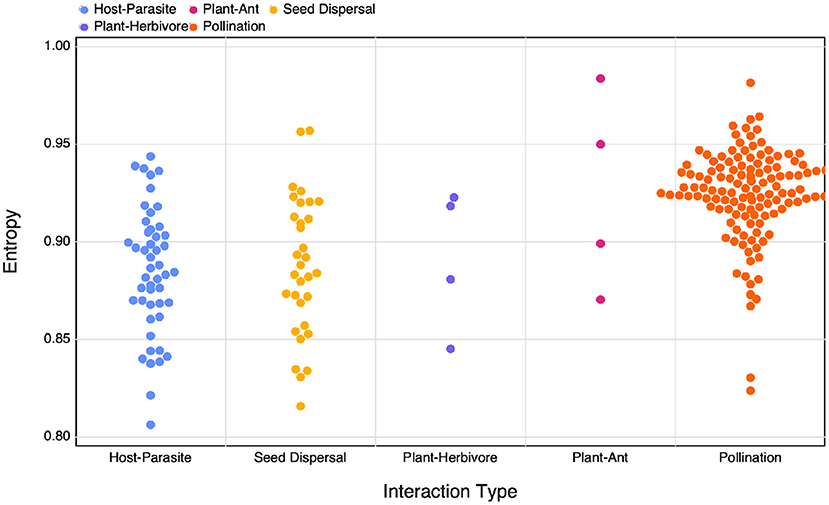
Figure 4. The calculated SVD entropy of different interaction networks of different interaction types.
3.3. Complex Networks Are Not More Robust to Extinction
One approach to calculating the overall structural robustness of an ecological network is by simulating extinction events through the sequential removal of species, which allows constructing an extinction curve that plots the relationship between species removed and cumulative secondary extinctions (Dunne et al., 2002; Memmott et al., 2004). Extinction events can be simulated in a manner of different ways, either by removing (1) a random individual, (2) systematically removing the most connected species (one with the highest number of interactions with other species), and (3) the least connected species (Dunne et al., 2002). After each extinction event, we remove species from the network that no longer have any interacting partners, thereby simulating secondary extinctions. This is then repeated until there are no species remaining in the network. Furthermore, we can restrict extinction events to only one dimension of the interaction matrix, i.e., removing only top-level or bottom-level species, or alternatively removing a species from any dimension of the matrix. Extinction curves are then constructed by plotting the proportion of species remaining against those that have been removed; it stands to reason that a flatter curve “maintains” its species pool for a longer number of cumulative extinctions, and could be seen as more resilient, when compared to a curve that has a much steeper decline. As per previous studies, we measure the robustness to extinction as the area under the extinction curve (AUC), calculated using the Trapezoidal rule. AUC values close to 0 means that a single extinction is enough to collapse the network almost entirely, and values close to 1 means that most species persist even when the number of extinctions is really high.
When looking at the relationship between SVD entropy and the area under an extinction curve (as a proxy for resilience to extinction) we find differences depending on both the extinction mechanism as well as along which dimension the species removal occurred (Figure 5). As a whole we do not observe any obvious relationships between SVD entropy and resilience, nor for different interaction types. We do however see differences in the resilience of networks depending on how the extinctions were simulated. Generally we see a higher resilience in networks where species of only a specific group are removed or in networks where species were either randomly removed or based on an increasing number of interactions.
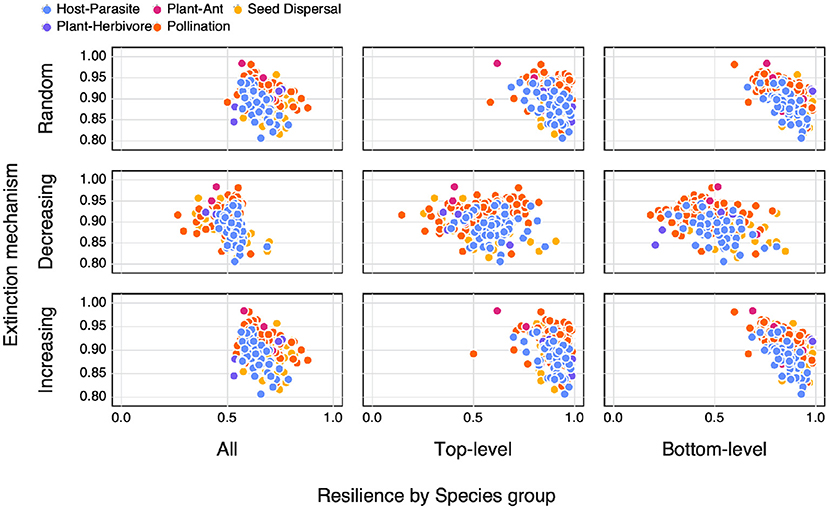
Figure 5. The relationship between SVD entropy and the area under an extinction curve (as a proxy for resilience to extinction) for both different extinction mechanisms (Random = the removal of a random species, Decreasing = the removal of species in order of decreasing number of interactions (i.e., most to least number of interactions), Increasing = the removal of species in order of increasing number of interactions) as well as along different dimensions (species groups) of the network (All = any species, Top-level = only top-level species, and Bottom-level = only bottom-level species) colours indicate the different interaction types of the networks.
As highlighted in Figure 3, SVD entropy can be used as an additional measure of network complexity. However, as shown in Figure 5, the assumption that network complexity begets resilience to extinction begins to unravel when we use a measure of physical complexity. This is in contrast to previous studies that have shown how connectance plays a role in the resilience of networks to extinctions (Dunne et al., 2002; Memmott et al., 2004). This does not discount the role of using structural measures of network complexity (e.g., connectance, nestedness, or spectreal radius) as indicators of their resilience (although possibly hinting as to why there is no strong emerging consensus as to how structural complexity relates to this), but rather points to an erroneous assumption as to what aspects of a network we have previously used to define its complexity.
3.4. Plant-Pollinator Networks Are Slightly More Complex
Although we don't observe clear differences in the relationship between different interaction types when comparing amongst various measures of complexity, we do find that different types of interaction networks have differing SVD entropies. When comparing calculated SVD entropy between interaction types using an ANOVA (after excluding Plant-Ant and Plant-Herbivore interactions due to their small sample size in our dataset) we find a significant difference between group means (F = 47.047, p < 10−3). A Tukey's HSD test reveals that plant-pollinator networks (μ = 0.924) are more complex than both host- parasite networks (μ = 0.885, p < 10−3) and seed dispersal (μ = 0.888, p < 10−3). Host-parasite and seed dispersal networks had apparently no difference in average complexity (p = 0.889). These results suggest that mutualistic networks may be more complex, which matches with previous litterature: these networks have been shown to minimise competition (Bastolla et al., 2009) and favour unique interactions, thereby increasing network complexity. This specific structure can appear as a side-process of either ecological (Maynard et al., 2018) or evolutionary (Valverde et al., 2018) processes, but nevertheless leaves a profound imprint on the complexity of the networks.
3.5. Connectance Constrains Complexity (But Also Rank Deficiency)
We used simulated annealing (Kirkpatrick, 1984) to generate networks with the highest, or lowest, possible SVD entropy values. From a set network size (30 species, 15 on each side) with a random number of interactions (spanning the entire range from minimally to maximally connected), we reorganised interactions until the SVD entropy was as close to 0 or 1 as possible. We repeated the process 25 times for every number of interactions. We also measured the relative rank deficiency of the generated networks. This allows identifying the boundaries of both measures of complexity. The specific simulated annealing we used is as follows. We set an initial temperature T0 = 2. At every timestep t (up until t = 104), the temperature is set to , so that is decays exponentially at a rate λ = 1−10−4. At each timestep, we switch two interactions in the network at random to generate a proposal network . The score of this proposal is the difference between the squared error of and i.e. , where f is the SVD entropy and θ is the target for optimisation (either 0 or 1 for, respectively minimally or maximally complex). A proposal is accepted with probability .
By exploring the minimal and maximal values of SVD entropy for networks of a given size, we can show that the range of complexity that a network can express varies as a function of connectance (Figure 6). As reported by Poisot and Gravel (2014), there is no variation when the networks are either minimally or maximally connected, but any connectance in between can give rise to networks of varying complexities. This being said—minimally connected networks always show the largest complexity, and an increase in connectance will always decrease complexity. Interestingly, this relationship is monotonous, and there is no peak of complexity where the maximal number of possible networks combination exists, i.e., around Co≈0.5 (Poisot and Gravel, 2014). This is an intriguing result—ecological networks are indeed extremely complex, but whereas ecologists have usually interpreted connectance as a measure of complexity, it is in fact sparse networks that are the complex ones, and connectance acts to decomplexify network structure.
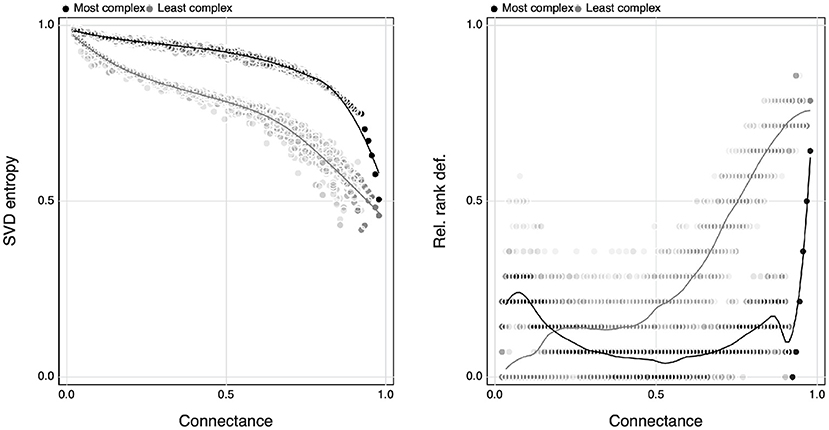
Figure 6. The relationship between the maximum and minimum value of SVD entropy of a collection of random interaction networks (using simulated annealing) for a given connectance spanning from 0 to 1 (left) and how this relates to the relative rank deficiency of networks (right).
The right panel of Figure 6 shows the average rank deficiency of networks for which SVD entropy was either maximised or minimised. Complex networks (meaning, maximally complex given their connectance) had a lower deficiency, indicating that except at extreme connectances, there are combinations of networks for which all species can interact in unique ways—this is a natural consequence of the results reported by Poisot and Gravel (2014), whereby the number of possible networks is only really constrained at the far ends of the connectance gradient. Minimally complex networks, on the other hand, saw their rank deficiency increase with connectance. This hints at the fact that the decrease in complexity with connectance may be primarily driven by the infeasibility of having enough species for them to all interact uniquely as connectance increases. Because non-unique interactions tend to result in competition (Bascompte and Jordano, 2007), this can “push” networks toward the full-rank configuration (as suggested by the results in Figure 1), thereby maximising complexity regardless of connectance.
3.6. Larger Networks Are Less Complex Than They Could Be
To assess whether ecological networks are more, or less, complex than expected, we applied two null models that generate pseudo-random networks: Type I (Fortuna and Bascompte, 2006), where interactions happen proportionally to connectance, and Type II (Bascompte et al., 2003), where interactions happen proportionally to the joint degree of the two species involved. The models are equivalent to, respectively, the Erdos-Renyi and Configuration models (Newman, 2010), both of which are maximum entropy generative models that reflect global (Type I) or local (Type II) constraints (Park and Newman, 2004). We generated 999 samples for every network in the dataset, and measured the z-score of the empirical network as
where xi is the SVD entropy of network i, and μi and σi are, respectively the average and standard deviation of the distribution of SVD entropy under the null model. Negative values of zi reflect a network that has lower entropy than expected under the assumptions of the null model. In Figure 7, we show that despite high absolute values of SVD entropy, ecological networks are not as complex as they could be. This is consistently true for both null models, and for the three types of networks that had a sufficient sample size.
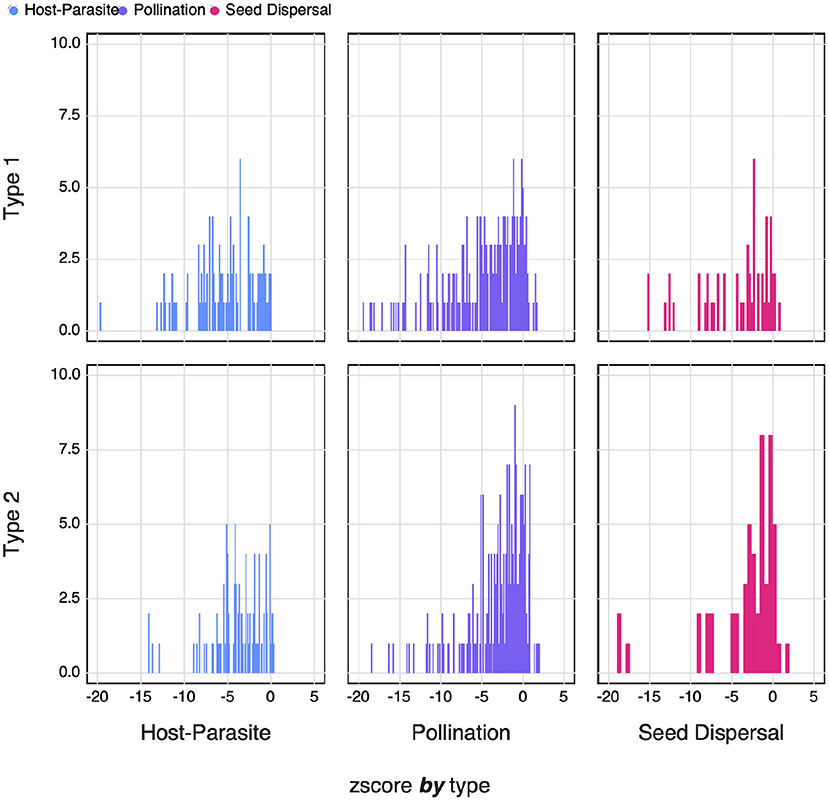
Figure 7. The counts of the zi-scores of different types of networks for both Type I and Type II null models. Negative zi-scores indicate networks with an SVD entropy that is lower i.e., less complex than expected.
Previous work on random networks (using a model that is essentially the Type I null model) shows that sufficiently large networks achieve maximal von Neuman entropy (Du et al., 2010; Passerini and Severini, 2011). In Figure 8, we compare the logistic of zi to the richness of the network. Transforming to the logistic smooths out differences in absolute value that are apparent in Figure 7, and projects the values in the unit range, with values above 0.5 being more complex than expected. It is quite obvious that, across both models and the three types of interactions, only smaller networks achieve higher entropy. Barbier et al. (2018) and Saravia et al. (2018) have previously noted that the early stages of network assembly usually result in severely constrained networks, due to the conditions required for multiple species to persist; as networks grow larger, these constraints may “relax,” leading in networks with more redundancy, and therefore a lower complexity.
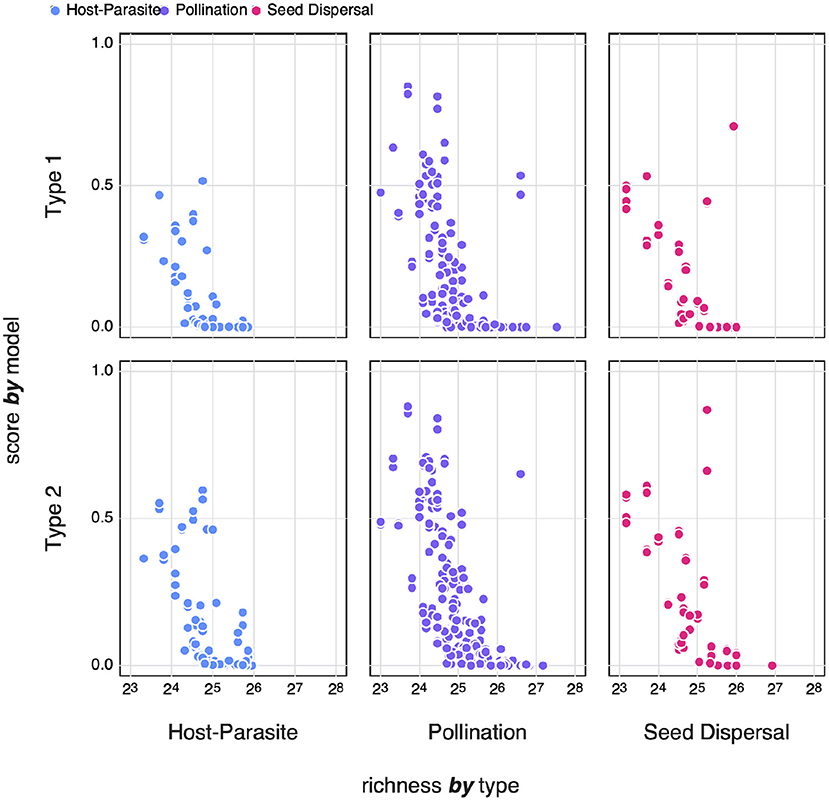
Figure 8. The logistic zi-scores of different types of networks for both Type I and Type II null models compared to the species richness of the network. Where zi-scores below 0.5 indicate networks with an SVD entropy that is lower i.e., less complex than expected.
4. Conclusion
We present SVD entropy as a starting point to unifying (and standardising) how we should approach defining the complexity of ecological networks. The use of a unified definition will allow us to revisit how complexity relates to the ecological properties of networks using a standardised method. One important result from using SVD entropy is that the complexity of ecological networks is indeed immense, yet despite this high complexity networks are still not reaching their maximum potential complexity. We suggest that the assembly dynamics of networks may explain this observation but this still raises the question as to why larger (or more mature) networks are not “maintaining” their expected complexity and prompts further exploration as to the role of ecological assembly in structuring networks.
Data Availability Statement
Publicly available datasets were analyzed in this study. This data can be found here: http://www.web-of-life.es/.
Author Contributions
TP and TS designed the study and edited the manuscript for submission. TS performed the analysis and wrote the manuscript. All authors contributed to the article and approved the submitted version.
Funding
This work was funded by a donation from the Fondation Courtois.
Conflict of Interest
The authors declare that the research was conducted in the absence of any commercial or financial relationships that could be construed as a potential conflict of interest.
Acknowledgments
We acknowledge that this study was conducted on land within the traditional unceded territory of the Saint Lawrence Iroquoian, Anishinabewaki, Mohawk, Huron-Wendat, and Omàmiwininiwak nations.
References
Barbier, M., Arnoldi, J.-F., Bunin, G., and Loreau, M. (2018). Generic assembly patterns in complex ecological communities. Proc. Natl. Acad. Sci. U.S.A. 115, 2156–2161. doi: 10.1073/pnas.1710352115
Bascompte, J., and Jordano, P. (2007). Plant-animal mutualistic networks: the architecture of biodiversity. Ann. Rev. Ecol. Evol. Syst. 38, 567–593. doi: 10.1146/annurev.ecolsys.38.091206.095818
Bascompte, J., Jordano, P., Melian, C. J., and Olesen, J. M. (2003). The nested assembly of plant-animal mutualistic networks. Proc. Natl. Acad. Sci. U.S.A. 100, 9383–9387. doi: 10.1073/pnas.1633576100
Bastolla, U., Fortuna, M. A., Pascual-García, A., Ferrera, A., Luque, B., and Bascompte, J. (2009). The architecture of mutualistic networks minimizes competition and increases biodiversity. Nature 458, 1018–1020. doi: 10.1038/nature07950
Bezanson, J., Edelman, A., Karpinski, S., and Shah, V. (2017). Julia: a fresh approach to numerical computing. SIAM Rev. 59, 65–98. doi: 10.1137/141000671
Borrelli, J. J. (2015). Selection against instability: stable subgraphs are most frequent in empirical food webs. Oikos 124, 1583–1588. doi: 10.1111/oik.02176
Brose, U., Williams, R. J., and Martinez, N. D. (2006). Allometric scaling enhances stability in complex food webs. Ecol. Lett. 9, 1228–1236. doi: 10.1111/j.1461-0248.2006.00978.x
Delmas, E., Besson, M., Brice, M.-H., Burkle, L. A., Dalla Riva, G. V., Fortin, M.-J., et al. (2018). Analysing ecological networks of species interactions. Biol. Rev. 94, 16–36. doi: 10.1111/brv.12433
Du, W., Li, X., Li, Y., and Severini, S. (2010). A note on the von Neumann entropy of random graphs. Linear Algebra Appl. 433, 1722–1725. doi: 10.1016/j.laa.2010.06.040
Duffy, J. E., Cardinale, B. J., France, K. E., McIntyre, P. B., Thébault, E., and Loreau, M. (2007). The functional role of biodiversity in ecosystems: incorporating trophic complexity. Ecol. Lett. 10, 522–538. doi: 10.1111/j.1461-0248.2007.01037.x
Dunne, J. A., Williams, R. J., and Martinez, N. D. (2002). Network structure and biodiversity loss in food webs: robustness increases with connectance. Ecol. Lett. 5, 558–567. doi: 10.1046/j.1461-0248.2002.00354.x
Eckart, C., and Young, G. (1936). The approximation of one matrix by another of lower rank. Psychometrika 1, 211–218. doi: 10.1007/BF02288367
Forsythe, G., and Moler, C. (1967). Computer Solution of Linear Algebraic Systems. Englewood Cliffs, NJ: Prentice Hall
Fortuna, M. A., and Bascompte, J. (2006). Habitat loss and the structure of plant-animal mutualistic networks: mutualistic networks and habitat loss. Ecol. Lett. 9, 281–286. doi: 10.1111/j.1461-0248.2005.00868.x
Golub, G. H., Hoffman, A., and Stewart, G. W. (1987). A generalization of the Eckart-Young-Mirsky matrix approximation theorem. Linear Algebra Appl. 88–89, 317–327. doi: 10.1016/0024-3795(87)90114-5
Golub, G. H., and Reinsch, C. (1971). “Singular value decomposition and least squares solutions,” in Linear Algebra (Berlin: Springer), 134–151.
Gravel, D., Massol, F., and Leibold, M. A. (2016). Stability and complexity in model meta-ecosystems. Nat. Commun. 7:12457. doi: 10.1038/ncomms12457
Gu, R., and Shao, Y. (2016). How long the singular value decomposed entropy predicts the stock market? – Evidence from the Dow Jones Industrial Average Index. Physica A Stat. Mech. Appl. 453, 150–161. doi: 10.1016/j.physa.2016.02.030
Jacquet, C., Moritz, C., Morissette, L., Legagneux, P., Massol, F., Archambault, P., et al. (2016). No complexity-stability relationship in empirical ecosystems. Nat. Commun. 7:12573. doi: 10.1038/ncomms12573
Kirkpatrick, S. (1984). Optimization by simulated annealing: quantitative studies. J. Stat. Phys. 34, 975–986.
Landi, P., Minoarivelo, H. O., Brännström, Å., Hui, C., and Dieckmann, U. (2018). Complexity and stability of ecological networks: a review of the theory. Popul. Ecol. 60, 319–345. doi: 10.1007/s10144-018-0628-3
May, R. M. (1976). Simple mathematical models with very complicated dynamics. Nature 261:459. doi: 10.1038/261459a0
Maynard, D. S., Serván, C. A., and Allesina, S. (2018). Network spandrels reflect ecological assembly. Ecol. Lett. 21, 324–334. doi: 10.1111/ele.12912
Memmott, J., Waser, N. M., and Price, M. V. (2004). Tolerance of pollination networks to species extinctions. Proc. R. Soc. B Biol. Sci. 271, 2605–2611. doi: 10.1098/rspb.2004.2909
Newman, M. E. J. (2010). Networks. An introduction. New York, NY: Oxford University Press Available online at: http://dl.acm.org/citation.cfm?id=1809753
Park, J., and Newman, M. E. J. (2004). Statistical mechanics of networks. Phys. Rev. E 70:066117. doi: 10.1103/PhysRevE.70.066117
Passerini, F., and Severini, S. (2011). The von Neumann entropy of networks. arXiv[Preprint].arXiv:0812.2597 doi: 10.4018/978-1-60960-171-3.ch005
Phillips, J. D. (2011). The structure of ecological state transitions: amplification, synchronization, and constraints in responses to environmental change. Ecol. Compl. 8, 336–346. doi: 10.1016/j.ecocom.2011.07.004
Poisot, T., Belisle, Z., Hoebeke, L., Stock, M., and Szefer, P. (2019). EcologicalNetworks.jl - analysing ecological networks. Ecography. 42, 1850–1861. doi: 10.1111/ecog.04310
Poisot, T., and Gravel, D. (2014). When is an ecological network complex? Connectance drives degree distribution and emerging network properties. PeerJ 2:e251. doi: 10.7717/peerj.251
Poulin, R. (2010). Network analysis shining light on parasite ecology and diversity. Trends Parasitol. 26, 492–498. doi: 10.1016/j.pt.2010.05.008
Proulx, S. R., Promislow, D. E. L., and Phillips, P. C. (2005). Network thinking in ecology and evolution. Trends Ecol. Evol. 20, 345–353. doi: 10.1016/j.tree.2005.04.004
Rozdilsky, I. D., and Stone, L. (2001). Complexity can enhance stability in competitive systems. Ecol. Lett. 4, 397–400. doi: 10.1046/j.1461-0248.2001.00249.x
Saravia, L. A., Marina, T. I., Troch, M. D., and Momo, F. R. (2018). Ecological network assembly: how the regional meta web influence local food webs. bioRxiv [Preprint]. doi: 10.1101/340430
Shannon, C. E. (1948). A mathematical theory of communication. Bell Syst. Techn. J. 27, 379–423. doi: 10.1002/j.1538-7305.1948.tb01338.x
Staniczenko, P. P. A., Kopp, J. C., and Allesina, S. (2013). The ghost of nestedness in ecological networks. Nat. Commun. 4:1391. doi: 10.1038/ncomms2422
Ulrich, W., Almeida-Neto, M., and Gotelli, N. J. (2009). A consumer's guide to nestedness analysis. Oikos 118, 3–17. doi: 10.1111/j.1600-0706.2008.17053.x
Keywords: singular value decomposition, physical complexity, bipartite network, entropy, pollination, ecological network analysis
Citation: Strydom T, Dalla Riva GV and Poisot T (2021) SVD Entropy Reveals the High Complexity of Ecological Networks. Front. Ecol. Evol. 9:623141. doi: 10.3389/fevo.2021.623141
Received: 11 November 2020; Accepted: 27 April 2021;
Published: 10 June 2021.
Edited by:
Aurore Ponchon, University of Aberdeen, United KingdomReviewed by:
Leonardo Montagnani, Free University of Bozen-Bolzano, ItalyMarcello Vitale, Sapienza University of Rome, Italy
Copyright © 2021 Strydom, Dalla Riva and Poisot. This is an open-access article distributed under the terms of the Creative Commons Attribution License (CC BY). The use, distribution or reproduction in other forums is permitted, provided the original author(s) and the copyright owner(s) are credited and that the original publication in this journal is cited, in accordance with accepted academic practice. No use, distribution or reproduction is permitted which does not comply with these terms.
*Correspondence: Timothée Poisot, timothee.poisot@umontreal.ca
†ORCID: Tanya Strydom orcid.org/0000-0001-6067-1349
Giulio V. Dalla Riva orcid.org/0000-0002-3454-0633
Timothée Poisot orcid.org/0000-0002-0735-5184