Climate Impacts on Fire Risk in Desert Shrublands: A Modeling Study
 Kirk A. Moloney
 Andres Fuentes-Ramirez2,3,4
  Claus Holzapfel
- 1Department of Ecology, Evolution and Organismal Biology, Iowa State University, Ames, IA, United States
- 2Laboratorio de Biometría, Departamento de Ciencias Forestales, Universidad de La Frontera, Temuco, Chile
- 3Butamallin Research Center for Global Change, Universidad de La Frontera, Temuco, Chile
- 4Instituto de Ecología y Biodiversidad (IEB), Santiago, Chile
- 5Department of Earth and Environmental Sciences, Rutgers, The State University of New Jersey, Newark, NJ, United States
Fire is recognized to be an important disturbance in many ecosystems worldwide, although desert ecosystems are not generally thought of as being prone to fire, primarily because of the lack of a continuous fuel bed. However, the likelihood of catastrophic fires in some desert systems is increasing due to the spread of exotic species, which can grow in the open. A second factor increasing fire risk may be extreme rainfall events caused by climate warming that can lead to an increase in fuel loads. Our work explores the impact of increased rainfall on fire risk in creosote shrublands that have been invaded by exotic grasses. We take experimental results from creosote (Larrea tridentata) shrublands in the Mojave and Sonoran Deserts of the Southwestern United States and develop spatially explicit simulation models to explore the impact of shifting rainfall regimes on biomass production and fire spread. In doing this, we explore two scales that are important in the spread of fire: (1) the macro-scale which considers the likelihood that fire arriving at one edge of a modeled landscape will successfully reach the opposite edge, leading to spread at a broader scale; and (2) the micro-scale, which considers fire spread within the landscape. We use a very simple model to first explore how changes in the distribution of fuel in the landscape impact the ability of fire to spread across and within the landscape. We then add more realism by including a direct consideration of creosote shrub distributions and biomass levels produced in different vegetation zones associated with distance from creosote. Our models show that the spread of fire at both macro- and micro-scales can be predicted from a knowledge of the statistical distribution of biomass in the field. The only additional information that is needed to predict the extent of fire spread is the amount of biomass at a local site (g m–2) required to ignite standing biomass in adjacent sites. This will depend upon species composition as well as amount of biomass, the hydration status of the vegetation and climatic conditions, such as windspeed and relative humidity.
Introduction
Fire is recognized to be an important disturbance in many ecosystems worldwide. It can alter vegetation structure, soil properties, and other key ecosystem functions (Whelan, 1995; Sugihara et al., 2006). Many ecosystems on Earth, though, are naturally dependent on wildfires. About 4% of global land surface burns on an annual basis (Randerson et al., 2012). To date, a great deal of the literature has focused on explaining how fire regimes are changing around the globe due to climate change (see Grissino Mayer and Swetnam, 2000; Cary, 2002; Bowman et al., 2009), spread of exotic species, historical fire suppression and human-induced fire. In fact, it has been shown that the incidence of fire has increased in the past 2000 years and human-impact in prehistorical and historical time has favored fire outbreaks around the globe (Marlon et al., 2008; Wang et al., 2010).
Desert ecosystems are not generally thought of as being prone to fire, primarily because of the lack of a continuous fuel bed to carry fire (Brooks and Matchett, 2006; Allen et al., 2011; Fuentes-Ramirez et al., 2016). However, changes in rainfall regimes, spread of invasive species and an increase in human activity may be leading to enhanced fire risk in these systems through an increase in connectivity of the fuel bed during high rainfall years (Moloney et al., 2019). As a consequence, native desert species may be at risk as they are poorly adapted to fire due to the low historical fire frequency. In desert regions of southwestern North America (e.g., the Mojave and Sonoran deserts), native herbaceous plant communities are less diverse in burned compared to unburned areas (Brooks, 2002; Engel and Abella, 2011), and desert shrubs, such as the creosote bush, Larrea tridentata (DC.) Cov. (Zygophyllaceae; hereafter Larrea) are very fire sensitive. Larrea is a slow-growing, deep-rooted, and long-lived (up to 11,700 year; Vasek, 1980) shrub that is uniquely adapted to survive intense droughts, but not fire (post-fire resprouting rate of 3–30%; Abella, 2009).
Over the last several decades, the Mojave and Sonoran deserts in the Southwestern US have been invaded by exotic grasses (e.g., Bromus and Schismus species) and forbs (e.g., Erodium cicutarium and Brassica tournefortii; D’Antonio and Vitousek, 1992; Brooks et al., 2004), which has increased the susceptibility of these deserts to fire. The abundance of exotic invasive species is often closely tied to seasonal and annual variation in precipitation, which may lead to greater biomass production and fuel loads within the inter-shrub areas during periods of above average rainfall; whereas, prior to invasion, these systems tended to have low fuel loads in the inter-shrub areas even after periods of high rainfall (Bradley et al., 2016). As a consequence, fire risk is often greater after rainy seasons with above-average rainfall in invaded systems, because of greater plant growth and litter production, which can fuel larger fires (Brooks et al., 2004; Chambers and Wisdom, 2009; Esque et al., 2013; Moloney et al., 2019). By serving as spreaders of fire, exotic annual grasses in particular have transformed these deserts through fire-induced mortality of keystone shrubs and reduction of the high soil nutrient availability, typically associated with fertility islands (Mudrak et al., 2014; Fuentes-Ramirez et al., 2015a, b). Thus, where invasive grasses are abundant, shrub islands are prone to burn (Brooks, 2002), strengthening the grass-fire cycle long known to drive fire incidence in invaded ecosystems (D’Antonio and Vitousek, 1992).
Within this context, we designed a multiyear experimental study exploring the responses of annual plant communities to increased precipitation in Larrea dominated shrub desert landscapes of the Sonoran and Mojave deserts (Schafer et al., 2012; Moloney et al., 2019). The focus was on understanding the spatial distribution of fuel as a function of shrub locations. For example, the well-known, nutrient-island effect of creosote shrubs leads to a concentration of nutrients under shrubs with nutrient levels falling off with distance from shrubs (Charley and West, 1975; Schlesinger et al., 1996; Thompson et al., 2005; Ewing et al., 2007; Mudrak et al., 2014). Related to this, it has been thought that the increased fire risk in creosote shrublands (primarily through studies in the Mojave) is enhanced by invasive annuals that can grow in the open unlike native species, which grow best under the shrub canopies and are only sparsely distributed in the open (Brooks et al., 2004; Brooks and Matchett, 2006; Fuentes-Ramirez et al., 2016). Our experiment showed that with increased precipitation, biomass increased significantly in both the Mojave and Sonoran sites and was highest under shrubs, decreasing with distance into the open matrix as predicted (Moloney et al., 2019). What may be most critical for fire spread is the change in biomass in the open matrix as there needs to be enough fuel to carry fire from shrub to shrub (Fuentes-Ramirez et al., 2016). In Figure 1 you can see evidence of these relationships from a fire caused in the Mojave by an exploding electrical transformer.
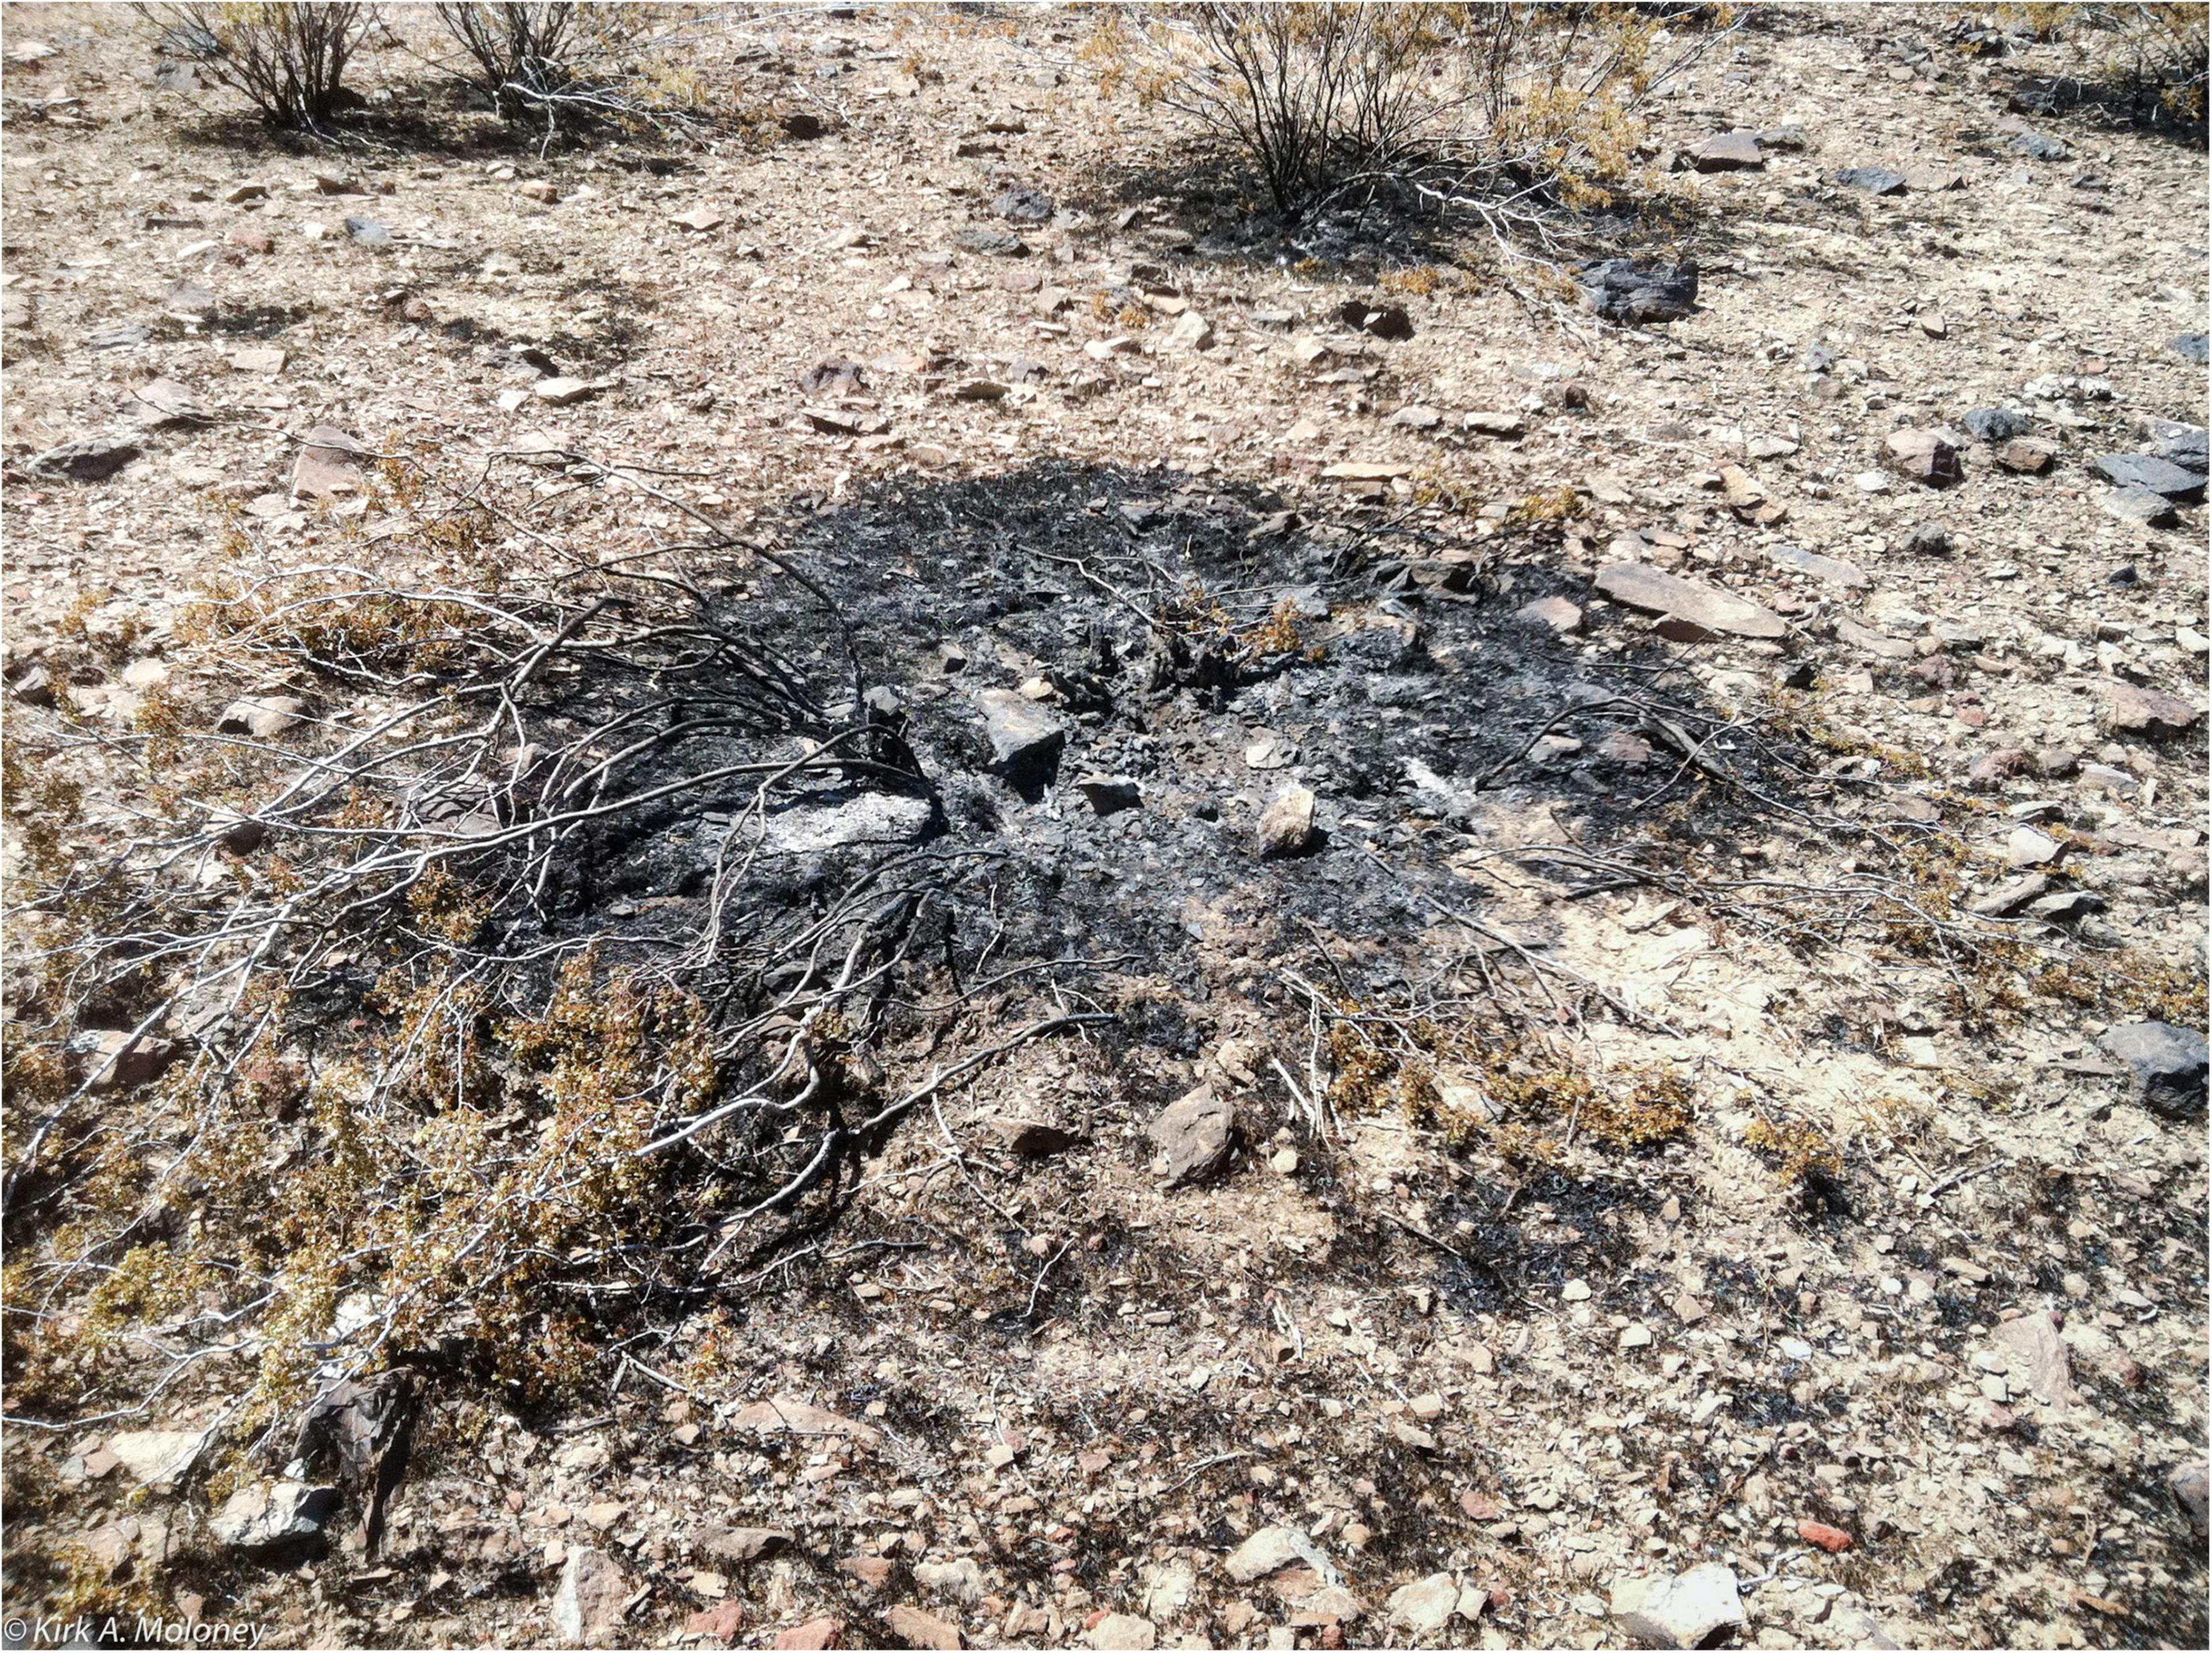
Figure 1. Creosote shrubland fire on Fort Irwin Army Base, California in June of 2011. The fire was started by an exploding electrical transformer. The big fire scars seen in the photo are due to higher biomass of annual plants under creosote. The fire in the annuals was clearly hot enough with enough duration to burn the creosote stems. There is evidence of fire spread in the matrix in the right foreground where there is blackened plant material in the open. Photo by Kirk A. Moloney.
One goal of our research project was to use data from the experimental study to develop a spatially explicit simulation model examining the impact of increased precipitation on fire risk in the two desert systems. The work discussed here presents the results of a modeling study based on these data. In analyzing the model, we examined two aspects of fire spread representing two scales of the process. At the regional scale, we considered the broad scale spread of fire through the landscape. The critical element of this process is that the spatial distribution of fuel is sufficient to allow fire to bridge a landscape element and spread fire to adjacent areas of the landscape. At the local scale, we considered the amount of spread within a landscape element after ignition of fire at a single point in the landscape. Critical here is the proportion of the landscape burned from a single ignition point. This represents the risk of fire damage to the local plant community. Ultimately, we hope to provide valuable insights for fire management in deserts. In particular, we aim to arrive at estimates of biomass thresholds above which fire can spread through desert landscapes. Information on such thresholds can provide a determination of critical fuel loads, such as ones built up by the growth of invasive, exotic grasses after extreme rainfall events that could lead to destructive fires.
Materials and Methods
In developing the fire simulation model, we began with a very basic, binary landscape characterizing only two types of habitat, flammable and non-flammable, distributed at random. More “realistic” detail was then added to the model to explore the impact on the spread of fire by: (1) the differential likelihood of ignition of neighboring cells from a burning cell; (2) the presence of shrubs; and (3) patterns of biomass distribution based on field observations and precipitation experiments. Our philosophy in applying this approach derived from the belief that the best approach to understanding complex phenomena is to develop an understanding of the basic building blocks of the process before adding more realistic detail.
Field Data
Field data for the model experiments were required to parameterize annual plant biomass distributions used in determining the spatial distribution of fuel loads in the model landscapes (see below). These data were obtained from an experimental study conducted from 2011 to 2013 at two sites in the Southwestern US (Schafer et al., 2012; Moloney et al., 2019). One site was in the Mojave Desert and the other in the Sonoran.
The Mojave Desert site (35°9′021″ N, 116°53′6″ W, 865 m MSL) was located within the Fort Irwin National Training Center, north of Barstow, California. The average annual precipitation is 147 mm with a mean annual temperature of 17.7°C (data from the Goldstone Echo 2 weather station 22 km N of our study site, Western Regional Climate Center)1. Precipitation at this site is predominantly from winter rains. The study site was located on an east-facing bajada dominated by L. tridentata (DC.) Cov. and Ambrosia dumosa (A. Gray) Payne. Soils are young and intermediate aged alluvial grus (decomposed granite; Amoroso and Miller, 2006).
The Sonoran Desert site (32°41′49″ N, 112°50′22″ W, 322 m MSL) was located within the Barry M. Goldwater Range, south of Gila Bend, Arizona. It has an average annual precipitation of 153.9 mm and mean annual temperature of 22.7°C [data was from the Gila Bend weather station, 29 km NNE of our study site, Western Regional Climate Center (see text footnote 1)]. The Sonoran site is characterized by two wet seasons with rainfall during both the summer and winter. As in the Mojave site, Larrea is the dominant species; however sub-dominant shrub species are mostly lacking. Soils were coarse-loamy, hyperthermic, typic hyplicalcids (U.S. Department of Agriculture)2.
The methodology and rationale for the experimental study have been reported in detail in Schafer et al. (2012) and Moloney et al. (2019). The pertinent component of the experimental protocol for this paper is that peak annual biomass was determined for 1,344, 20 × 20 cm permanent microplots that differed in distance to the base of Larrea shrubs. Biomass was determined with non-destructive methods from measures of percent aerial cover (cov) and height (h) in cm. These two quantities were regressed against dry biomass (g/100 cm2) harvested from comparable microplots in adjacent areas at each site during each year of the study (for details see Appendix S3 of Moloney et al., 2019). The resulting equations were used to determine biomass in the microplots each year.
The permanent microplots were located relative to 168 randomly chosen creosote shrubs within an 83 × 130 m experimental plot in each desert site. The positions chosen for the microplots were used to represent four major micro-habitats associated with the “nutrient island” effect in creosote shrublands (Garcia-Moya and McKell, 1970; Schlesinger et al., 1996; Mudrak et al., 2014). The four micro-habitats were: (1) under-the-canopy (UC); (2) canopy drip-line (CD); (3) open, near-to-shrub (ON); and (4) open, far-from-shrub (OF). Details on the placement of the microplots relative to shrubs can be found in Moloney et al. (2019) and Schafer et al. (2012). Annual plants tend to produce more biomass in creosote influenced UC and CD habitats with the amount tapering off in ON and OF habitat with the trend in density being the opposite (Moloney et al., 2019). The proportion of native vs. exotic annuals was also much higher at the Sonoran site than the Mojave (Moloney et al., 2019).
In the winter of 2010–2011 data were obtained from replicates of the four microhabitats. Immediately after data collection, we introduced four different treatments applied in a split-plot, factorial design: (1) burned vs. unburned; (2) soil turbation vs. unturbated; (3) seed addition vs. no seed addition; and (4) precipitation with three levels of moisture (1/2 ambient, ambient and 2× ambient rainfall). In this paper we will only be using data from the unburned, unturbated, and 2× ambient precipitation treatment (highest moisture level) to parameterize simulations. Since seed addition had no effect on outcomes, we pooled replicates from both seed treatments in our analyses. The high moisture treatment (2× ambient) was designed to mimic approximately double the amount of ambient precipitation during 2012 and 2013 by adding hand irrigation and represents the conditions producing the highest risk of fire spread due to increased biomass production by annual plants. Burn and disturbance treatments had a minimal experimental effect on biomass, particularly when compared to the effects of precipitation, so we did not consider data from these treatments in our models. For complete details of the experimental design see Moloney et al. (2019).
Shrub size and location data for both experimental sites were obtained as described in Mudrak et al. (2014). We modeled the horizontal profile of shrubs using canopy area as described in Mudrak et al. (2014), converting the oval shape of the canopy to circular areas maintaining the same cover area (Figure 2).
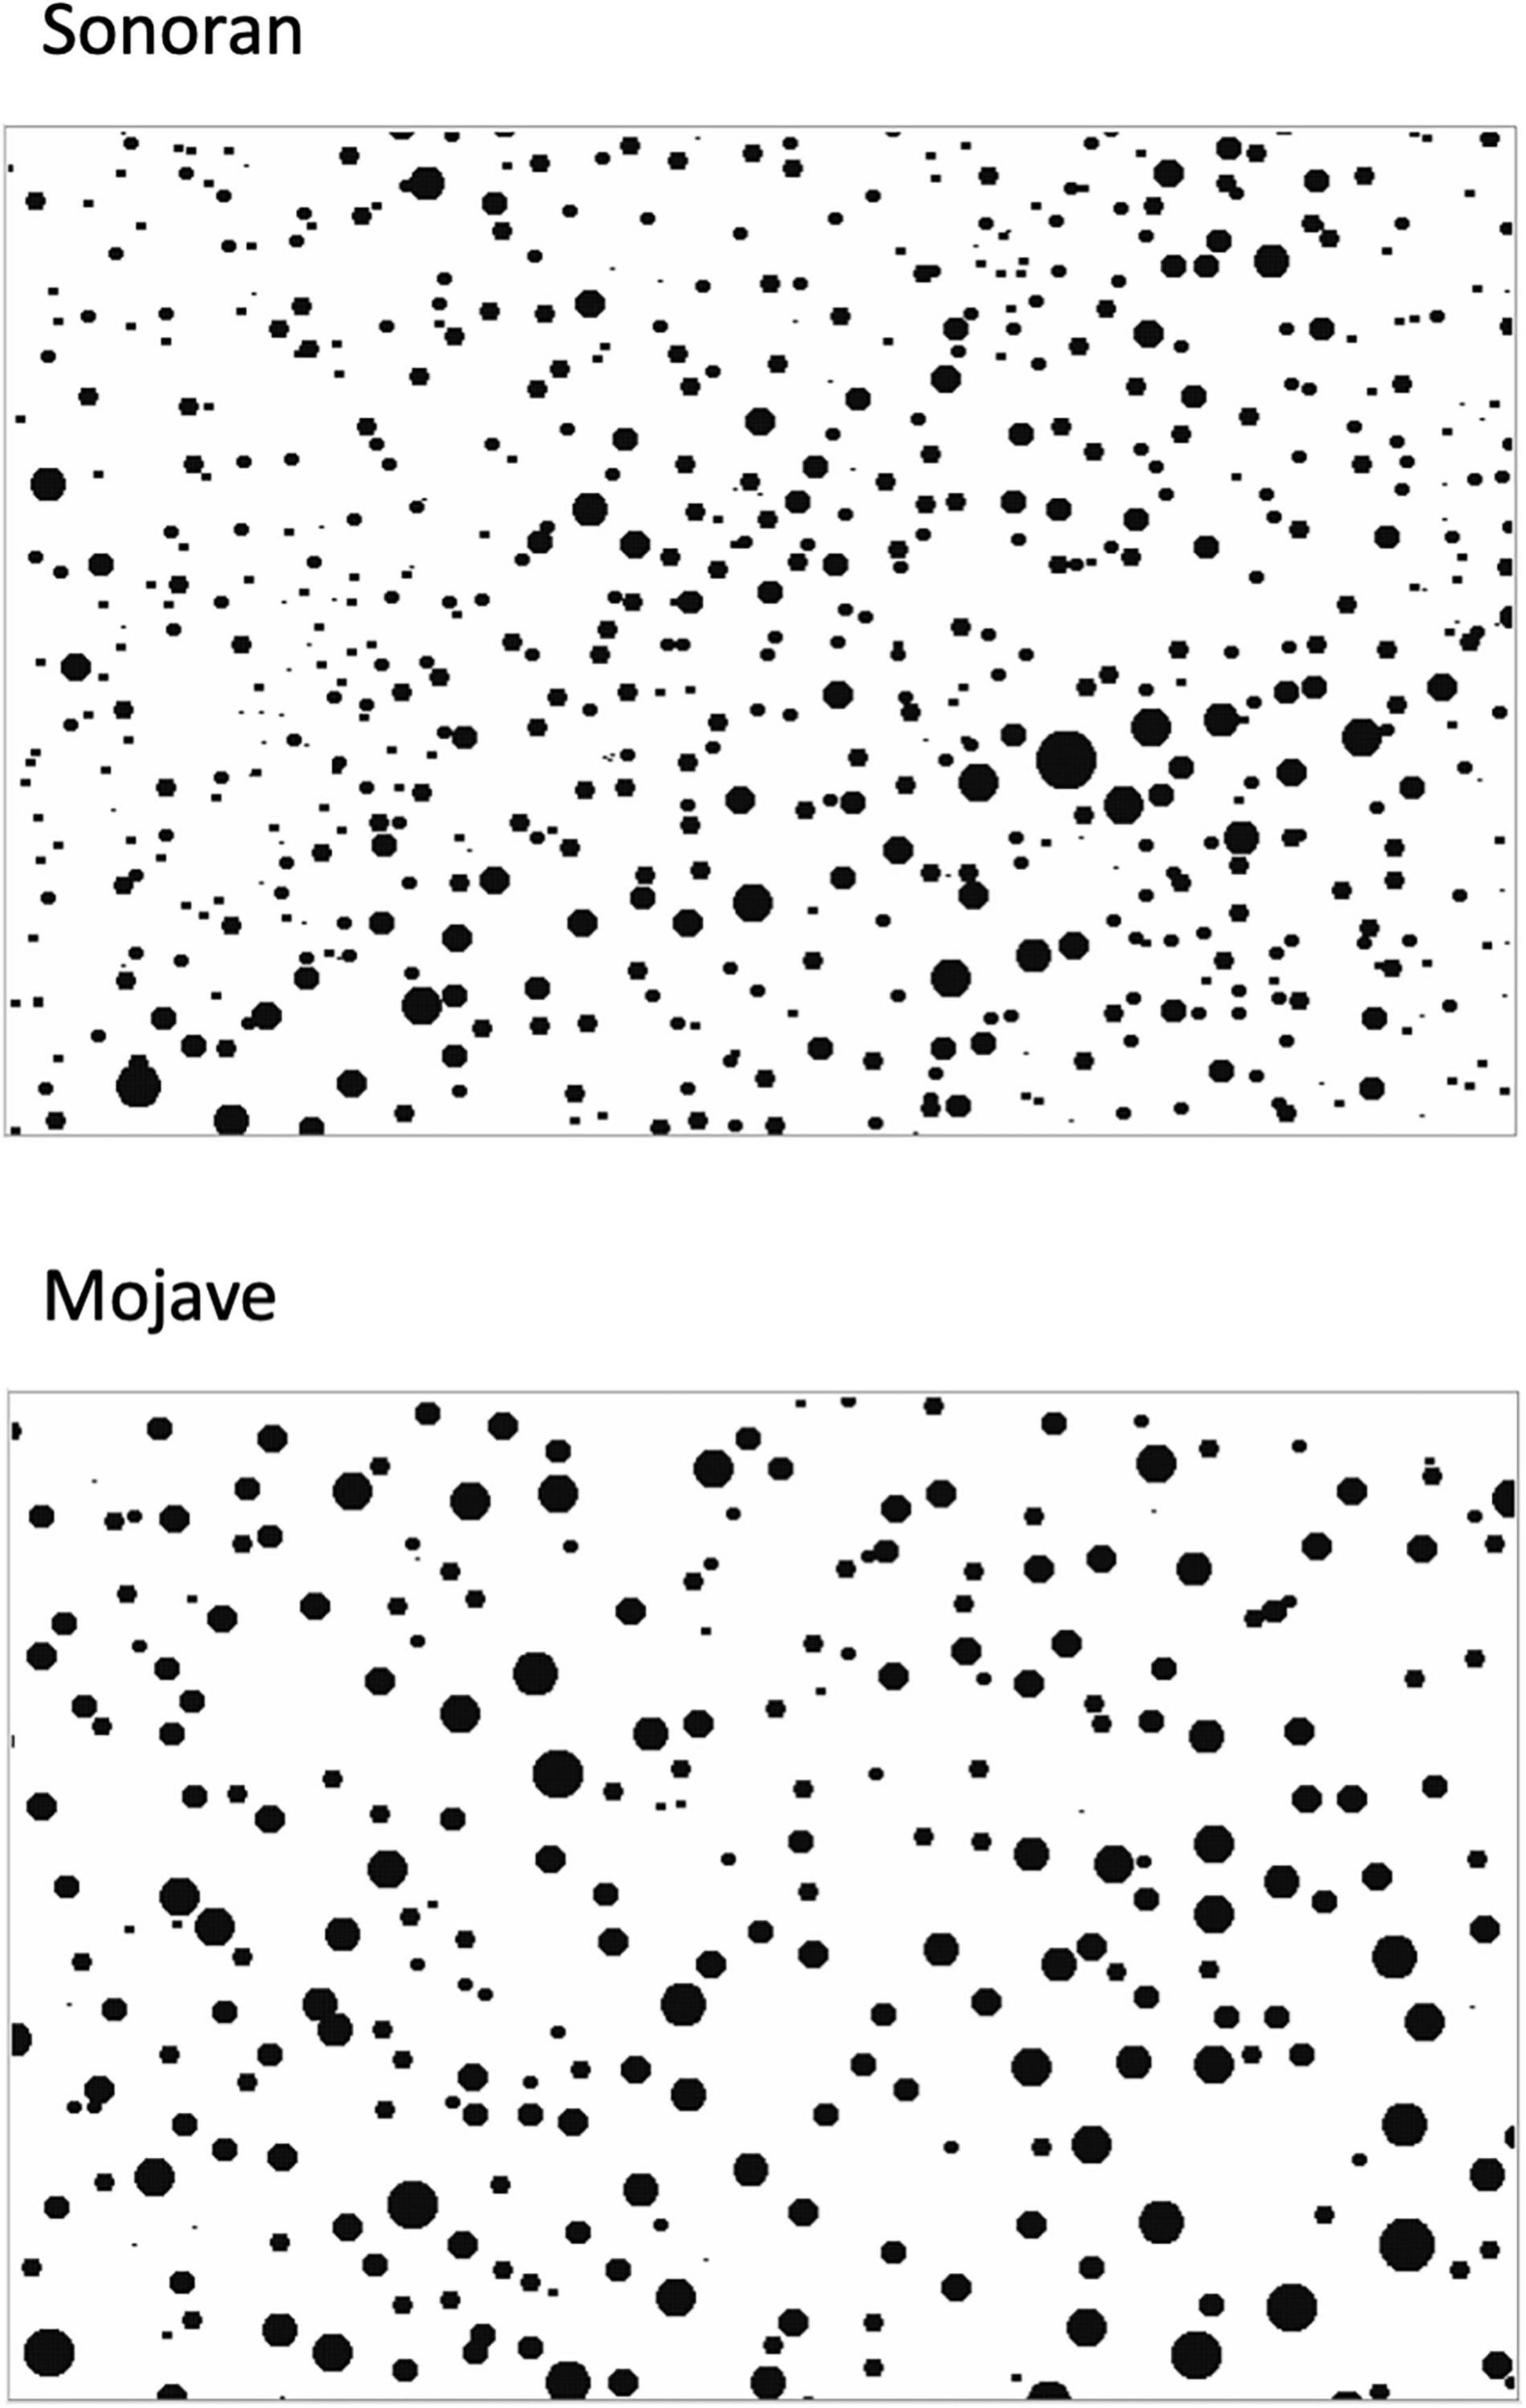
Figure 2. Creosote maps used in the simulation program for the Sonoran and Mojave experimental plots based on field surveys. Both sites are 120 × 80 m, length vs. height respectively.
Simulation Model
General Model Structure
The simulation model was written in C++ and is hierarchical in nature, comprising three fundamental layers: (1) the landscape, which defines the extent of the model through two parameters {w,h}, width and height in meters, respectively; (2) a raster-based layer composed of a matrix of 20 × 20 cm cells containing annual plants; and (3) a vector-based layer, which represented shrubs. The raster-based layer comprises a matrix of cells with each cell’s state characterized by the cell’s flammability and ability to spread fire to adjacent cells. An individual cell cij is referenced by its {i,j} location in the matrix.3 The vector-based layer contained shrubs. Each shrub was defined by three parameters {x, y, r}; x and y coordinates represent the shrub’s geographic center of biomass in the landscape and r is the radius of the shrub canopy. Before running fire simulations, shrubs were converted to a raster layer containing all cells whose centroids fell inside circles of radius r centered on locations {x,y} for all shrubs (see Figure 2). This layer was then used to modify the flammability of the annual plant matrix layer.
Cell Flammability State
The flammability state of a cell cij located at landscape position {i, j} was characterized by two parameters, the probability that the cell could burn (fij) and the probability that a burning cell spreads fire to a neighboring cell (sij). Cell flammability was set in two different ways depending upon the modeling approach:
Simple Binary Landscapes
In binary landscapes cells in the model were randomly set as being either flammable (fij = 1) or non-flammable (fij = 0) with a probability pcell. In this case, for each cell cij in the model landscape the flammability state was set by obtaining a random number (n) from a uniform probability distribution on the unit interval, if n ≤ pcell then fij = 1, otherwise fij = 0.
Realistic Landscapes
Cells were first populated by setting the biomass of annual plants in each cell (bij) in the landscape, with bij being the biomass in cell cij. The method for determining biomass depended on the model experiment being conducted (see below). Once biomass was set, the flammability of a cell was set to zero if no biomass was present, otherwise fij = 1. The probability that fire could spread from a burning cell to adjacent cells was a function of biomass determined by a cutoff value (Δ) set for a model simulation run. In the simple case explored in this paper, if bij ≥Δ then sij = 1, otherwise sij = 0.
Fire Initiation
Fire was initiated in a simulation in one of two ways, depending upon the experiment. In experiments exploring percolation-spread (i.e., macro-scale fire spread), all cells along one edge (the southern edge) were ignited at the start of a simulation. In point-spread experiments (i.e., micro-scale fire spread), fire was initiated at a single, randomly selected cell within the landscape.
Fire Spread
Fire in a burning cell cij ignited a neighboring cell if a random number (n) drawn from a uniform probability distribution on the unit interval was less than or equal to the probability of spread sij. Fire spread from a burning cell was determined in this fashion for all neighboring cells. Cell neighborhoods for fire spread were defined either as the four cells lying in the four cardinal directions adjacent to a focal cell (von Neumann neighborhood) or as the eight cells surrounding the focal cell (Moore neighborhood). Exploratory experiments comparing spread for the two neighborhood types showed that there was little difference in the qualitative pattern of fire spread (results not shown). As a consequence, we only explore models using a von Neumann (4 cell) neighborhood in this paper.
Model Run End State
Model runs ended at the point where there was no more spread of fire. The outcome of the model was assessed differently depending upon the way the model was initiated.
Percolation-Spread (Macro-Scale)
In each percolation-spread model run, the output was examined to determine if any cell on the northern border had burned after all the cells on the southern border were ignited. If at least one cell on the northern border burned then the model had successfully “percolated.” Successful percolation indicated that there was at least one path of flammable cells leading from the southern edge to the northern edge of the model landscape. A landscape that percolates can carry a fire across the local landscape and can act as a conduit of fire within a broader landscape. Landscapes that do not percolate can’t spread fire between adjacent landscape elements.
One key benchmark for assessing percolation is what is known as the pcrit value, which is equal to approximately 0.5928 (Gardner et al., 1987; Cox and Durrett, 1988). This is a theoretical quantity that represents a threshold value for a theoretically infinite 2-dimensional landscape composed of cells. If the proportion of cells in an infinite landscape that are flammable is less that pcrit then there is no available continuous path for fire to cross the landscape. If the proportion of traversable cells is greater than pcrit then it is guaranteed that there is at least one traversable path. For landscapes that are not infinite the likelihood of percolation across the landscape is still related to pcrit but in a more nuanced fashion as we explore in experiment E-1 below (also see Abades et al., 2014).
Point-Spread (Micro-Scale)
We determined the proportion of flammable cells in the landscape that burned as well as the proportion of all landscape cells that burned. This provided an assessment of the extent of fire spread within the local landscape from an initial ignition point originating in the landscape.
Simulation Experiments
Simple Binary Landscapes
Our first experiments in developing the fire model were designed to explore the dynamics of spread in a very simple system before adding more realism. For these experiments, cells in the landscape were set to one of two states, flammable or not flammable as explained above. All analyses involving simple binary landscapes, with the exception of E-1, were conducted on 80 m x 40 m landscapes, i.e., 400 × 200 cells, somewhat smaller than the approximate scale of the experimental sites motivating the model.
Landscape Scale Experiment [E-1]
In the first experiment, we varied landscape scale to explore how this would impact realized percolation probabilities for different landscape sizes with the same underlying pcell values. The smallest landscape was 200 × 100 cells (40 × 20 m). We doubled the size of the landscape up to a maximum value of 12,800 × 6,400 cells (2,560 × 1,280 m) for a total of 7 landscape sizes.
Before conducting model runs at each landscape scale, we used a coarse scale search at low pcell values, i.e., lower than pcrit = 0.5928, to determine pcell values below which fire never percolated across the landscape. We used the same process to determine values above pcrit for which fire always percolated. Once the upper and lower bounds were determined we varied pcell in increments of 0.002 between the lower and upper bounds. At each parameter setting we generated 100 random landscapes and conducted a percolation-spread analysis on each.
Probability of Spread Experiment [E-2]
As in experiment E-1, cells were randomly set to be either flammable or non-flammable using the same protocols for setting pcell values as in E-1. The probability that a cell could ignite another cell in the same neighborhood (s) was systematically altered between values of 0.5 and 1.0 in increments of 0.1 and the same value was applied to all cells of a replicate landscape. One hundred replicate runs were produced for each parameter combination of pcell and s and each replicate was examined to see if it percolated.
Point-Spread Experiment [E-3]
In this experiment, pcell and s values were varied over the same range of values as described in E-2. We will only report results for model runs with s = 1.0 as this captures the qualitative nature of the process at all values of s. As before, 100 replicates were run for each parameter value combination. In each model run fires were initiated by randomly setting one cell on fire and then fire was allowed to spread following the normal rules. This allowed us to explore the range of variability in fire spread due to differences in local conditions (e.g., Figure 3).
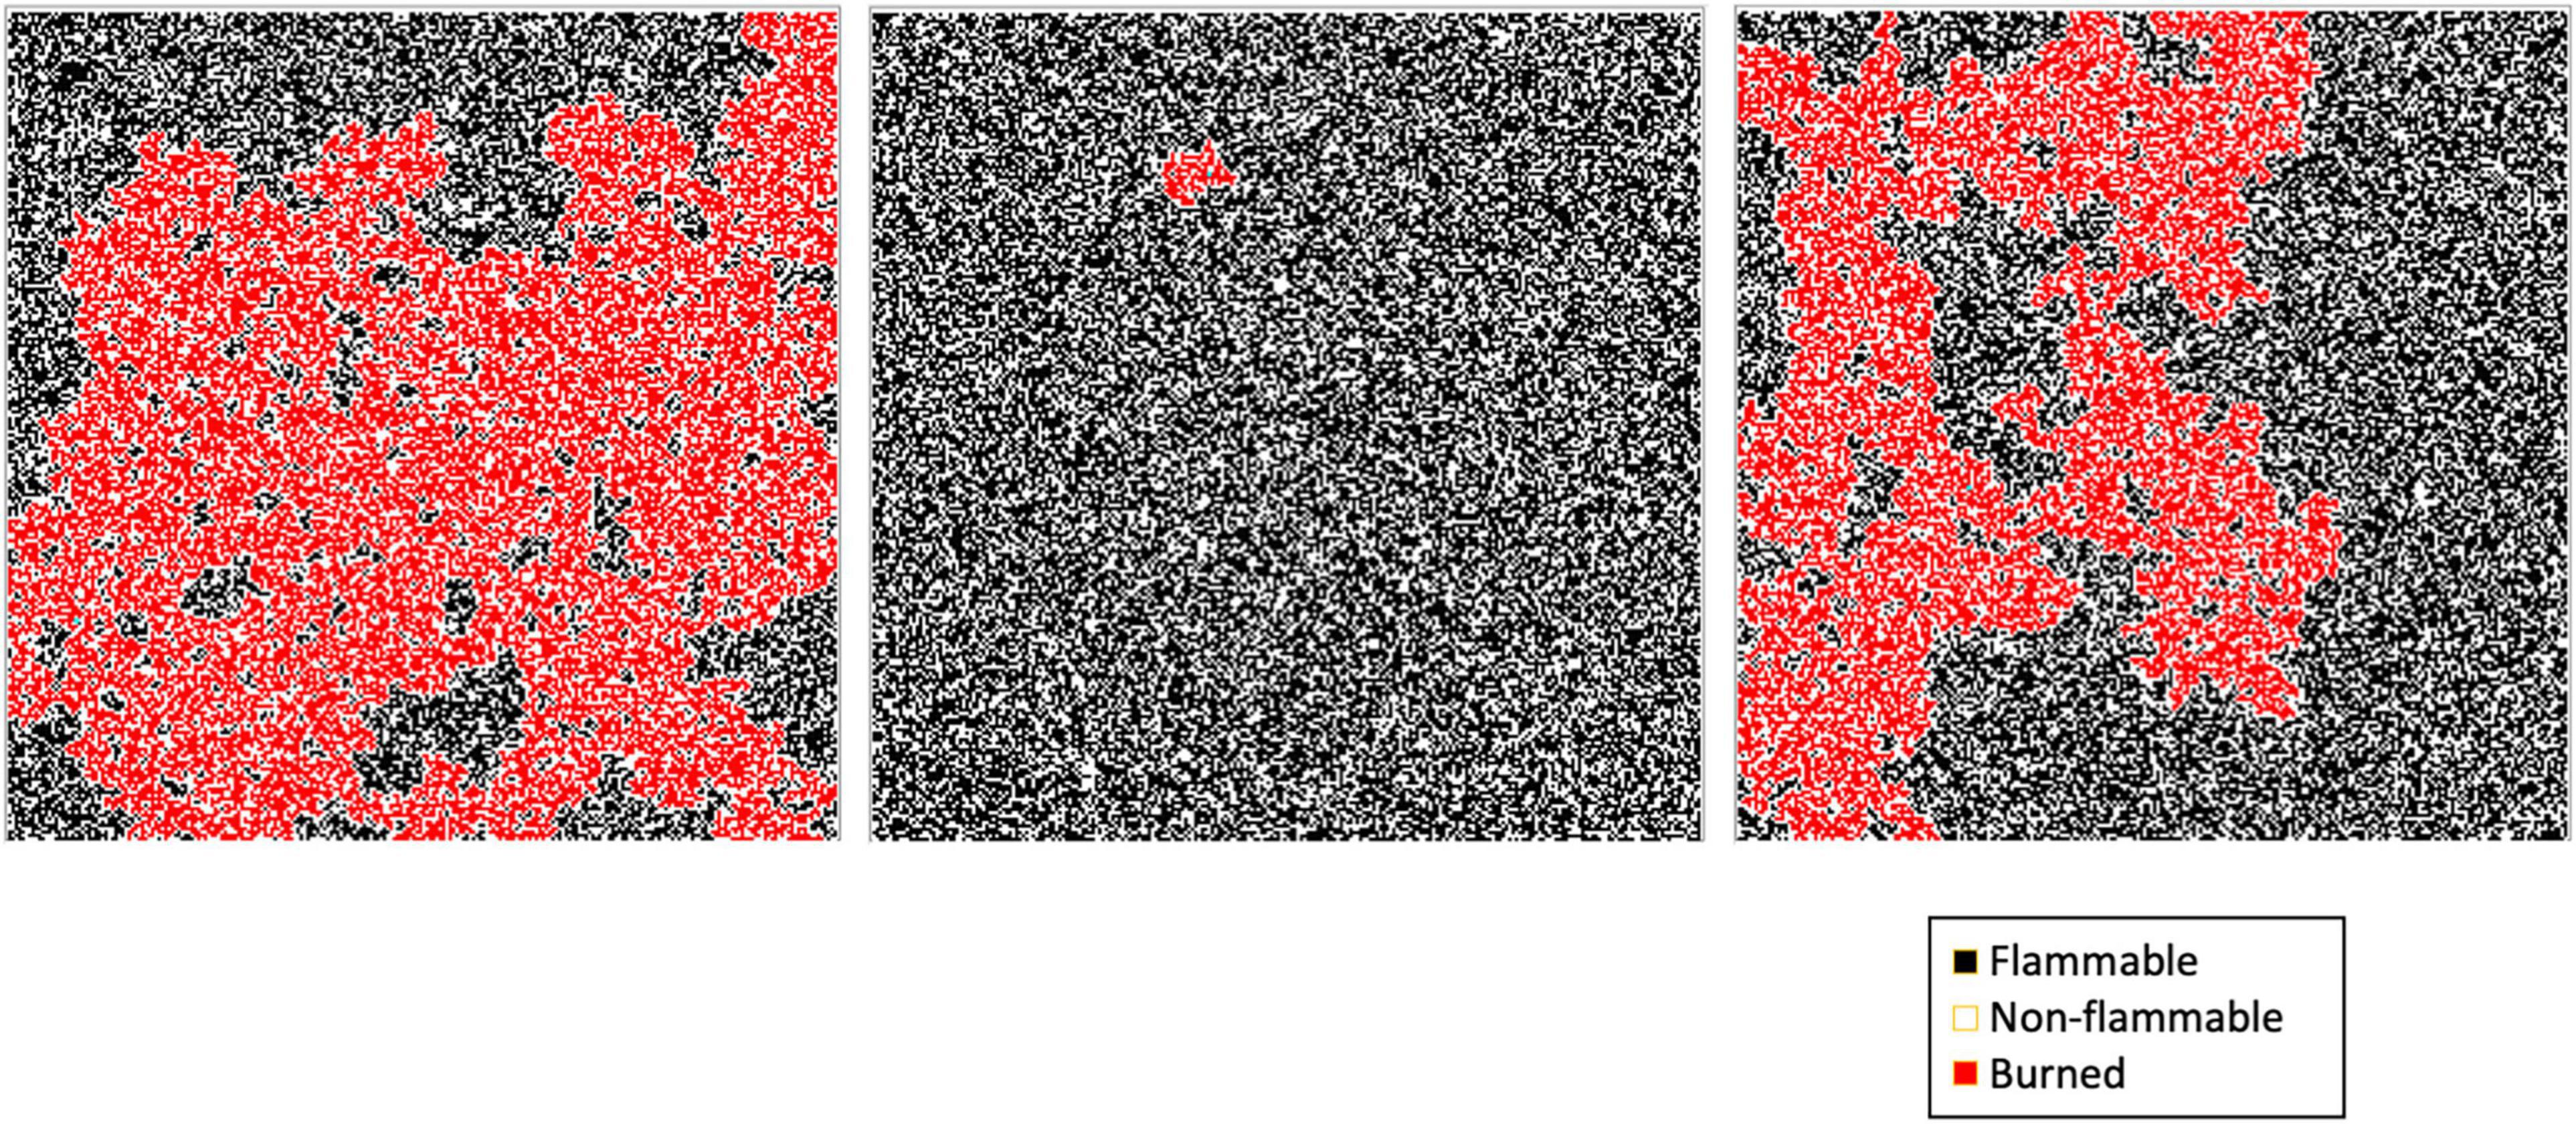
Figure 3. Three replicates of random-point ignition in 250 × 250 cell binary landscapes with fixed values of pcell = 0.60 and pspread = 1.00.
Shrub as Firebreak or Accelerant Experiment [E-4]
Three sets of experiments were conducted to explore the impact of shrubs occurring in the landscape on resulting fire spread: (1) no shrubs—as in the previous experiments; (2) shrubs that burned—potentially acting as an accelerant to fire spread; and (3) shrubs that don’t burn—potentially acting as a fire break. We can view this simplistic depiction of the impact of shrubs as a proxy for the effect shrubs have on the fuel loads under their canopies. They act as an accelerant under dry conditions when shrubs lead to high fuel loads under their canopies. In contrast, inhibition could be caused by low fuel loads under shrubs or high moisture levels lowering the flammability of the fuel bed. These experiments were explored using the percolation-spread fire model.
For each of the three experiments in E-4, binary landscapes were constructed as in E-2 across a range of pcell values holding spread (s) constant at a value of 1.0. One hundred replicates of each parameter combination were used for each of the three experiments. For models including shrubs, a random set of shrubs were produced based on the characteristics of creosote shrubs found at the Mojave Desert experimental site (unpublished analysis). The distribution of shrubs was modeled as a Strauss process with a beta of 0.031 and hard separation distance of 3.15 m using the routine rStrauss from the spatstat package in R (Baddeley et al., 2015). [The average distance between creosote shrubs at the Mojave site was 3.15 m (Mudrak et al., 2011).] This produced an average of 0.028 shrubs per m2 in a 40 × 20 m landscape (90 shrubs total on average per landscape). This was close to the value observed in the field of 0.031 shrubs m2. Once the shrub locations were determined their sizes were randomly assigned using a mean radius of 0.97 m (standard deviation = 0.408), the same distribution as observed for the 301 shrubs measured at the Mojave site. The cell locations covered by shrub canopies were all set to a value of f = 1 in models with shrubs acting as an accelerant and were set to f = 0 with shrubs acting as fire breaks. These experiments were explored using the percolation-spread fire model.
Realistic Landscapes
The preceding experiments all took place on a simple binary landscape to develop an understanding of fire spread in a context that was easy to interpret. In the “realistic” landscape experiments we built in more detail about the general desert shrub system to explore the impact on fire spread. In this case, experiments were conducted on a 120 × 80 m landscape. Realism was added in two steps. First we made the matrix habitat more realistic by modeling biomass based on gamma probability distributions associated with the OF habitat, i.e., the habitat not influence by the presence of shrubs (see Chen et al., 2008, for a discussion of the gamma distribution as an appropriate model for biomass distributions of plants). In a second step, we added more realism by including the effects of shrubs on the distribution of annual plants due to the shrub island effect. This was done by characterizing the microhabitats of cells as being a function of distance from shrubs.
Gamma distribution parameters for specific microhabitat conditions (i.e., microhabitat location and experimental treatment) were determined in a two-step approach analyzing the experimental data corresponding to conditions of the 4 experimental microhabitats using a Hurdle model. In the first step we determined the probability that a sample for the specific conditions under consideration had measurable biomass (pocc). We then determined the rate and shape parameters for the gamma distribution using the glm in R with a log-link function (R Core Team, 2019). Only replicates including measurable biomass were included in the latter analysis. The results of these analyses are shown in Tables 2, 3.
In all of the experiments modeling biomass as a fuel, we determined the biomass of annuals in each cell of the landscape in two steps using a Hurdle model as in the analysis of the experimental data. First, we determined if the cell was empty or contained measurable biomass based on the probability distribution that a cell had a measurable amount of biomass (Tables 2, 3; Probability occupied). In each cell containing biomass, a biomass value (bij) was randomly drawn from a gamma distribution using the boost libraries for C++ (boost.org, 2014). The gamma is a two parameter distribution determined by shape and rate (Bolker, 2008). The parameters used to determine biomass in each cell were based on the empirical values associated with the microhabitat being modeled (Table 3).
Biomass-Matrix Percolation Experiment [E-5]
We used parameters based on the microhabitat farthest from shrubs (OF) to determine cell biomasses (Table 3). The experiment was designed to explore a matrix only landscape, i.e., one devoid of shrub effects.
We examined two scenarios based on observed biomass distributions in our field experiments. The first scenario was for the Mojave site in 2013 and second for the Sonoran site in 2012. In both cases we used parameters obtained for the high-moisture (2× ambient precipitation) treatment. These years were the best growth years in the sites for which we collected biomass data with the high-moisture treatments producing the greatest amount of biomass (Table 2).
In both experiments we altered a biomass threshold variable (Δ) to vary the conditions under which fire could spread. A cell with bij < Δ could not spread fire to neighboring cells but can burn, i.e., sij = 0 and fij = 1, respectively. Any cell with bij ≥ Δ could spread fire to an adjacent cell (and can burn). The only cells that can’t burn are those that don’t have any biomass, i.e., bij = 0. The spread of fire from one cell to another was determined as in the binary landscape experiments. In all model runs for this experiment we used a percolation fire model. High and low values of Δ were determined as in the binary landscape experiment. We then changed Δ in increments of 0.005 (g per 0.04 m2) from the low to high value producing 100 replicates at each parameter combination (Note that the results are reported in g m–2).
Shrub-Island Experiments
In the shrub-island experiments, four different habitat zones were defined for the models based on the location and size of shrubs (Figure 4). These zones corresponded to the microhabitat treatments of the experiments in the Mojave and Sonoran Deserts. As in the previous experiment, two different models were used based on high-water treatments from the Mojave and Sonoran sites in 2013 and 2012, respectively. Cell biomasses were determined as in the previous experiment with the addition of considering microhabitat type in setting the probabilities for each cell (Table 3). We conducted two experiments using two different types of fire regime. In the percolation experiment [E-6], fire was initiated as in the other experiments exploring percolation fire spread. In the point-spread experiment [E-7], fire was initiated as in experiment E-3. In both experiments we varied the biomass threshold variable (Δ) in increments of 0.01 (g per 0.04 m2) producing 100 replicates at each parameter combination (Note that the results are reported in g m–2).
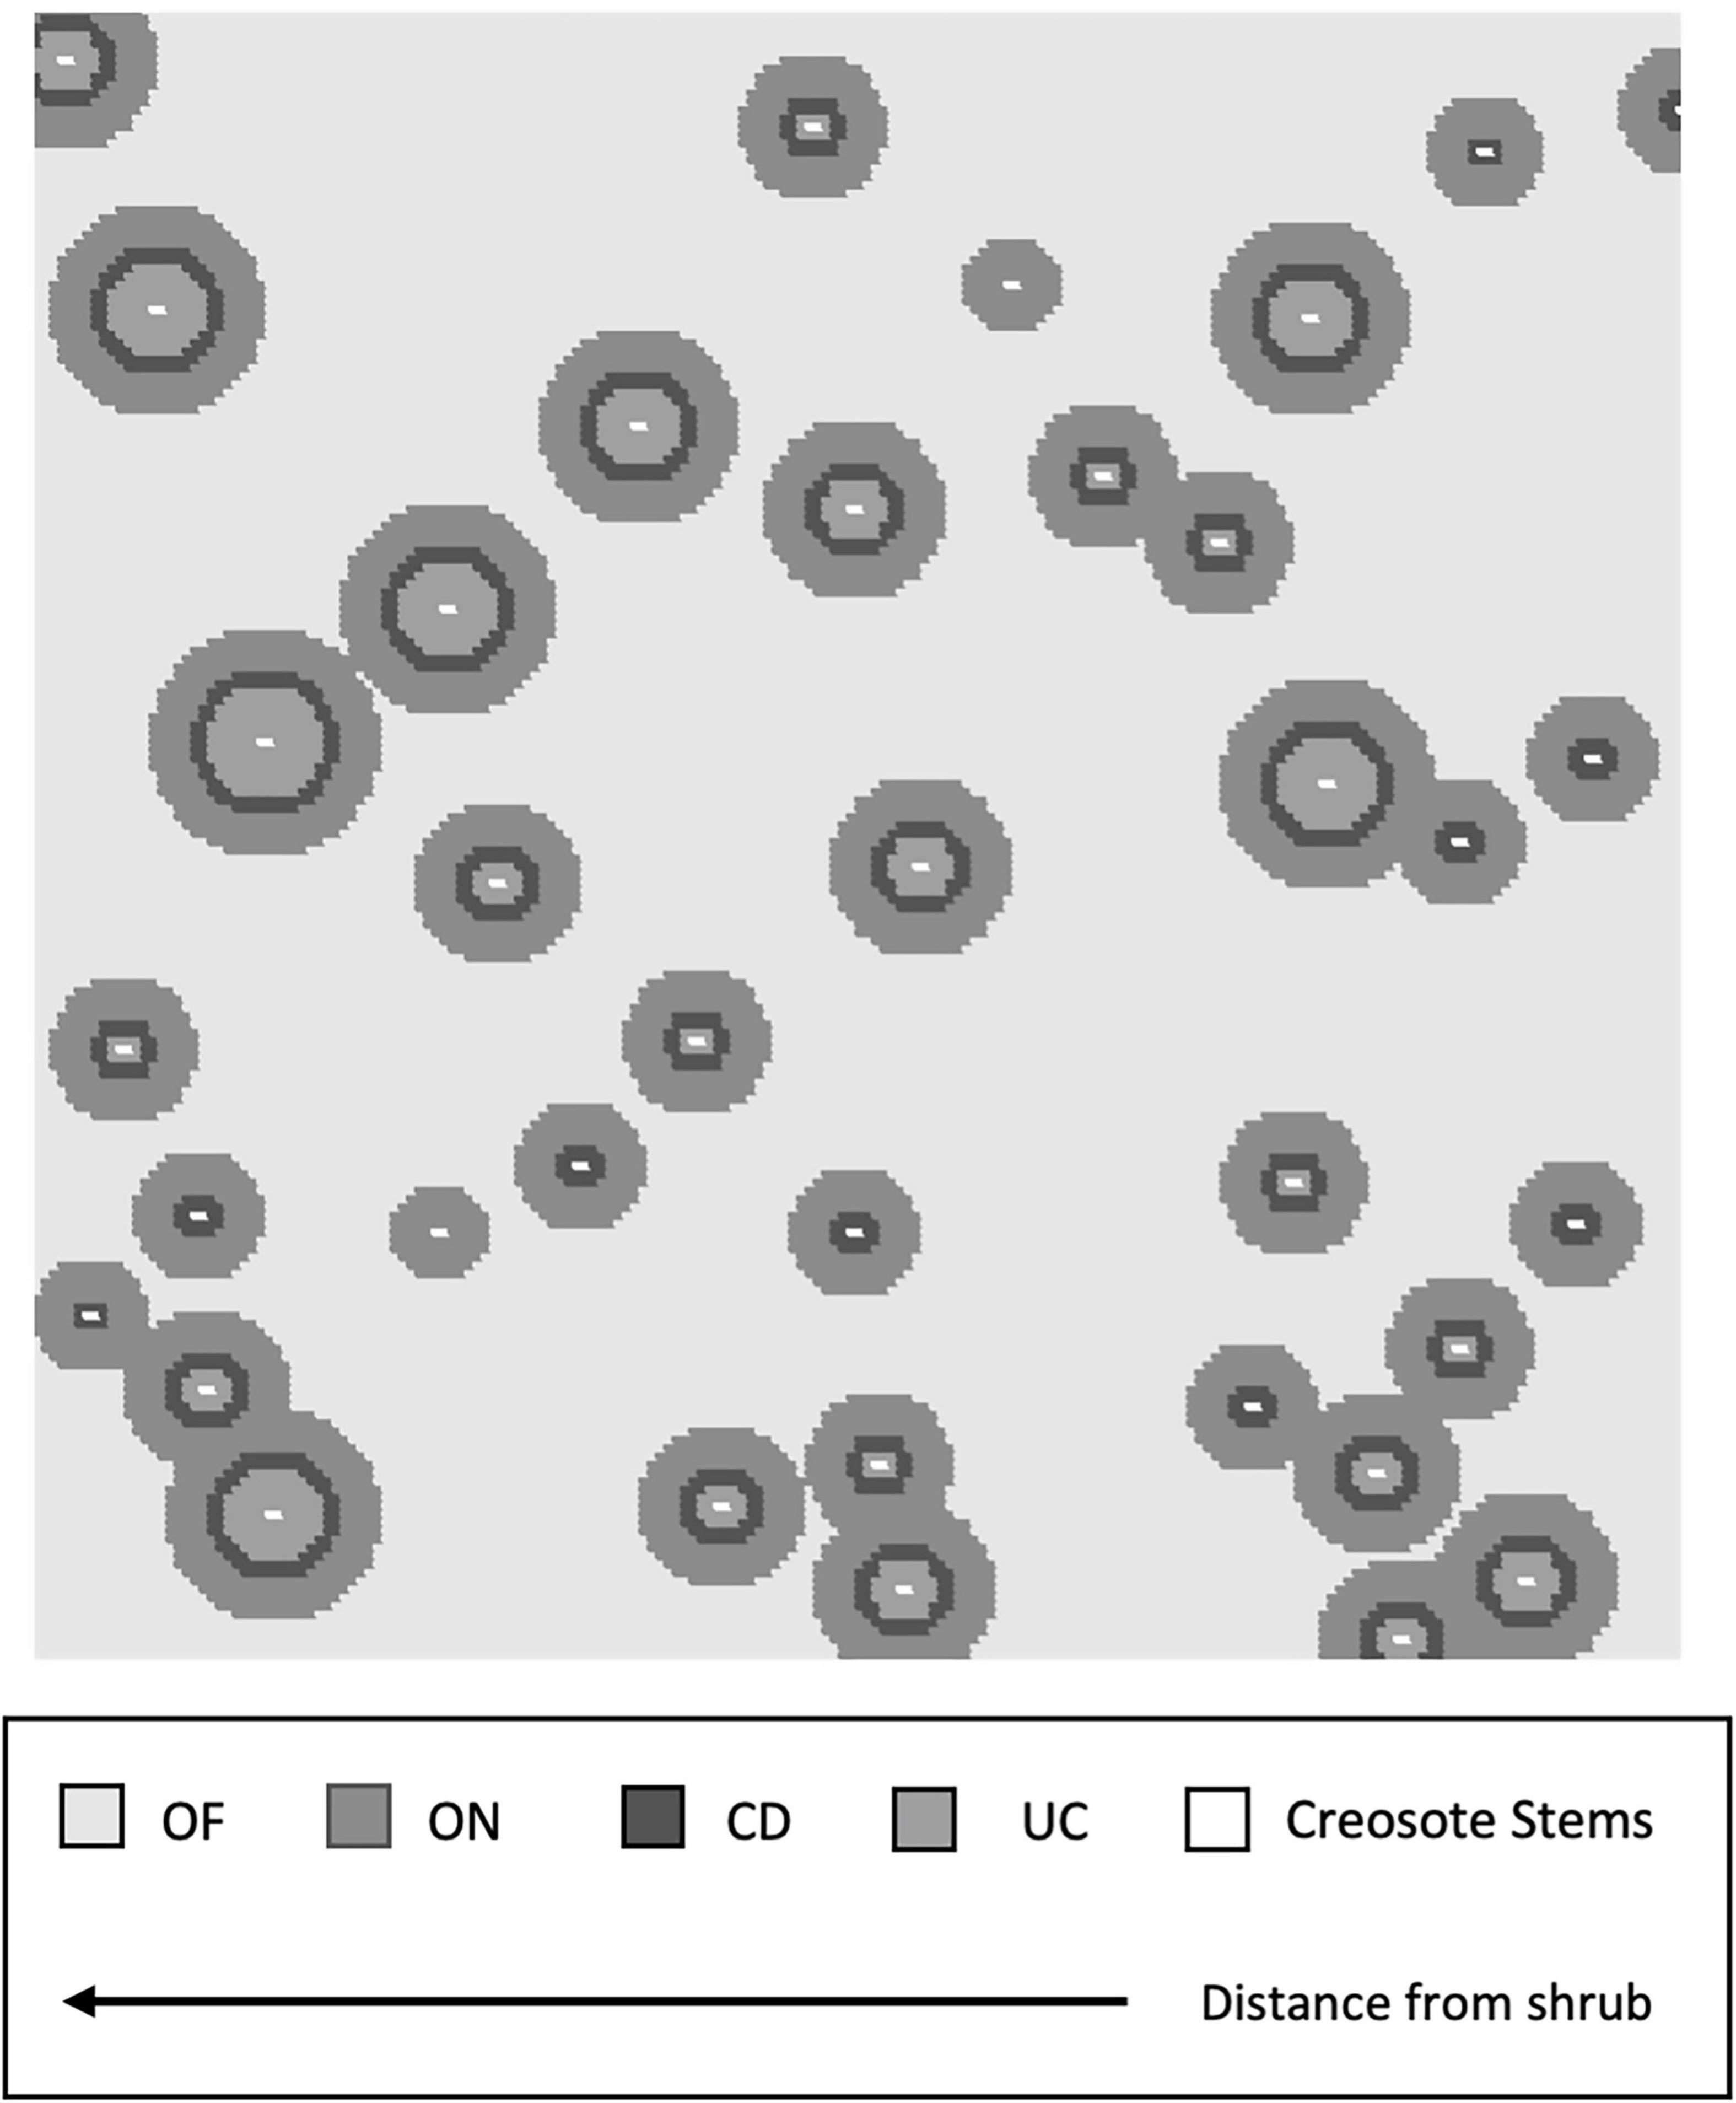
Figure 4. Example of habitat zones in the Shrub Island model.
Statistical Analyses
All statistical analyses were conducted in R (R Core Team, 2019).
Fitting Percolation Probability Curves
Percolation probability curves for an experiment were determined using glm with a binomial-link function. Each model replicate either percolated or didn’t percolate. This result was regressed using pcell for binary landscapes and Δ for landscapes produced using gamma distributions for determining biomass levels in cells.
Calculating Threshold Biomass Values for Fire Percolation
We calculated the biomass threshold value (threshold) for fire spread for each set of microhabitat conditions using the R formula threshold = qgamma (pocc – pcrit, shape, rate). The biomass threshold value represents the cut point for percolation in an infinite landscape given the probability conditions of the microhabitat under consideration. If the amount of biomass required to spread fire to neighboring cells lies above the biomass threshold value for a specific landscape the fire cannot percolate. If the amount required is less than the threshold value, then there is the potential for the fire to percolate conditional on the size of the landscape considered. The quantity pocc – pcrit adjusts for the probability that some cells may not have any measurable biomass, i.e., pocc < 1.0. If pocc <pcrit then fire cannot percolate across the landscape under any circumstances.
Results
Simple Binary Landscape Experiments
Landscape Scale Percolation Experiment [E-1]
The slope of the percolation probability curve estimated from model runs for different landscape scales steepens in the transition from a probability of zero to a probability of one as landscapes become larger (Figure 5). Also, the range of landscape values between the lower bound of no percolation and the upper bound of always percolating narrows as landscape scale increases. This is consistent with the theoretical result for infinite landscapes which produce a step function of no percolation with p-values below pcrit and certain percolation above pcrit. Interestingly, the curves for the landscapes of different size intersect close to the pcrit value on the x-axis (Figure 5).
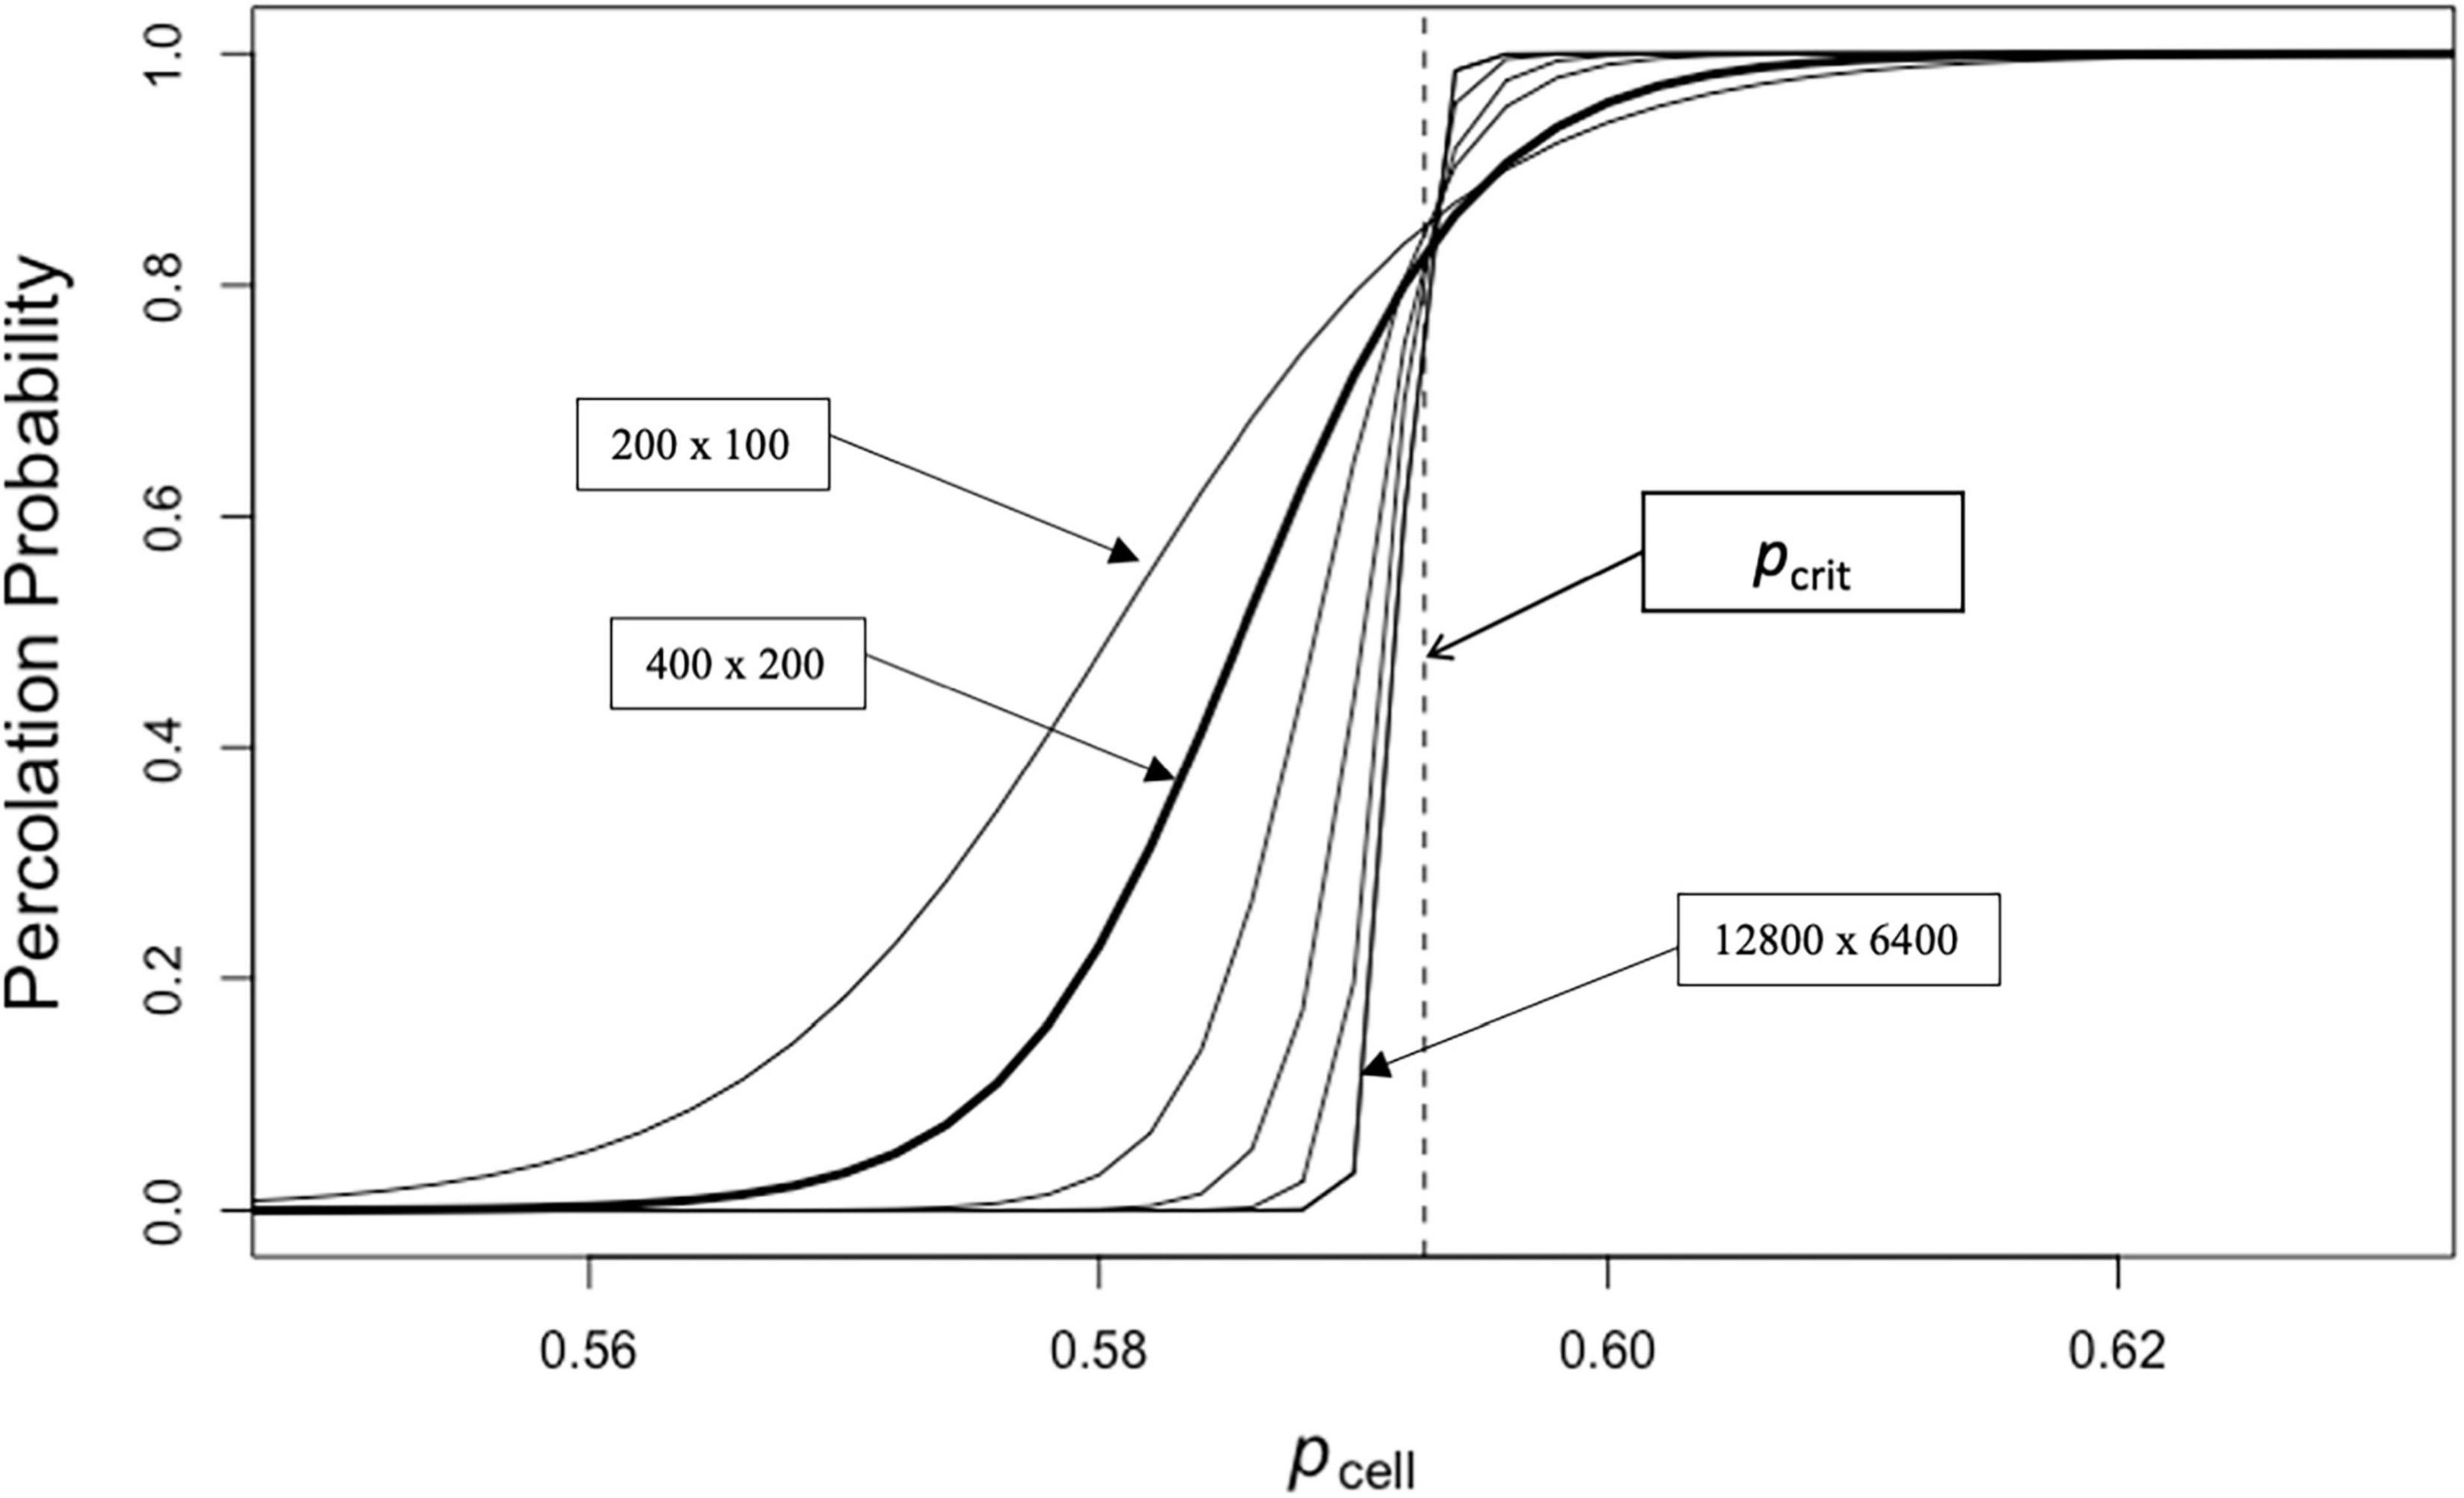
Figure 5. Probability of fire percolation with landscapes of different size (Experiment E-1).
Probability of Spread Experiment [E-2]
In lowering s (the probability of fire spread from cell to cell) from a maximum value of 1.0 to a value of 0.5 (below the critical value) we see that the percolation probability curves shift to the right (Figure 6). This indicates that the number of cells that are capable of burning must increase to produce similar percolation probabilities as the cell-to-cell spread of fire decreases in probability. The curve with the probability of spread s = 1.0 in Figure 6 is the same as the curve for the 400 × 200 cell landscape in Figure 5. Although the percolation curve for spread of 0.5 never reaches an upper value of 1.0 for any value of pcell, there are by chance some cases where there is percolation as evidenced by values for the curve above 0.0.
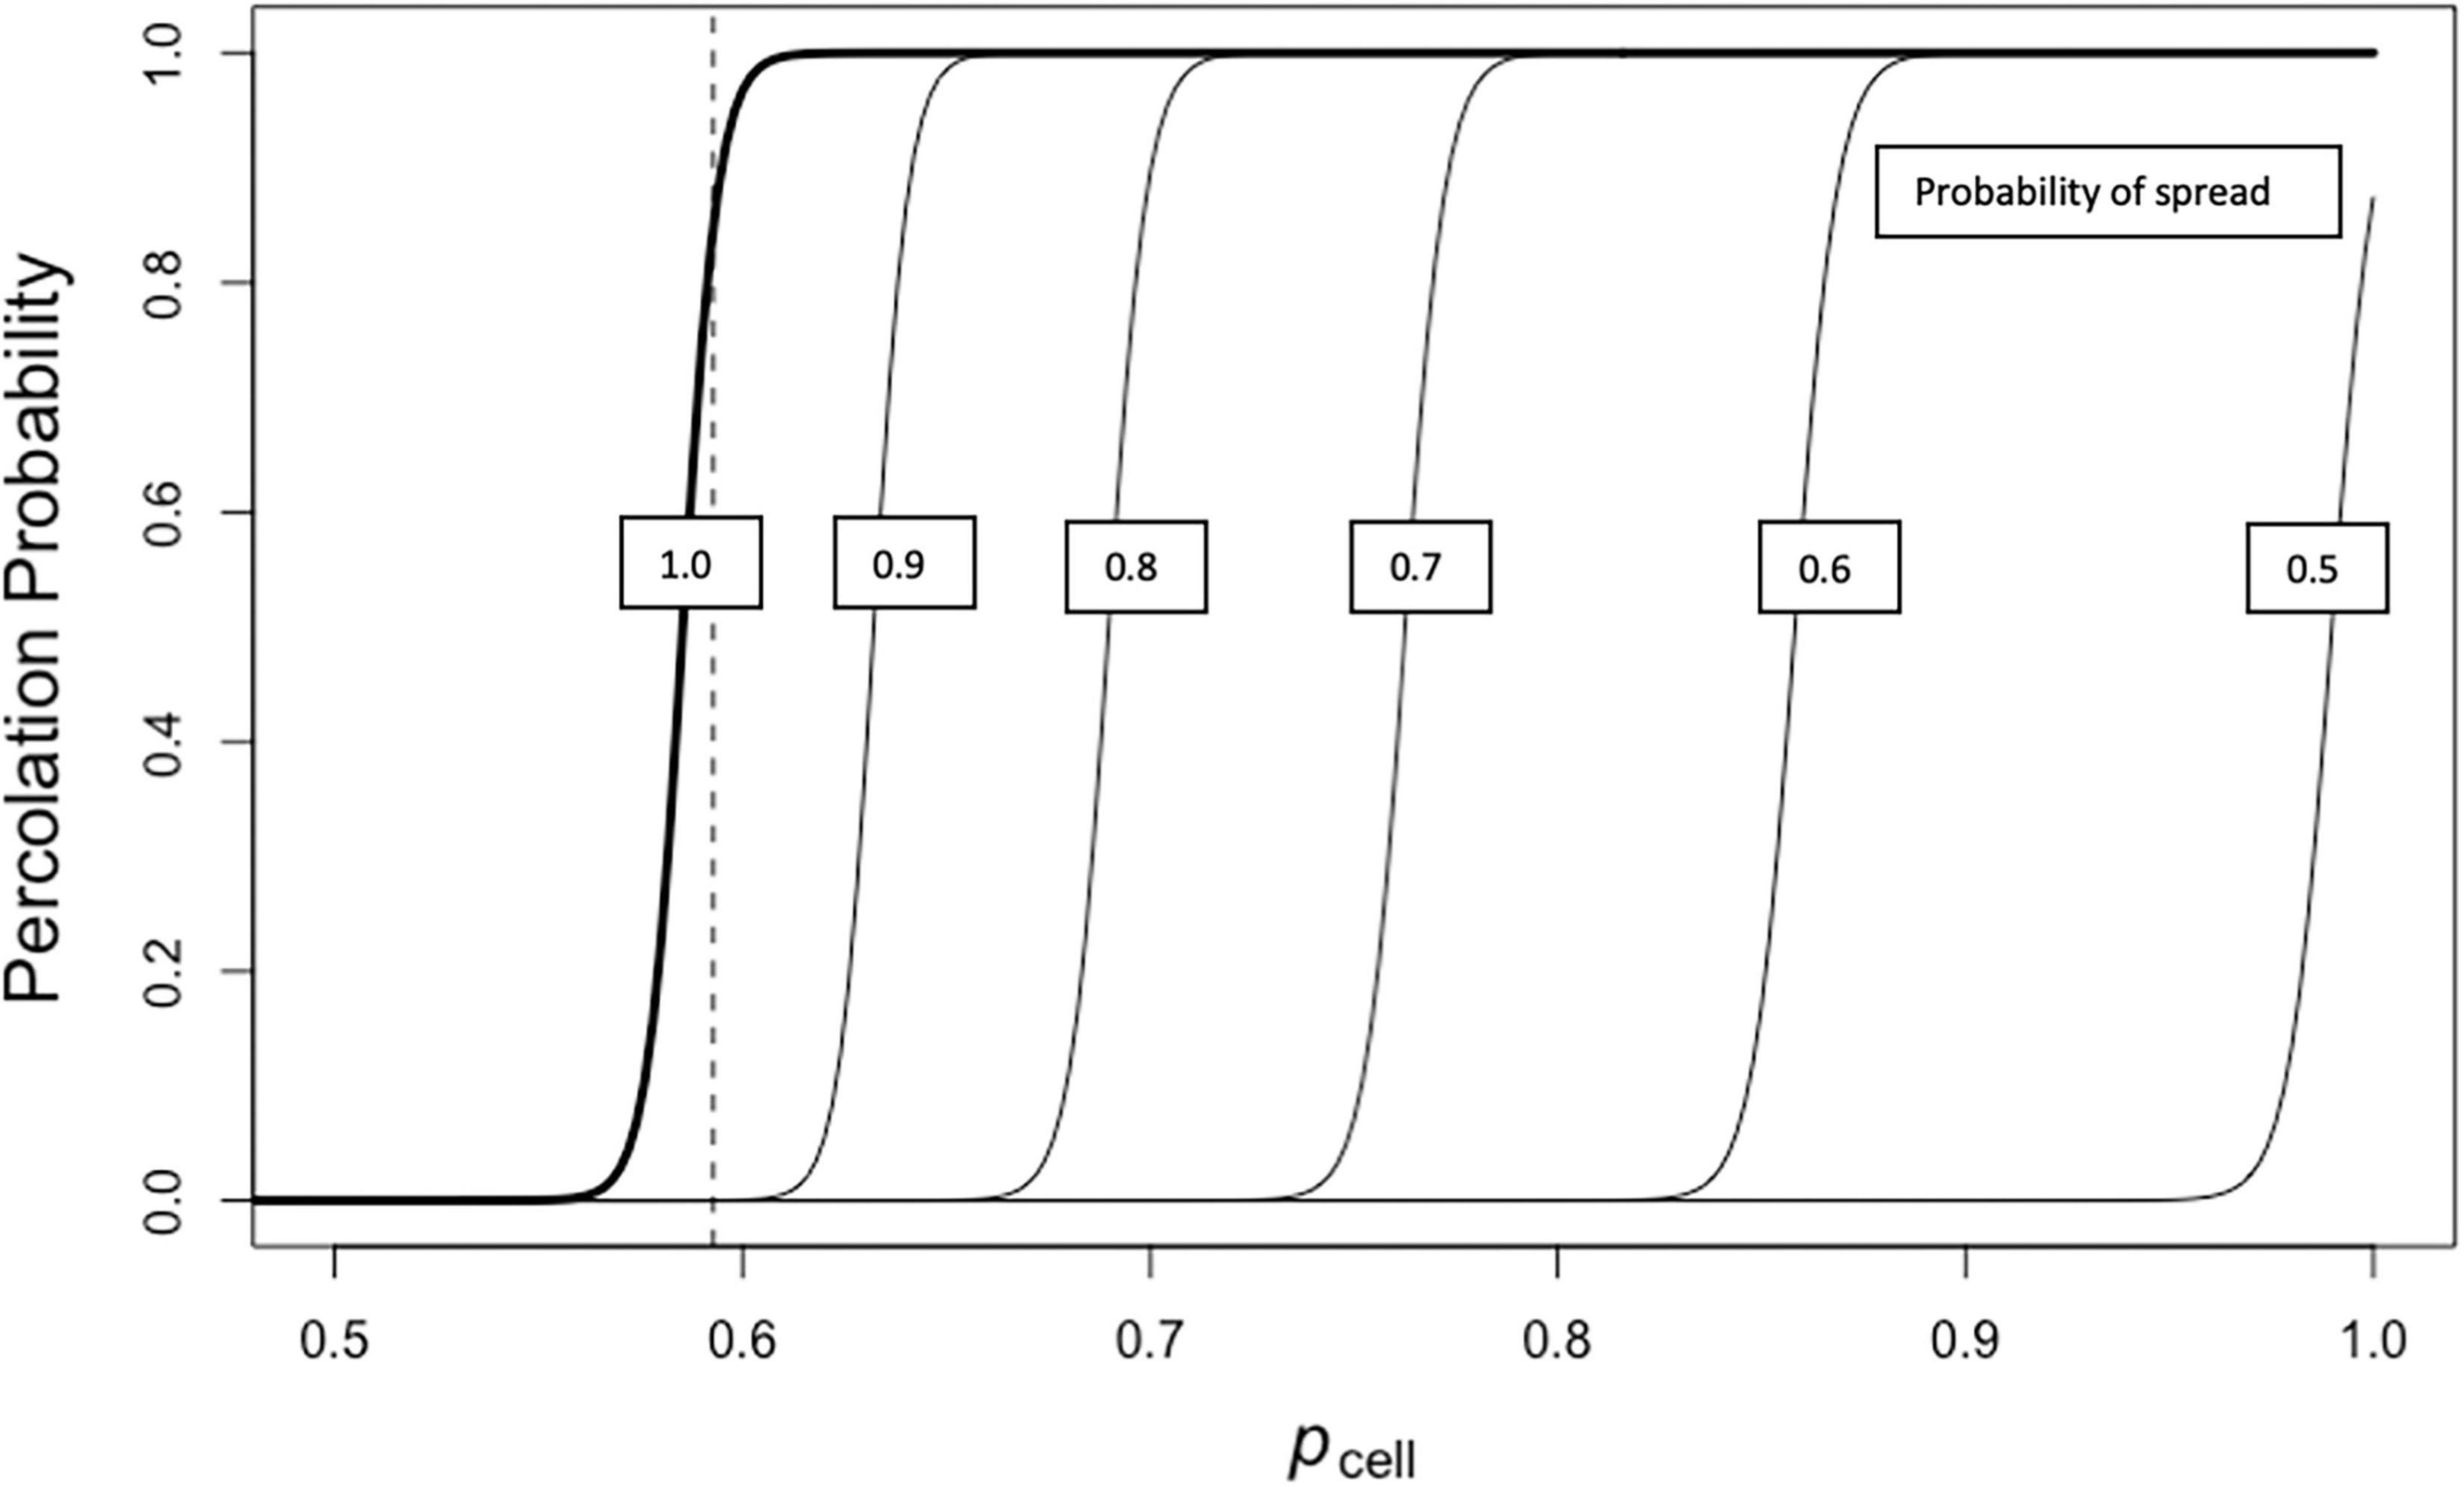
Figure 6. Percolation probability of fire across a landscape with different probabilities of spread (sij) given varying levels of pcell (Experiment E-2).
Point-Spread Experiment [E-3]
When fires are initiated in a single location, the amount of the landscape that is impacted by fire can vary greatly among replicates with the same value of pcell (Figure 7). In many cases, the proportion of flammable sites or total landscape burned can range from approximately zero to very high values. The highest values occur when all cells capable of burning are burned. The pcrit dividing line provides a good reference point to see how this works (Figure 7).
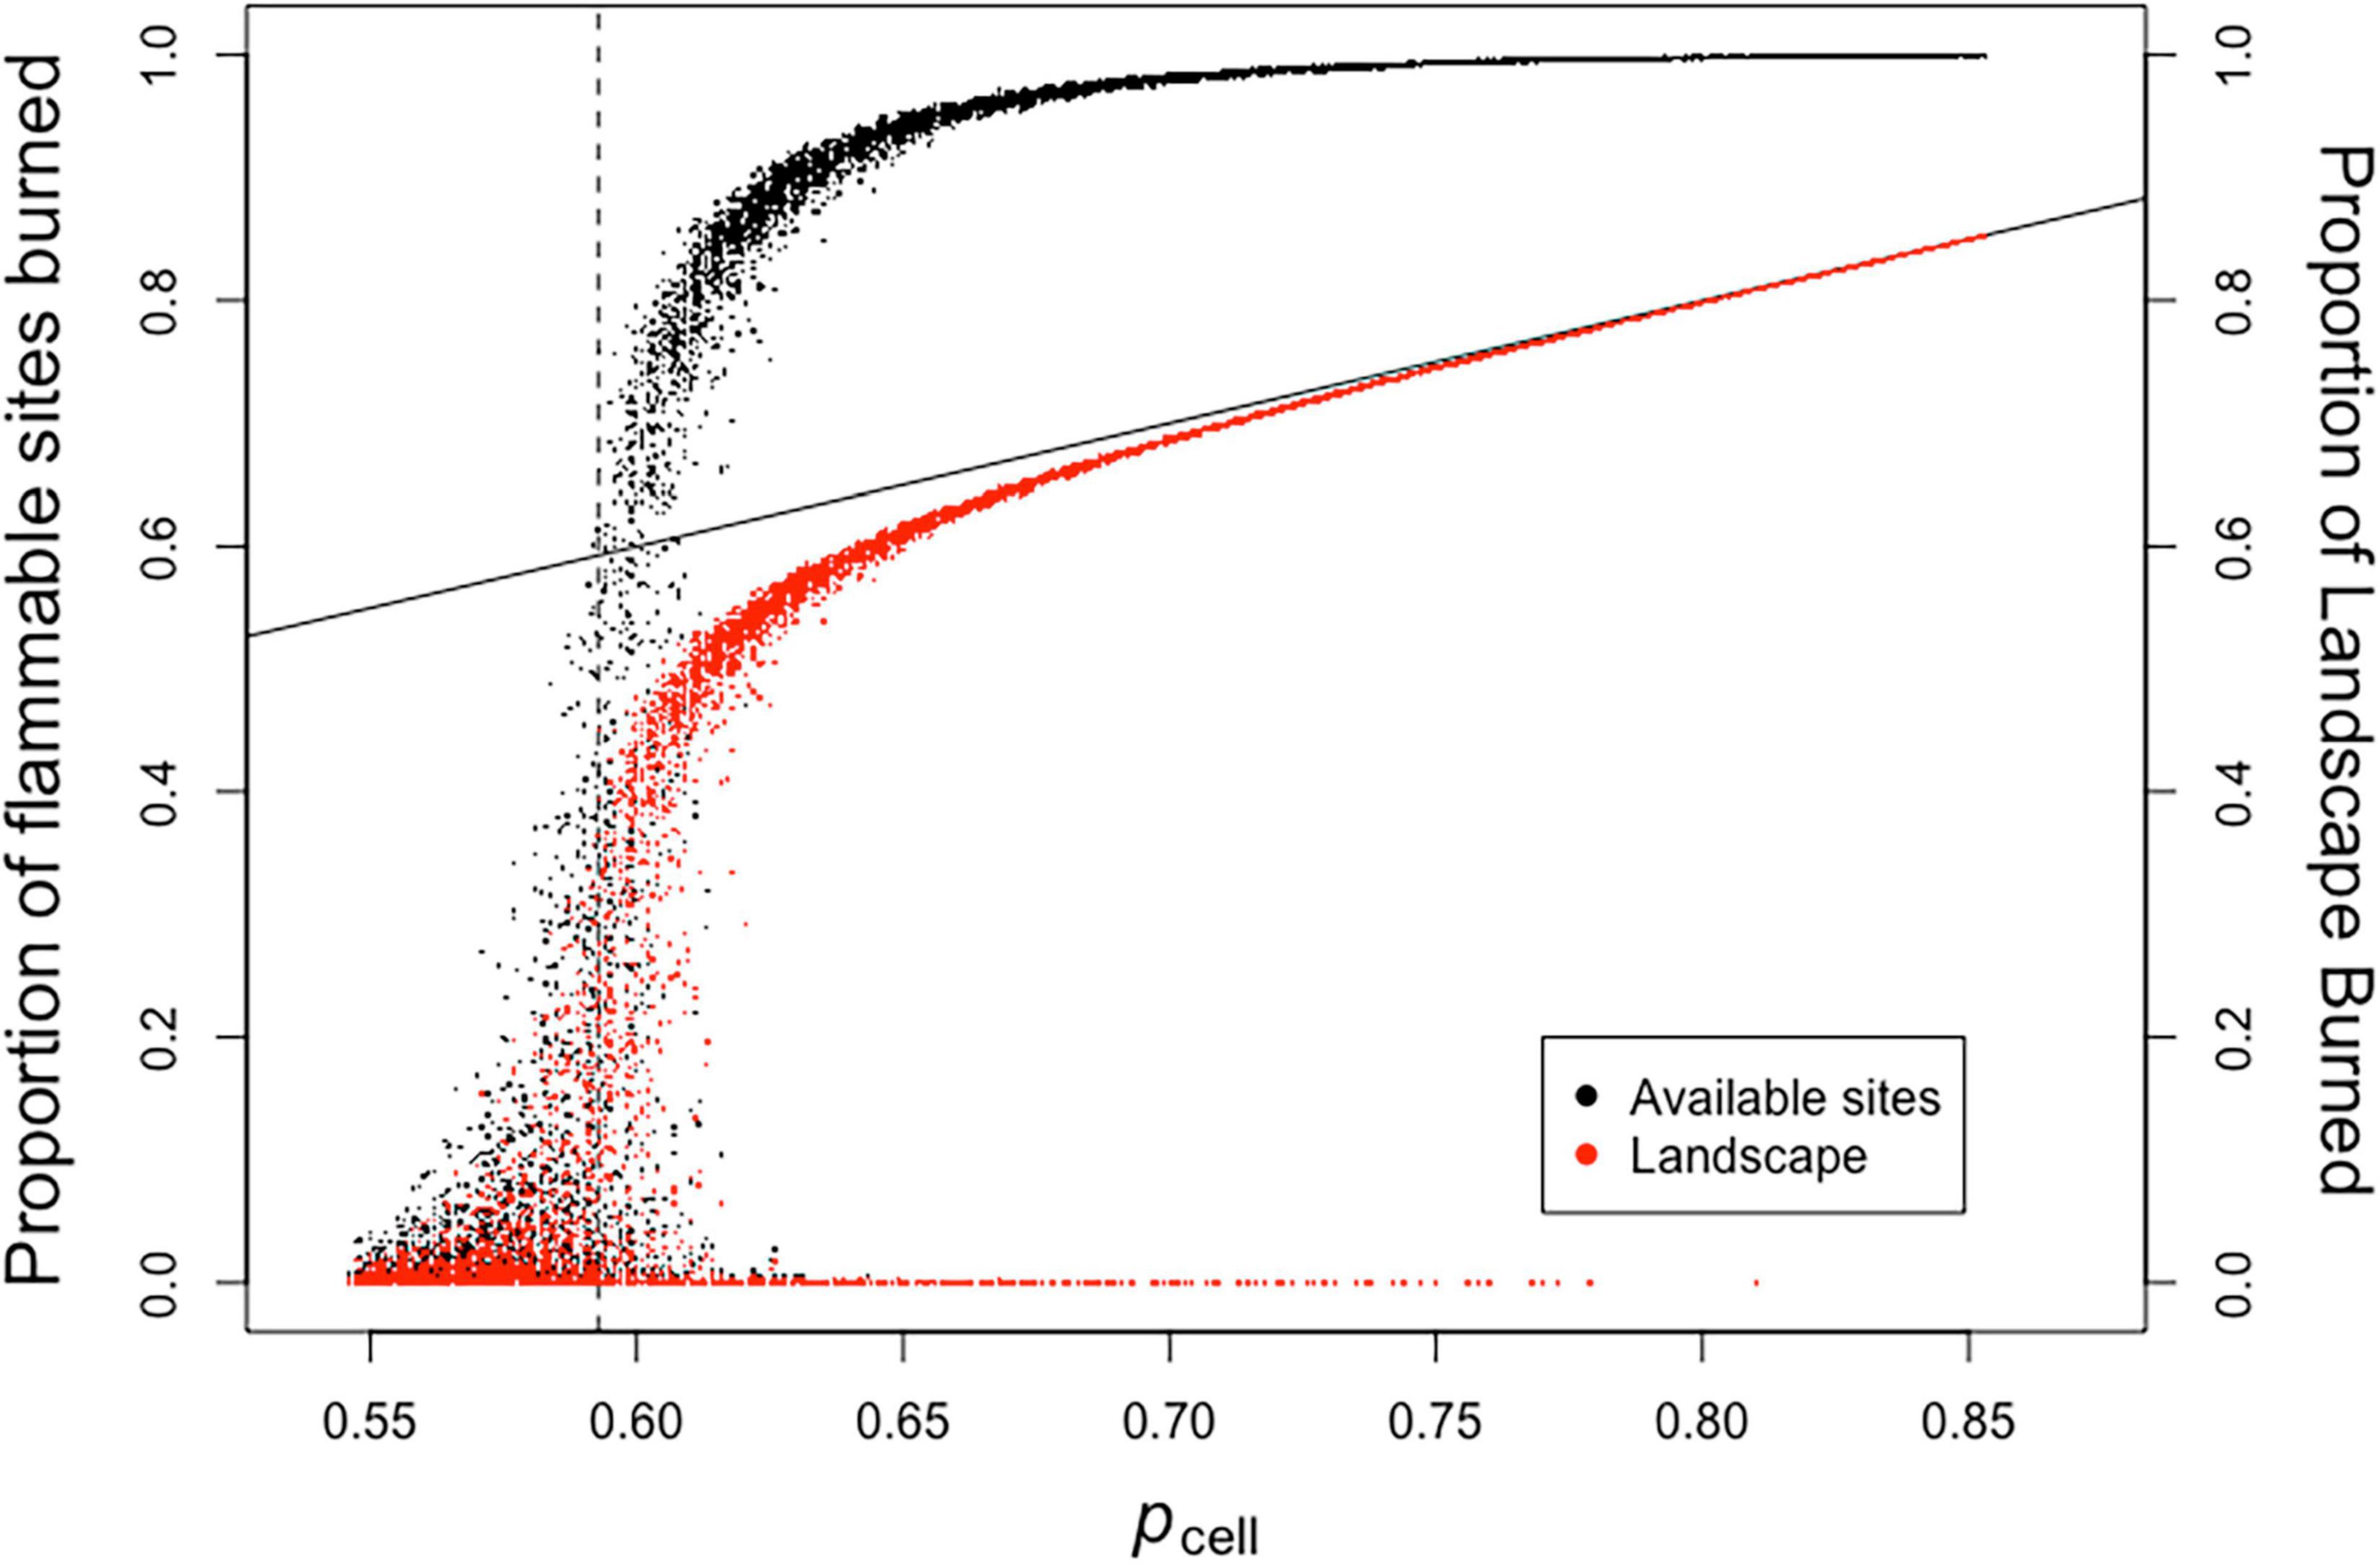
Figure 7. Point source ignition experiments for a binary landscape. The probability of a cell being flammable (pcell) was varied from 0.55 to 0.85 in increments of 0.002 for each burn experiment with 100 replicates for each value of pcell. Proportion of available sites burned is the number of cells burned divided by the number of flammable cells in each model run. Proportion of landscape burned is the number of burned cells divided by the total number of model cells in each model run. The vertical dashed line is pcrit. The solid sloped line is y = x.
Proceeding from pcell values of 0.55 (well below pcrit) to higher values, the maximum number of flammable sites burned among replicates increases, while many replicates still have a low proportion of sites burning, in many cases close to zero. The same trend is observed above pcrit, although the variance in proportion burned among replicates drastically decreases at pcell values above approximately 0.65 (Figure 7). However, there are a few replicates that show a very low proportion of flammable sites and landscape burned for values of pcell above 0.65 until a bit above 0.80. These low values of fire spread occur when the initial location set on fire falls in a rare neighborhood surrounded by sites that are not flammable.
Shrub as Firebreak or Accelerant Experiment [E-4]
The impact of shrubs in the landscape changes the probability of percolation depending upon whether shrubs burn or don’t burn (Figure 8). The direction of change in the percolation curve is as one would predict, with shrubs being able to burn shifting the percolation curve to the left (i.e., fire spreads easier at lower values of matrix flammability; low pcell values). The curve shifts to the right when shrubs do not burn. These circumstances reflect changes that can occur with shifts in moisture status of creosote and annual plants protected from moisture loss by shading and the shrub-island effect under shrubs. Creosote branches and annuals with higher moisture content require higher levels of exposure to fires in the matrix and under the canopy to ignite (Fuentes-Ramirez et al., 2016).
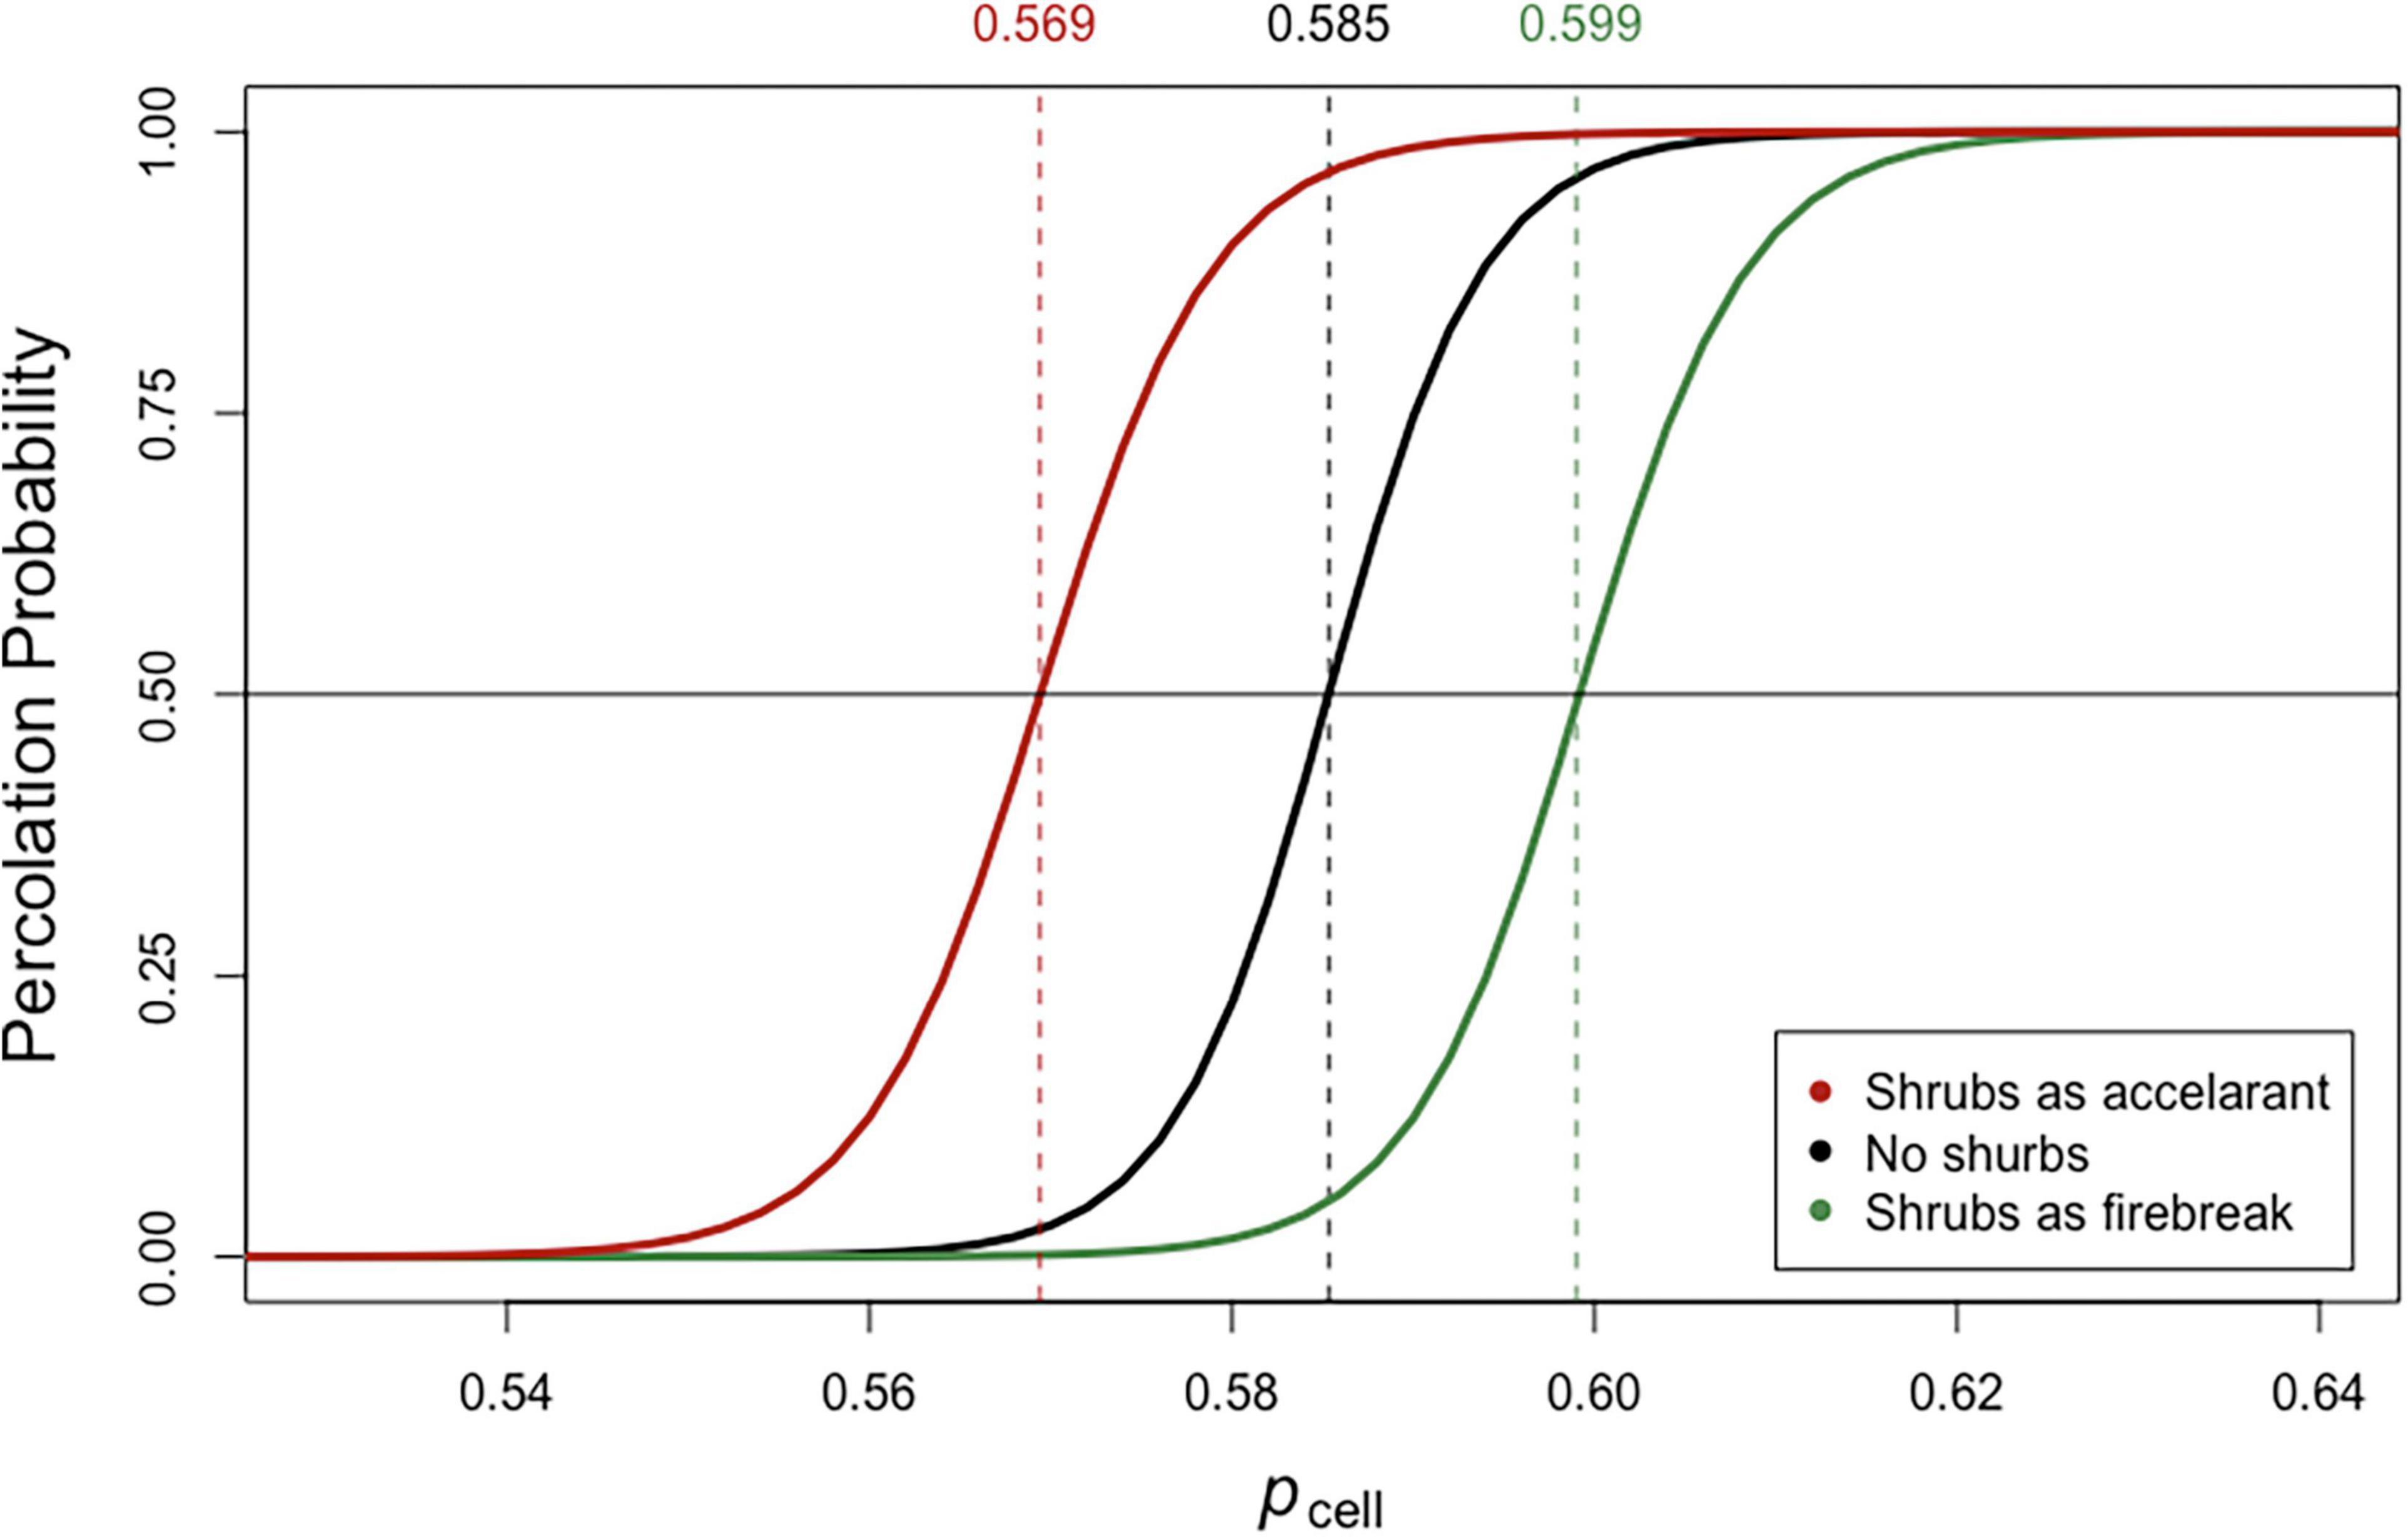
Figure 8. Percolation probabilities for binary landscapes with shrubs acting as firebreaks (shrubs do not burn) or accelerants (shrubs burn) as compared to a landscape with no shrubs. Shrubs were randomly assigned with a distribution and size closely mimicking measured shrubs in the Mojave experiment (see section “Materials and Methods”). Vertical dotted lines are values at which there is a 50:50 probability that fire will percolate across the landscape in the vertical direction.
Realistic Landscape Experiments
Biomass-Matrix Percolation Experiments [E-5]
Characterizing the matrix as being composed of annual plants with a gamma biomass distribution produces a percolation response similar to the response seen in the binary landscapes (cf., Figure 9A with Figures 5, 6). As the proportion of the landscape that is flammable increases, we go from a landscape that doesn’t percolate to one that always percolates once we have passed the critical threshold pcrit.
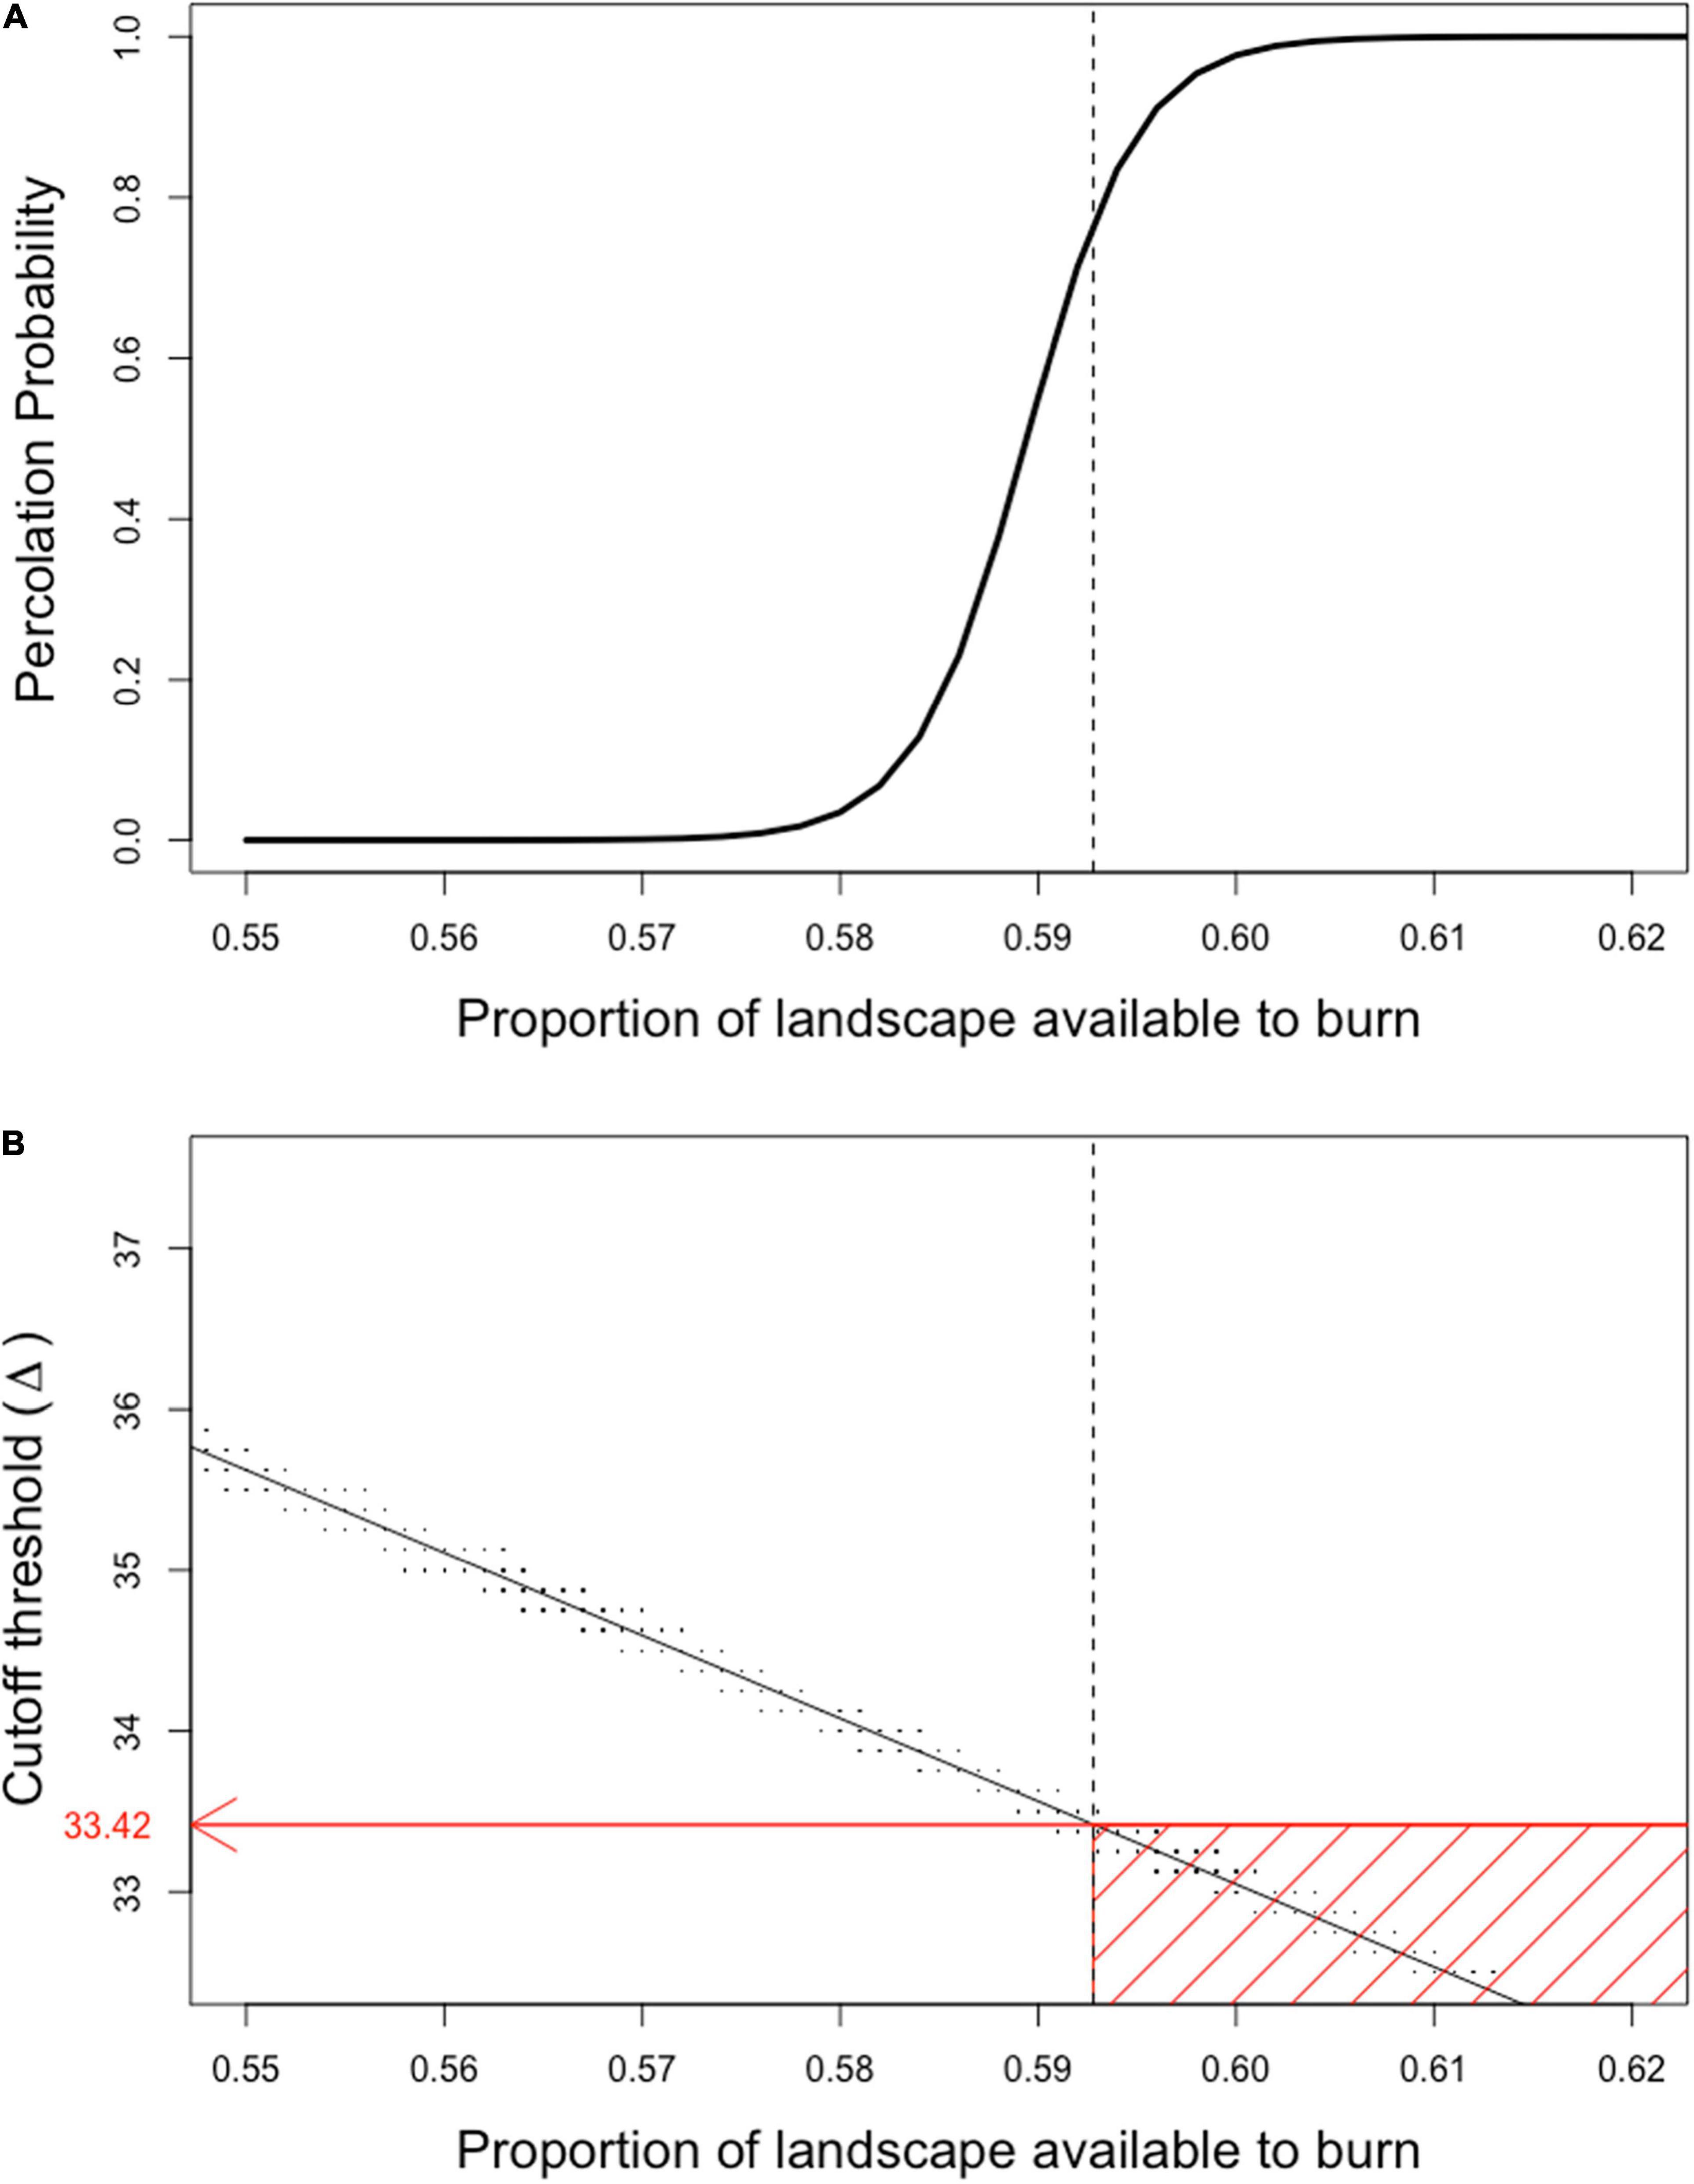
Figure 9. Percolation probabilities and flammability of landscapes at different biomass thresholds of flammability. The proportion of landscape available to burn was the proportion of cells in the landscape that had biomass values at or above the flammability cutoff value Δ. All replicates had randomly assigned biomass distributions based on the biomass levels found under the high precipitation (E), no burn (UB) and no disturbance (UT) treatment in matrix (OF) treatment sites in the Mojave site experiment using a gamma distribution fit to field data (see section “Materials and Methods” and Moloney et al., 2019). (A) Shows the percolation probability at varying levels of landscape flammability (Proportion of landscape available to burn, effectively the pcell value, was determined by calculating the proportion of cells with Δ or greater biomass, which were the cells that could spread fire). The solid line is the percolation probability curve fit to the observed model output. The dotted vertical line is at pcrit. (B) Shows the relationship between Δ and the proportion of the underlying landscape that is available to burn (effectively the pcell value). Black dots represent the relationship between biomass cutoff values Δ and the underlying proportion of the landscape that is flammable at that cutoff value for replicate model runs. The dotted vertical line is at pcrit. The solid black line is the regression line of flammability threshold regressed on proportion of landscape available to burn. The horizontal red line is the biomass cutoff value that produces a landscape that has a proportion of burnable sites equal to pcrit determined by assessing the regression at a value of pcrit; this value can also be obtained directly from the probability density function associated with the gamma distribution used in producing the landscape (cf, the entry in Table 2 for Mojave, 2013). The red box encompasses the range of conditions that will produce a landscape that will be guaranteed to percolate.
Although the percolation relationships for the current experiment and the binary landscape experiments are similar, the way we explore the relationship in the current experiment is fundamentally different. Here, the biomass distribution in the matrix is fixed by the values chosen for the gamma distribution determined from field measurements. Changes in fire spread are explored by changing the value of Δ, the biomass cutoff threshold, for a specific landscape (Figure 9B). As Δ values are lowered the proportion of the landscape that is available to burn increases, i.e., we are modeling conditions where it takes a lower amount of biomass to spread a fire when we lower the value of Δ. If we know the value of Δ from flammability experiments (e.g., Fuentes-Ramirez et al., 2016) we can then make predictions regarding the likelihood a fire will percolate across the landscape.
Using the gamma distribution, we can calculate the value of the biomass cutoff threshold Δ at which the landscape will be at the critical percolation threshold of pcrit (Figure 9B). With this as a benchmark, we can explore the percolation relationships as a function of Δ (Figure 10—upper panel). When we compare the 2013 Mojave and 2012 Sonoran model landscapes under increased precipitation (2× ambient rainfall), we find that there is a broader range of conditions in the Mojave landscape that will allow fire to percolate as compared to the Sonoran landscape. Basically, percolation in the Mojave will occur if fire spread occurs at standing biomass values of less than 33.42 g m–2, whereas fire in the Sonoran will only percolate if it can spread at values less than 27.01 g m–2. The implication is that the Mojave site would be more susceptible to fire spread than the Sonoran site, all things being equal. The relationships here however are quite artificial as they do not include the variability in biomass distributions produced by the shrub island effect, which were explored in the experiments discussed next.
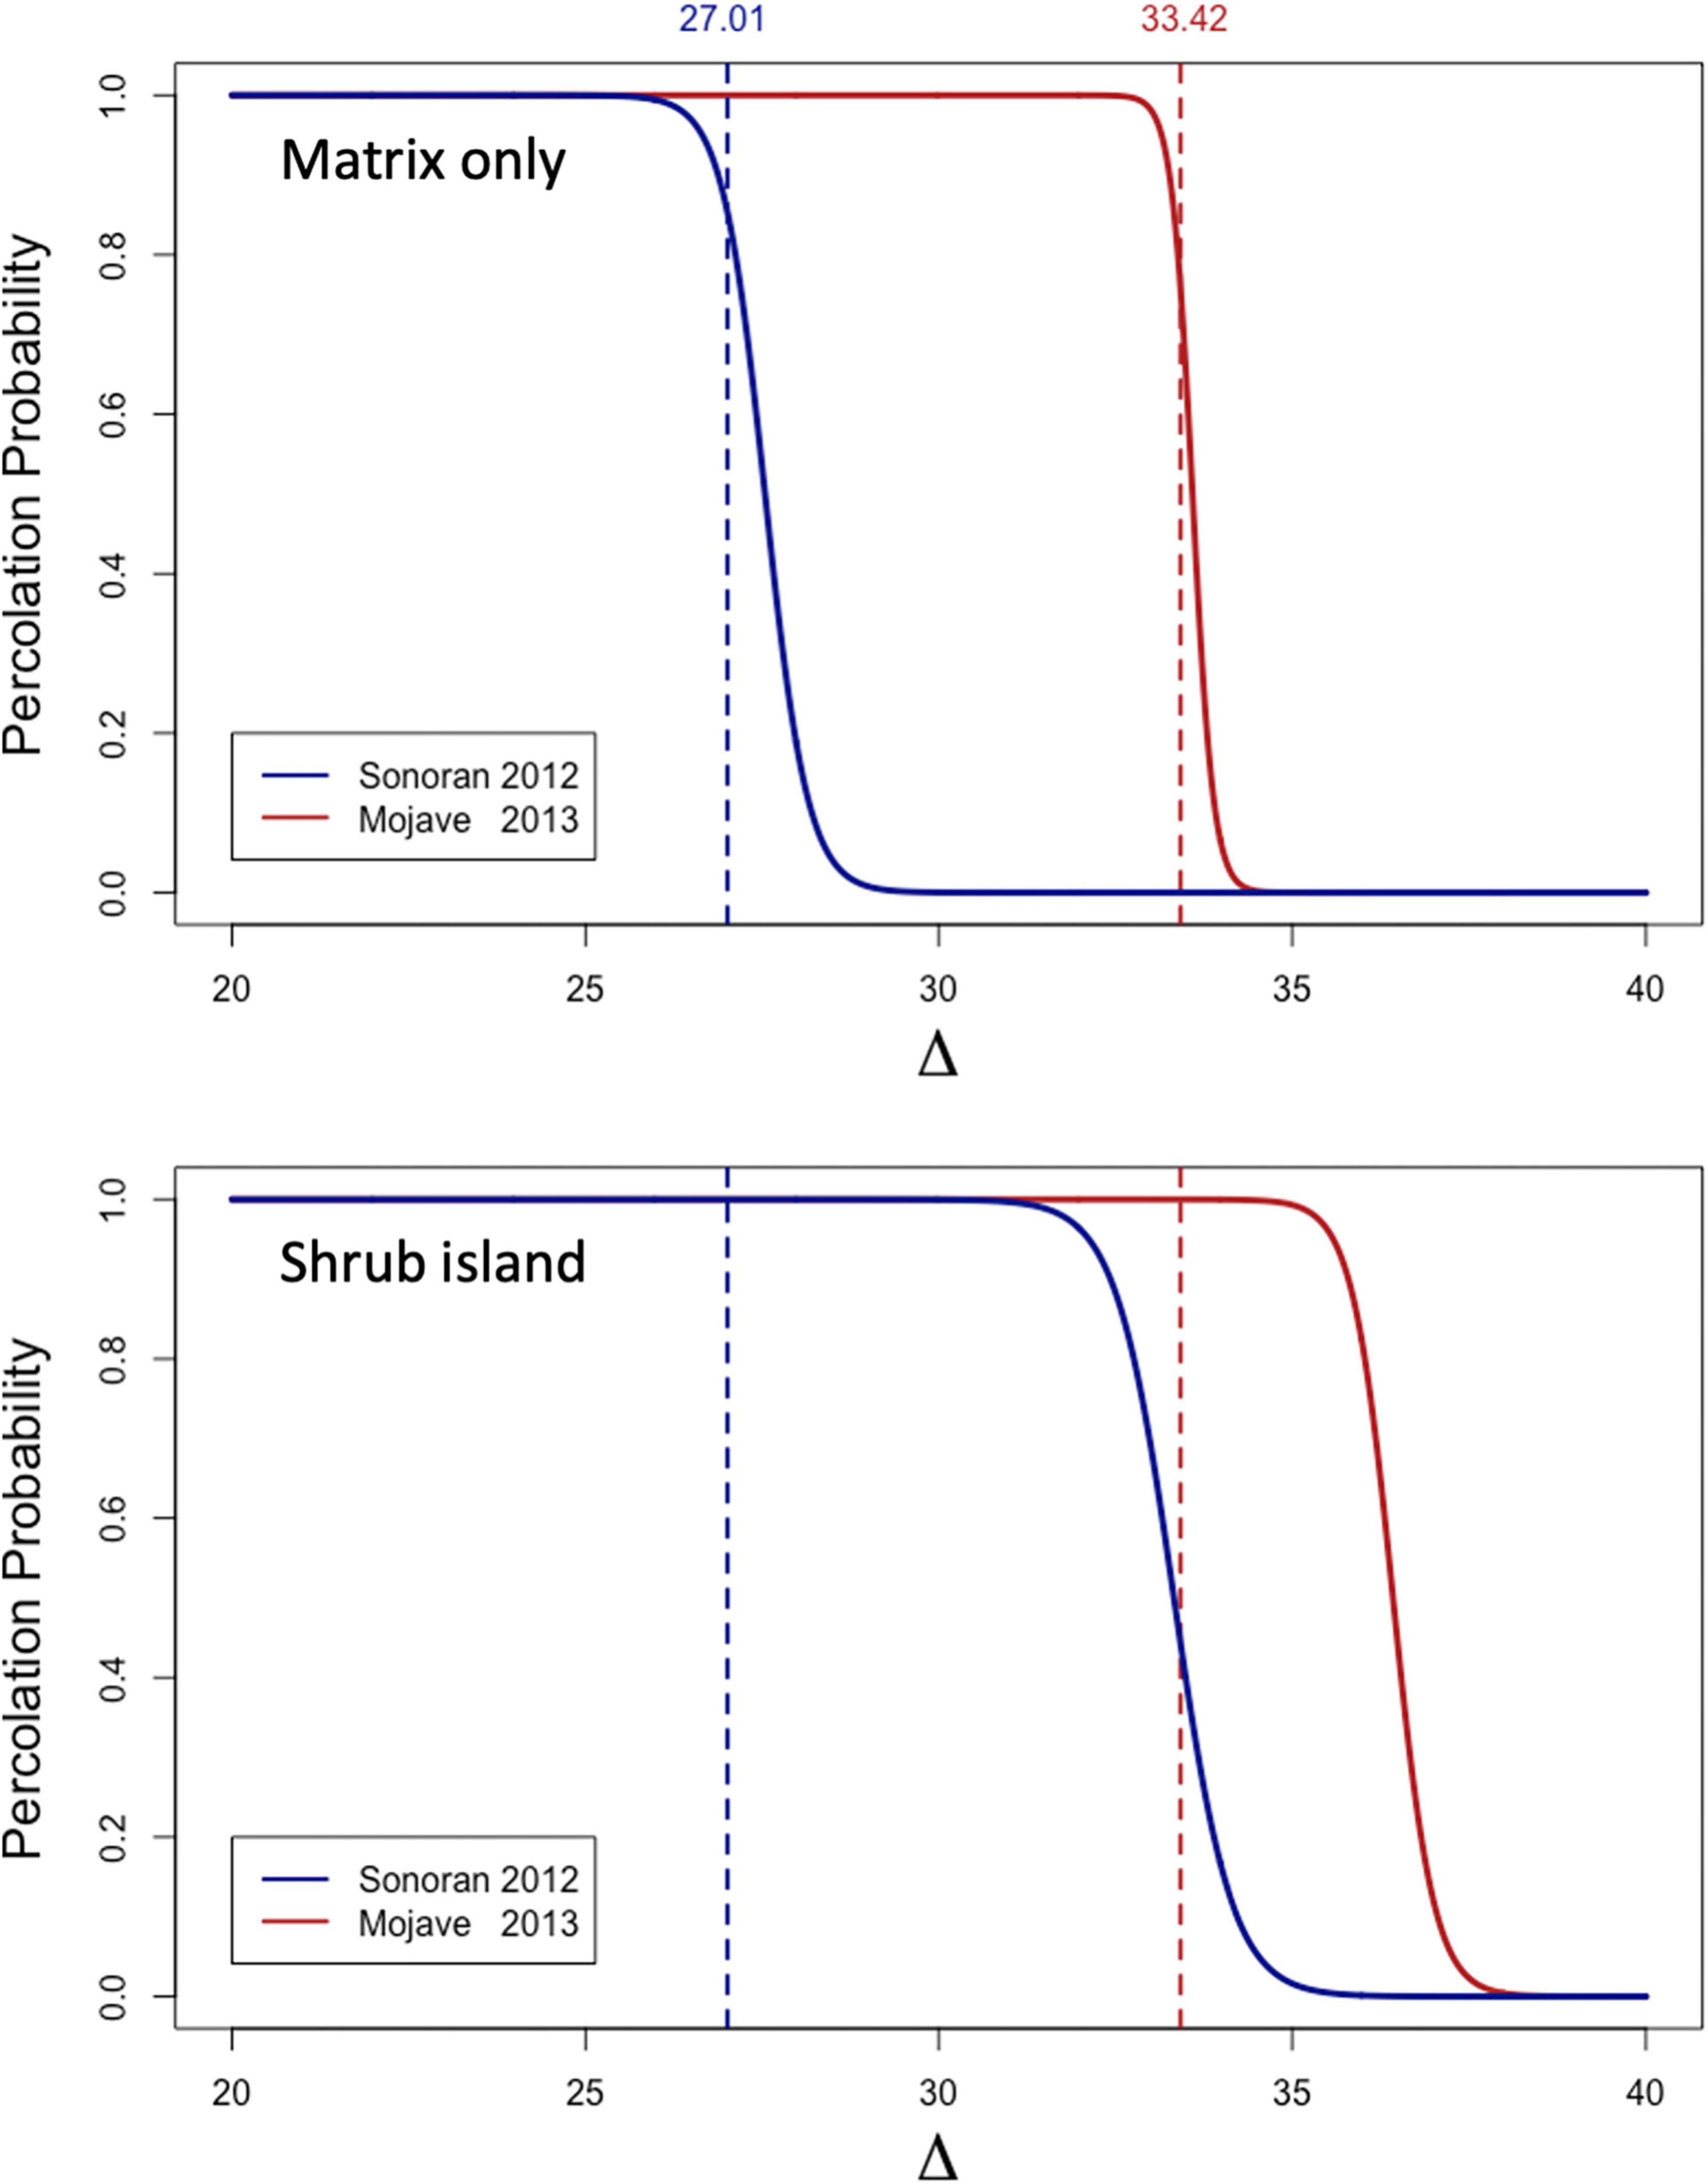
Figure 10. Percolation probability as a function of biomass cutoff values (Δ) for high precipitation conditions during best growth years in Sonoran and Mojave Desert experiments, 2012 and 2013, respectively. Vertical dashed lines correspond to the biomass value that lies at pcrit as predicted from the gamma distribution for OF sites (Table 3). Top panel: These are the percolation probabilities for a model containing only matrix habitat based on the OF experimental plots for Sonoran and Mojave Desert Experiments. Bottom panel: These are the percolation probabilities for a shrub island model during the same year.
Shrub-Island Experiments
Shrub-Island Percolation Experiment [E-6]
Comparing the shrub-island percolation experiment to the results for the biomass-matrix experiment (E-5), we see that the minimum biomass required to have a high probability for percolation shifts to higher values in the shrub-island model (Figure 10). The spread of fire is accelerated by the conditions associated with shrubs in the community. In examining Table 3, it is clear that this is due to the higher levels of biomass found in the microhabitats near to the shrubs (ON) and at the canopy dripline (CD). The effect is stronger for the Sonoran site model as can be seen in the larger shift to the right by the percolation curve for the shrub-island model (Figure 10). The increased shift may be due to the fact that the under-canopy microhabitat (UC) at the Sonoran site has biomass levels almost as high as the CD habitat, but in the Mojave they drop off markedly. The high level of fuel load continuity under shrubs in the Sonoran site act to accelerate fire spread more effectively than in the Mojave.
Shrub-Island Point-Spread Experiment [E-7]
As with the simple binary landscape, point-spread experiment [E-3], there is a great deal of variability in the amount of landscape burned after a point ignition over a range of biomass threshold (Δ) values (Figure 11). At even very low Δ values, there are instances where fire affects almost none of the landscape for both the Mojave and Sonoran models even though in most replicates a large proportion of the landscape burns. However, in general as Δ lowers there is less variability than at higher Δ values as the landscape becomes more interconnected and most flammable sites are reached by fire spread.
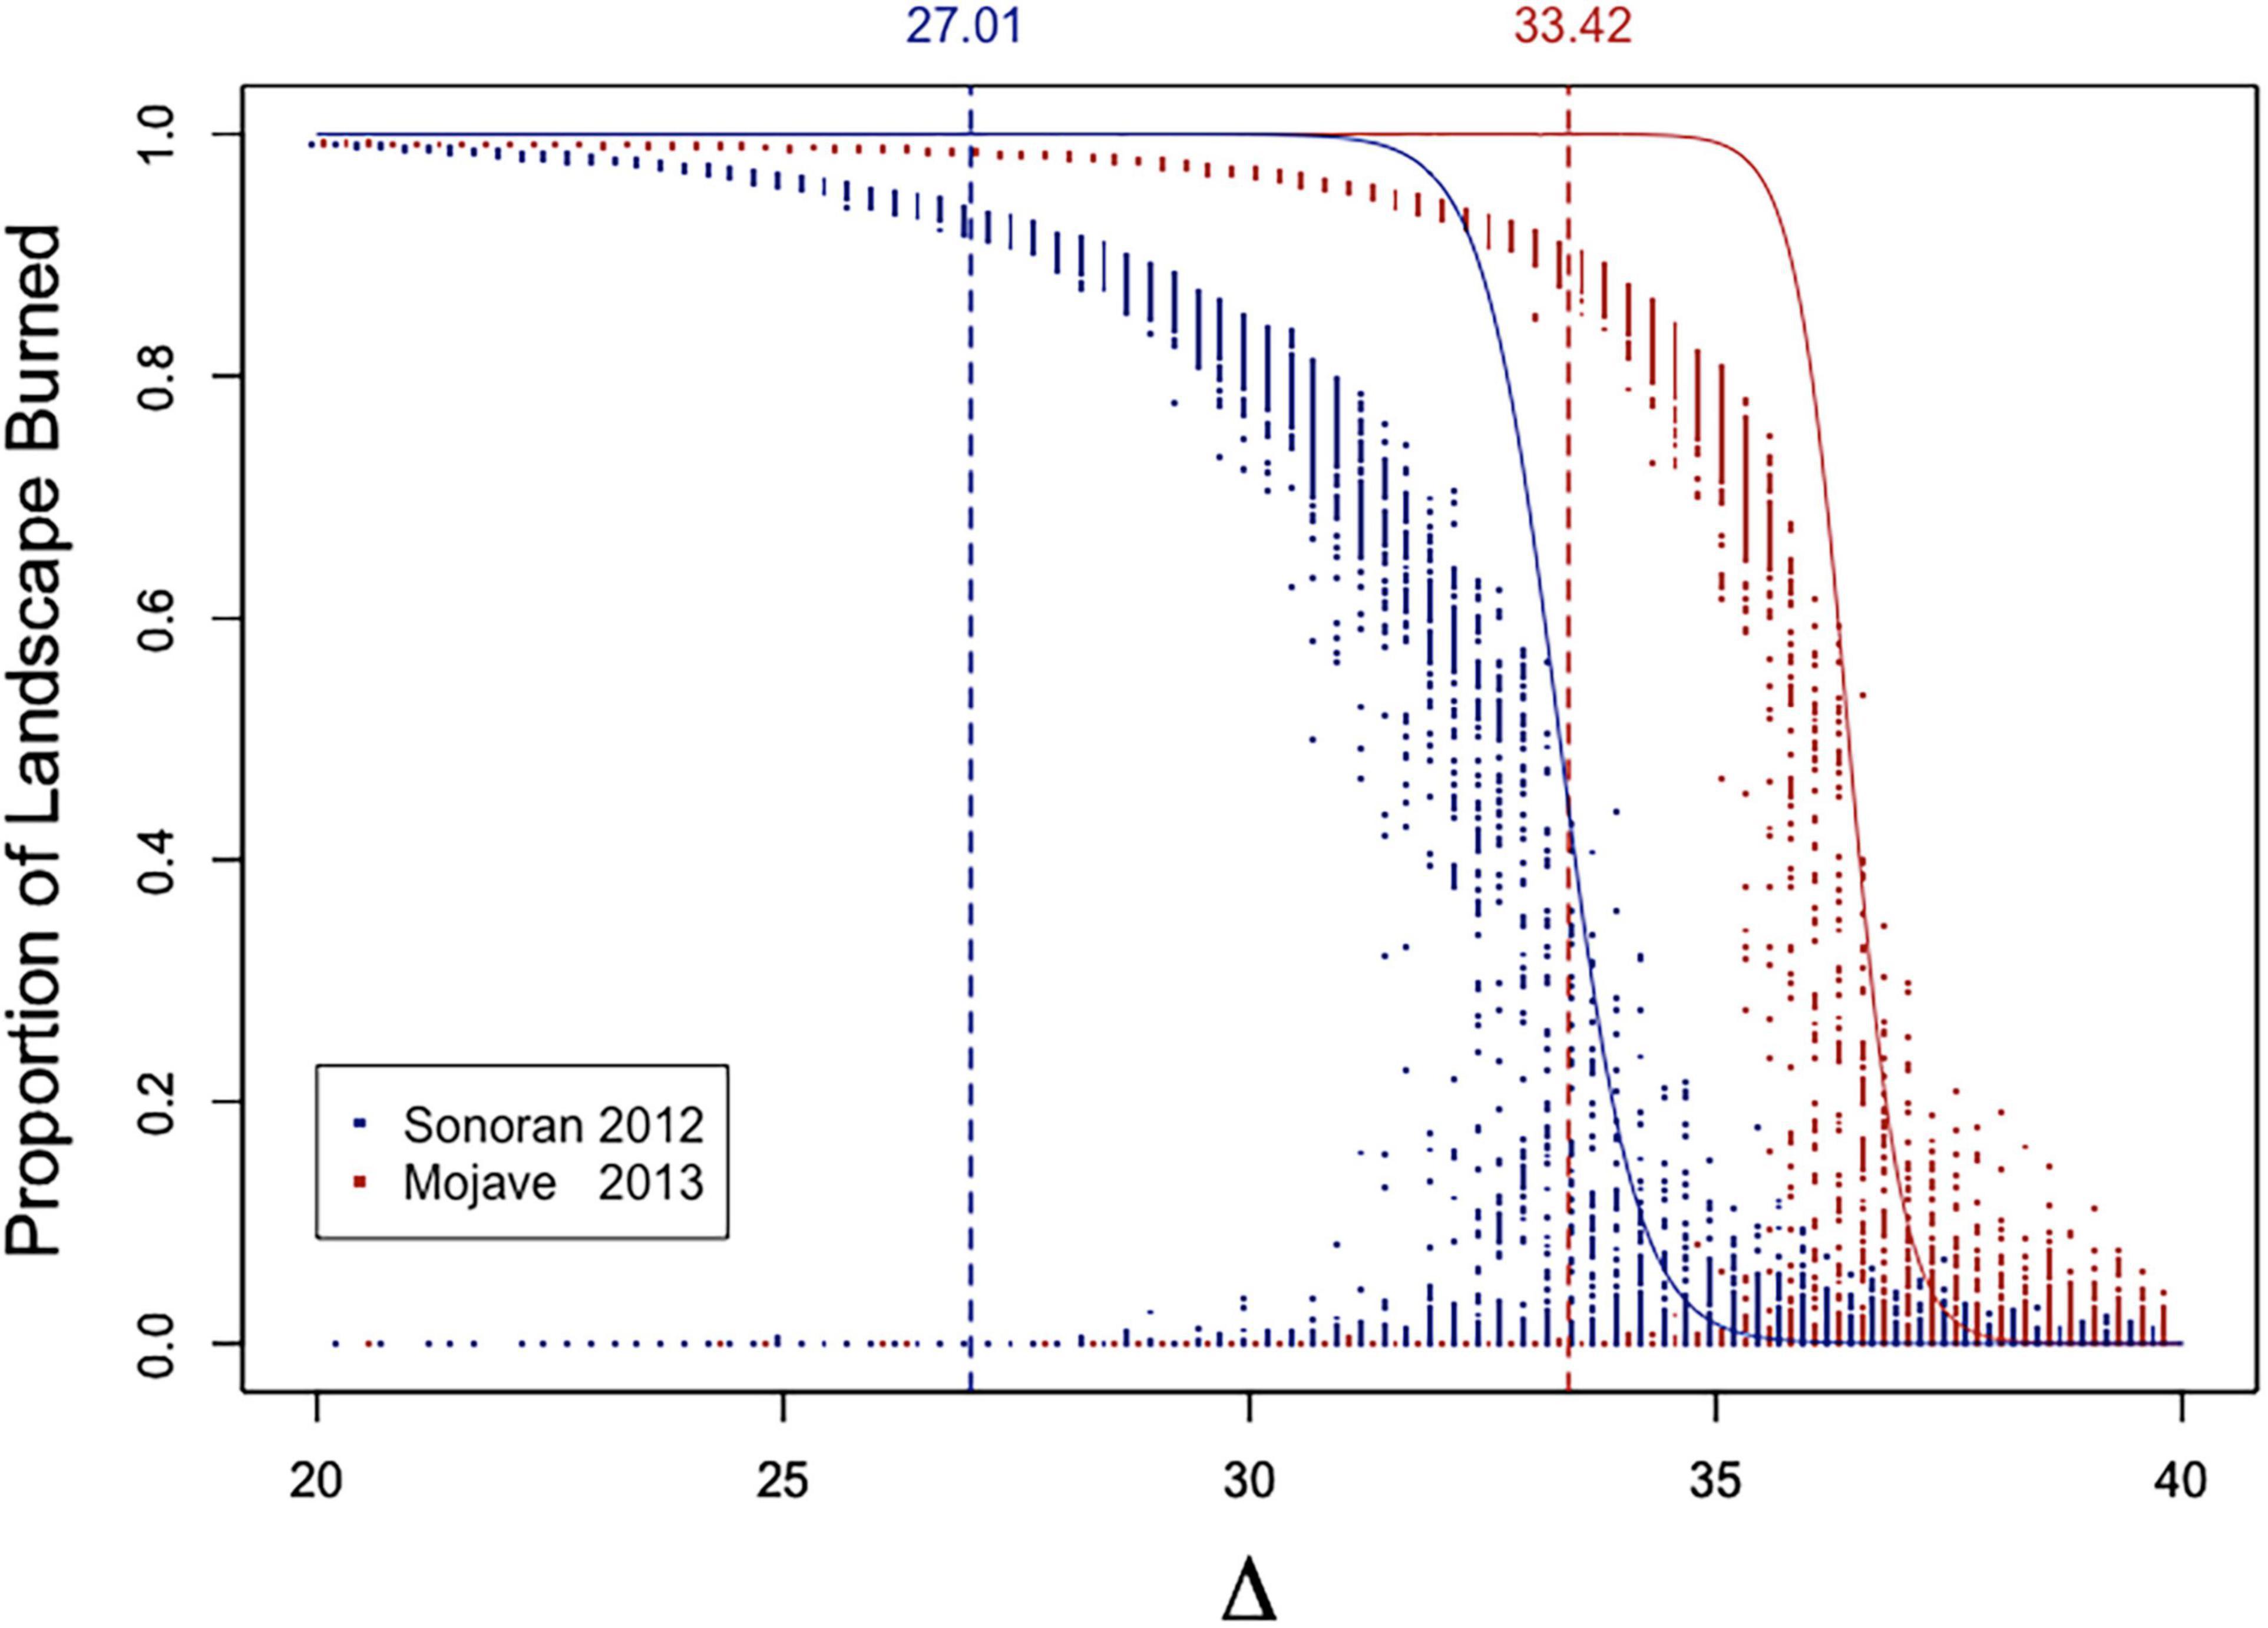
Figure 11. Proportion of landscape burned by fire initiated within a single cell. Red points are replicates in the Mojave 2013 model and blue points in Sonoran 2012. Solid lines are the percolation probabilities shown in Figure 10. Vertical dashed lines correspond to the biomass value that lies at pcrit as predicted from the gamma distribution for OF sites (Table 3).
Discussion
The sequence of model experiments presented here started with a very basic, binary landscape characterizing only two types of habitat, flammable and non-flammable, distributed at random. More “realistic” detail was then added to the model to explore the impact on the spread of fire of: (1) the differential likelihood of ignition of neighboring cells from a burning cell; (2) the presence of shrubs; and (3) patterns of biomass distribution based on field observations and precipitation experiments. By approaching the problem this way a deeper, more nuanced understanding of the process can be built up step-by-step. The alternative approach of building a more complete model and then exploring the dynamics is also a valid approach, but our view is that the latter approach is more appropriate for the study of specific systems and is not as generalizable.
Spread of Fire Across the Landscape (Percolation)
The experiments we used to explore the spread of fire across the landscape viewed fire spread through the lens of percolation theory, which has a fairly deep history in the modeling of fire and landscapes (Niessen and Blumen, 1986; Ohtsuki and Keyes, 1986; Grassberger, 2002; Zinck and Grimm, 2009; Abades et al., 2014). Percolation theory has also played a significant role in the discipline of landscape ecology in the development of an understanding of movement of organisms through fragmented landscapes, which can be viewed as analogous to the spread of fire; both fire and organisms require suitable habitat to move through the landscape (Wiens and Milne, 1989; Johnson et al., 1992; Wiens et al., 1997; Wu, 2013). Studying percolation of fire across a landscape element provides a macroecological view of the way fire can spread across the broader landscape.
As can be seen in our first model experiment [E-1], our understanding of the movement of fire across the landscape is influenced by the scale of the landscape considered. The likelihood that there will be a continuous path of flammable sites connecting across the landscape (percolating) shifts with changes in fuel availability. The smaller the landscape the more gradual the shift from a non-percolating landscape to a percolating landscape as the proportion of flammable sites increases (Figure 5). The reason for this is that larger landscapes will more likely have a random arrangement of sites that lead to a pathway of fuel from one edge of the landscape to another at a given probability of site flammability. This is due to what has been called the sampling effect (cf., Jarvis et al., 2017). Another factor affecting the likelihood that fire can percolate across the landscape is the likelihood that fire can spread from a burning site to adjacent sites in the neighborhood. Factors affecting this include fuel load, moisture status of vegetation, relative humidity, temperature, windspeed and wind direction (Benson et al., 2008; Fuentes-Ramirez et al., 2016; Estes et al., 2017). We explored the impact of changing conditions of spread in an experiment [E-2] altering the probability that a burning site will set an adjacent site with sufficient fuel to burn on fire (Figure 6). The impact of lower likelihood of spread, even with sufficient fuel, is to shift the curve representing the probability of spread across the landscape to higher levels of fuel load (i.e., pcell in the binary landscape models) but it does not change the fundamental shape of the percolation response curve.
One could argue that the binary landscape models are too simplistic in their characterization of fire spread patterns. However, we have shown that adding more realism to the model by considering fuel loads in the form of biomass distributions [experiment E-5], rather than as a binary process, produces the same overall relationship as seen in the binary landscape model (i.e., percolation probabilities; Figure 9). The net effect of including biomass as a factor in fire spread is that it allows the ability to couple changes in fuel loads to shifts in probability of fire spread across the landscape within the modeling process.
The addition of shrubs as an accelerant or inhibitor of fire spread to the simple binary model [experiment E-4] does not change the fundamental relationships coupling fuel loads to spread across the landscape (Figure 8). We can view this simplistic depiction of the impact of shrubs as a proxy for the effect shrubs have on the fuel loads under their canopies. They act as an accelerant under conditions when shrubs lead to high fuel loads under their canopies, especially when conditions enhance flammability, e.g., low moisture conditions. In contrast, inhibition could be caused by low fuel loads under shrubs due to lower growth of annuals, low flammability due to higher moisture content or due to the qualities of the fuels themselves. Fuentes-Ramirez et al. (2016) have shown that some native annual species associated with under canopy habitat require hotter conditions and longer exposure to flames to ignite.
When shrubs were added to the model the rate of change in the probability of percolation from no-percolation to always percolate was not changed significantly. What does change is the position of the percolation curve with respect to the overall proportion of the matrix sites that are flammable (Figure 8). Shrubs acting as an accelerant shift the percolation probability curve toward lower values (i.e., fire percolates at lower fuel loads), whereas shrubs acting as an inhibitor (firebreak) shift the curve toward higher values. This is of course not surprising, but it does give some insights into the magnitude of that shift. The main benefit of these models is that they provide some insights into the range of conditions under which fire risk becomes enhanced. They can also be used to explore how changes in the distribution of shrubs might impact fire spread.
Spread of Fire From a Point Source
While the model experiments exploring the percolation process take a broad scale view, the experiments examining the spread of fire from random point-source ignitions examine the within landscape process of fire spread. An important component of this is the stochastic nature of fire spread due to the local pattern of site flammability in the neighborhood of the ignition point. In the binary landscape model [E-3], there is a rapid increase in the variability of fire spread among replicates as the proportion of flammable sites goes above 0.50 (Figure 7). This variability reflects the stochastic variability of neighborhood connectivity among flammable sites. Once the proportion of flammable sites surpasses about 0.62 the variability among replicates declines dramatically. Even so, until the proportion of flammable sites is above about 0.78 there are still replicates where fire spread is almost non-existence, i.e., the proportion of flammable sites and landscape burned is quite low in some replicates.
An examination of the “curve” for the proportion of landscape burned in Figure 7 provides an insight into what occurs when the proportion of flammable sites is 0.75 or greater. Under these circumstances almost all (if not all) of the flammable sites are in contact with other flammable sites in their neighborhood. This is indicated by the fact that for a majority of replicates the number of sites burned is close to the number of flammable sites, i.e., the “proportion of landscape burned is approximately equal to pcell on Figure 7. Under these circumstances the “proportion of flammable sites burned” approaches one. The few replicates that have a low proportion of sites burned represent rare instances where fire is initiated in a non-flammable cell or in a rare neighborhood where fire initiation occurs in a cell surrounded by a neighborhood of non-flammable sites.
Linking the More Realistic Biomass Model to the Binary Model
Shifting from the binary fire model to a more realistic approach requires a more nuanced definition of fire spread. Instead of a site being set as either flammable or non-flammable, sites are characterized by their fuel loads, i.e., standing biomass, based on field measurements of biomass distributions and their statistical properties. Modeling fire spread under these circumstances requires a consideration of both whether or not a cell can burn but also whether it contains enough biomass to spread fire to adjacent cells (cf., Fuentes-Ramirez et al., 2016). Basically, any cell containing measurable biomass can burn, but its ability to spread fire to neighboring cells depends upon the amount of biomass contained within the cell. With too little biomass, the fire in a cell is either not hot enough or of enough duration to ignite adjacent cells. Because of these considerations, the determinant of fire spread is the minimal biomass required to ignite adjacent cells on fire, i.e., the biomass cutoff threshold (Δ; Table 1). Setting a value for Δ in a model run determines the proportion of the landscape available to burn for the given biomass probability distribution, similar to choosing pcell in the binary model. Any cell with Δ biomass or greater can spread fire. The equivalence between Δ and pcell is shown in Figure 9.
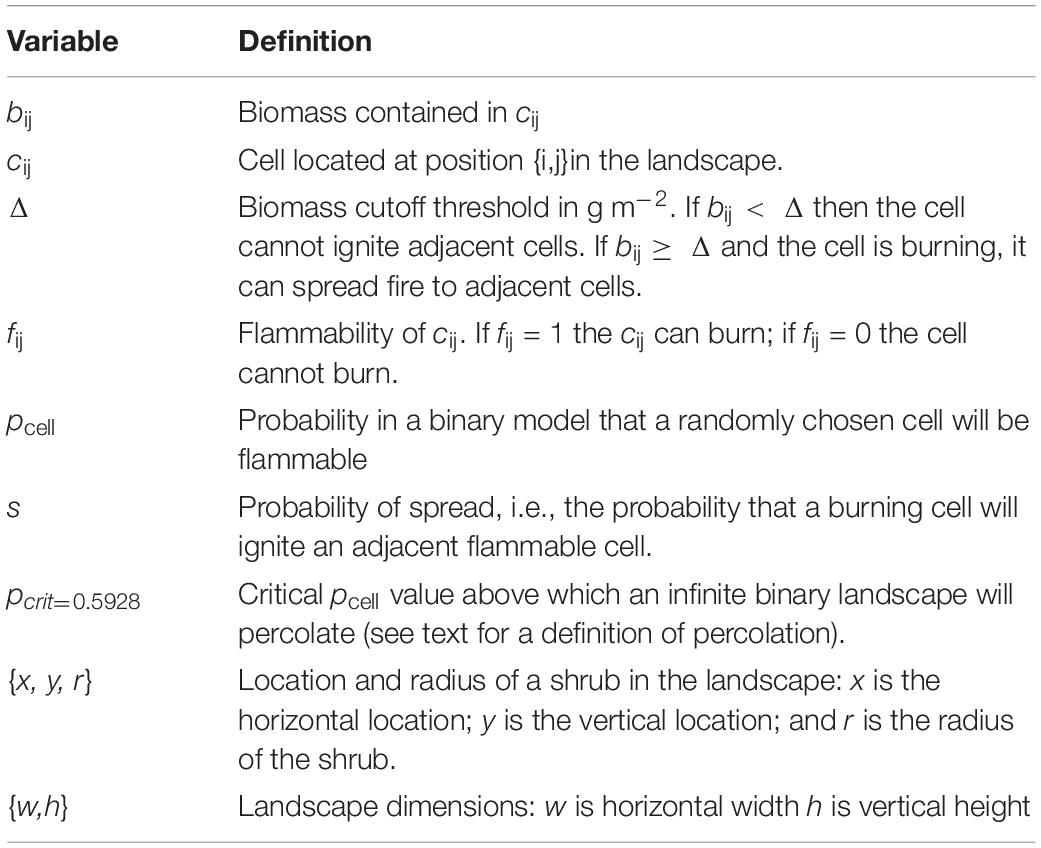
Table 1. Definitions of variables used in the model and analyses.
The Shrub-Island Effect and Fire Spread
Our model experiments show that the impact of the shrub island effect during years of enhanced precipitation is to increase the extent of fire spread (Figure 10). This results from increased production of annual plants under creosote canopies. In contrast, fires that kill creosote lead to more open systems. One might assume that this could act to decrease the spread of fire due to diminishing the shrub island effect. However the impact of fire removing shrubs has other long term effects on the distribution of nutrients reducing the spatial concentration of N and K after the shrubs are killed (Fuentes-Ramirez et al., 2015b). Exotic annual grasses have also been shown to have enhanced competitive abilities relative to native annuals when soil nutrients are scarce (Brooks, 2000). The shift in nutrient distributions may consequently lead to an increase in fuel loads in the open and result in more frequent and intense fires in the future due to a more highly connected landscape (Brooks et al., 2004; Olsson et al., 2012). The current model could be adapted to consider these situations with a proper understanding of the distribution of biomass post-fire.
Implications for Fire Management
Our models show that a characterization of the probability distribution for biomass can be used to calculate the approximate value of the Biomass threshold Δ for matrix sites that will identify conditions producing a percolating landscape in the model (see Tables 2, 3). If burn experiments indicate that the biomass required to produce ignition in adjacent locations is equal to the Biomass threshold or lower then there is a good chance that a fire can spread across the landscape. Under these conditions fire spread within the local landscape will also be extensive. The values that lead to fire spread can therefore be determined without the need to run simulation models once the parameters for the biomass probability distribution and required fuel load thresholds for spread are known.

Table 2. Biomass values for matrix microhabitat (OF) fit to a gamma distribution from the experiments conducted in the Mojave and Sonoran deserts.
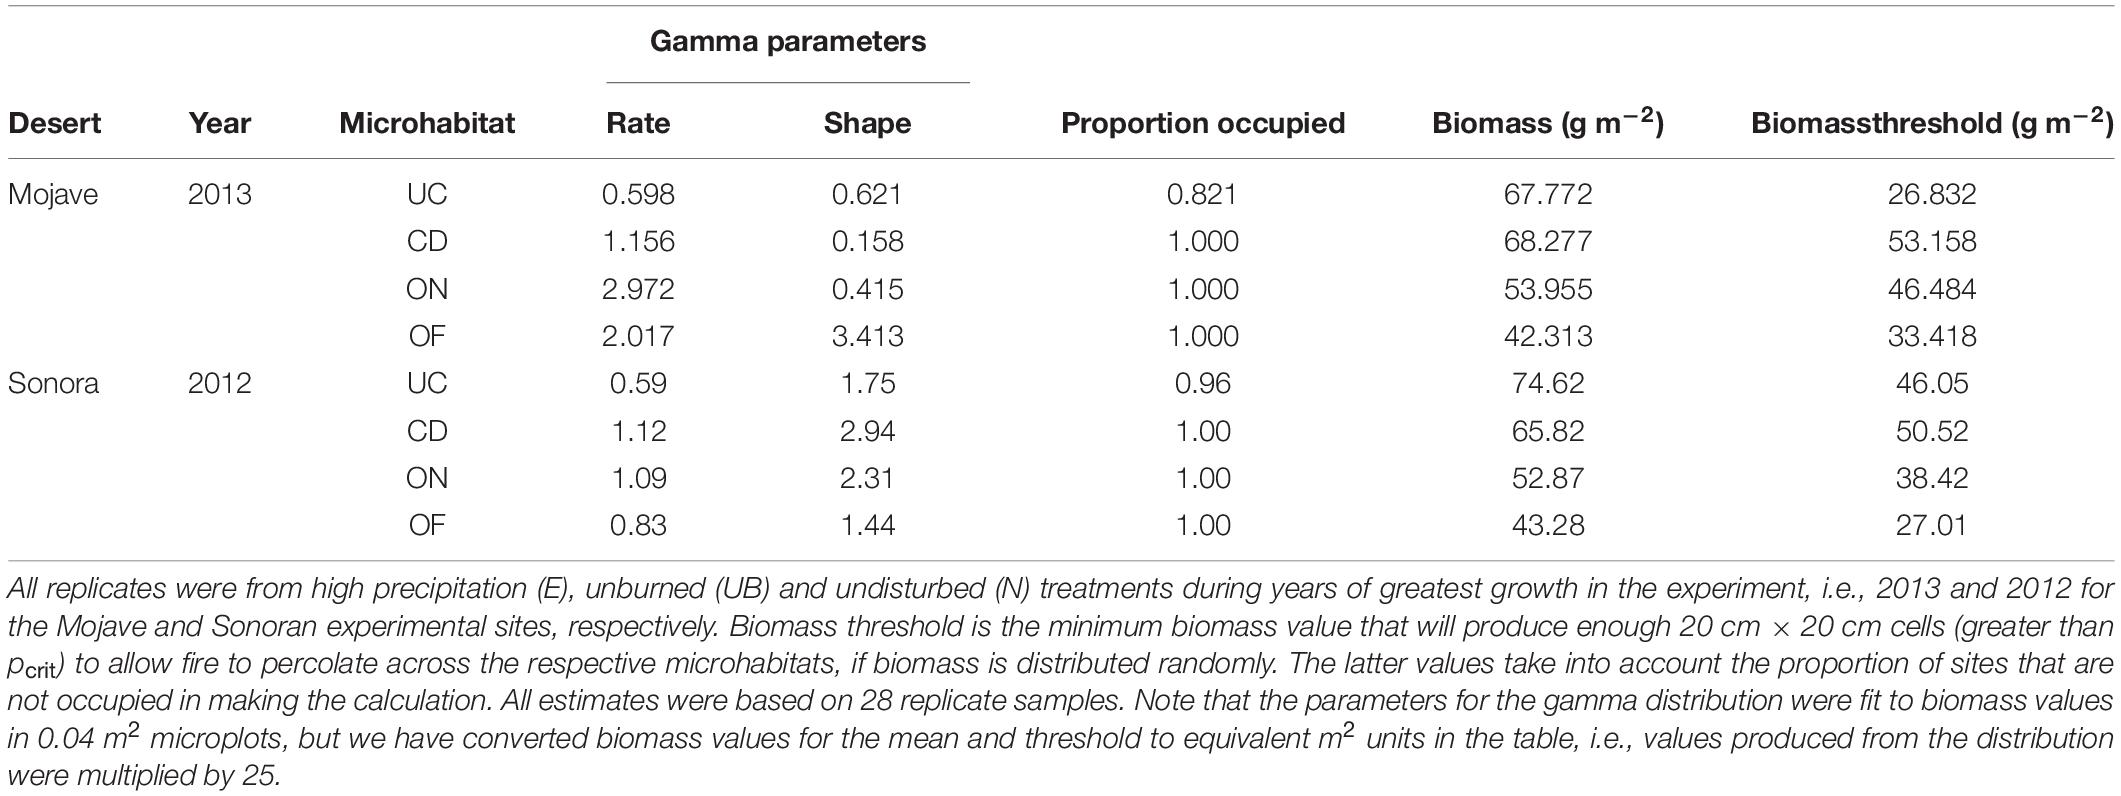
Table 3. Biomass values fit to a gamma distribution from the experiment conducted in the Mojave and Sonoran deserts.
The advantage of using Δ as a parameter to characterize the probability of fire spread is that it is a quantity that can be determined from burn experiments as in Fuentes-Ramirez et al. (2016). Once this is known, predictions regarding fire spread can be made from knowing biomass distributions in the field in conjunction with understanding the critical biomass threshold values under different conditions of hydration status. The impact of hydration on biomass can either be determined directly by harvesting standing biomass at a given site for years with different amounts of precipitation or by conducting simple irrigation experiments. One can even envision simple approximations of the effects of variable rainfall on fuel loads by comparing biomass among naturally variable patterns of water availability, e.g., washes vs. the bajada matrix. Obviously, such “space-for-time” analogs can only provide rough approximations and experimental approaches are expected to provide more accurate results (Damgaard, 2019).
It should be pointed out that the situations we have modeled probably represent conditions where fire will not spread extensively, since the conditions producing the greatest amount of biomass in our experiments yield a biomass threshold of approximately 33 g m–2 for the open (OF) matrix habitat (Table 3; Mojave-2013 High Precipitation Experiment). In contrast, published estimates of the threshold values for carrying fire in grass-dominated systems have been reported to be between 70 and 150 g m–2 (see Rao et al., 2015), at least double the maximum value we observed. The Rao et al.’s (2015) paper, which is a modeling study of fire size as a function of precipitation, N loading and biomass productivity in low-elevation desert scrub, found that there was no distinct biomass threshold that would produce extensive fires. However, they did find that the largest fires (99th percentile and above) were much bigger when winter fine-fuel production was above 125 g m–2.
Given the biomass values we observed in our field experiment in the context of what is known about fuel loads necessary to carry fire, there is no potential for extensive fire spread under the conditions occurring at the time of our study, even with an addition of 2× ambient precipitation. Our experiments were conducted during a time of historic drought in the Desert Southwest. However, model predications for the Southwestern US suggest that, although the area will become generally hotter and drier (Cayan et al., 2010; Woodhouse et al., 2010), the area also may be impacted by more extreme rainfall events (Diffenbaugh et al., 2005; Wang and Zhang, 2008). It remains to be seen whether or not extreme rainfall events, coupled with continued invasion by annual grasses, will increase fuel loads to the extent that the potential for extensive fires becomes a concern. Applying our modeling approach may, however, have benefits if applied to desert grassland systems that already have higher fuel loads due to local environmental conditions. The models may also be used to predict when the systems we studied will be at greater risk of catastrophic fire spread either through an increase in invasive species biomass in the open or through extreme rainfall events.
Future Explorations
The model described here is a work in progress and could be adapted to include more elements that might increase the ability to more accurately predict rates and patterns of fire spread in desert shrublands. A short list of the possibilities include: (1) more realistic spatial patterns of biomass distribution perhaps coupled to models of water movement in the landscape; (2) a nuanced understanding of the flammabilities of different plant species that may be associated with different habitat zones; (3) addition of the effects of shrubs that burn and lead to the spread of fire by windblown embers and belowground spread of fire by roots; and (4) inclusion of plant demography in response to fire and moisture over time. Each of these elements would allow the development of a more nuanced understanding of fire in these systems and with enough work could lead to models coupled with models of climate to look at long term trends.
Data Availability Statement
The raw data supporting the conclusions of this article will be made available by the authors, without undue reservation.
Author Contributions
KM designed and conducted the field experiments used to parameterize the model, wrote the model code, parameterized, conducted, and analyzed the model experiments. KM, CH, and AF-R contributed to writing the manuscript. CH designed and conducted the field experiments used to parameterize the model. AF-R was responsible for developing the conceptual three component igniter-spreader-shrub model of fire spread that informed the development of the simulation models presented here. All authors contributed to the article and approved the submitted version.
Funding
This study was funded by the Department of Defense’s (DoD) Strategic Environmental Research and Development Program (SERDP): Project RC-1721, Holzapfel and Moloney. AF-R was grateful for the support received from Concurso Nacional Inserción en la Academia CONICYT-PAI 79170054 and from grants DI20-0066 and DI21-1001, Universidad de La Frontera.
Conflict of Interest
The authors declare that the research was conducted in the absence of any commercial or financial relationships that could be construed as a potential conflict of interest.
Publisher’s Note
All claims expressed in this article are solely those of the authors and do not necessarily represent those of their affiliated organizations, or those of the publisher, the editors and the reviewers. Any product that may be evaluated in this article, or claim that may be made by its manufacturer, is not guaranteed or endorsed by the publisher.
Acknowledgments
We thank David Housman, Alex Misiura, Ruth Sparks, Teresa Walker, and Richard Whittle for logistical support and help in the field. We thank Erika L. Mudrak, Hadas Parag, and Marjolein Schat for their involvement in earlier phases of this project which were used to inform the current study. Comments by two peer reviewers greatly improved the paper.
Footnotes
- ^ http://www.wrcc.dri.edu
- ^ http://soildatamart.nrcs.usda.gov
- ^ Table 1 provides definitions of the mathematical symbols used to represent variables in the paper as a quick reference.
References
Abades, S. R., Gaxiola, A., Marquet, P. A., and Sala, O. (2014). Fire, percolation thresholds and the savanna forest transition: a neutral model approach. J. Ecol. 102, 1386–1393. doi: 10.1111/1365-2745.12321
Abella, S. R. (2009). Post-fire plant recovery in the Mojave and Sonoran Deserts of western North America. J. Arid Environ. 73, 699–707. doi: 10.1016/j.jaridenv.2009.03.003
Allen, E. B., Steers, R. J., and Dickens, S. J. (2011). Impacts of fire and invasive species on desert soil ecology. Rangeland Ecol. Manage. 64, 450–462. doi: 10.2111/rem-d-09-00159.1
Amoroso, L., and Miller, D. M. (2006). NTC Soils. Surgical Geologic Map of Arid Southwestern USA. Washington, DC: U.S. Geological Survey.
Baddeley, A., Rubak, E., and Turner, R. (2015). Spatial Point Patterns: Methodology and Applications With R. Boca Raton, FL: CRC.
Benson, R. P., Roads, J. O., and Weise, D. R. (2008). “Chapter 2 climatic and weather factors affecting fire occurrence and behavior,” in Developments in Environmental Science, eds A. Bytnerowicz, M. J. Arbaugh, A. R. Riebau, and C. Andersen (Amsterdam: Elsevier), 37–59. doi: 10.1016/s1474-8177(08)00002-8
Bowman, D. M. J. S., Balch, J. K., Artaxo, P., Bond, W. J., Carlson, J. M., Cochrane, M. A., et al. (2009). Fire in the earth system. Science 324, 481–484.
Bradley, B. A., Curtis, C. A., and Chambers, J. C. (2016). “Bromus response to climate and projected changes with climate change,” in Exotic Brome Grasses in Arid and Semiarid Ecosystems of the Western US, eds C. Brown, J. Chambers, and M. Germino (Berlin: Springer).
Brooks, M. L. (2000). Competition between alien annual grasses and native annual plants in the Mojave Desert. Am. Midland Nat. 144, 92–108. doi: 10.1674/0003-0031(2000)144[0092:cbaaga]2.0.co;2
Brooks, M. L. (2002). Peak fire temperatures and effects on annual plants in the Mojave Desert. Ecol. Appl. 12, 1088–1102. doi: 10.1890/1051-0761(2002)012[1088:pftaeo]2.0.co;2
Brooks, M. L., and Matchett, J. R. (2006). Spatial and temporal patterns of wildfires in the Mojave Desert, 1980–2004. J. Arid Environ. 67, 148–164. doi: 10.1016/j.jaridenv.2006.09.027
Brooks, M. L., D’Antonio, C. M., Richardson, D. M., Grace, J. B., Keeley, J. E., DiTomaso, J. M., et al. (2004). Effects of invasive alien plants on fire regimes. BioScience 54, 677–688. doi: 10.1641/0006-3568(2004)054[0677:eoiapo]2.0.co;2
Cary, G. J. (2002). Importance of a Changing Climate for Fire Regimes in Australia. Flammable Australia: The Fire Regimes and Biodiversity of a Continent. Cambridge: Cambridge University Press, 26–46.
Cayan, D. R., Das, T., Pierce, D. W., Barnett, T. P., Tyree, M., and Gershunov, A. (2010). Future dryness in the southwest US and the hydrology of the early 21st century drought. Proc. Natl. Acad. Sci. U.S.A. 107, 21271–21276. doi: 10.1073/pnas.0912391107
Chambers, J. C., and Wisdom, M. J. (2009). Priority research and management issues for the imperiled great basin of the western United States. Restor. Ecol. 17, 707–714. doi: 10.1111/j.1526-100x.2009.00588.x
Charley, J. L., and West, N. E. (1975). Plant-induced soil chemical patterns in some shrub-dominated semi-desert ecosystems of Utah. J. Ecol. 63, 945–963. doi: 10.2307/2258613
Chen, J., Shiyomi, M., Hori, Y., and Yamamura, Y. (2008). Frequency distribution models for spatial patterns of vegetation abundance. Ecol. Model. 211, 403–410. doi: 10.1016/j.ecolmodel.2007.09.017
Cox, J. T., and Durrett, R. (1988). Limit theorems for the spread of epidemics and forest fires. Stoch. Process. Appl. 30, 171–191. doi: 10.1016/0304-4149(88)90083-x
Damgaard, C. (2019). A critique of the space-for-time substitution practice in community ecology. Trends Ecol. Evol. 34, 416–421. doi: 10.1016/j.tree.2019.01.013
D’Antonio, C. M., and Vitousek, P. M. (1992). Biological invasions by exotic grasses, the grass/fire cycle, and global change. Annu. Rev. Ecol. Syst. 23, 63–87. doi: 10.1146/annurev.es.23.110192.000431
Diffenbaugh, N. S., Pal, J. S., Trapp, R. J., and Giorgi, F. (2005). Fine-scale processes regulate the response of extreme events to global climate change. Proc. Natl. Acad. Sci. U.S.A. 102, 15774–15778. doi: 10.1073/pnas.0506042102
Engel, E. C., and Abella, S. R. (2011). Vegetation recovery in a desert landscape after wildfires: influences of community type, time since fire and contingency effects. J. Appl. Ecol. 48, 1401–1410. doi: 10.1111/j.1365-2664.2011.02057.x
Esque, T. C., Webb, R. H., Wallace, C. S. A., van Riper, C., McCreedy, C., and Smythe, L. (2013). Desert fires fueled by native annual forbs: effects of fire on communities of plants and birds in the lower Sonoran Desert of Arizona. Southwest. Nat. 58, 223–233. doi: 10.1894/0038-4909-58.2.223
Estes, B. L., Knapp, E. E., Skinner, C. N., Miller, J. D., and Preisler, H. K. (2017). Factors influencing fire severity under moderate burning conditions in the Klamath Mountains, northern California, USA. Ecosphere 8:e01794. doi: 10.1002/ecs2.1794
Ewing, S. A., Southard, R. J., Macalady, J. L., Hartshorn, A. S., and Johnson, M. J. (2007). Soil microbial fingerprints, carbon, and nitrogen in a Mojave Desert creosote-bush ecosystem. Soil Sci. Soc. Am. J. 71, 469–475. doi: 10.2136/sssaj2005.0283
Fuentes-Ramirez, A., Mudrak, E. L., Caragea, P. C., Holzapfel, C., and Moloney, K. A. (2015a). Assessing the impact of fire on the spatial distribution of Larrea tridentata in the Sonoran Desert, USA. Oecologia 178, 473–484. doi: 10.1007/s00442-014-3214-1
Fuentes-Ramirez, A., Schafer, J. L., Mudrak, E. L., Schat, M., Parag, H. A., Holzapfel, C., et al. (2015b). Spatio-temporal impacts of fire on soil nutrient availability in Larrea tridentata shrublands of the Mojave Desert, USA. Geoderma 259-260, 126–133. doi: 10.1016/j.geoderma.2015.05.016
Fuentes-Ramirez, A., Veldman, J. W., Holzapfel, C., and Moloney, K. A. (2016). Spreaders, igniters, and burning shrubs: plant flammability explains novel fire dynamics in grass-invaded deserts. Ecol. Appl. 26, 2311–2322. doi: 10.1002/eap.1371
Garcia-Moya, E., and McKell, C. M. (1970). Contribution of shrubs to the nitrogen economy of a desert-wash plant community. Ecology 51, 81–88. doi: 10.2307/1933601
Gardner, R. H., Milne, B. T., Turnei, M. G., and O’Neill, R. V. (1987). Neutral models for the analysis of broad-scale landscape pattern. Landsc. Ecol. 1, 19–28. doi: 10.1007/bf02275262
Grassberger, P. (2002). Critical behaviour of the Drossel-Schwabl forest fire model. New J. Phys. 4, 17–17. doi: 10.1088/1367-2630/4/1/317
Grissino Mayer, H. D., and Swetnam, T. W. (2000). Century scale climate forcing of fire regimes in the American Southwest. Holocene 10, 213–220. doi: 10.1191/095968300668451235
Jarvis, N., Larsbo, M., and Koestel, J. (2017). Connectivity and percolation of structural pore networks in a cultivated silt loam soil quantified by X-ray tomography. Geoderma 287, 71–79. doi: 10.1016/j.geoderma.2016.06.026
Johnson, A. R., Milne, B. T., and Wiens, J. A. (1992). Diffusion in fractcal landscapes: simulations and experimental studies of tenebrionid beetle movements. Ecology 73, 1968–1983. doi: 10.2307/1941448
Marlon, J. R., Bartlein, P. J., Carcaillet, C., Gavin, D. G., Harrison, S. P., Higuera, P. E., et al. (2008). Climate and human influences on global biomass burning over the past two millennia. Nat. Geosci. 1, 697–702. doi: 10.1038/ngeo313
Moloney, K. A., Mudrak, E. L., Fuentes-Ramirez, A., Parag, H., Schat, M., and Holzapfel, C. (2019). Increased fire risk in Mojave and Sonoran shrublands due to exotic species and extreme rainfall events. Ecosphere 10:e02592. doi: 10.1002/ecs2.2592
Mudrak, E. L., Moloney, K. A., Fuentes-Ramirez, A., Schafer, J. L., Haines, C. E., and Holzapfel, C. (2011). “Spatial patterns in the distribution of creosote (Larrea tridentata) and burrobush (Ambrosia dumosa) in the Mojave and Sonoran deserts: a template for fire risk,” in Proceeding of the 96th Annual Ecological Society of America Meeting, (Austin, TX).
Mudrak, E. L., Schafer, J. L., Fuentes-Ramirez, A., Holzapfel, C., and Moloney, K. A. (2014). Predictive modeling of spatial patterns of soil nutrients related to fertility islands. Landsc. Ecol. 29, 491–505. doi: 10.1007/s10980-013-9979-5
Niessen, W. V., and Blumen, A. (1986). Dynamics of forest fires as a directed percolation model. J. Phys. A 19:L289.
Olsson, A. D., Betancourt, J., McClaran, M. P., and Marsh, S. E. (2012). Sonoran desert ecosystem transformation by a C4 grass without the grass/fire cycle. Divers. Distrib. 18, 10–21. doi: 10.1111/j.1472-4642.2011.00825.x
R Core Team (2019). R: A Language and Environment for Statistical Computing. Vienna: R Foundation for Statistical Computing.
Randerson, J. T., Chen, Y., van der Werf, G. R., Rogers, B. M., and Morton, D. C. (2012). Global burned area and biomass burning emissions from small fires. J. Geophys. Res. 117:G04012.
Rao, L. E., Matchett, J. R., Brooks, M. L., Johnson, R. F., Minnich, R. A., and Allen, E. B. (2015). Relationships between annual plant productivity, nitrogen deposition and fire size in low-elevation California desert scrub. Int. J. Wildland Fire 24, 48–58. doi: 10.1071/wf13152
Schafer, J., Mudrak, E., Haines, C., Parag, H., Moloney, K., and Holzapfel, C. (2012). The association of native and non-native annual plants with Larrea tridentata (creosote bush) in the Mojave and Sonoran Deserts. J. Arid Environ. 87, 129–135. doi: 10.1016/j.jaridenv.2012.07.013
Schlesinger, W. H., Raikes, J. A., Hartley, A. E., and Cross, A. F. (1996). On the spatial pattern of soil nutrients in desert ecosystems. Ecology 77, 364–374. doi: 10.2307/2265615
Sugihara, N. G., van Wagtendonk, J. W., and Fites-Kaufman, J. (2006). “Fire as an ecological process,” in Fire in California’s Ecosystems, eds N. G. Sugihara, J. W. van Wagtendonk, J. Fites-Kaufman, K. E. Shaffer, and A. E. Thode (Berkeley, CA: University of California Press), 58–74. doi: 10.1525/california/9780520246058.003.0004
Thompson, D. B., Walker, L. R., Landau, F. H., and Stark, L. R. (2005). The influence of elevation, shrub species, and biological soil crust on fertile islands in the Mojave Desert, USA. J. Arid Environ. 61, 609–629. doi: 10.1016/j.jaridenv.2004.09.013
Vasek, F. C. (1980). Creosote bush: long-lived clones in the Mojave Desert. Am. J. Bot. 67, 246–255. doi: 10.2307/2442649
Wang, J., and Zhang, X. (2008). Downscaling and projection of winter extreme daily precipitation over North America. J. Clim. 21, 923–937. doi: 10.1175/2007jcli1671.1
Wang, Z., Chappellaz, J., Park, K., and Mak, J. E. (2010). Large variations in southern hemisphere biomass burning during the last 650 years. Science 330, 1663–1666. doi: 10.1126/science.1197257
Wiens, J. A., and Milne, B. T. (1989). Scaling of ‘landscapes’ in landscape ecology, or, landscape ecology from a beetle’s perspective. Landsc. Ecol. 3, 87–96. doi: 10.1007/bf00131172
Wiens, J. A., Schooley, R. L., and Weeks, R. D. (1997). Patchy landscapes and animal movements: do beetles percolate? Oikos 78, 257–264. doi: 10.2307/3546292
Woodhouse, C. A., Meko, D. M., MacDonald, G. M., Stahle, D. W., and Cook, E. R. (2010). A 1,200-year perspective of 21st century drought in southwestern North America. Proc. Natl. Acad. Sci. U.S.A. 107, 21283–21288. doi: 10.1073/pnas.0911197107
Wu, J. (2013). Key concepts and research topics in landscape ecology revisited: 30 years after the Allerton Park workshop. Landsc. Ecol. 28, 1–11. doi: 10.1007/s10980-012-9836-y
Keywords: creosote, simulation, percolation, fire, Mojave, Sonoran, climate change, exotic invasive species
Citation: Moloney KA, Fuentes-Ramirez A and Holzapfel C (2021) Climate Impacts on Fire Risk in Desert Shrublands: A Modeling Study. Front. Ecol. Evol. 9:601877. doi: 10.3389/fevo.2021.601877
Received: 01 September 2020; Accepted: 14 July 2021;
Published: 10 August 2021.
Edited by:
Glenda M. Wardle, The University of Sydney, AustraliaReviewed by:
Diego Nieto-Lugilde, University of Córdoba, SpainEdith B. Allen, University of California, Riverside, United States
Copyright © 2021 Moloney, Fuentes-Ramirez and Holzapfel. This is an open-access article distributed under the terms of the Creative Commons Attribution License (CC BY). The use, distribution or reproduction in other forums is permitted, provided the original author(s) and the copyright owner(s) are credited and that the original publication in this journal is cited, in accordance with accepted academic practice. No use, distribution or reproduction is permitted which does not comply with these terms.
*Correspondence: Kirk A. Moloney, kmoloney@iastate.edu